1. Introduction
Landsat Thematic Mapper (TM) satellites have increasingly been used to measure burn area and severity of fires within the US [
1]. Most often, Landsat TM reflectance values have been transformed by the Normalized Burn Ratio (NBR) algorithm, which calculates the differenced ratio between bands 4 and 7, providing an index sensitive to vegetation condition and substrate cover and composition [
2]. To help correct for seasonal variation in vegetation and soil reflectance values, a pre-fire NBR image can be combined with a post-fire NBR image to yield a differenced Normalized Burn Ratio (dNBR) image, which displays changes in vegetation and soil cover interpreted as burn severity [
2]. Past and ongoing field assessments are used to estimate NBR or dNBR breakpoints separating burned
versus unburned areas and levels of burn severity [
3]. Although dNBR has the advantage of providing a change index conceptually fitting a definition of burn severity based on degree of ecological change, it is constrained by the need for both pre-fire and post-fire scenes acquired at the same time of the year to avoid misinterpretations caused by seasonal changes in vegetation, making it sensitive to between-image landcover changes other than those caused by fire [
3]. Thus, both NBR and dNBR can be advantageous in different situations [
4].
Although the use of NBR and dNBR imagery to monitor burns has increasingly expanded nationally [
5,
6,
7,
8,
9], from the western to eastern US, the method faces several challenges particular to the southeastern region [
4]. Most burnable areas in the region have fire-adapted native plant species that are not completely killed by fire and rapidly resprout, thus progressively covering the burned area and masking the scar [
1]. Although resprouting of deciduous herbaceous and woody plants is greatly reduced in the dormant season, southeastern US wetland habitats are often inhabited by a large proportion of evergreen shrubs that can resprout throughout the year [
10]. The post-fire period during which a burned area is detectable is probably further limited by short fire-free intervals in many parts of the region, which limit fuel accumulation and fire intensity and minimize burn severity. Many burns occur during the winter months and therefore may be obscured when deciduous trees leaf out during the following spring. The quality of remote sensing data may be further diminished during the winter months by the low sun angle, which reduces the amount of light reflected back to the satellite [
11]. Perhaps the greatest challenge in the region is frequent cloud cover during the summer and winter months, which limits the number of usable Landsat images by covering burn scars and creating shadows that may be misinterpreted as burned area [
2]. To date, the rate at which the perceivable burn scar signature degrades with time and limitations posed by cloud cover in obtaining accurate images have not been evaluated. This understanding is critical for evaluating remote sensing’s potential for monitoring the estimated 1.6 million hectares that are annually burned by prescription in the southeastern US [
12,
13].
The goal of this study was to quantify timing constraints on remote sensing of burned area caused by post-fire response of vegetation, seasonal cloud cover, and frequency of Landsat image acquisitions within the southeastern US. Specific objectives were to (1) determine the effect of time since fire on degradation of satellite-derived estimates of burned area attributable to vegetation recovery in two common southeastern US plant community types, (2) determine the frequency of usable Landsat TM images for each month of the year, (3) predict accuracy levels of burned area estimates for each month of the year given these constraints, and (4) evaluate NBR versus dNBR for their relative effectiveness in estimating burned area in the studied environment. The approach was to compare initial versus a series of subsequent estimates of burned area from prescribed burns conducted on the Apalachicola National Forest throughout the year of 2006, analyze 26 years of satellite imagery encompassing the study area to determine the time lag between burns and subsequently available cloud-free images in each month of the year, and predict the combined effect of vegetation response and cloud cover on accuracy of burned area estimates for fires in each month of the year.
2. Methods
2.1. Study Location and Description
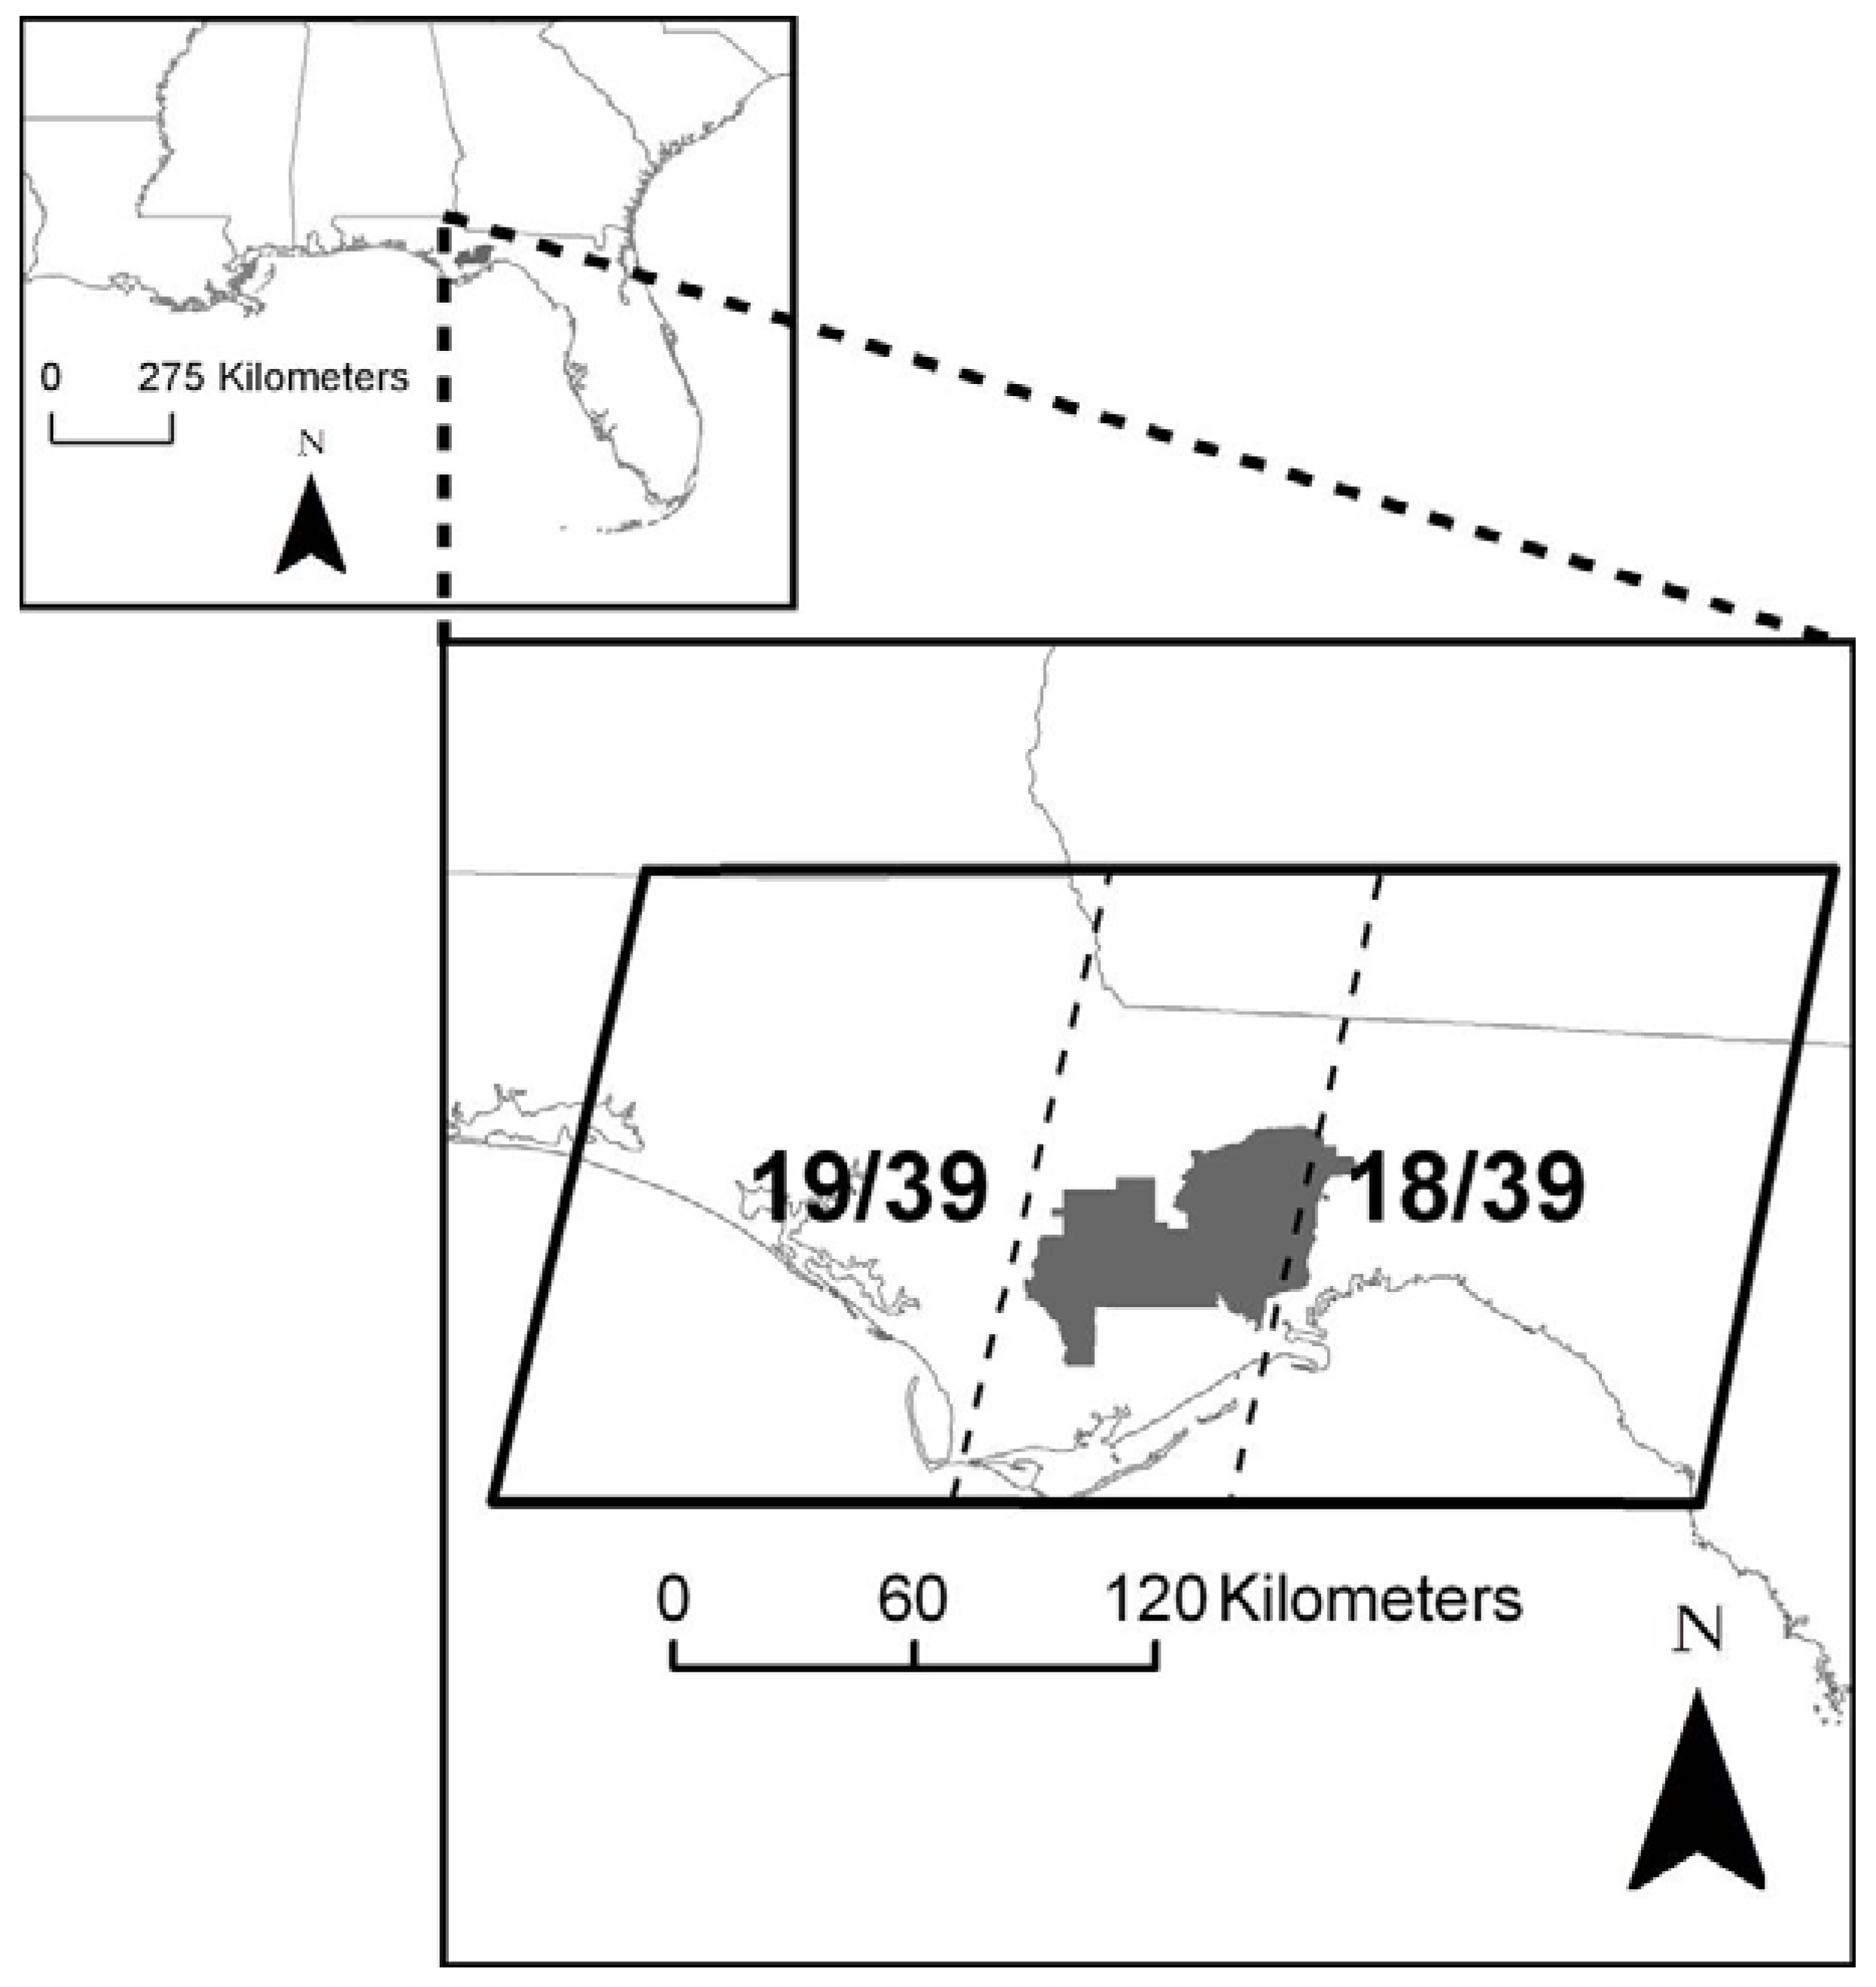
The study was conducted within the 228,632-hectare Apalachicola National Forest (ANF) in the Central Panhandle region of Florida (
ca. 30°20′N–84°21′W,
Figure 1) near southwestern Georgia. Common vegetation community types found within the ANF are wet pine flatwoods, depression swamps, and pine sandhills, described in more detail elsewhere [
4]. For this study we focused on wet pine flatwoods and depression swamps because of their relatively large representation within the southeastern US and ANF in particular, thus providing adequate burn samples for analyses.
2.2. Effect of Time since Burn on Estimates of Burned Area
We assessed the effect of time since burn on the accuracy of NBR and dNBR estimates of burned area for each of the 43 prescribed burns conducted on the ANF in 2006 (
Table 1). Specifically, we compared both NBR and dNBR images captured within 30 days following fire (initial image) with subsequent images to calculate percent accuracy in one month increments up to 15 months post-fire. The use of Landsat data was restricted to Landsat 5 TM because of scan-line errors in Landsat 7 ETM+ (Enhanced Thematic Mapper-plus) imagery which limit the estimation of burned area [
14]. Landsat 5 TM images that were already radiometrically and geometrically corrected (Level 1T) were downloaded from USGS [
15] and then processed into NBR and dNBR [
2]. The NBR and dNBR images were converted to 2-class burned/unburned images by using breakpoints specific to season of burn and community type calculated in a previous study [
9]. Burns, demarcated by burn units within the ANF, were categorized by occurrence in the dormant season (November–February) or growing season (March–October) and by flatwoods or depression swamp community types (
Table 1). Errors of omission and commission for each month following fire were converted to percent accuracy, calculated by dividing the number of pixels interpreted as burned by the total number of pixels in the initial estimate (0–1 months post-fire), using the assumption that the initial estimate most closely represented the actual burned area. Data were presented graphically to show the monthly change in percent accuracy with time since the initial image capture using NBR
versus dNBR for dormant and growing seasons of burn (combined community types) and in flatwoods and depression swamps (dormant season burns only, since burns in flatwoods were underrepresented in the growing season [N = 3]).
Figure 1.
Locations of the Apalachicola National Forest (dark gray) and WRS-2 (Worldwide Reference System, version 2) path 18 row 39 (18/39) and path 19 row 39 (19/39) overlap (dashed lines) covering portions of northwest Florida and southwest Georgia, USA.
Figure 1.
Locations of the Apalachicola National Forest (dark gray) and WRS-2 (Worldwide Reference System, version 2) path 18 row 39 (18/39) and path 19 row 39 (19/39) overlap (dashed lines) covering portions of northwest Florida and southwest Georgia, USA.
Table 1.
Number of burns (Burn N), burned area means (hectares [ha]), and burned area ranges (ha) for each combination of season and community type assessed within the Apalachicola National Forest.
Table 1.
Number of burns (Burn N), burned area means (hectares [ha]), and burned area ranges (ha) for each combination of season and community type assessed within the Apalachicola National Forest.
| Season | Community | Burn N | Mean (ha) | Range (ha) |
|---|
| Dormant | Flatwood | 11 | 639 | 407–1,199 |
| Dormant | D. Swamp | 21 | 661 | 170–1,256 |
| Growing | Flatwood | 3 | 705 | 513–857 |
| Growing | D. Swamp | 8 | 462 | 200–838 |
2.3. Ability to Obtain Usable Remote Sensing Images
To determine the probability of obtaining at least one “clear” (90% cloud free) Landsat 5 TM image per month for locations on the ANF, we used images from Landsat path 18 row 39 (18/39) and path 19 row 39 (19/39) (
Figure 1) acquired over the 26 year period (1984–2009) during which images were nearly consistently collected at 16 day intervals and provided through the USGS online image viewer [
15]. Although the scenes overlap and provide double coverage for approximately 30% of the ANF, we made calculations for each path/row separately and reported their average to provide a conservative estimate and improve applicability of results to other locations within the region. These probabilities were used to further calculate the average and maximum number of months following a burn required to obtain a subsequent cloud-free image. For purposes of this calculation, theoretical burns were arbitrarily determined to occur on the 15th of each month, after which time to the next available cloud-free image was determined.
2.4. Effect of Limitations on Accuracy of Burned Area Estimates
We predicted the accuracy of burned area estimates for fires occurring within each month of the year for both NBR and dNBR by considering the amount of time between fire and acquisition of a clear post-fire image and the estimated loss of percent accuracy during that time. Specifically, for a given burn month, the average number of months required to obtain a cloud-free image was used to approximate the corresponding burned area percent accuracy according to our previous estimates of burn scar degradation (community types combined). The same was done using the maximum number of months required to obtain a clear image following burns in each month of the year to estimate the lower limits of accuracy. It was considered that, in order to calculate values for dNBR, the time following fire required to obtain a clear image should be modified to reflect the need to obtain a pre-fire as well as post-fire image. Thus, we required post-fire images to have a clear image in the same, previous, or subsequent month in the previous year to be counted. However, this modification had virtually no effect on the average or maximum number of months required to obtain a post-fire cloud-free image.
3. Results
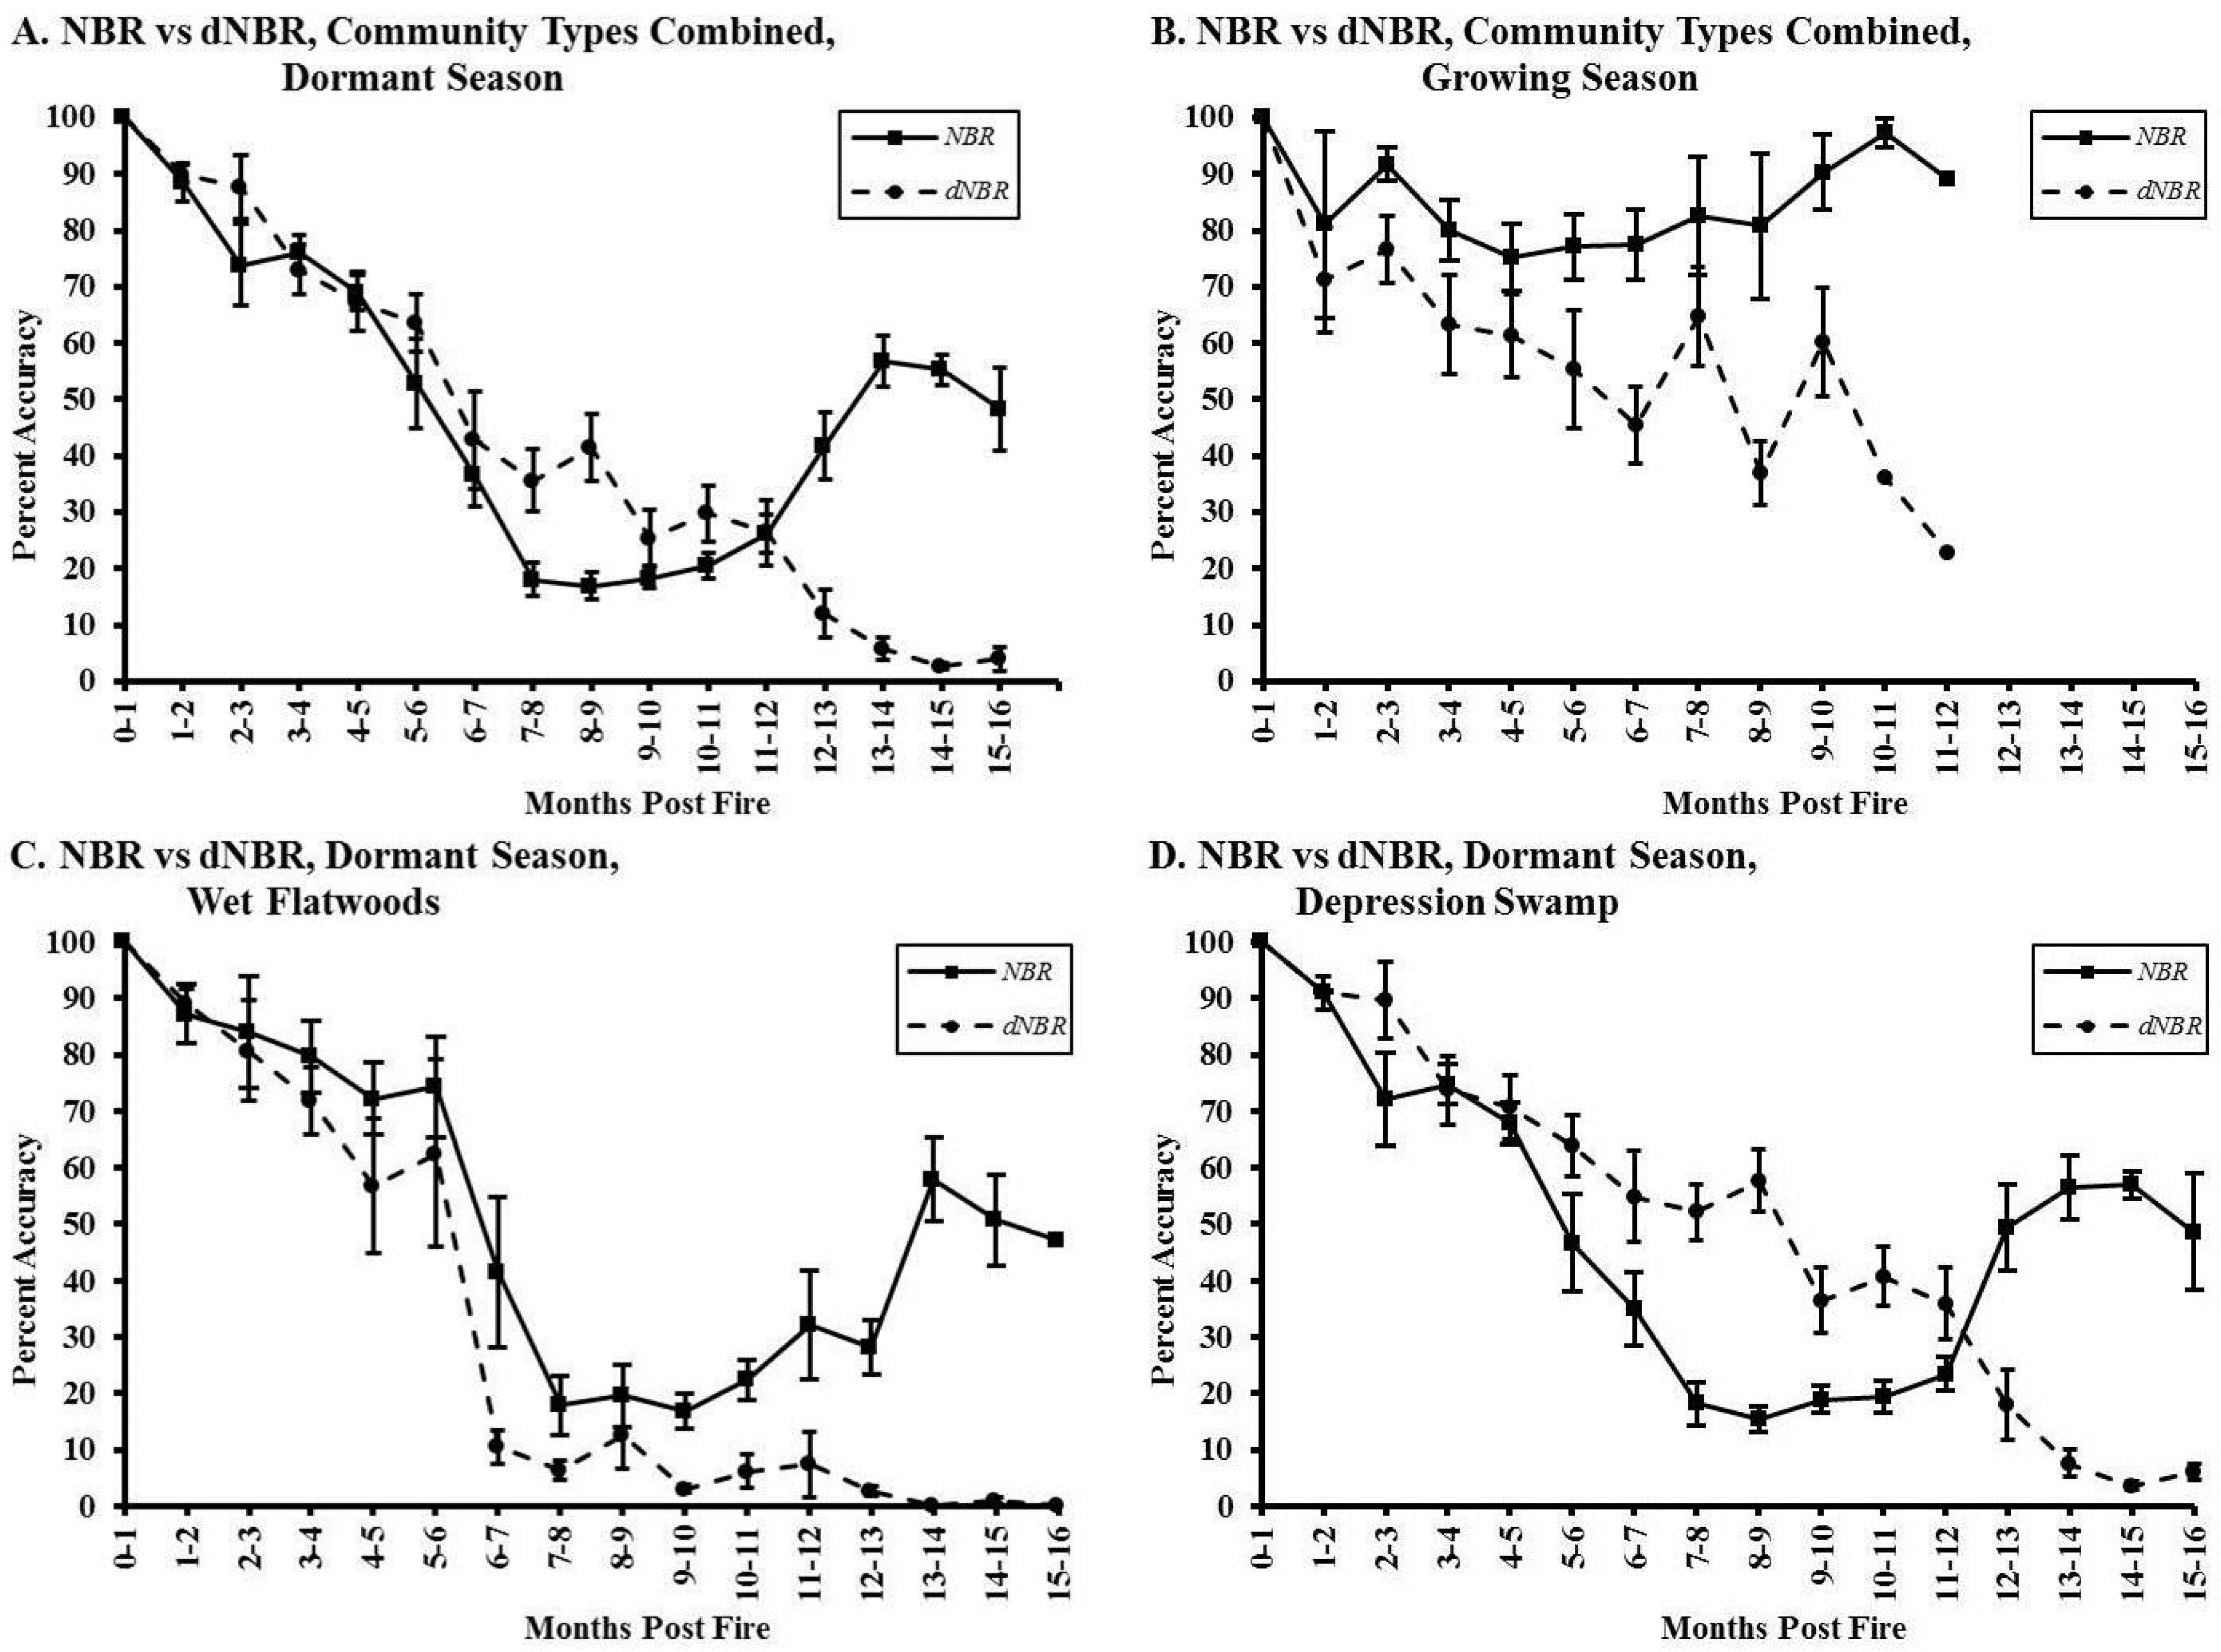
3.1. Effect of Time since Burn on Estimates of Burned Area
Satellite NBR image series for both growing season and dormant season burns with combined community types exhibited an initial decrease, a leveling-out period, and subsequent increase in percent accuracy over 16 months following fire (
Figure 2(A,B)). For dormant season burns, percent accuracy with combined community types decreased from its initial state (set at 100%) to about 70–80% during the first 4 months at a rate of about 9% per month before declining precipitously (
Figure 2(A,B)). In contrast, growing season burns with combined community types showed a 6% monthly rate of decrease in percent accuracy from 100% to about 80% during the first 4 months, after which it remained level for about 4 months (
Figure 2(A)). Values for flatwoods
versus depression swamps varied little during the first 5 months following fire, after which flatwoods showed a precipitous decrease in percent accuracy (
Figure 2(C,D)). The dNBR image series for both growing and dormant season burns with combined community types showed an overall linear decrease in percent accuracy at a rate of about 11% per month over the 16 month post-fire period, although accuracy values were higher for dormant season burns during the first 5 months (
Figure 2(A,B)). Percent accuracy was generally lower for depression swamps than for flatwoods during the initial 8 months following fire (
Figure 2(C,D)).
Figure 2.
Average percent accuracy between initial and subsequent Normalized Burn Ratio (NBR) and differenced Normalized Burn Ratio (dNBR) estimates of burned areas during each month following fire over a 16 month period for 43 burns occurring in 2006. (A) NBR versus dNBR in the dormant season, community types combined, (B) NBR versus dNBR in the growing season, community types combined, (C) NBR versus dNBR in wet flatwoods in the dormant season, and (D) NBR versus dNBR in depression swamps in the dormant season. Error bars reflect the standard error of percent accuracy values within each month since fire.
3.2. Ability to Obtain Usable Remote Sensing Images
Depending on the month of fire occurrence, the average amount of time needed to obtain a clear image ranged from 0.9 to 1.7 months (Mean = 1.3), and the maximum time ranged from 2.7 to 6.6 months (Mean = 4.8;
Table 2). Overall, there were 3–11 viable images available per year (Mean = 7, SD = 1.6).
Table 2.
Average and maximum number of months between burn date and subsequent clear image (Landsat 5 TM) each month of the year averaged over years 1984–2009 (n = 26), and the resulting predicted % accuracy of images based on rate of degradation of burn scars from prescribed fires on the Apalachicola National Forest in 2006. Values are averaged between Landsat 5 TM scenes 18/39 and 19/39. Growing season months are indicated by an asterisk (*).
| | | Predicted % Accuracy |
|---|
| | # Months | NBR | dNBR |
|---|
| Burn Season | Avg. | Max | Avg. | Min | Avg. | Min |
|---|
| January | 1.5 | 5.6 | 90 | 53 | 90 | 66 |
| February | 1.3 | 6.2 | 90 | 38 | 90 | 44 |
| March* | 1.2 | 6.1 | 82 | 80 | 72 | 47 |
| April* | 1.3 | 5.0 | 82 | 78 | 72 | 55 |
| May* | 1.7 | 4.8 | 82 | 78 | 72 | 62 |
| June* | 1.6 | 3.8 | 82 | 80 | 72 | 64 |
| July* | 1.5 | 3.4 | 82 | 80 | 72 | 64 |
| August* | 1.3 | 3.7 | 82 | 80 | 72 | 64 |
| September* | 0.9 | 2.7 | 82 | 92 | 72 | 78 |
| October* | 1.1 | 5.3 | 82 | 78 | 72 | 55 |
| November | 1.3 | 4.3 | 90 | 70 | 90 | 70 |
| December | 1.4 | 6.6 | 90 | 38 | 90 | 44 |
| Average | 1.3 | 4.8 | 85 | 70 | 78 | 59 |
3.3. Effect of Limitations on Accuracy of Burned Area Estimates
Average predicted percent accuracy obtainable for burned area estimates using NBR or dNBR ranged from 78 to 90% among months of the year, and minimum predicted percent accuracy ranged from 44 to 92% (
Table 2). Average percent accuracy was greater for NBR than for dNBR for theoretical burns occurring during the 8 growing season months, but otherwise values were the same using either method (
Table 2).
4. Discussion
Results reveal that burned area detected using NBR or dNBR begins to diminish almost immediately (within a few weeks) following fire, attributable to rapid post-fire response of vegetation. This magnitude of decrease may be understated given that the initial image, assumed to show the actual burned area, was itself captured up to one month following fire. The rate of decrease in percent accuracy between the initial and subsequent burn estimates appeared fairly consistent among community types, season of burn, and use of NBR versus dNBR during the first four months following fire, with an overall average decrease of approximately 9% per month.
The increase in percent accuracy following the initial several-month decrease when using NBR (
Figure 2) is noteworthy. For growing season burns studied, this increase roughly corresponded to the onset of the dormant season (4–8 months following fire). The increase may have been the result of differences in satellite reflectance caused by the lowering of sun angle, which decreases both image illumination and radiance [
3,
16]. NBR images derived from post-fire images with lower sun angles may have inaccurately exhibited higher percent accuracy over time because of the misclassification of unburned areas as burned (error of commission) [
16]. Natural senescence of plants may also have led to errors of commission, and thus a pseudo-increase in percent accuracy [
3]. For burns occurring in the dormant season, the increase in percent accuracy using NBR occurred 10–14 months following the initial image, similarly corresponding to onset of the subsequent dormant season. In contrast, dNBR apparently adjusted for such seasonal effects by incorporating seasonally matched pre- and post-fire images, resulting in a more consistent, and presumably more accurate, decline in percent accuracy over time. The two spikes that interrupted the otherwise consistent decline of dNBR percent accuracy during months 7–8 and 9–10 is attributable to random variance associated with the small sample size of observations (N = 8) during the growing season months. These results underscore the importance of obtaining post-fire images in the same dormant or growing season as the burn, especially when using NBR imagery [
1,
3,
16,
17]. Rapid post-fire acquisition of images is also important for minimizing the chance that hydrological fluctuations will cause misinterpretation of burned area [
4].
Given the rapid response of vegetation and corresponding rapid decrease in accuracy of remote sensing estimates, the timely availability of cloud-free images is the most limiting factor in remotely sensing burned area using Landsat TM, which has a 16-day revisit cycle. However, the patterns of clear image availability are seasonal, with greatest limitations on late spring burns prior to the cloudy summer season, providing some ability to predict acquisition of adequate images for a given burn program or fire season. Also, the results of this study are somewhat conservative in that only images that were 90% clear for locations on the ANF were considered acceptable, whereas images with greater cloud cover may still be used if the burned area is within a clear portion of the image. Our study also did not consider the approximately 30% overlap between adjacent Landsat images, which increases the probability of coverage for a given burn.
The percent accuracy expected after accounting for image availability provides guidelines for the relative utility of NBR
versus dNBR under different circumstances. NBR appeared to be more accurate than dNBR in the growing season and no different in the dormant season. This interpretation is appropriately applied only to the first few months following fire, as the higher NBR values at longer times since fire likely relate to errors of commission caused by the onset of the subsequent dormant season as discussed above, in which case dNBR estimates are presumably more accurate. The superior performance of NBR for measuring growing season burns (within the same season) may be attributed to the high contrast between green and recently burned vegetation at that time, while dNBR interpretations may be relatively hampered by differences between the pre- and post-fire images not related to fire, including hydrological fluctuations [
4] and slight differences in timing of acquisition and successional changes in unburned vegetation. However, dNBR's more reasonable continuous decrease in percent accuracy with time since fire over the course of the study suggests that it is less prone to errors of commission and may be more accurate when properly applied. Given the strong limitation of image availability on accuracy of burned area estimates, use of additional sources of satellite imagery incorporating the required bands 4 and 7 should improve overall accuracy of remote sensing of burned area. The Landsat Data Continuity Mission [
18] is scheduled to begin operation in December 2012 to replace the currently operating Landsat 5 and 7 satellites (
http://ldcm.nasa.gov/). Also, comparable data generated by the ASTER satellite program at 14 day intervals have recently been made available, free of charge, for approved NASA supported researchers and affiliates [
19].
5. Conclusions
In applying NBR and dNBR methods of estimating burned area in the studied vegetation community types, estimates at greater than >70% accuracy require acquisition of post-burn images within three months of burning during the dormant season and two months during the growing season. Images should be obtained within the same growing or dormant season as the fire. Where images cannot be obtained within this time frame, dNBR burned area estimates might be corrected using linear trends in loss of detectability such as those presented in this study. NBR appears to be preferable for growing season fires if the postburn image is also captured during the growing season. NBR may also be preferable when there is knowledge of additional change in landcover besides fire, including hydrologic fluctuations. For monitoring programs or estimates of burned area over large areas or timeframes, a subset of burned area estimates for which adequate images are available might be used to make broader estimates of burned area. They might also be used to calibrate additional sources of burned area data, such as prescribed burn authorizations and incident reports.
Although the current study was limited to a single year of burn data in wet flatwoods and depression swamps in the ANF, the results focus attention on the need to be aware of timing constraints on image acquisition in functionally similar community types worldwide. Such community types include temperate and tropical grasslands and savannas and shrub communities containing rapidly resprouting woody species, especially in wetlands. Awareness of the limitations to remote sensing of burned area addressed in this study should contribute to improved quality control and error estimation in applying this generally useful method.
Acknowledgments
This project was supported by Joint Fires Science Program Project # 06-2-1-31, National Parks Service Cooperative Agreement H5023-10-0001, USGS contract G08PC91508, the USDA Forest Service, Apalachicola National Forest, and Tall Timbers Research Station and Land Conservancy. We thank Caroline Noble, David Brownlie, and Bruce Davenport for instrumental assistance in the initiating the project, Nate Benson, Don Ohlen, Joe Noble, and Theron Terhune for essential technical support, and Carl Key and Steve Howard for their assistance in revising this manuscript. We thank three anonymous reviewers whose comments substantially improved the paper.
Declaration
Any use of trade, firm, or product names is for descriptive purposes only and does not imply endorsement by the US Government.
References
- Zhu, Z.; Key, C.H.; Ohlen, D.; Benson, N.C. Evaluate Sensitivities of Burn-Severity Mapping Algorithms for Different Ecosystems and Fire Histories in the United States; Joint Fire Science Program (JFSP) Final Report JFSP01-1-4-12; USGS: Boise, ID, USA, 12 October 2006; pp. 1–36.
- Key, C.H.; Benson, N.C. Landscape Assessment: Ground Measure of Severity, the Composite Burn Index; and Remote Sensing of Severity, the Normalized Burn Ratio; General Technical Report RMRS-GTR-164-CD; Rocky Mountain Research Station, USDA Forest Service: Ogden, UT, USA, 2006; pp. 1–55. [Google Scholar]
- Key, C.H. Ecological and sampling constraints on defining landscape fire severity. Fire Ecol. 2006, 2, 34–59. [Google Scholar] [CrossRef]
- Picotte, J.J.; Robertson, K.M. Validation of remote sensing of burn severity in south-eastern US ecosystems. Int. J. Wildland Fire 2011, 20, 453–464. [Google Scholar] [CrossRef]
- Cocke, A.E.; Fule, P.Z.; Crouse, J.E. Comparison of burn severity assessments using differenced normalized burn ratio and ground data. Int. J. Wildland Fire 2005, 14, 189–198. [Google Scholar] [CrossRef]
- Epting, J.; Verbyla, D.; Sorbel, B. Evaluation of remotely sensed indices for assessing burn severity in interior alaska using Landsat TM and ETM+. Remote Sens. Environ. 2005, 96, 328–339. [Google Scholar] [CrossRef]
- Kasischke, E.S.; Turetsky, M.R.; Ottmar, R.D.; French, N.H.F.; Hoy, E.E.; Kane, E.S. Evaluation of the composite burn index for assessing fire severity in Alaskan black spruce forests. Int. J. Wildland Fire 2008, 17, 515–526. [Google Scholar] [CrossRef]
- Pennington, C. Burn Scar Mapping in the Sabine National Wildlife Refuge Using Landsat TM and ETM+ Imagery. M.Sc. Thesis, Louisiana State University, Baton Rouge, LA, USA, 2006. [Google Scholar]
- Picotte, J.J.; Robertson, K.M. Accuracy of remote sensing wildland fire-burned area in southeastern US Coastal plain habitats. Tall Timbers Fire Ecol. Proc. 2010, 24, 86–93. [Google Scholar]
- Stout, J.; Marion, W.R. Pine flatwoods and xeric pine forests of the southern (lower) coastal plain. In Biodiversity of the Southeastern United States: Lowland Terrestrial Communities; Martin, M.H., Boyce, S.G., Echeternacht, A.C., Eds.; Wiley: New York, NY, USA, 1993; pp. 373–446. [Google Scholar]
- Key, C.H. Remote sensing sensitivity to fire severity and fire recovery. In Proceedings of the 5th International Workshop on Remote Sensing and GIS Applications to Forest Fire Management: Fire Effects Assessment, Zaragoza, Spain, 16–18 June 2005; pp. 29–39.
- Haines, T.K.; Busby, R.L.; Cleaves, D.A. Prescribed burning in the south: Trends, purposes and barriers. Southern J. Appl. Forest. 2001, 25, 149–153. [Google Scholar]
- Peterson, J.L.; Ward, D.E. An Inventory of Particulate Matter and Air Toxics from Prescribed Fires in the USA for 1989; Report IAG-DW 12934736-01-1989; USDA Forest Service, Pacific Northwest Research Station: Seattle, WA, USA, 1993; pp. 1–72.
- Hudak, A.T.; Morgan, P.; Stone, C.; Robichaud, P.R.; Jain, T.B.; Clark, J. The relationship of field burn severity measures to satellite-derived burned area reflectance classification (BARC) maps. In Proceedings of the Annual Meeting of the American Society for Photogrammetry and Remote Sensing: Mountains of Data, Peak Decisions, Denver, CO, USA, 23–28 May 2004; pp. 96–104.
- USGS. Global Visualization Viewer (Glovis). Available online: http://glovis.usgs.gov (accessed on 21 May 2009).
- Verbyla, D.L.; Kasischke, E.S.; Hoy, E.E. Seasonal and topographic effects on estimating fire severity from Landsat TM/ETM+ data. Int. J. Wildland Fire 2008, 17, 527–534. [Google Scholar] [CrossRef]
- Singh, A. Digital change detection techniques using remotely-sensed data. Int. J. Remote Sens. 1989, 2, 15–41. [Google Scholar] [CrossRef]
- NASA. Landsat Data Contunuity Mission (LDCM): Extending the Legacy of Global Land Observation. Available online: http://ldcm.nasa.gov/ (accessed on 10 December 2010).
- NASA. Advanced Spaceborne Thermal Emission and Reflection Radiometer (ASTER): Requesting New Acquisions Website. Available online: http://asterweb.jpl.nasa.gov/NewReq.asp (accessed on 10 December 2010).
© 2011 by the authors; licensee MDPI, Basel, Switzerland. This article is an open access article distributed under the terms and conditions of the Creative Commons Attribution license (http://creativecommons.org/licenses/by/3.0/).


