1. Infrared Imaging Techniques for the Analysis of Buildings
The use of infrared (IR) sensors is today a fundamental tool in many close-range and terrestrial applications.
Thermal infrared cameras operate in the bandwidth 3.5 µm < λ < 14 µm (
Long Wave IR) and allows one to visualize thermal differences on the surface of an object. In [
1] and [
2] a review of these sensors is reported, along with several applications including diagnostics of building heat insulations, power line and pipeline monitoring, livestock monitoring, animal studies, sport sciences, detection of archeological remains, security and medicine.
Near infrared cameras (NIR) are sensitive to the wavelengths in the range 0.75 µm < λ < 1.4 µm and are usually used for the analysis of vegetation [
3]. Terrestrial applications might also exploit findings and achievements of IR sensors that have been used for many years in satellite [
4] and airborne applications [
5,
6].
In this paper the focus is concentrated on the use of IR sensors for applications concerning the analysis of performances and state of health of buildings. Thermal scanning of a structure allows one to collect information regarding technological elements, shape, physical characteristics of materials, and state of decay. Different kinds of defects affecting building structures can be detected by the analysis of surface temperature, submitted at particular boundary conditions.
As infrared thermography (IRT) is mostly used as a preliminary investigation tool, a direct survey of the shape, materials and their damages is necessary to know the real state of the surface to analyze. Moreover, planning the acquisition of IR images suffers from the approximation depending on the accuracy of the preliminary reconnaissance. For instance, the heating time may vary in different portions of the building, depending on changes in material or exposition of the structure. The integration of 3D metric models and IRT seems a great improvement of this investigation technique, because it can overcome the lack of reliable surveys and assessments, joining both steps in one and reducing time and inspection costs. In the case of ancient buildings, the walls to investigate are usually irregular. Indeed, thickness, structure and number of layers may be different even in the same part of the construction. Therefore, the metric location of thermal anomalies that should be further investigated with destructive tests is crucial for reducing as much as possible the size and number of samples needed.
The inspection of building envelopes by IRT is based on the effects of heat flow across the structure. The surface temperature is a function of heat flow crossing the wall and local boundary conditions. This parameter may give information regarding the interior layers of the structure. The heat is transferred more quickly throughout the most cohesive materials and/or materials with greater thermal effusivity. Differences in surface temperature due to different thermal properties of elements such as timber, bricks, stone, and mortar can be visualized at proper time as a “footprint” of their shapes projected on the overlapping plaster. Any thin delamination of the coating and detachment of the finishing layer strongly reduces the heat transfer and adds its signal to that given by the structure.
For example, in
Section 6 the authors will present two case studies of inspections on two different buildings, both belonging to the Italian preservation register record. One is the historical headquarter of Politecnico di Milano, the Rector’s office, dating back to 1927. The second is a famous building in the university campus, the “Trifoglio” building, which was designed by Gio Ponti in 1961.
2. Integration of IR Images and 3D Models of Buildings
Most IR sensors adopted in close-range applications are capable of capturing small rectangular images. If the user is interested in investigating pathologies localized in tiny areas, the analysis of each single image can provide sufficient information (see e.g., [
7]). The only required processing step is a preliminary
image equalization in order to concentrate attention on the range of temperatures that have been effectively revealed on the surface. Due to the simplicity of this task and the reduced cost of several up-to-date thermal cameras with low geometric resolutions, IRT is becoming largely popular among professionals working in building maintenance.
On the other hand, in the case of large constructions or when the temperature information has to be related to the three-dimensional structure of a building, the independent analysis of single images is not enough. Images have to be mapped and mosaicked on the surfaces to be analyzed. This operation is usually called
photo-texturing (or simply
texturing) and requires a 3D model of the object [
8]. Such a model can be derived by existing drawings or can be obtained from photogrammetric or terrestrial laser scanning (TLS) surveys, as illustrated in
Section 3. In the case of small and flat surfaces, mapping an image is reduced to the computation of a
homography. This requires the identification of at least four corresponding points on both IR image and surface, operation that could be difficult in the case of homogeneous walls. To overcome this problem, an image in the visible wavelength (RGB) can be mapped first on the model. Mapping an RGB image is a simple task when operating with either photogrammetry or TLS (see
Section 3.1 and
Section 3.2). A further remarkable task to improve the final quality of the IR images used for texturing is the geometric calibration of the adopted IR thermocamera.
A more comprehensive approach to map images on 3D models is based on the use of 3D analytical relationships which approximate the process of image formation.
Collinearity equations [
9] are used in photogrammetry to describe the connection of a 3D point (
X,
Y,
Z) in the object space to its image point (
x,
y) in a 2D photograph. These equations incorporate the observed coordinates of each point in the image and three groups of parameters:
inner orientation (IO) parameters (principal distance
c and principal point coordinates
xp and
yp),
exterior orientation parameters (EO), including
rotation angles and coordinates of
perspective center, and object coordinates of the observed point. Furthermore, a set of
additional parameters (APs), which describes lens distortion according to a mathematical model [
10], can be included into the collinearity equations. Usually IO and APs are computed in a preliminary stage called
camera calibration. Their values will remain constant for all the images captured by the same camera, at least for the period of the measurement campaign and in absence of mechanical or thermal shocks. Alternatively, the perspective model of collinearity equations can be replaced by the projective model provided by
Direct Linear Transformation (DLT, [
11]). Here the relationship between 2D and 3D coordinates is described by means of 11 algebraic coefficients without an immediate physical meaning. In both cases, model parameters are evaluated by a procedure referred to as
image orientation. Usually, the most popular procedure to accomplish this task in the case of thermal imagery relies on the orientation of each single image independently from the others. This procedure, generally defined
space resection, is based on the measurement of a few control points as in the case of homographic transformations. The number of points to measure depends on the adopted model (6 for DLT, 3 for collinearity), on the method adopted for the linearization of equations, and on the desired redundancy of observations. In practice, this number usually ranges from 5 to 10 points per image. Also in this case, a preliminary texturing with RGB images could be useful to simplify and speed up the IR image orientation. Once an image has been oriented in the same reference system of the surface model, each 3D point of a point cloud or each portion of a polygonal model can be textured (see
Section 4). This method is today viable in many photogrammetric and point cloud processing software packages. Unfortunately, it suffers from three main drawbacks: (i) it is time-consuming because each image has to be processed individually; (ii) some IR images might have poor texture and control points cannot be found; (iii) mosaicing of IR images on the 3D model is prone to show discontinuities in areas where two overlapping images are textured.
In the presented paper, an alternative procedure to carry out this task is proposed. A geometric 3D model of the structure under investigation is obtained by using TLS (see
Section 3.2), if this is not already available. Photogrammetry can also be used in some cases as described in
Section 3.1. Both techniques allow one to obtain a vector representation of the model (polygonal model), whose facets can be depicted by the image content. Another simple representation is directly given by texturing the point cloud obtained from laser scanning or from image matching if photogrammetry has been used. In the case of TLS, such photo-texturing can be obtained in a straight-forward way only if the instrument can integrate an RGB camera. Alternatively, an NIR camera can replace the RGB one to obtain NIR texture of the object. The use of this information for building investigations is not yet popular. However, as demonstrated by the example in
Subsection 6.2, the interpretation of NIR images could provide further information, different from that obtained from RGB or IR textures. In the proposed data acquisition system, IR images are captured by a thermal camera which is mounted on one side of a short steel rod. A high resolution RGB camera is positioned on the other side. After the calibration and relative orientation of both sensors, the resulting “bi-camera” system can provide two outcomes: (1) the IR coverage of the building; (2) the EO of all images captured by the RGB camera, which is obtained through a
bundle adjustment. Here some additional images can be integrated to strengthen the photogrammetric block geometry. The knowledge of relative orientation between IR and RGB cameras allows one to compute the EO of both sensors. Finally, the EO of IR-RGB “bi-camera” system is computed with respect to the reference system of the object. This solution allows one to overcome, at the same time, almost all drawbacks listed for traditional single-image registration methods, as described in
Section 5 and witnessed by the examples reported in
Section 6. The level of automation of this procedure depends on the texture of the target object. Indeed, the only manual task is due to the orientation of RGB images, which can only be carried out by an automatic procedure when they consist of a rich texture without repetitive patterns [
12]. However, no measurements between the RGB and IR images are required, except during the calibration of the “bi-camera” system.
3. Technology for Multispectral Data Acquisition in Terrestrial Applications
3.1. Thermal Imagery
Infrared thermography (IRT) is a non-destructive and non-contact technique based on the measurement of the heat energy and its conversion into an electrical signal which is turned into a thermal digital image by a microprocessor. Luhmann
et al. [
13] gives a synthetic but comprehensive review of IR sensor technology. As is well known from Wien’s displacement law [
14], the maximum emitted electro-magnetic wavelength (
λmax) of an object is inversely proportional to its absolute temperature (
T):
This means that the higher the temperature, the shorter the maximum wavelength emitted. In the field of building analysis, the detection of temperatures in the range between −20 °C and 100 °C is required, corresponding to emitted maximum wavelengths ranging from 7.7 µm to 11.4 µm. As a result, the sensors to be adopted must be able to work in the
Long Wave IR spectrum. A second problem concerning the sensor technology is related to the minimum size of the sensor unit, depending upon the diameter (
d) of the
diffraction disk:
where λ is the wavelength of the recorded signal and
k = f/D (called “F” or “stop” number) is the ratio between focal length (
f) and lens aperture (diameter of the pupil) (
D). According to the shorter value of λ implied in the IR spectrum with respect to the visible one, resulting diffraction diameters will be much larger. As a consequence, while SLR (Single-Lens Reflex) cameras can be equipped with CCD (Charge-Coupled Device) or CMOS (Complementary Metal Oxide Semiconductor) sensors having a pixel size of a few micrometers, thermal cameras range between 30 and 50 µm.
Two different kinds of sensors are used in IR thermocameras. The most largely adopted technology is based on thermal detectors, which feature a sensitivity in the order of ±0.1 K. Currently, cameras with sensor size inferior to 320 × 240 pixels con be purchased for a few thousand euros and are used for analyses in building maintenance practice. Larger sensors are also available (up to a size of 1,280 × 960 pixels), although at an absolutely different cost. If a higher thermal sensitivity or a faster acquisition speed is desired, cameras equipped by quantum detectors can be adopted. In this case, an internal cooling system is needed, which makes the device cumbersome and difficult to operate in some environments.
Thermocameras are based on a solid state sensor technology and can be handled as standard RGB cameras in photogrammetric applications. The pinhole camera model can be used, with lens distortion calibrated by standard photogrammetric procedures [
2,
9]. In the experiments reported in this paper (
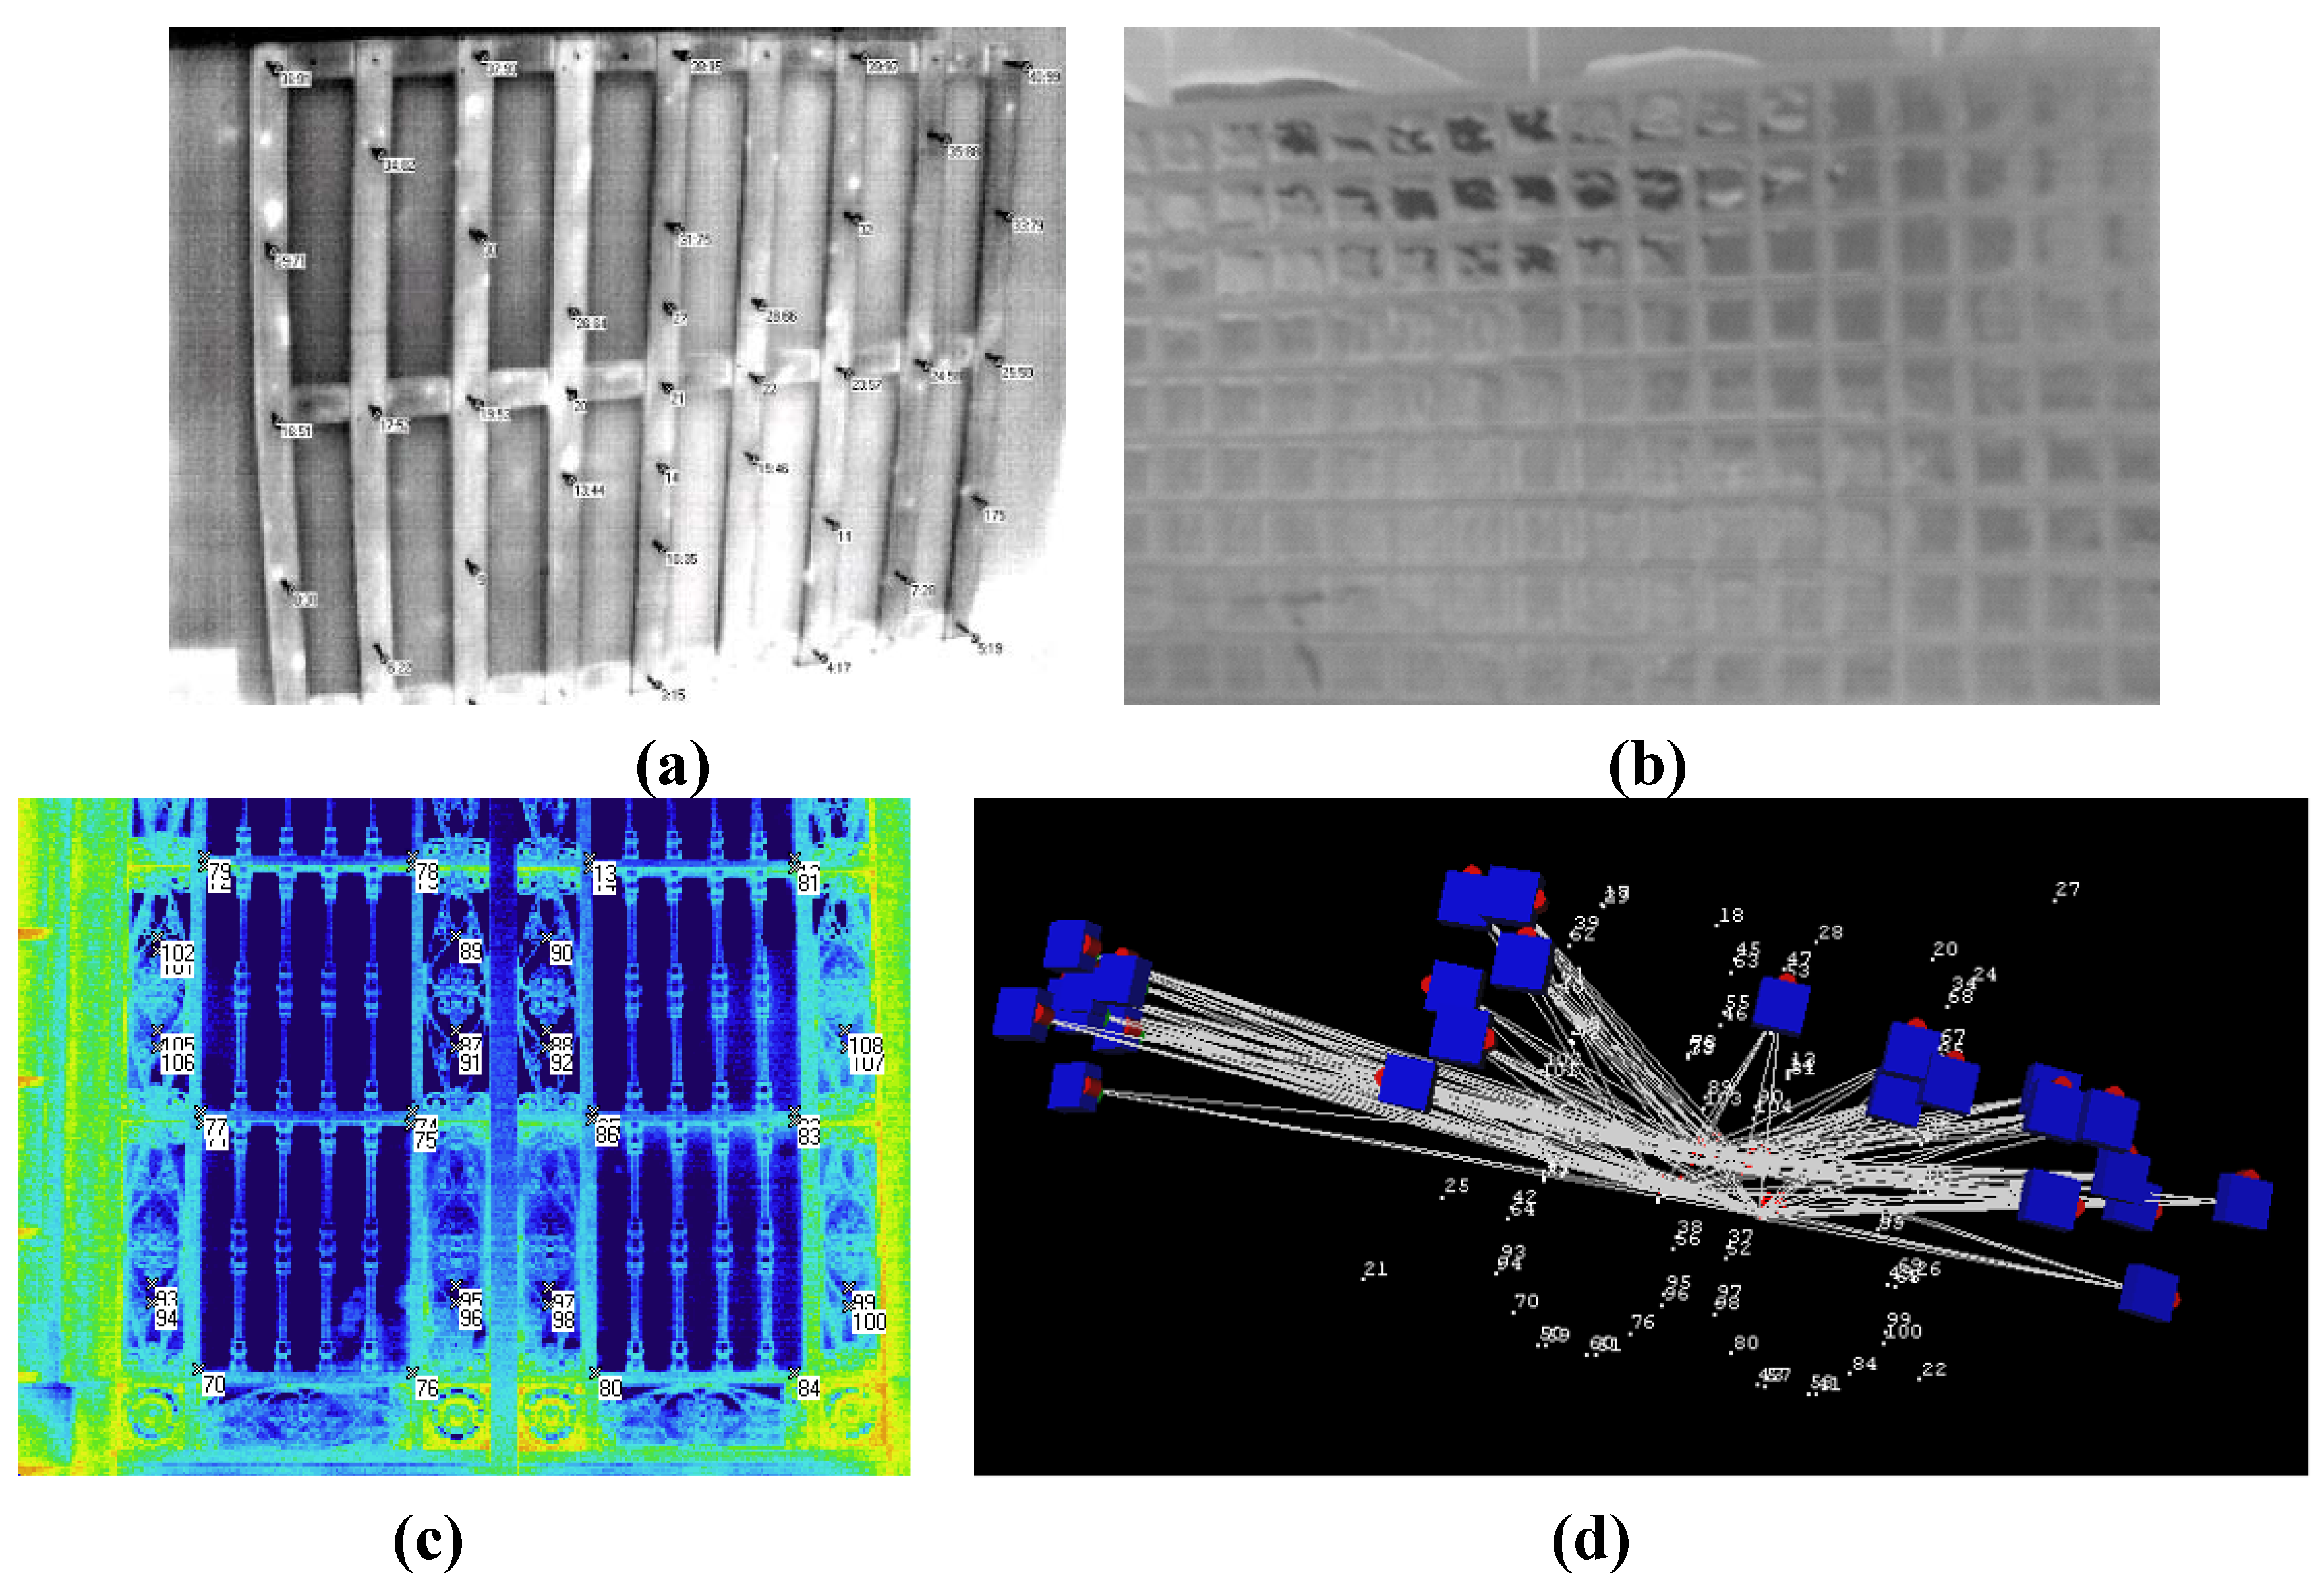
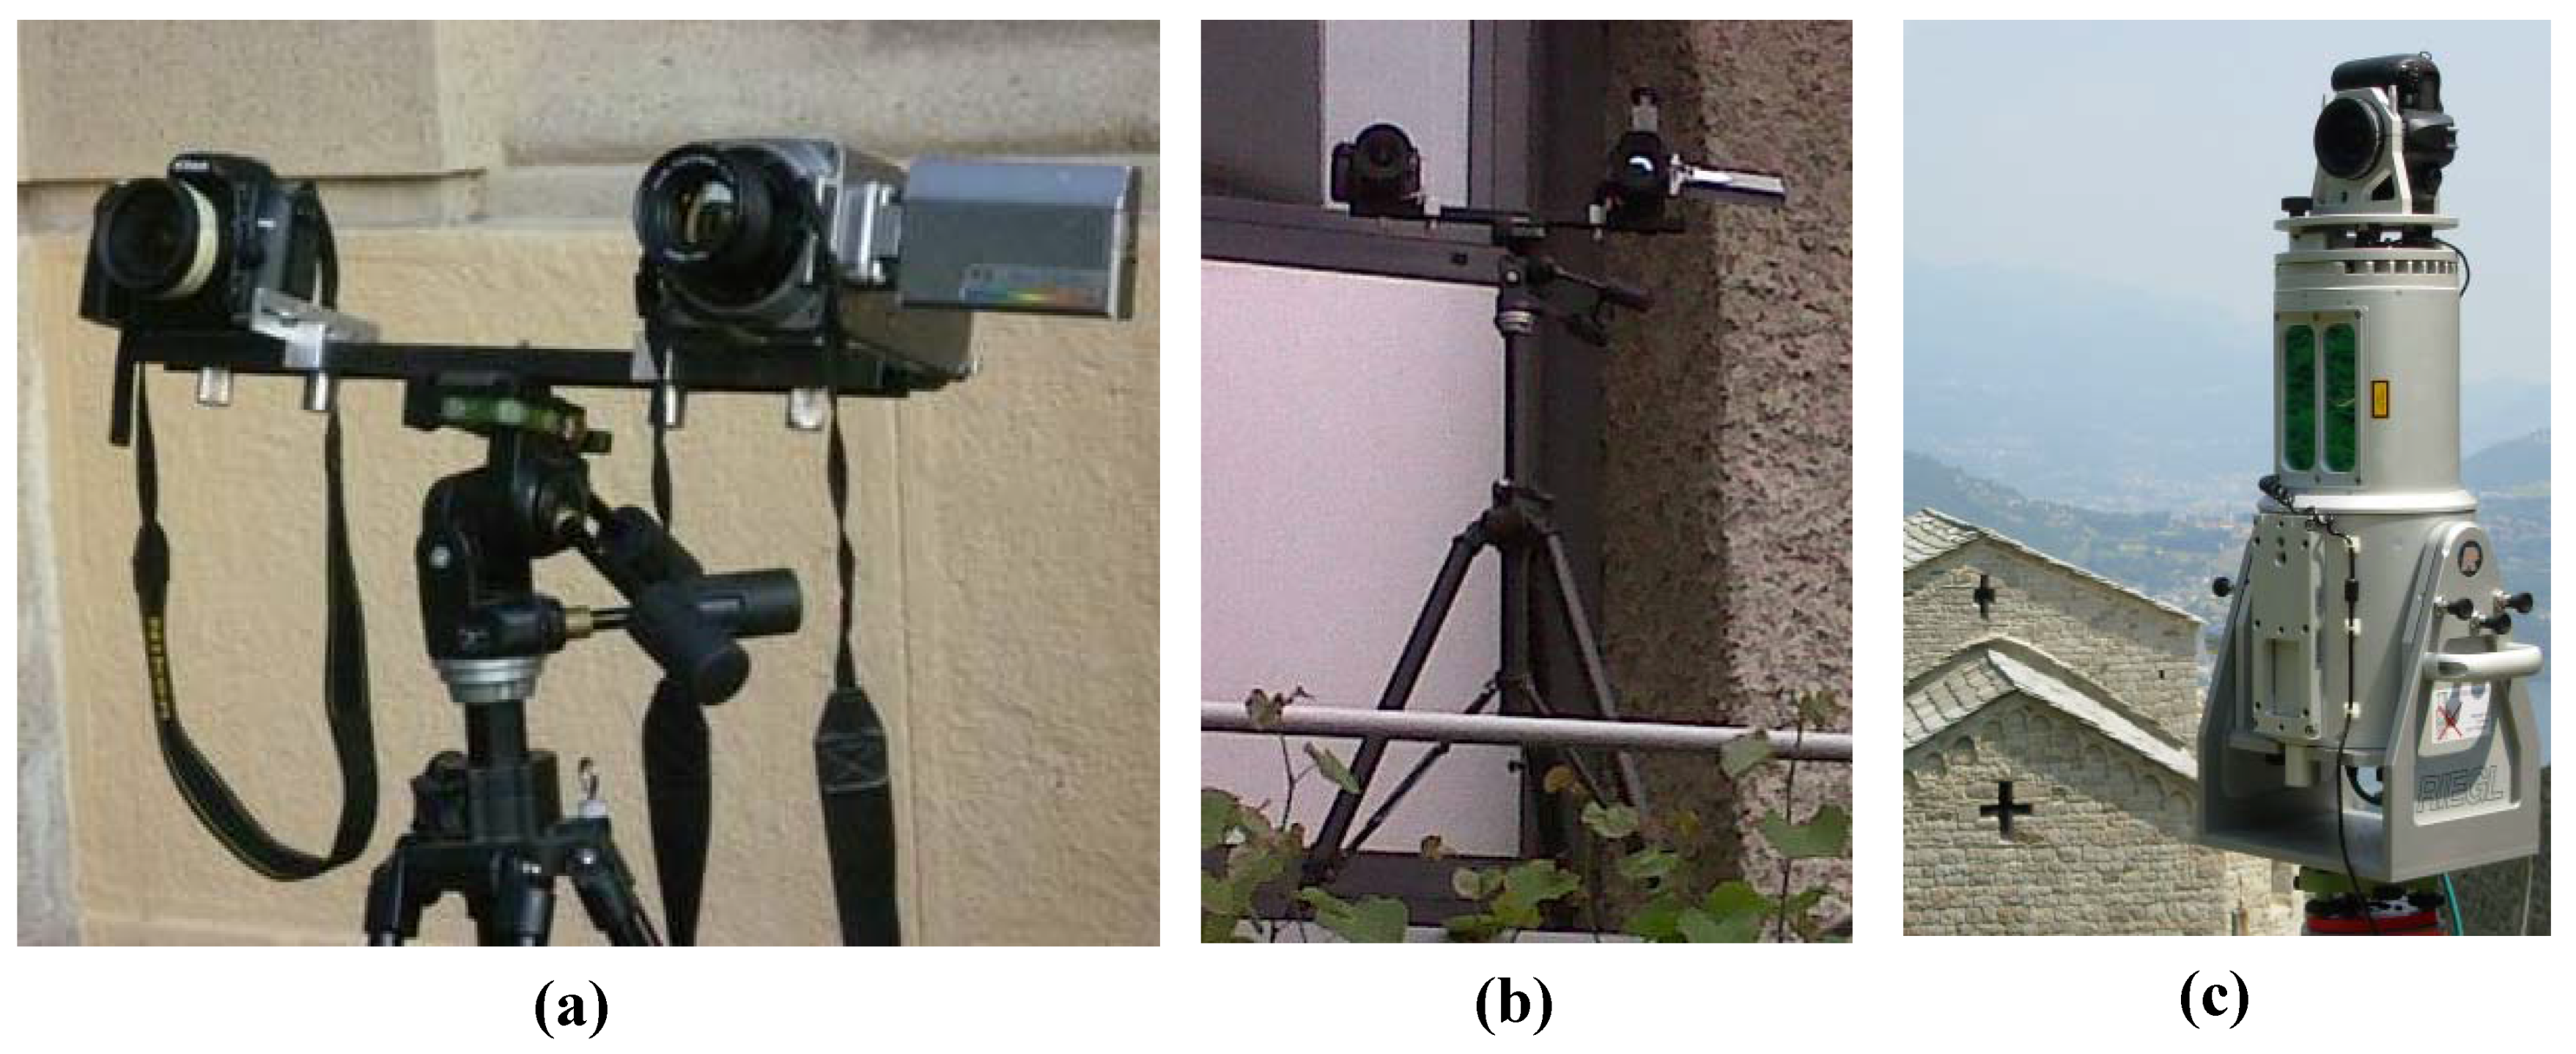
Section 6), a standard photogrammetric procedure for camera calibration has been used. This is based on a calibration framework made up of 38 control points (CPs) fixed on a wooden structure (see
Figure 1(a)). A set of iron nails have been chosen as CPs, whose 3D coordinates have been accurately measured by using a theodolite from multiple stations. The precision of CPs is then much higher than the geometric resolution of the IR images. Indeed, the simple sun-lighting is sufficient to heat each CP, which assumes a temperature higher than background and becomes distinguishable in IR data. All the unknowns (EO, IO and APs) can be computed through a
bundle adjustment implemented in commercial software packages for close range photogrammetry. In the application carried out up until today, the measurement of the image coordinates of CPs is performed manually. The results of a previous work [
15] have shown that the full set of the Brown’s APs is significant. The proposed procedure can be applied only in a laboratory, because a calibration panel is needed. Alternatively, an object with a rich texture in the thermal spectrum can be selected if calibration has to be accomplished on-the-field (see an example in
Figure 1(b,c)). In this case a
self-calibration is computed but using a
free-net bundle adjustment, where the coordinates of CPs are unknown [
9]. In
Figure 1(d), typical geometry of a photogrammetric block for calibration purposes is shown.
Figure 1.
Pictures of some frameworks adopted for camera calibration:
(a) wooden panel with iron nails adopted for
field-calibration in laboratory;
(b,
c) examples of objects used for self calibration through
free-net bundle adjustment;
(d) example of a block of IR images adopted for calibration. The presence of rolled images is aimed at de-correlating the estimated parameters [
10].
Usually, IRT cameras are used for quantitative investigations. Thus the lenses are designed for reducing radiometric aberrations with lower care to geometric distortions. The short wavelength involved in IRT requires the use of Germanium lenses, with consequent higher costs. A radiometric calibration is carried out in the vendor’s laboratory. Considering that uncooled cameras might suffer from radiometric distortions due to the lens heating during data acquisition, which results in IR emission, an internal calibration procedure can be applied in up-to-date sensors.
A camera in the visible spectrum is usually available to facilitate interpretation of IR images. This integrated camera, that is coaxial to the IR sensor, could be potentially exploited to provide sensor orientation. On the other hand, its low resolution could provide only results with a limited precision with current technological development.
The efficiency of IRT as a non-destructive technique is well documented in many fields of engineering to support restoration or conservation projects and treatments. In civil engineering and architecture, IRT can be successfully used as an alternative to conventional inspection technologies, especially for the detection of subsurface defects and hidden structures in wide areas (see the examples in
Section 6). Moreover, IRT is often complemented by other non-destructive techniques such as GPR or sonic measurements.
Nowadays the guidelines ([
1]; Chapter 18) of testing procedures recommend the repetition of thermographic recapture at different conditions of thermal exchange. In addition, comparisons of temperatures of selected areas in the same framing at the same boundary conditions are suggested. This method allows the operator to reduce systematic errors due to ambient irradiation variations and fluctuations. This detection is successful at the transient state during the early heating phase (by solar or artificial source of irradiation) of the surface, when the heat transfers to the inner layers of the materials, according to the thermal properties of the object. Areas of detachment appear warmer as the heat flux enters the surface material. The heat remains in the most exterior layer, which is insulated by the air underneath the surface, instead of flowing into the substrate. Therefore there is an interruption of the linear diffusion of heating.
The law of energy preservation indicates that the variation of energy in time is equal to the exchanged energy between surface and environment. This exchange is due to irradiation on and from the surface, convection, conduction to the interior layers, state changes of chemical species on the surface (evaporation/condensation). All these terms can be in the masonry, although in the presented case study condensation and evaporation did not occur because of the weather conditions.
3.2. Near Infrared Imagery
A wide range of sensors that allow the acquisition of near infrared (NIR) images are available on the market. On the other hand, here a solution based on the use of a low-cost sensor derived from a modified consumer SLR camera is proposed. This approach presents a few important key-points: (i) a large sensor format, comparable to that of RGB cameras; this property results in the reduction of the number of camera poses needed for texturing a 3D model of a large object; (ii) the possibility of changing the lens in order to operate with variable camera-object distances; (iii) the opportunity to integrate the NIR sensor into a TLS instrument for the direct texturing of point clouds.
Most SLR digital cameras available on the market have CCD (or CMOS) sensors able to register the electromagnetic radiation in both visible and NIR spectral bandwidths. As a SLR digital camera is sold for normal photographic purposes, the visual quality of the final image is enhanced with a filter applied in front of the CCD sensor. The main goal of this filter (usually called Bayer filter) is the decomposition of the electromagnetic information that each pixel acquires. Light is therefore decomposed into three components, because each pixel can measure only a single channel (red, green, blue). Most lenses cannot correctly focus each wavelength on the sensor plane. This problem generates a loss of definition. To overcome this drawback, a filter that removes the NIR component is applied, but this filter can be manually removed from the camera, while the Bayer filter is often fixed. The NIR filter was then replaced by an optical window transparent to visible and NIR wavelengths and preserving the same optical path for the light rays. After this operation the cameras are sensitive above 0.75 µm and an additional “black” filter is added in front of the lens to obtain the desired range for the NIR image acquisition.
In the experiments carried out during this research a digital SLR camera Nikon D100 (3,008 × 2,000 pixels) was modified in order to acquire also images in the NIR region of the light spectrum. In the Nikon D100 adopted, the NIR filter can be manually removed and substituted, as described in [
3] and [
16].
The use of NIR technology from both satellite and airborne platforms has been widely exploited for many purposes. Most applications concerned studies about vegetation, due to the emission in the NIR spectrum related to chlorophyll. On the other hand, terrestrial applications have been less relevant up until today. As demonstrated in the example reported in
Section 6.2, the use of NIR information in the analysis of building surfaces allows one to highlight the presence of processes and pathologies that are not revealed in the other ranges of the light spectrum.
The geometric calibration of the low-cost NIR camera can be carried out by using standard photogrammetric procedures utilized for RGB cameras [
10].
3.3. RGB Imagery
The technological development of SLR cameras has provided a reliable solution for the acquisition of RGB images for close range photogrammetric applications. Thanks to a standard calibration procedure [
9,
10], this kind of camera can be transformed into metric cameras. Commercial and low-cost software packages can be used to this aim. A calibrated SLR camera can be used in applications with a required a precision of 1:100,000 [
17,
18].
The main advantages of SLR cameras are (i) the possibility of changing lenses in order to cope with several camera-object distances; (ii) the availability of large formats for CCD (or CMOS) sensors that allow one to capture large views of the object and to improve the image block geometry.
5. A Procedure for Texturing 3D Models with Multispectral Images
In this section, a procedure able to texture 3D models acquired by using TLS with IR imagery is proposed. The method can be run also with other sources for 3D models such as photogrammetric surveys or existing CAD or procedural models [
23]. The advantages of the methods with respect to the current state-of-the-art are twofold. First, it allows one to overcome the main drawbacks encountered in many applications where the registration of single IR images is achieved through
space resection, as mentioned in
Section 2. Second, mapping the 3D model of the building with NIR images taken by a low-cost camera becomes quite simple. The proposed solution is quite flexible and incorporates different options to cope with specific properties of each case study. An example showing the operational principle of the proposed methodology is reported in
Figure 3.
In the last decades the concept adopted in photogrammetry to reduce the number of control points for image orientation is based on
triangulation procedures. The same solution is not directly applicable to IR images, due to a small format with low geometric resolutions and large radiometric changes between images mainly due to the variability of environmental conditions during data acquisition. Indeed, as can be seen in the example in
Figure 4, the surface temperature of a building depends on solar radiation. Consequently a slight change of this parameter results in modifying the surface temperature. On the other hand, RGB images can be easily oriented through
bundle adjustment and several solutions have been developed in photogrammetry to perform this task [
12]. This consideration has led to the design of a “bi-camera” system made up of a SLR digital camera and an IR thermocamera (
Figure 5). Here the aim is not to exploit stereo-vision (the baseline is limited to 45 cm only), but the purpose of the system is to use the SLR camera for computing the orientation of the other sensor as well. A set of “bi-camera” stations are planned to cover the entire region of interest. Some further RGB images can be taken from other positions in order to strengthen the geometry of the photogrammetric block including new RGB images (
Figure 3). In fact, in many cases the geometry required for the IR mapping is not stable for orientation purpose, as shown in the example reported in
Section 6.2. The orientation process of RGB images is the subject of
Section 5.1. Once this task has been worked out, the knowledge of the relative orientation of the “bi-camera” system allows one to compute the EO of the thermal IR thermocamera as well (
Section 5.2).
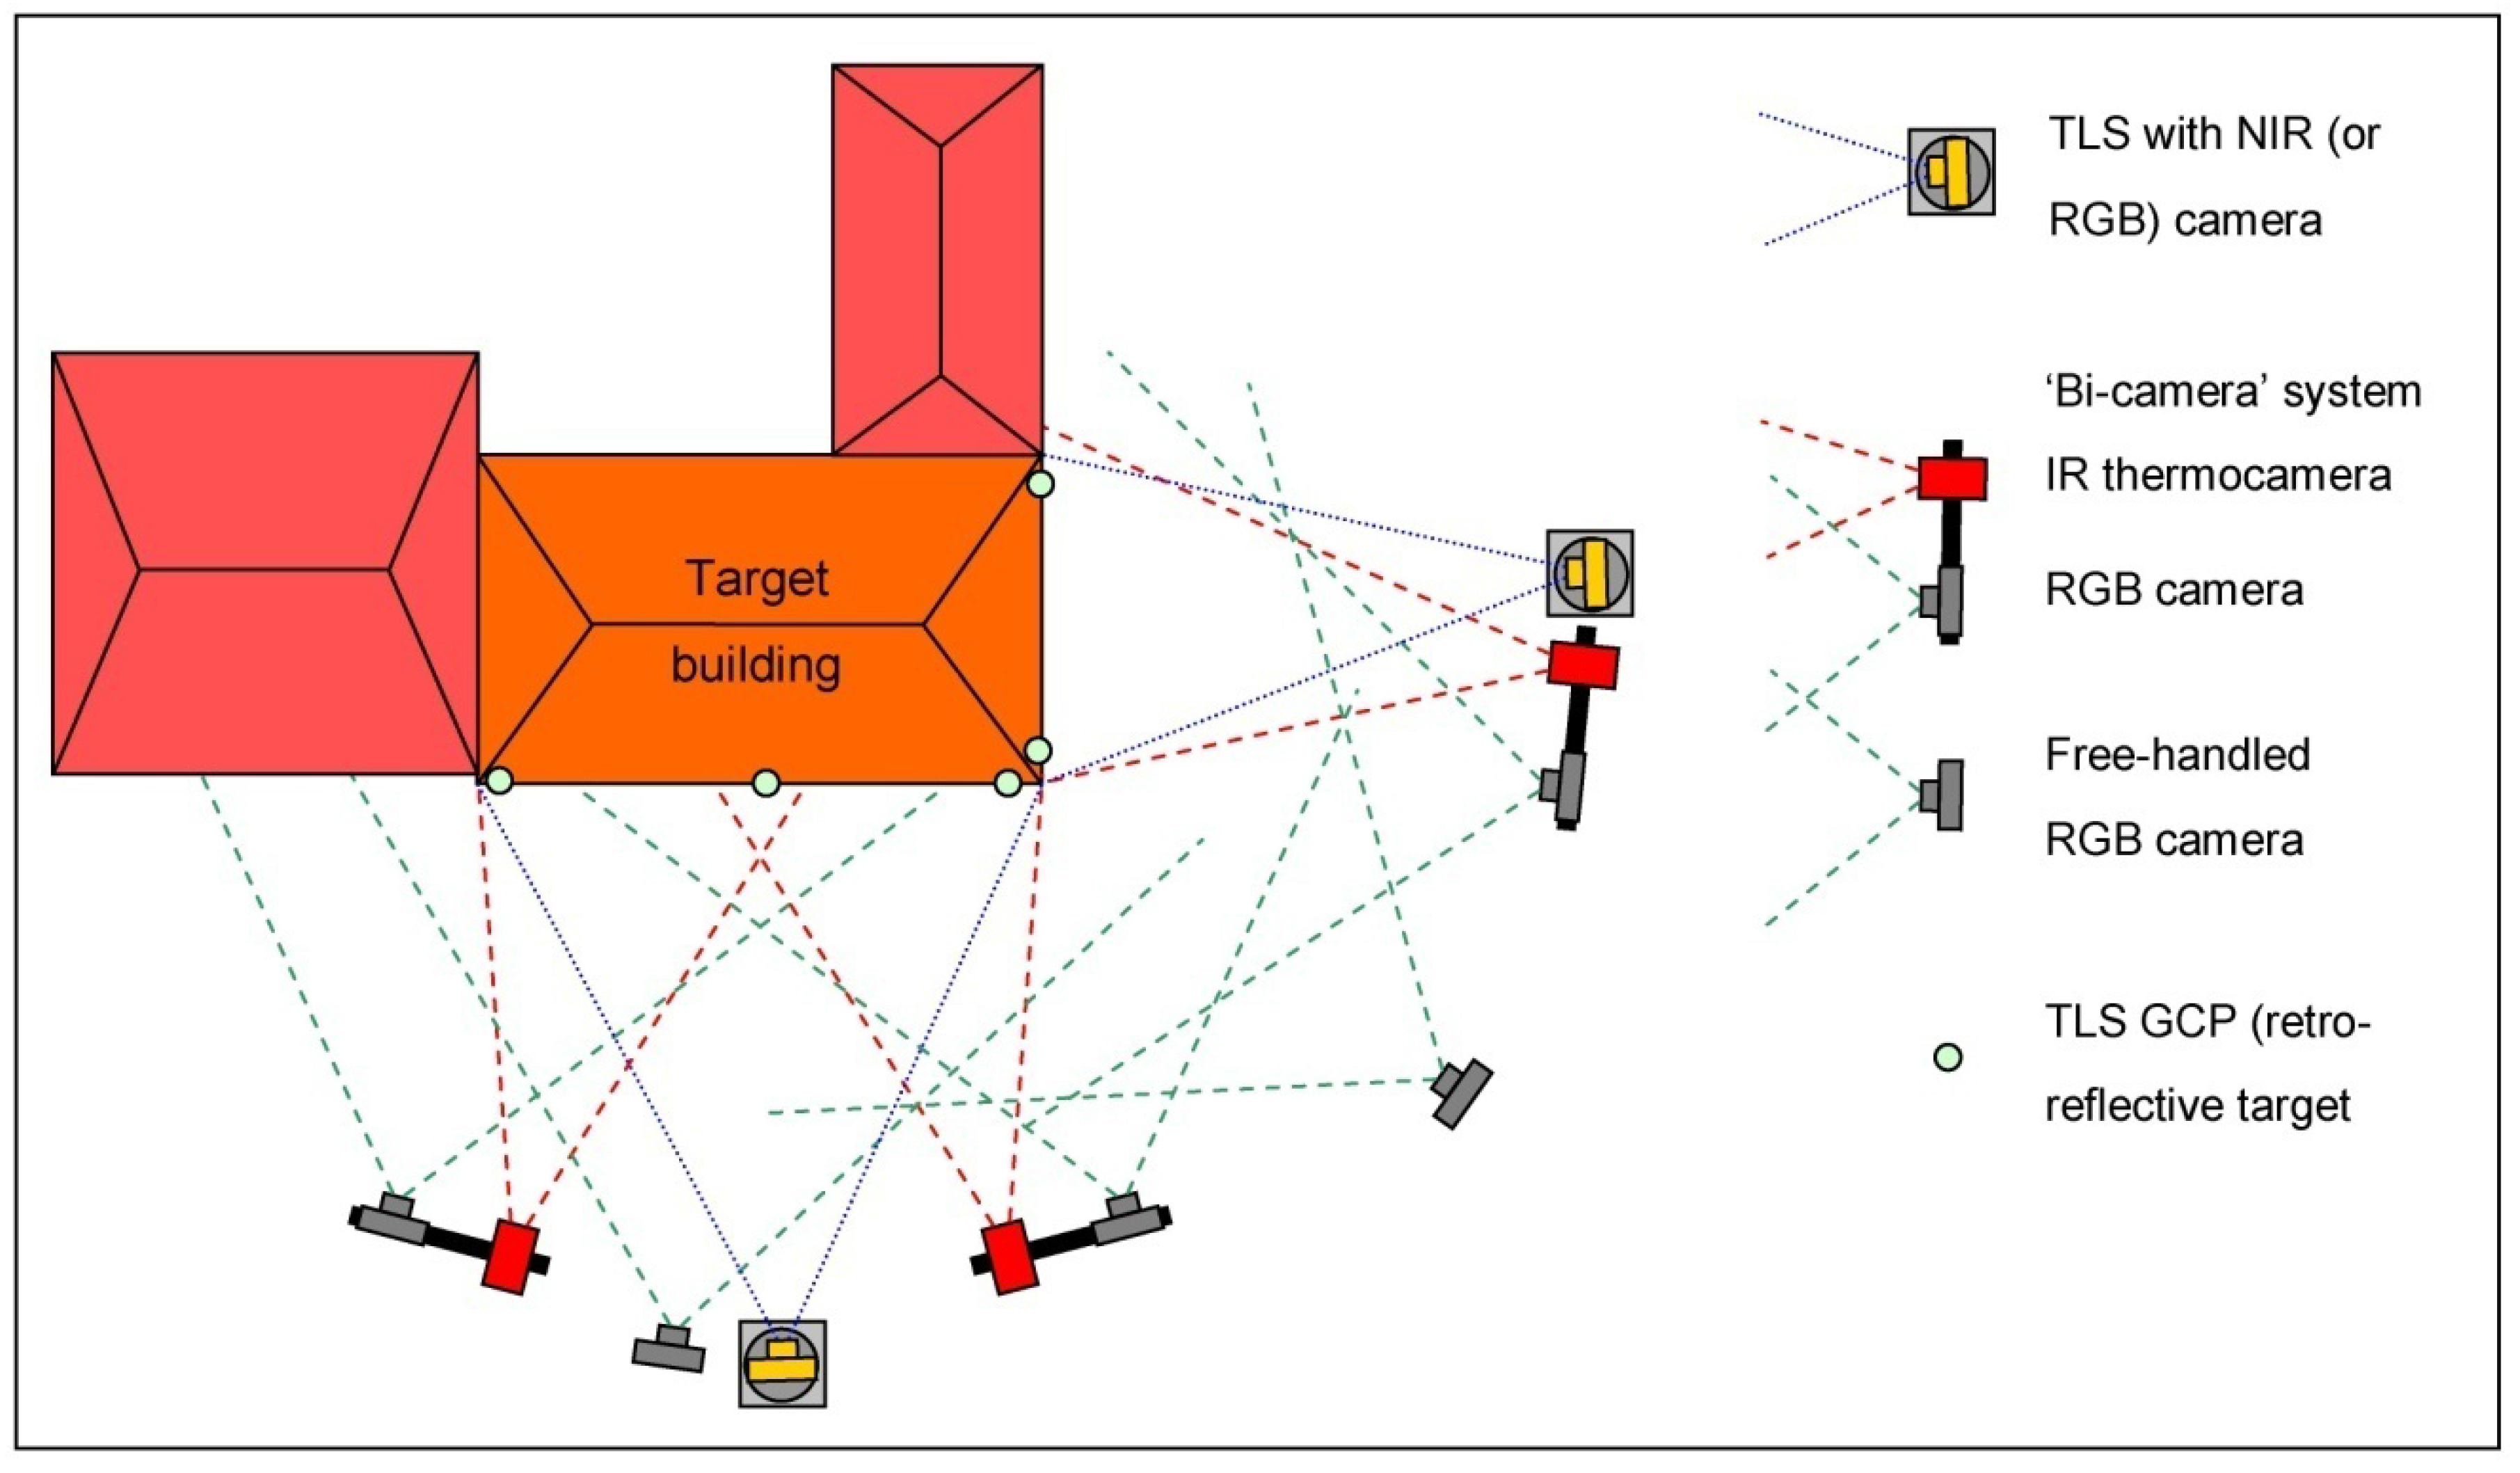
Figure 3.
Example of data acquisition process for mapping IR/NIR/RGB images on a 3D model of a building.
Figure 3.
Example of data acquisition process for mapping IR/NIR/RGB images on a 3D model of a building.
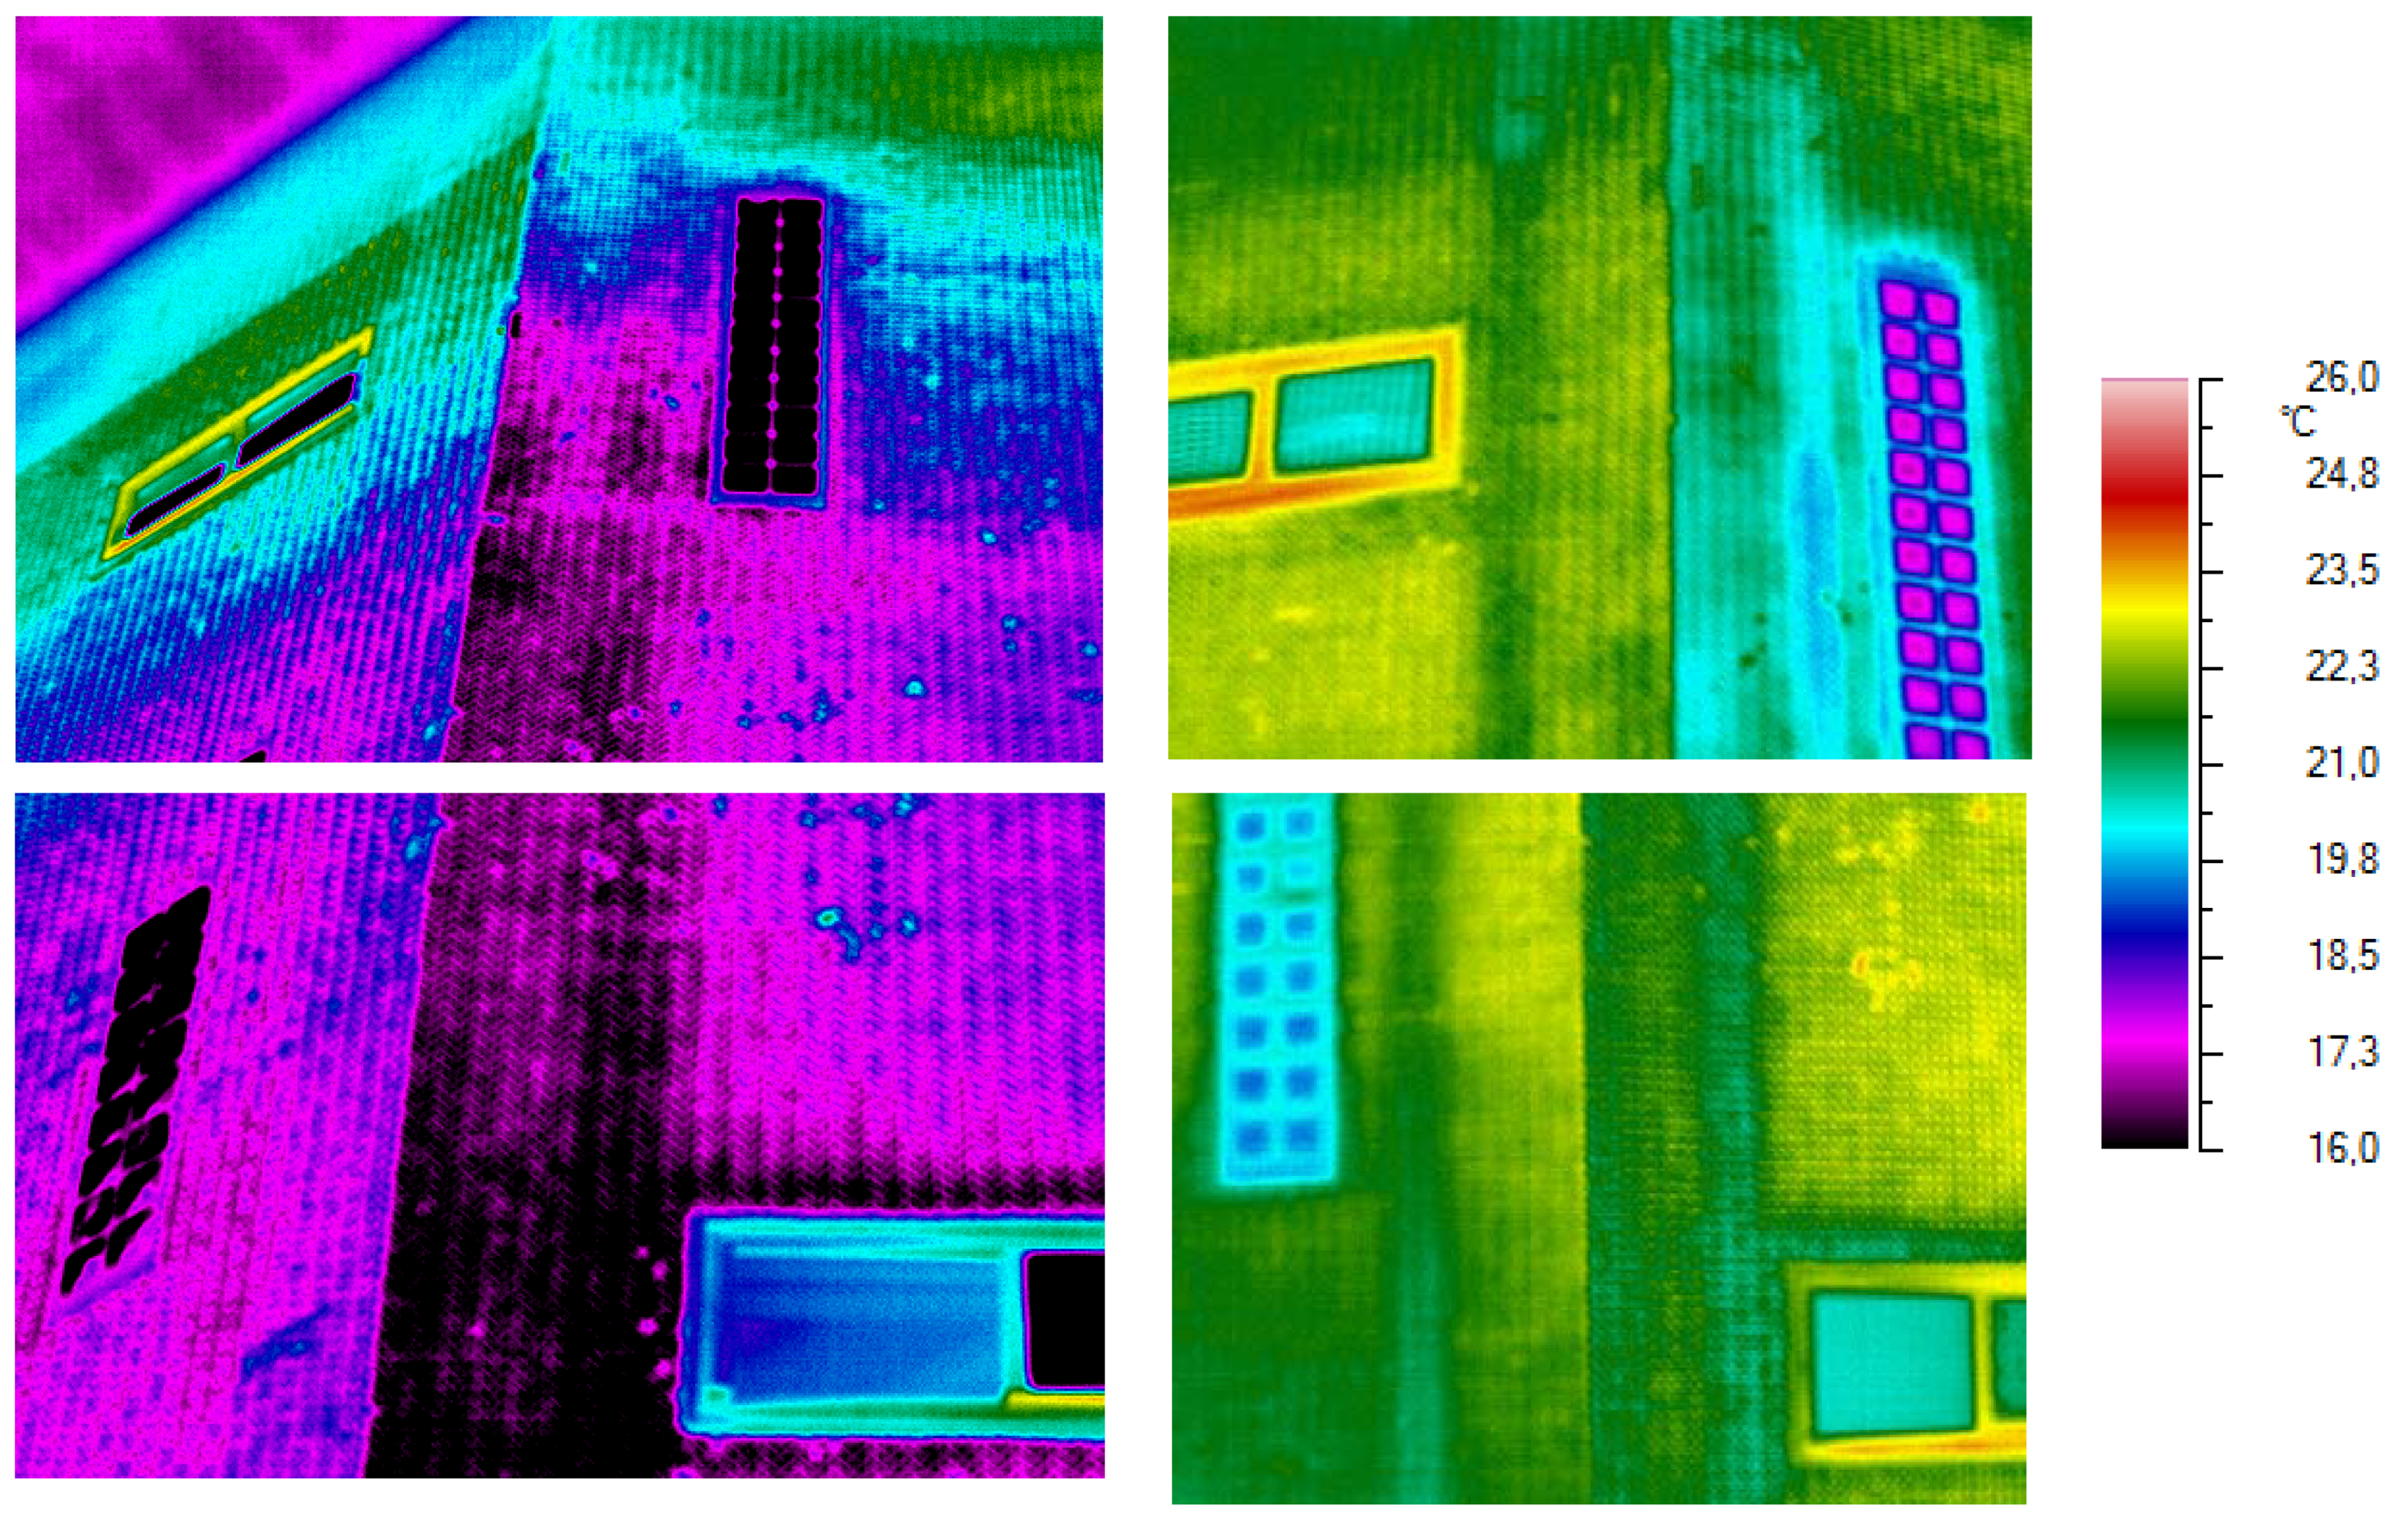
Figure 4.
Couple of thermal IR images of overlapping portions of the same facade taken at different epochs (1 h). The use of a color palette shows the strong differences due to temperature changes.
Figure 4.
Couple of thermal IR images of overlapping portions of the same facade taken at different epochs (1 h). The use of a color palette shows the strong differences due to temperature changes.
Figure 5.
Data acquisition systems: (a) “Bi-camera” system, including a Nikon D80 SLR (3,872 × 2,592 px, f = 20 mm) and an IR Thermocamera camera AVIO (320 × 240 px, equipped with an uncooled microbolometric detector, resolution 0.08 K; FoV 26° × 19,6°, IFOV 1.4 mrad, f = 74 mm); (b) “Bi-camera” system, including a Nikon D80 SLR and an IR Thermocamera NEC H2640 (640 × 480 px, equipped with a UFPA detector, resolution 0.03 K; FoV 21.7° × 16.4°, IFOV 0.6 mrad, f = 50 mm); (c) TLS Riegl LMS-Z420i integrating a SLR camera Nikon D100 (3,008 × 2,000, f = 20 mm) to gather RGB or NIR images.
The acquisition of TLS data is carried out independently from the IR/RGB imagery. This option allows one to optimize data acquisition time depending upon the best conditions for each data type. Here the adopted instrument is a Time-of-Flight (ToF) laser scanner Riegl LMS-Z420i, which can be integrated by a SLR camera positioned in a calibrated support on the scanning head. As can be seen in
Figure 5(c), such support can be used to mount an RGB or a low-cost NIR camera (
Section 3.2). This option allows one to obtain the required scans to model the building, which can be directly textured by both RGB and NIR imagery. Aspects related to this stage of data acquisition are reported in
Section 5.3.
Finally the “bi-camera” system is registered into the TLS reference system, so that all data sources can be mapped onto the final 3D model. Some alternative options can be followed to adapt the whole procedure to different operational configurations. For example, the 3D model can be obtained from photogrammetry, either including the RGB images acquired by the “bi-camera” system or independently. All these concerns will be analyzed in
Section 5.4, while in
Section 5.5 the final products that can be obtained by this procedure will be illustrated.
5.1. Exterior Orientation of RGB Images
Bundle adjustment is a well-assessed task in modern photogrammetry for blocks of high-resolution images taken by calibrated cameras. On the other hand, an accurate design of the block geometry is required to guarantee a stable solution of the EO parameters (i), the datum definition (ii), and the possibility of adopting image matching procedures for orientation or surface reconstruction (iii).
Different options depend upon the modality adopted for tie point measurements and the following bundle adjustment process. Although in the case of buildings, the manual measurement is still the more reliable approach, a partial automation is possible. The use of
coded targets is an opportunity given in many photogrammetric packages for close-range applications [
24]. It allows one to use automated procedures with objects without proper textures, but it also needs a direct access to the façades where targets have to be positioned. In this procedure the automatic marker-less orientation technique ATiPE [
20] has been included. Its application is optional, depending upon the image content and the block geometry, as shown in
Section 6.
The datum definition of the photogrammetric block is carried out in a standard way, by using ground control points or inner constraints.
5.2. Relative Orientation of the “Bi-Camera” System
One of the most remarkable advantages of the “bi-camera” system is the opportunity to employ the RGB data in the processing pipeline. Orientation parameters will be transferred to the thermal camera according to a mathematical relationship that considers the relative positions of both cameras. The EO parameters of both cameras are expressed through their rotation matrices (RRGB, RIR) and vectors of perspective centers (X0RGB, X0IR). The parameters corresponding to the RGB camera are computed in the object reference system within a bundle adjustment. The ones of the IR thermocamera are derived by exploiting the relative orientation between both sensors as follows.
In the case of a stereo system where cameras are mounted on a bar, the
relative rotation matrix (
R*) between both cameras can be expressed using the following condition:
The matrix R* does not change if the stereo system is translated or rotated and can be determined with a calibration procedure where both thermal and visible images are oriented within a bundle adjustment using a photogrammetric block made up of stereo pairs. The knowledge of the rotation matrix RRGB is adopted to derive RIR by inverting Equation (3) as RIR = RRGB R*.
The second constraint due to relative orientation concerns the perspective centers of cameras. Although the length of the baseline ||
X0RGB −
X0IR|| is a fixed value, the difference between the perspective center components ∆
X =
X0IR −
X0RGB cannot be a constant if the stereo system is shifted and rotated. On the other hand, if this difference is written by considering the reciprocal position of the cameras (e.g., using the intrinsic reference system of the right camera), it assumes a constant value
t:
As a calibration project provides the value of the vector
t, during the survey of a building façade the perspective center of the thermocamera can be estimated as:
An important operational problem related to the acquisition of IR images is the small format of current sensors. This limitation requires short camera-object ranges if a high resolution of thermal maps is needed. As a consequence, in many cases a fixed focusing distance cannot be applied for the acquisition of each image. The computation of a multiple sets of APs according to diverse focusing distances is not a practical solution. On the other hand, in such cases the method based on the orientation of each single IR image by means of space resection is surely better. Indeed, the main difference between sets of calibration parameters is due to the principal distance c. Consequently, the use of space resection allows one to adjust this parameter per each camera pose.
The relative orientation of the system is estimated within a block of images where both datasets (RGB and IR) are oriented. After the selection of an object with a good texture, series of stereo pairs are acquired. Both projects are oriented separately and then they are registered in the same reference system, where a metric distance is used to remove the scale ambiguity and to estimate R* and t.
The use of constraints like those presented is not new in photogrammetric applications with multi-sensor systems. In [
25], a system with three cameras, two visible and one thermal infrared, was calibrated with a bundle adjustment incorporating distance constraints.
5.3. Laser Scanning Modeling and NIR/RGB Texturing
Laser scanning is a general solution for 3D modeling. Here the instrument adopted to accomplish the procedure (see the workflow in
Figure 3) is a Riegl LMS-Z420i (technical data can be found at
www.riegl.com). Although this laser scanner yields lower precisions in surface measurement than
phase-shift sensors specifically designed for architectural surveying (see [
26] for a review of up-to-date sensors), the integration of a high resolution camera allows us to generate in a direct way a photo-textured 3D model. It is believed to be quite important to select this kind of TLS for multi-source data texturing of building 3D models. Calibration and orientation of both camera devices in the TLS
intrinsic reference system (IRS) are obtained in a preliminary stage by adopting standard procedures implemented in the Riegl company data acquisition and processing software Riscan Pro.
The horizontal FoV of Riegl LMS-Z420i is a panoramic kind, but the vertical FoV is limited to a band of 80°. On the other hand, the availability of a calibrated tilt-mount support can be exploited to acquire scans at different vertical inclinations from the same stand-point. A set of rigid-body transformation parameters allow one to register these scans together. In a similar way, the digital camera mounted on the scanner head can be rotated around the instrumental main axis and blocked to fixed steps. Therefore, several small FoV images can be used for texturing a full panoramic laser scan.
In the case the TLS survey has to be carried out from more than one stand-point, scan registration can be accomplished by using retro-reflective targets or
surface matching algorithms like ICP [
22]. If the survey needs to be geo-referenced into an external reference system, some points can be measured with a theodolite from the stations of a geodetic network.
5.4. Data Fusion and Photo-Texturing
At the current stage of the procedure, two different datasets are available, each of them defined in a different reference system. The first includes RGB and IR images gathered by using the “bi-camera” system. The orientation of RGB images can be computed by using the options described at
Section 5.1, and then the orientation of IR images is derived by exploiting the relative orientation of the “bi-camera” system. The second group collects laser scan point clouds and NIR images captured by the integrated camera. In both cases a set of GCPs can be used to establish an external datum. Alternatively, some inner constraints can be used.
The fusion of both sub-projects can be carried out by using some CPs that can be measured in the RGB images and in the laser point cloud. If the images captured by the RGB camera integrated to the laser scanner can be included in the photogrammetric block made up of RGB images captured by the “bi-camera” system, the measurement of common tie points might by used as additional observations for the fusion of both sub-projects.
Once all data have been registered in the same reference, the polygonal 3D model (or point cloud) can be textured by projecting any single thermal image. An additional check of the occlusions can be done as well. As previously mentioned, an advantage of the method consists in the use of high resolution visible images during the orientation phase, avoiding collimations with the thermal ones because of the modest metric accuracy obtainable. Moreover, it should be noted how some objects cannot be rigorously textured with the standard space resection procedure, especially in the case of objects with poor textures.
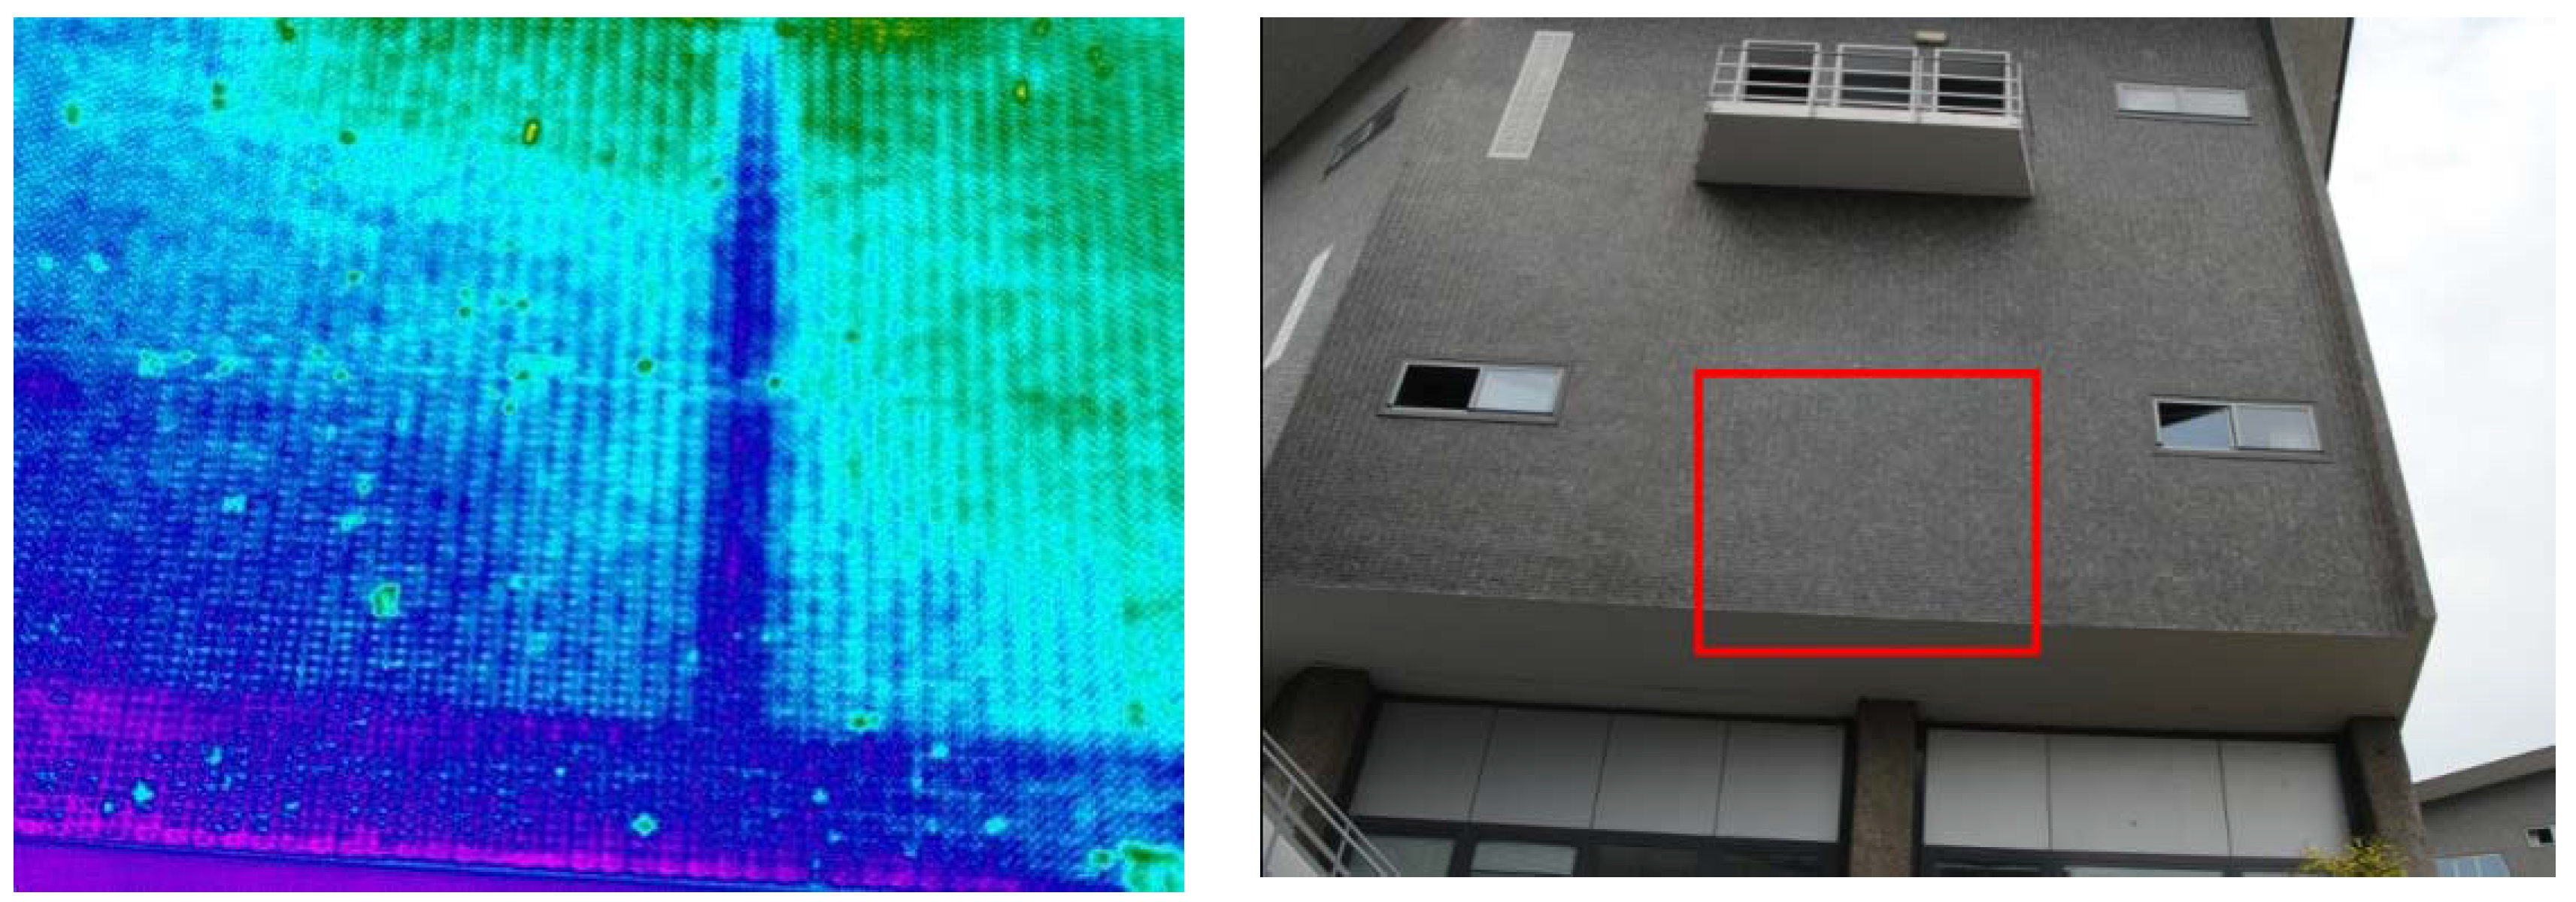
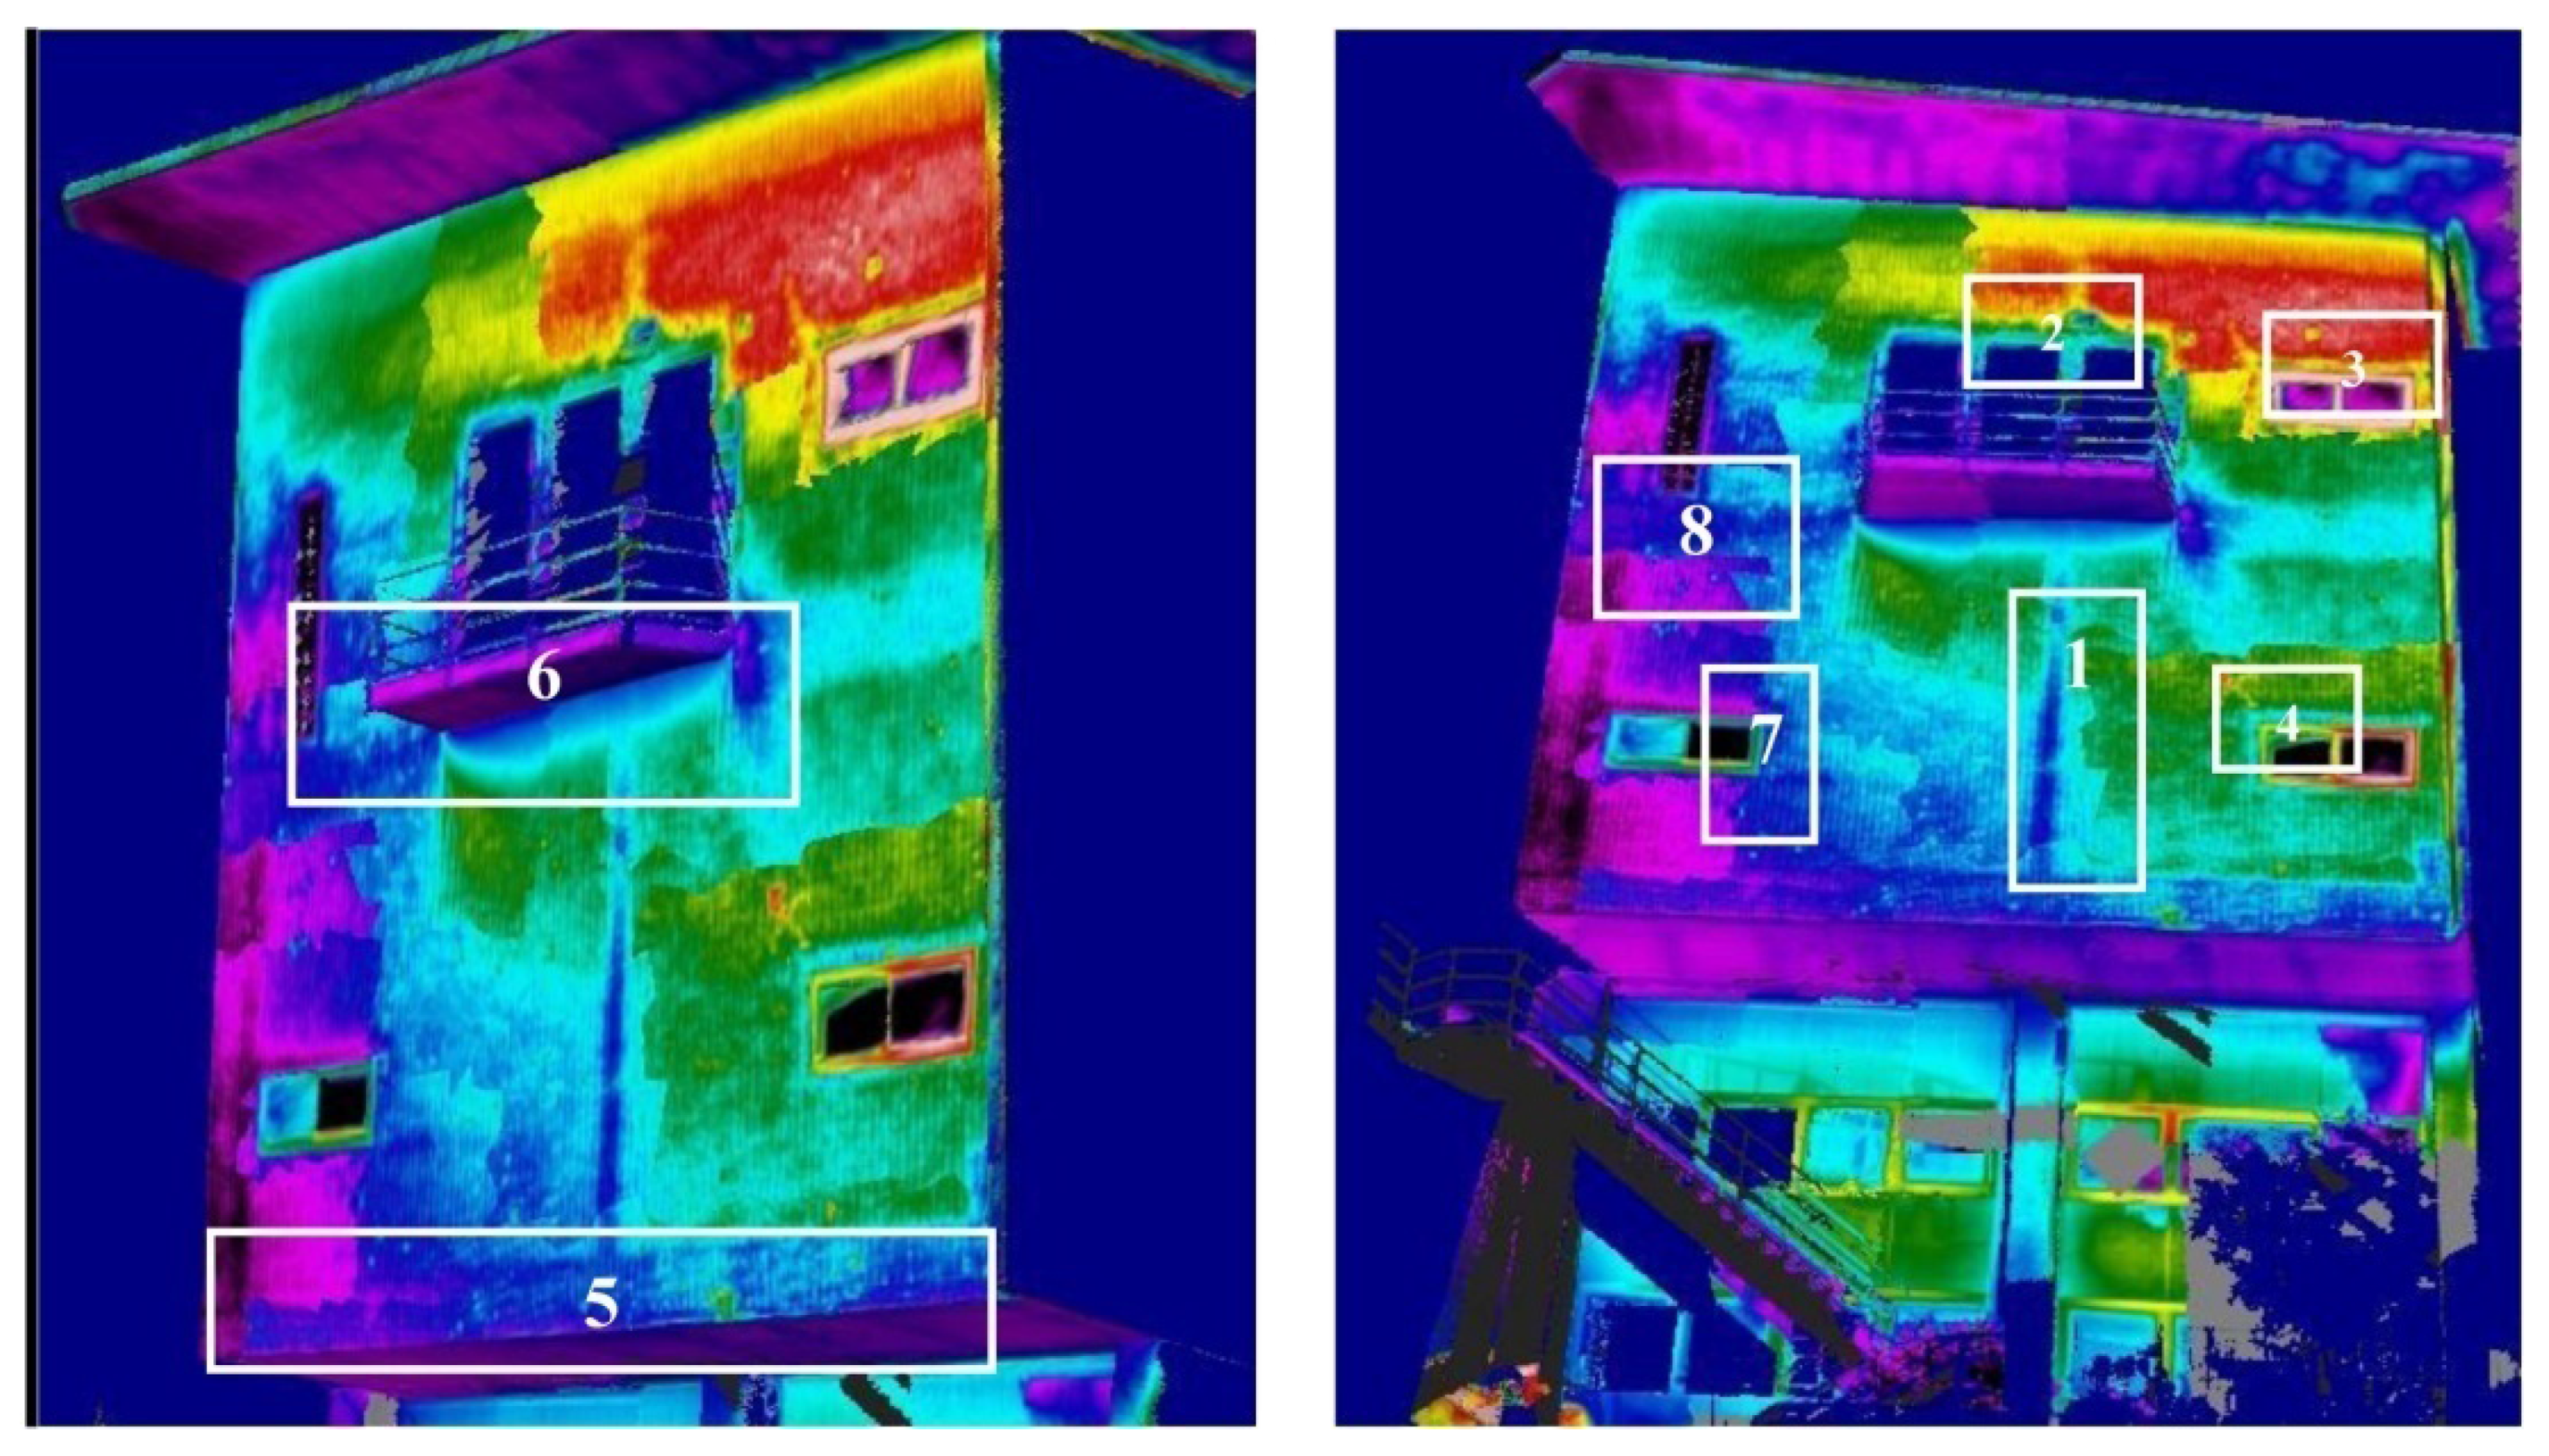
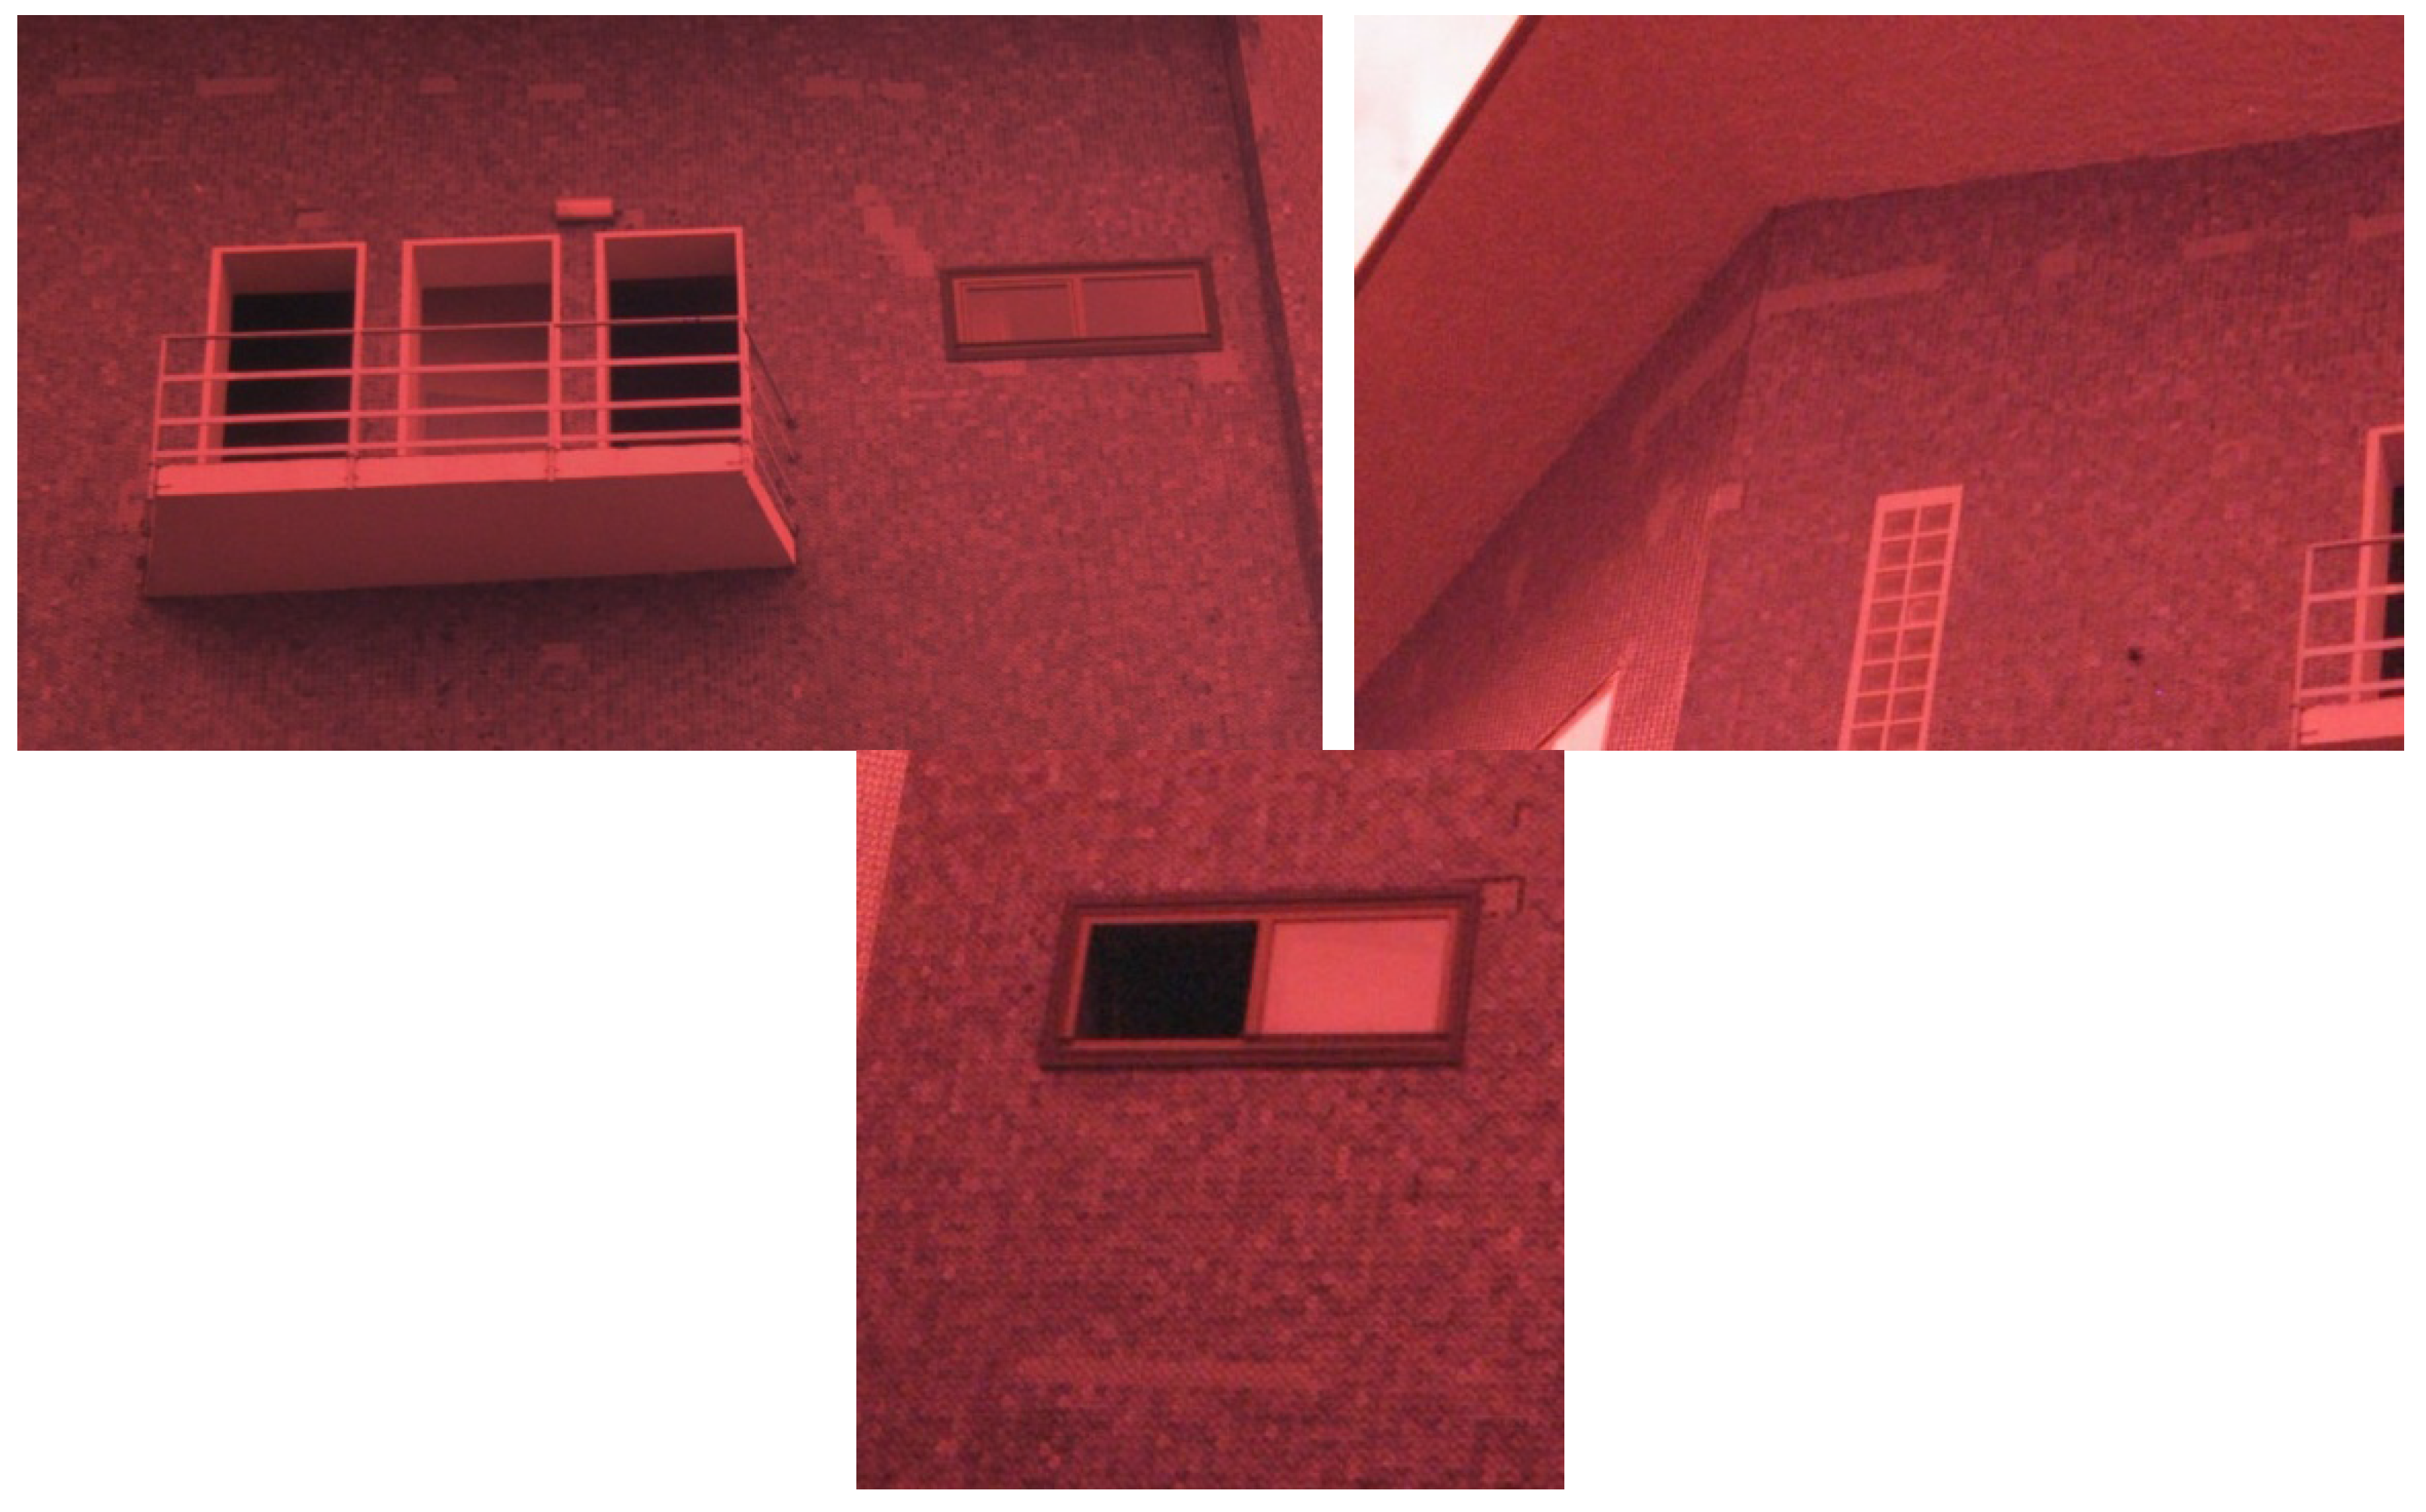
Figure 6 shows a typical situation where the thermal image alone is not sufficient to accomplish the texture mapping of the object. The uniform texture of the building does not allow the measurement image points. On the other hand, the corresponding RGB image covers a larger area, where several distinctive elements can be successfully matched.
Figure 6.
The use of the “bi-camera” system allows the orientation of thermal images where no distinctive elements are present, as in the example below derived from the case study in
Section 6.2.
Figure 6.
The use of the “bi-camera” system allows the orientation of thermal images where no distinctive elements are present, as in the example below derived from the case study in
Section 6.2.
5.5. Final Products
Once all data have been registered and mapped into the same reference system, some final outputs can be generated. The most complete product that can be derived is a
photo-textured 3D model, where all informative layers (geometric structure, RGB, NIR and IR textures) can be displayed. Such models give the opportunity to exploit the real three-dimensional data structure. Data can be manipulated by end-users through 3D visualization tools, which are available today also in the open-source community. In
Figure 7 an example of different multispectral textures on the same portion of the building are reported.
On the other hand, most end-users are not familiar with 3D visualization tools. If an architectural object can be divided into different quasi-planar façades, each of them can be managed as a set of 2.5D data in a GIS environment [
27] or CAD software. Alternatively instruments like “Solid Images” [
28] can be used for data delivering and interpretation. Different layers can be overlapped and visualized: the TIN/DEM surface model; the RGB, NIR and IR mosaic or ortho-rectified images; a vector layer if available. As proposed by [
13],
pan-sharpening of IR images on the basis of RGB images can be applied to improve their raw resolution. However, the authors do not believe that such images could provide additional information to the rectified IR images. This data structure, although only 2D with additional information on the elevations, can be used to perform visual inspections of single layers, comparisons between different layers, but also analytical correlations between raster layers.
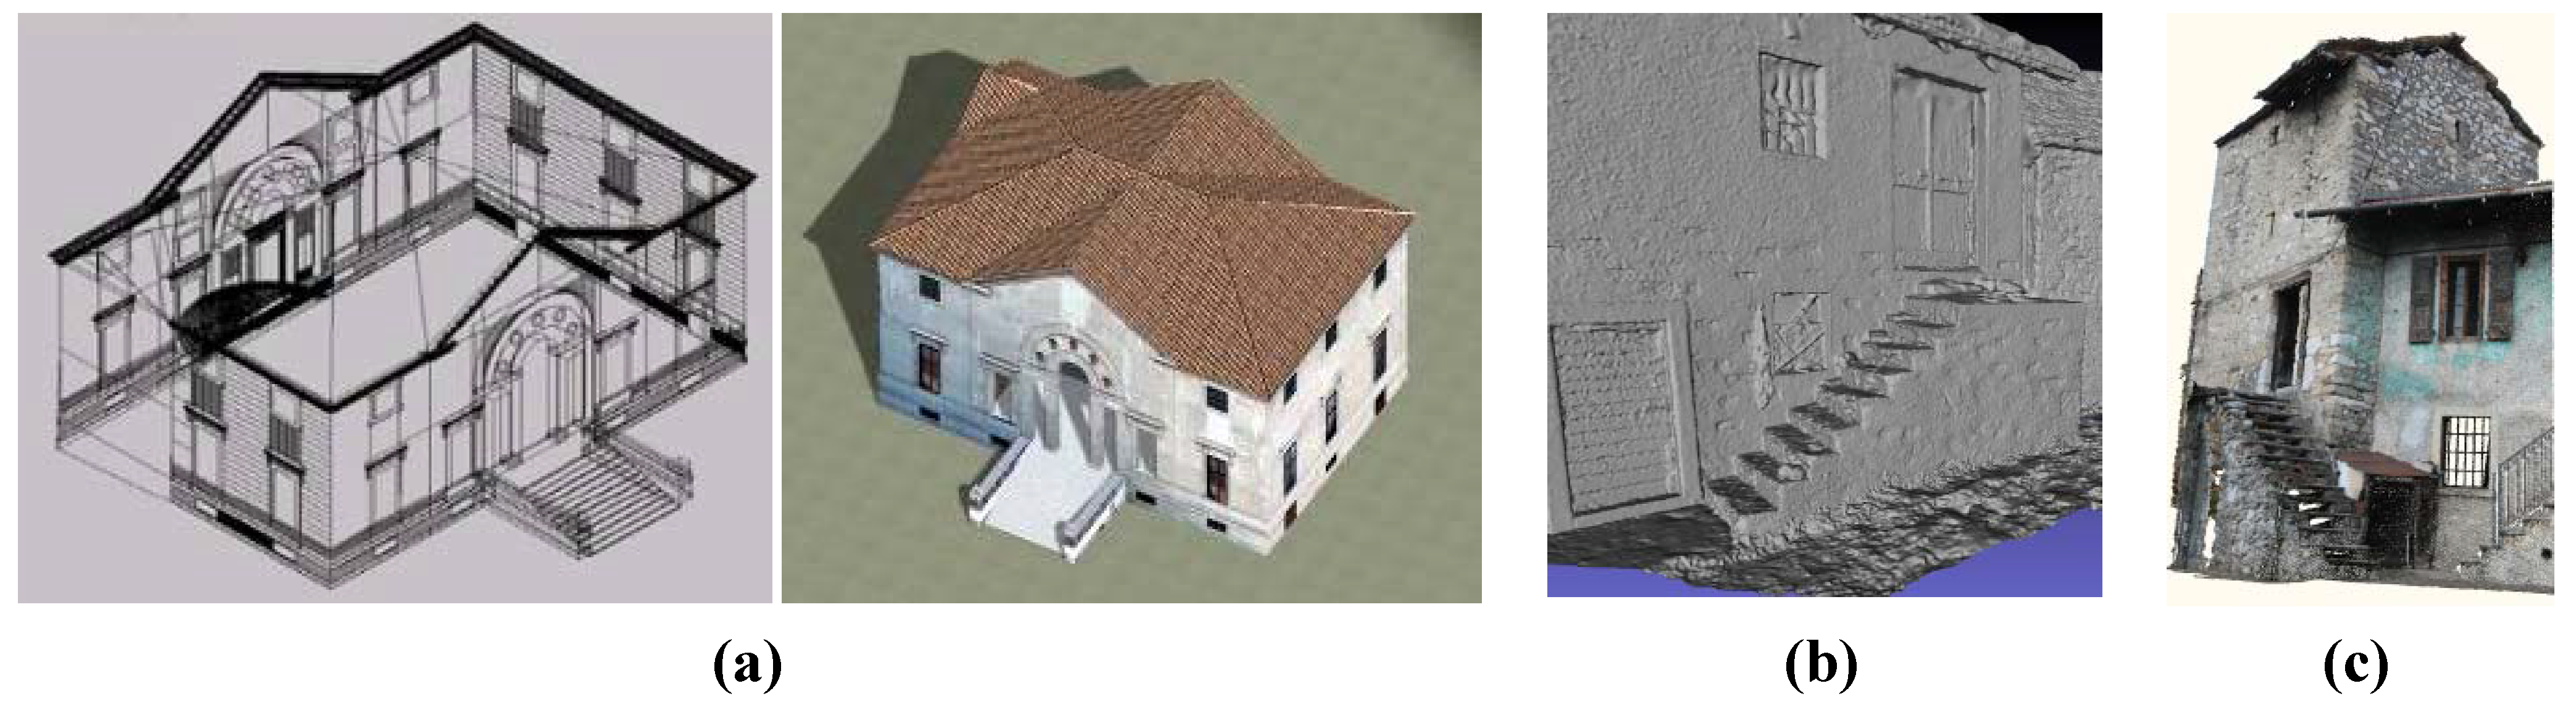
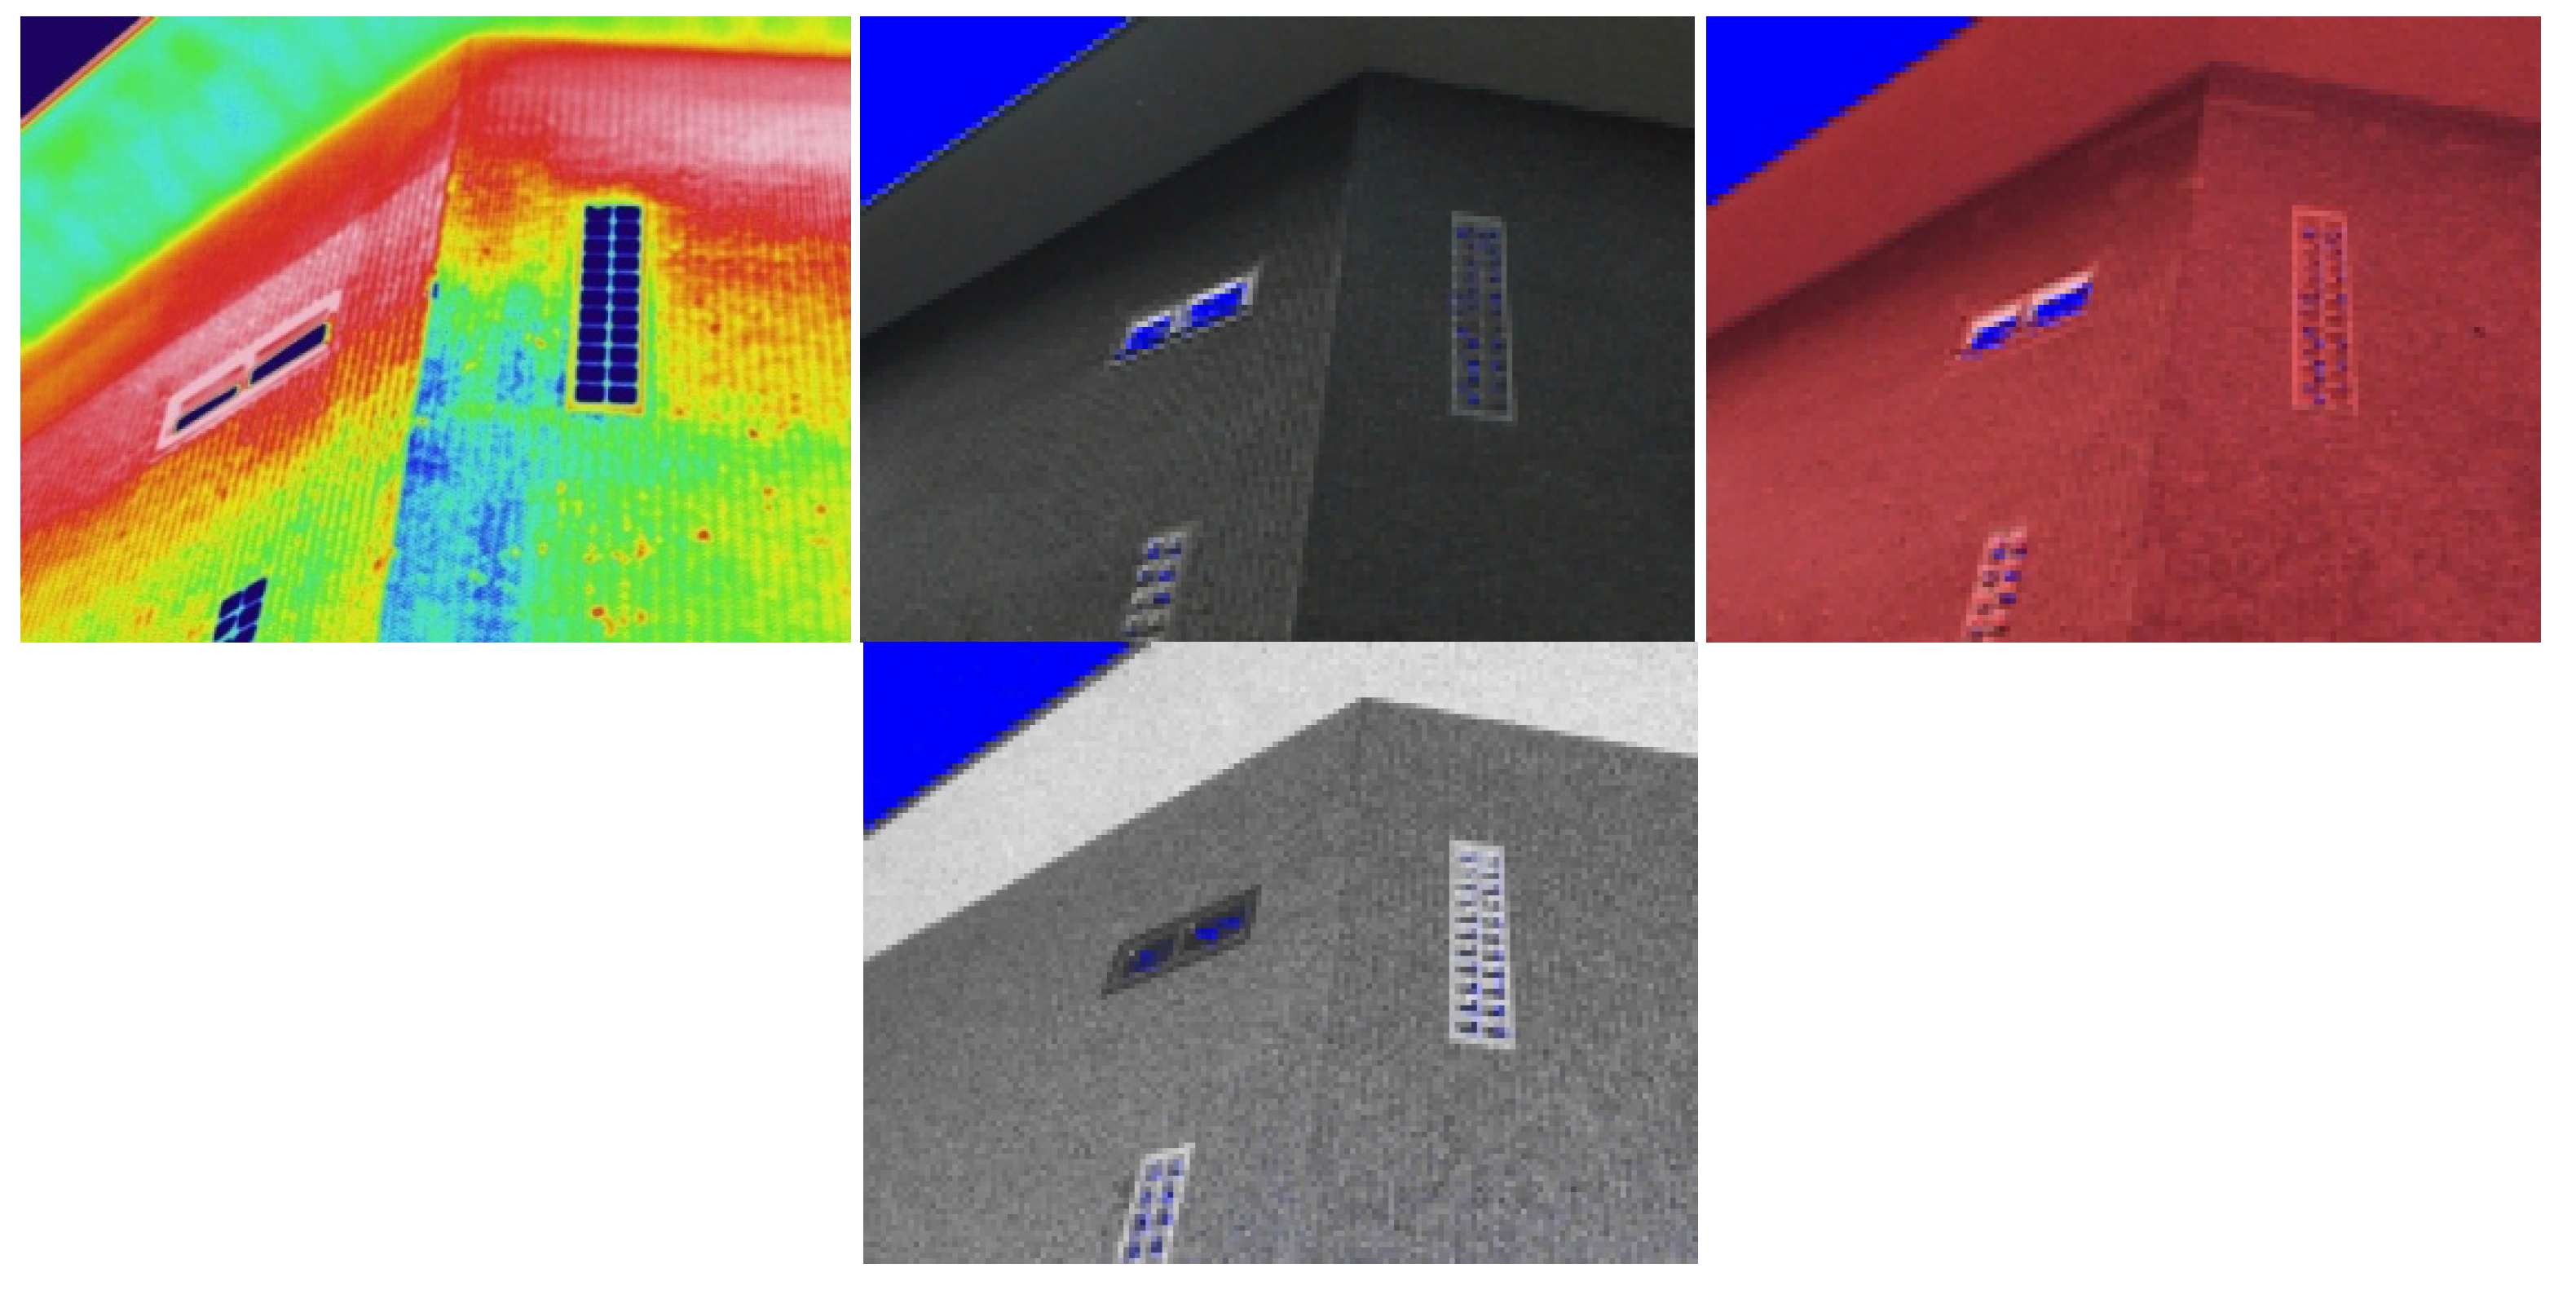
Figure 7.
A portion of the building in the case study reported in
Section 6.2 that has been textured by different kinds of multispectral images. From left to right: thermal IR, RGB, NIR, laser return intensity.
Figure 7.
A portion of the building in the case study reported in
Section 6.2 that has been textured by different kinds of multispectral images. From left to right: thermal IR, RGB, NIR, laser return intensity.
7. Conclusions and Future Work
In this paper, a procedure for texturing thermal IR images on a 3D building model was introduced. Terrestrial laser scanning is used as principal technique for the acquisition of a 3D model, but photogrammetry or existing CAD models can be applied as alternative solutions. In addition, NIR images captured by a low cost-camera integrated to the laser scanner can be added to the textured model. The proposed methodology tries to simplify the texturing process of IR images, which are usually acquired by low-resolution, small format digital cameras with respect to standard RGB images. The common approach used today is based on mapping each single image through space resection (or by homography if the model is flat). Here a bundle adjustment solution is proposed, but it requires the setup of a “bi-camera” system coupling a high resolution RGB camera to a thermocamera. In future, the orientation of the IR thermocamera could be carried out by exploiting the integrated coaxial RGB sensor that is supposed to impressively improve its performance in the next few years. A direct orientation solution using a low-cost IMU (Inertial Measurement Unit) device is also expected to help image orientation.
On the other hand, thermal sensors will soon enlarge their format, although a geometric resolution comparable to those of RGB digital cameras cannot be obtained due to diffraction limits. Consequently, efforts to improve the registration of IR images and with respect to other data sources deserve further studies. Both tasks are involved in either the calibration of the IR sensor and the relative orientation of the “bi-camera” system. The registration of the stereo system to the laser scanning system is still a manual task, if targets are not used. The recognition of common features between RGB images and laser intensity data could be a way to obtain this result, as suggested by [
38]. The problem of the variable focusing distance is still a drawback for accurate applications. Further studies will be required both for vendors (e.g., by producing lenses with calibrated focusing steps) and for end-users. In the latter case, calibration models that can be adaptively changed according to the range could be developed for IR thermocameras (if the effective focal length can be digitally recorded by the sensor) as proposed in [
39] and [
40] for RGB cameras.
The integration between photogrammetry, terrestrial laser scanning, and IR thermography allows one to optimize mapping of thermal anomalies, to ascertain their location, and to improve the geometric resolution of the final textured 3D model. Therefore the better evaluation of the defect/anomaly extension allows one to prioritize the conservation plan and the modality of the maintenance activity. Furthermore, the released graphic documentation consists of orthoimages that can support the preliminary projects for the conservation plan. This is complemented by some digital outputs like photo-textured 3D models and the implementation of data corresponding to different façades in a 2.5D GIS environment.
The optimization of the thermal recaptures in the preliminary phase of the project allows one to improve the decision making process for the economic evaluation of the necessary resources for conservation. On the other hand, the large scale application of the presented procedure could require a higher investment (funds and time) in the preliminary phase instead of at the end of the decision making process. The main costs depend on the articulation/complexity of the buildings (prominent and non-planar parts, projecting decorations) and the extension of the thermal anomalies under investigation. It will be reduced in the further step of the application thanks to the optimization of procedures.
Finally, the application of NIR images in building analysis is somewhat innovative. Such kinds of images can be easily used to texture 3D models if a low-cost camera integrated to a terrestrial laser scanner is employed. On the other hand, further studies are needed to understand the response of construction materials in the NIR spectrum.


