Article

A MODIS-Based Energy Balance to Estimate Evapotranspiration for Clear-Sky Days in Brazilian Tropical Savannas

by
Anderson L. Ruhoff
1,*,
Adriano R. Paz
2,
Walter Collischonn
3,
Luiz E.O.C. Aragao
4,
Humberto R. Rocha
5 and
Yadvinder S. Malhi
6
1
Instituto de Ciências Humanas e da Informação, Universidade Federal do Rio Grande, Rio Grande, RS CEP 96201-900, Brazil
2
Departamento de Engenharia Civil e Ambiental, Universidade Federal da Paraíba, João Pessoa, PB CEP 58059-900, Brazil
3
Instituto de Pesquisas Hidráulicas, Universidade Federal do Rio Grande do Sul, Porto Alegre, RS CEP 91501-970, Brazil
4
College of Life and Environmental Sciences, University of Exeter, Exeter EX4 4RJ, UK
5
Instituto de Astronomia, Geofísica e Ciências Atmosféricas, Universidade de São Paulo, São Paulo, SP CEP 05508-900, Brazil
6
School of Geography and the Environment, Oxford University Centre for the Environment, Oxford OX1 3QY, UK
*
Author to whom correspondence should be addressed.
Remote Sens. 2012, 4(3), 703-725; https://0-doi-org.brum.beds.ac.uk/10.3390/rs4030703
Submission received: 3 February 2012 / Revised: 5 March 2012 / Accepted: 5 March 2012 / Published: 12 March 2012

Abstract

:
Evapotranspiration (ET) plays an important role in global climate dynamics and in primary production of terrestrial ecosystems; it represents the mass and energy transfer from the land to atmosphere. Limitations to measuring ET at large scales using ground-based methods have motivated the development of satellite remote sensing techniques. The purpose of this work is to evaluate the accuracy of the SEBAL algorithm for estimating surface turbulent heat fluxes at regional scale, using 28 images from MODIS. SEBAL estimates are compared with eddy-covariance (EC) measurements and results from the hydrological model MGB-IPH. SEBAL instantaneous estimates of latent heat flux (LE) yielded r2= 0.64 and r2= 0.62 over sugarcane croplands and savannas when compared against in situ EC estimates. At the same sites, daily aggregated estimates of LE were r2 = 0.76 and r2= 0.66, respectively. Energy balance closure showed that turbulent fluxes over sugarcane croplands were underestimated by 7% and 9% over savannas. Average daily ET from SEBAL is in close agreement with estimates from the hydrological model for an overlay of 38,100 km2 (r2 = 0.88). Inputs to which the algorithm is most sensitive are vegetation index (NDVI), gradient of temperature (dT) to compute sensible heat flux (H) and net radiation (Rn). It was verified that SEBAL has a tendency to overestimate results both at local and regional scales probably because of low sensitivity to soil moisture and water stress. Nevertheless the results confirm the potential of the SEBAL algorithm, when used with MODIS images for estimating instantaneous LE and daily ET from large areas.

1. Introduction

Evapotranspiration (ET) is one of the most important regulating factors of climate, at both local and global scales, linking energy, climate and hydrology. ET is traditionally calculated as a difference of water-balance terms, whilst it is measured by instruments such as lysimeters or eddy-correlation (EC) systems. However such methods are limited in that they provide values of ET at specific sites and not at a regional or larger scale. Because the costs of installing complex measurement systems are high, and human and economic resources scarce, methods have therefore been developed in recent years which provide rapidly available hydrological data over large areas based on remote sensing.
To estimate energy fluxes between surface and atmosphere, a number of algorithms have been developed, including METRIC (Mapping EvapoTranspiration with Internalized Calibration) [1], Alexi (Atmosphere-Land Exchange Inverse) and DisAlexi (Disaggregated Atmosphere-Land Exchange Inverse) [2], SEBS(Surface Energy Balance System) [3], S-SEBI(Simplified Surface Energy Balance Index) [4], SEBAL (Surface Energy Balance Algorithm for Land) [5,6],T-SEB(Two-Source Energy Balance) [7], R-SEB(Aerodynamic Resistance Surface Energy Balance) [8], among others. The aim of such algorithms is to estimate latent heat fluxes (LE) and ET at both local and regional scales, using remote sensing with complementary meteorological data. Specifically, results obtained by SEBAL are regarded as consistent with field measurements [915]. Other research has reported results that are less clear [16,17].
SEBAL was developed conceptually for local and regional scale applications using Landsat images [11] with spatial resolution of 30 m and a temporal resolution of 16-day. However following the launch of other sensor systems, especially the MODIS sensor with 500 m of spatial resolution and a twice-daily temporal resolution, monitoring biogeochemical processes at the earth’s surface has gained a new boost. The availability of remote sensing data at different temporal, spatial and spectral resolutions allows new methodologies to be proposed for the purpose of monitoring and understanding the characteristics of complex environmental systems. The great advantage of MODIS data is the temporal resolution, since they can be used to estimate energy fluxes at regional, continental and global scales at daily time intervals [18], which is not possible with sensors such as Landsat TM and ETM, with broad images and less frequent revisits [19]. Much research has reported the influence of the remote sensing scale factor on ET estimates, where higher spatial resolution can contribute significantly to increased estimate accuracy [2022], whilst lower resolutions can result in loss of important information for environmental applications [23,24]. Compared to Landsat TM or ETM spatial resolution, the moderate spatial resolution from MODIS sensor when used in surface energy balance algorithms at regional scales can contribute significantly to increase errors in ET estimates due to scale factor. However the high radiometric sensitivity of MODIS’s 36 spectral bands associated with geometric and atmospheric corrections can compensate for lower spatial resolution. ET estimates at continental and global scales based on moderate spatial resolutions have been shown to be accurate [2532].
The purpose of this study was to estimate energy fluxes between surface and atmosphere for clear-sky days (days that are not affected by cloud cover at any time of the day) using SEBAL algorithm and Terra MODIS remote sensing datasets in tropical biomes in Brazil. Results were validated at local scale using EC data and at the spatial (regional) scale using hydrological modelling. The SEBAL algorithm [5,6,11], primarily driven by remote sensing data, was used to estimate ET at the regional scale, whilst the MGB-IPH (Large Basins Hydrological Model) hydrological model [33] was used to estimate ET at basin scale.

2. Methodology

2.1. Surface Energy Balance Algorithm for Land

2.1.1. Model Description

SEBAL uses multispectral remote sensing data associated with complementary meteorological data to estimate instantaneous surface energy balance components. The requirement for multispectral and thermal information means that the algorithm can only be used with images acquired on cloud-free days. Instantaneous LE (W·m−2) was estimated as the residual in the energy-balance equation (Equation (1)), as the difference between net radiation (Rn: W·m−2), soil heat flux (G: W·m−2) and sensible heat flux (H: W·m−2). A full description of the algorithm is given by Bastiaanssen et al. [5,6] and Allen et al. [11].
LE = R n G H
Surface albedo (αs) was estimated using MODIS daily surface reflectance [34] (Equation (2)) while surface emissivity (εs) was estimated using MODIS 16-days NDVI composition [35] (Equation (3)).
α s = b = 1 7 [ ρ s , b ω b ]
ɛ s = 1.009 + 0.047 ln ( NDVI )
in which ρs,b is the at-surface reflectance for band “n” and ωb is the weighting coefficient representing the fraction of at-surface solar radiation occurring within the spectral range represented by a specific band [34].
From the residual in the instantaneous energy-balance equation and the evaporative fraction (EF) (Equation (4)) the daily ET (ET24h: mm·day−1) were estimated (Equation (5)). EF has an important characteristic which is its regularity and constancy in cloud-free days [36]. Thus, its instantaneous value can be taken as the daily mean value, so that the spatial variability in daily ET can be predicted over large scales.
EF = LE R n G
ET 24 h = 86400 EF R n , 24 h λ
in which λ is the latent heat of evaporation (J·kg−1) and Rn,24h (W·m−2) is the average daily net radiation balance (Equation (6)) estimated using a sinusoidal function [37], assuming that during the night Rn and the average daily G is zero [36,38].
R n , 24 h = 2 R n π sin [ ( t overpass t rise t set t rise ) π ]
where toverpass (h) is the time at which the image was acquired and tset (h) and trise (h) are the times of sunset and sunrise, respectively. The daytime hours were calculated based on latitude and the day of the year.

2.1.2. Remote Sensing Input Data

To run SEBAL we used Terra MODIS remote sensing datasets. The datasets used to estimate the surface-energy balance can be classified into: (a) daily surface reflectance (MOD09 GHK C5 [39]), (b) daily land surface temperature (MOD11 C5 [40]) and (c) 16-day vegetation indices (MOD13 C5 [41]). MODIS is operating onboard Terra and Aqua satellites. A ±55° scanning pattern at 705 km altitude achieves a 2,330 km swath that provides global coverage every one to two days. Terra has a 10:30 am equator over-passing time. MOD09GHK gives estimates of spectral reflectance from the surface in seven short-wave spectral bands. MOD11A1 corresponds to land surface temperature (Ts) on cloud-free days. Pixels are selected using a cloud mask (MOD35L2) which excludes pixels affected by aerosols and clouds. The accuracy of the Ts data is better than 1K, and is 0.5K in most cases [40]. However in pixels contaminated by cloud cover and heavy aerosols the accuracy may vary from 4 to 11 °C, since the cloud-cover mask does not discard all affected pixels, particularly those near cloud edges [42]. MOD13A1 gives a normalized difference vegetation index (NDVI), which provide information on vegetation spatial and temporal variations, as well as conditions of photosynthetic activity and biophysical and phenological changes [43]. SEBAL was used on 28 cloud-free days between February and November 2001, 19 of which were in the dry season (usually lasting from April to September) and 9 in the wet season (usually from October to March). Besides the cloud cover which made selection of MODIS images difficult in the wet season, there were also many EC data missing, limiting the application of the model for a larger number of days.

2.2. The Hydrological Model MGB-IPH

2.2.1. Model Description

The MGB-IPH is a distributed hydrological model developed for large basins with drainage areas in excess of 10,000 km2 [33]. This model calculates the complete water balance at daily or monthly time intervals. The model runs using a regular grid with spatial resolution ranging from 5 to 20 km. The grid-cells are connected by channels representing the drainage network [44]. Each grid-cell is divided into classes that combine soil type and vegetation, which are called hydrological response units (HRU) [45,46] to account for the fractional contributions from different physical characteristics within each grid-cell. In the MGB-IPH model, evaporation and transpiration are calculated separately based on Penman-Monteith approach [47] (Equation (7)).
ET 24 h = Δ ( R n G ) + ρ a C ρ ( e s e a ) / r a Δ + γ ( 1 + r s r a )
where ET24h (mm·day−1) is the daily evapotranspiration, Δ (kPa·K−1) is the gradient of saturated vapour pressure, Rn (MJ·m−2·day−1) is the daily net radiation, G (MJ·m−2·day−1) is the daily soil heat flux, ρA (kg·m−3) is the air density, Cp (MJ·kg−1·K−1) is the specific heat of air at constant pressure, es (kPa) and ea (kPa) are the saturated vapour pressure and actual vapour pressure, respectively, γ (0.066 kPa·K−1) is the psychometric constant, whilst rs (s·m−1) and ra (s·m−1) are the surface and aerodynamic resistance, respectively.
It is assumed that evaporation of water intercepted by the canopy leads soil evaporation and plant transpiration. Evaporation of soil water occurs subsequently. If there is still a demand for evaporation, water is evaporated from a second soil layer. The maximum depth of canopy intercepted water (EImax: mm·day−1) is determined for each HRU as a function of leaf area index (LAI). After estimating evaporation, the remaining evaporative demand fraction (fDE) (Equation (8)) is met by plant transpiration for each vegetation cover type, which is used as a correction factor in calculating the plant transpiration (Equation (9)).
f DE = EIP EI EIP
ET 24 h = f DE * Δ ( R n G ) + ρ a * C ρ ( e s e a ) / r a Δ + γ ( 1 + r s r a ) * 1 λ * ρ w
where EIP (mm·day−1) is the potential evaporation of intercepted water, EI (mm·day−1) is the intercepted water by the canopy and ρw (kg·m−3) is the density of water. In this model, ra depends only on the canopy height (m) and wind speed (m·s−1) whilst rs is characteristic of each vegetation type but which vary according to the restriction of soil moisture (W: mm·day−1) [48]. It is assumed that soil conditions do not restrict ET if W is above 50% of soil water capacity (Wm: mm·day−1) [49]. In this case, rs is regarded as a minimum value typical of vegetation unaffected by soil moisture conditions. If soil water storage lies between wilting point (WPM: mm·day−1) and the beginning of the effect on rs (WL: mm·day−1), rs increases (Equation (10)). If W is less than the value WPM, the restriction is at its greatest and ET is zero.
r s = r sm * W L W PM W W PM
where rsm (s·m−1) is surface resistance for a given W. Full details of soil water balance in the MGB-IPH model are given by Collischonn et al. [33]. The MGB-IPH hydrological model was applied successfully in several South American large-scale river basins [5053].

2.2.2. Input Data and Model Validation

The hydrological model calibration and validation were performed using data from 273 rain gauges distributed over the basin were used for the analyses. The data were obtained from the Brazilian Water Agency [54] and from the Integrated System for Water Resource Management of the State of São Paulo [55]. Meteorological data were obtained from 14 data collection platforms provided by the National Institute for Spatial Research in Brazil [56]. To characterize the HRU, we used soil type information from the Radam Brasil [57] as well as land use data derived from classification of LANDSAT 7 ETM+ images. LANDSAT images were classified into four distinct groups: (i) open water; (ii) forest and reforested areas; (iii) agricultural areas; and (iv) pasture and bare soil. Soil types were regrouped into three basic classes according to water storage capacity: (i) high; (ii) medium; or (iii) low. After combining information on soil type and land use, six HRU’s were defined (10 × 10 km cell):
  • pasture, grassland and cropland areas with soils of medium storage capacity (HRU 1);
  • cropland areas with soils of high storage capacity (HRU 2);
  • soils with low storage capacity (HRU 3);
  • forest and reforested areas on soils with medium storage capacity (HRU 4);
  • pasture, grassland and bare soil on soils with high storage capacity (HRU 5);
  • open water surfaces (HRU 6).
The model was run using a daily time interval. The period from 1970 to 1980 was used to calibrate the model, and the period from 1981 to 2001 was used for model validation [58]. Nash-Sutcliffe coefficients of model fit were greater than 0.7 in all sub-basins in both stream flow calibration and validation periods, whilst errors in volume were less than 0.5% at calibration and 7% at validation [59]. The calibration and validation procedures and results are fully presented in Collischonn et al. [58] and Tucci et al. [59].

2.3. Site Description
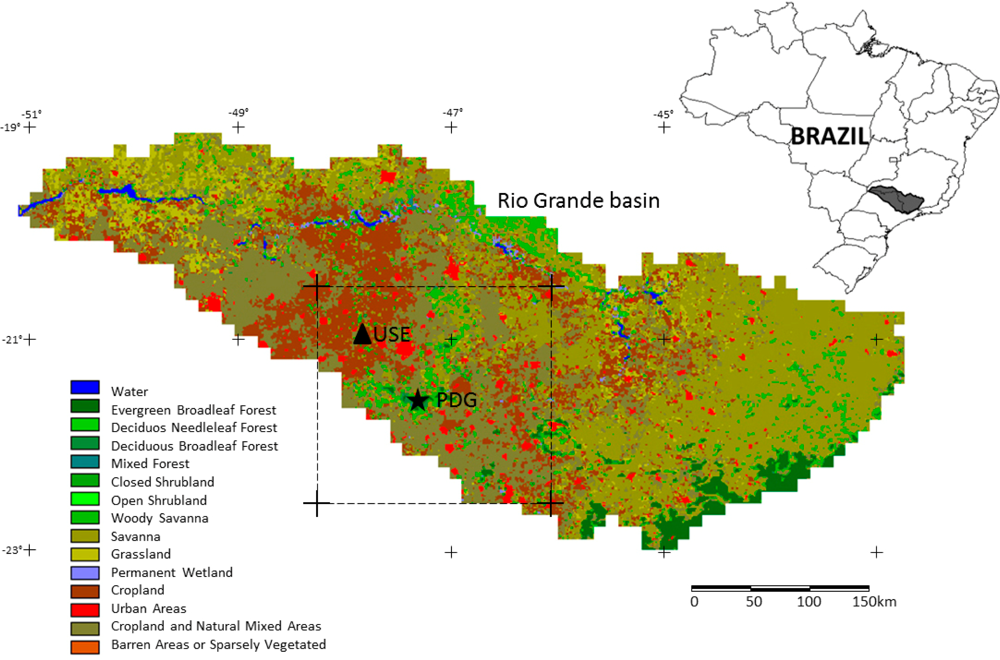
The flux sites were set up in 2000 installed at a savanna ecosystem (PDG site) and a sugarcane cropland (USE site). Turbulent fluxes (H and LE) were measured at heights of 7 m (USE) and 21 m (PDG). For the 7 m height at USE, the maximum contributing area has a footprint of between 40 and 60 m, whilst for the 21 m height at PDG, it was between 120 and 170 m [5860]. The accumulated flux for neutral conditions shows that more than 80% of measured flux at PDG site originates within 500 m, while at USE site originates within 1,500 m [58]. Turbulent flux measurements of H and LE at the USE site had calibration problems between August and December 2001 while some of the equipment o the tower installed at the PDG site had missing calibrations during January and September 2001 [58]. Ancillary meteorological data measurements needed for the analysis included Rn and G. Detailed descriptions of the equipment used, measurement procedures and results at both PDG and USE sites can be found in Juárez [60], Cabral et al. [61] and Rocha et al. [62].

2.4. Study Area

The study area lies between the Brazilian States of São Paulo and Minas Gerais. The Rio Grande basin is located between latitudes 19°15´S and 23°00′S and longitudes 43°30′W and 51°00´W. Most of the basin is covered by a savanna vegetation, locally called Cerrado. This natural vegetation was extensively replaced during the last centuries by intensive production of sugarcane, soya and by pastures. Savanna ET has a strong seasonality, varying between 6 mm·day−1 in the wet season to 1 mm·day−1in the dry season. In agricultural areas, ET varies according to the type of the cropland and its cultivation cycle, with significant variations due to vegetation structure that may range from bare soil to fully developed canopy cover.
The MGB-IPH was applied to the Rio Grande basin (145,000 km2) while SEBAL was applied over an area of 2° × 2° (45,000 km2) selected to cover the flux tower sites. The overlay between MGB-IPH and SEBAL is about 38,100 km2 (Figure 1).

2.5. Data Analysis

Measured data (provided at half-hour) were averaged to 1-hour and to daily periods to compare with model-predicted data. We did not gap-fill with a model and we excluded any given daily average if fewer than 75% of data time steps were available. The performance of the models were evaluated based on values of root mean square error (RMSE), mean absolute error (MAE) and coefficient of determination (r2) for model-predicted versus measured data. The RMSE is the overall error in the predictions relative to the actual measured value while MAE measures the average magnitude of the errors in a set of predictions, without considering their direction. The r2 assesses how well the model reflects the variations in the data.

3. Results and Discussions

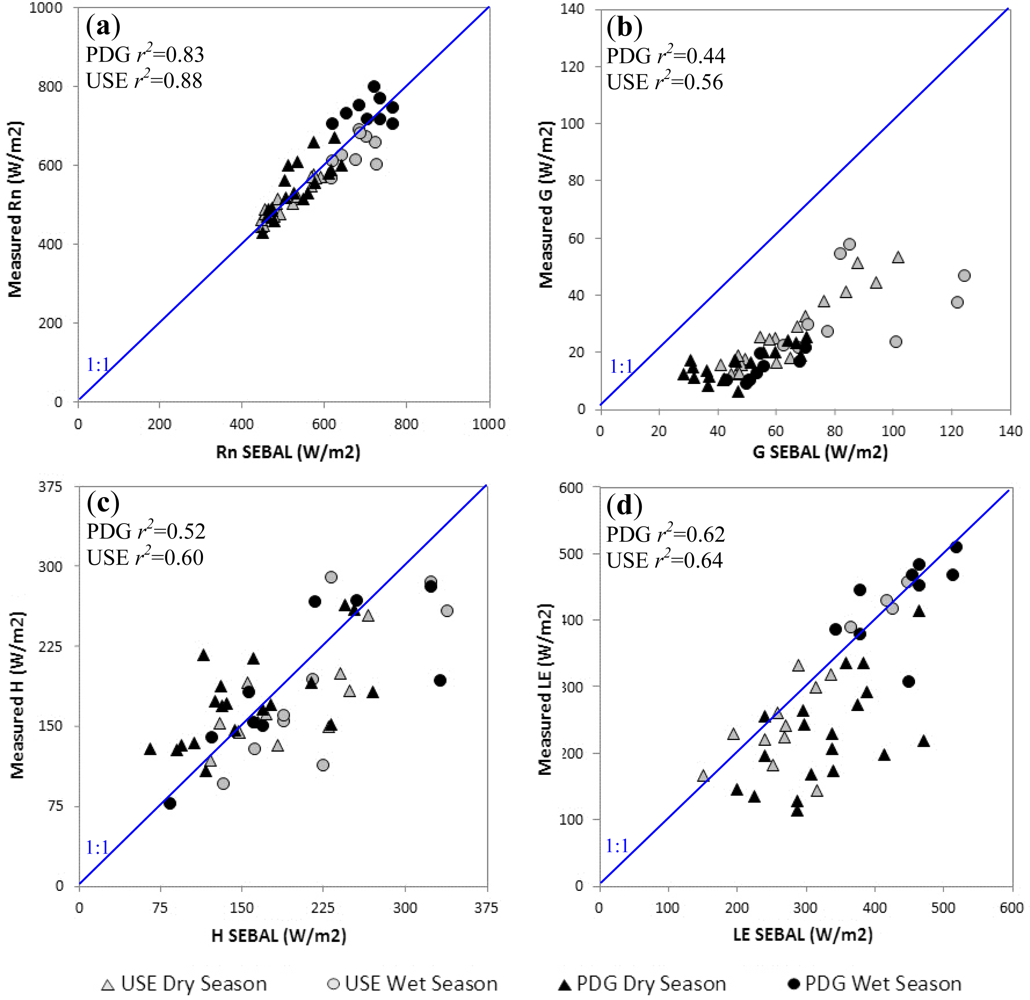
3.1. Validation of SEBAL’s Instantaneous Energy Fluxes

SEBAL estimations were spatially averaged over a 3 × 3 1-km pixels window centred on each flux tower to achieve spatial representativeness of the measured data for each site. Instantaneous values of Rn derived from SEBAL near mid-day (Terra MODIS has a ∼11:30 am local over-passing time) significantly explained over 80% of the variation of measured values at the USE (r2 = 0.88, p < 0.05) and at the PDG sites (r2 = 0.83, p < 0.05) (Figure 2(a)). There was a very marked seasonality, associated with the variation in solar radiation at the earth’s surface. RMSE was 37 W·m−2 at USE and 47 W·m−2 at PDG. Largest errors in the estimation of Rn occurred during the wet season, when days may have been partially cloudy or when clouds were present but not detected in MOD11A1. Instantaneous values of G at USE varied between 12 and 58 W·m−2 in dry and wet seasons, respectively, and at PDG between 8 and 24 W·m−2. Estimated values were moderately correlated with observed data (Figure 2(b)), varying between 40 and 120 W·m−2 at USE, and between 29 and 70 W·m−2 at PDG, in dry and wet seasons respectively. In absolute values, G was overestimated on average by 35 and 41 W·m−2. Estimates of H showed greater uncertainties relative to observed data. The mean instantaneous flux of H estimated by SEBAL at USE site was 217 ± 68 W·m−2, whilst the mean value given by the EC system was 175 ± 55 W·m−2. At the PDG site, the estimated mean was 170 ± 71 W·m−2, compared with the observed EC mean of 179 ± 51 W·m−2. The RMSE was 36 and 38 W m−2 at USE and PDG sites, respectively. We found a r2 of 0.60 (p < 0.05) and 0.52 (p < 0.05) at USE and PDG sites when comparing modelled H values with the in situ EC measurements (Figure 2(c)). Discrepancies in estimates of H can be explained by the combination of a series of factors related to simplifications and uncertainties introduced in algorithms to predict ET [17,63]. However these discrepancies are similar to results found by other studies [17,6368] when validating different models for turbulent flux estimation under different conditions of land use and land cover. Although LE fluxes estimated using SEBAL showed the correct seasonal pattern, an overestimation was found. At the USE site the mean overestimation was 23 W·m−2 with r2 = 0.64 (p < 0.05), whilst at PDG overestimation was approximately 70 W·m−2 with r2 = 0.62 (p < 0.05), when comparing modelled LE values with the in situ EC measurements (Figure 2(d)). The mean estimated LE at USE was 271 ± 100 W·m−2, whilst for the EC system the mean was 287 ± 87 W·m−2, with RMSE 34 W·m−2. At PDG, mean LE was estimated as 386 ± 93 W·m−2 compared with a mean of 285 ± 122 W·m−2 from the in situ EC data, with RMSE of 81 W·m−2.
The energy balance closure, given by comparing the turbulent fluxes (H+LE) estimated by SEBAL with the observed available energy (Rn–G), shows an underestimation of about 7% in turbulent flux at the USE site and 9% at PDG, with r2 = 0.88 (p < 0.05) and r2 = 0.85 (p < 0.05) respectively (Figure 3(a)). Since the measurements and estimates of Rn, G, H and LE are found by different methods, the energy balance closure shows whether or not there is agreement between these values. The mean value of H+LE estimated by SEBAL for the USE site was 488 ± 78 W·m−2 whilst the mean of measured Rn–G was 516 ± 68 W·m−2. At PDG, the mean H+LE given by SEBAL was 536 ± 89 W·m−2 compared with a mean of measured Rn–G, 589 ± 109 W·m−2. From an analysis of energy balance closure, Juarez [60] found underestimations of 24% and 23% in observed turbulent fluxes at the sites USE and PDG respectively, suggesting that there may be limitations inherent in the EC measurement system. It is not always possible to reach a satisfactory result because of measurement errors, particularly in the EC technique, which normally underestimates turbulent fluxes because of the difference between the levels at which Rn sensors are mounted (some meters above the surface) compared with sensors for G (some centimeters below the surface), and because of surface heterogeneity [6971].

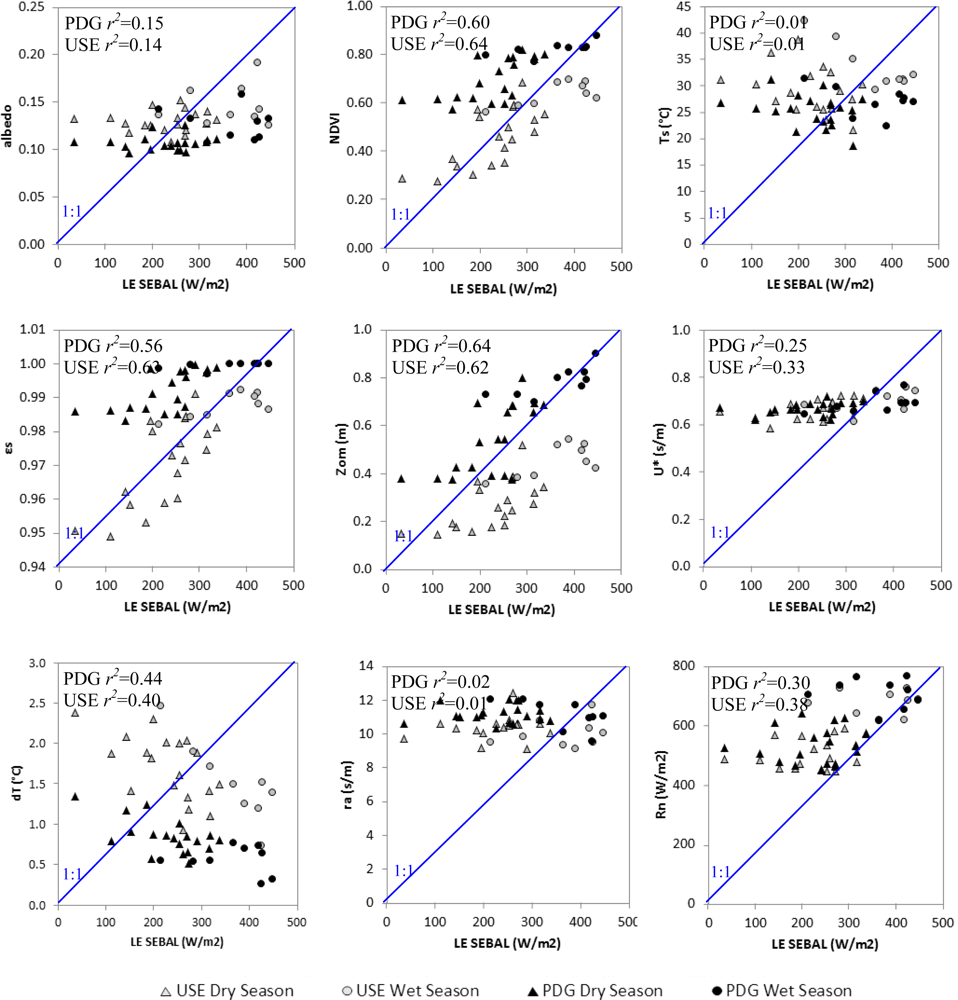
3.2. Control of SEBAL’s Instantaneous Latent Heat Flux

To understand what drives estimations of ET using SEBAL algorithm, coefficients of determination (r2) were calculated between instantaneous LE (on MODIS overpass) and the main inputs to the model (albedo, land surface temperature (Ts) and NDVI) and intermediate variables (surface emissivity (εs), roughness length (Zom), gradient of temperature (dT), wind friction velocity (u*), aerodynamic resistance (ra) and net radiation (Rn)). Figure 4 shows: (1) the importance of NDVI for estimating LE (disregarding εs and Zom since these are estimated as functions of NDVI, which explains the high correlation between these variables and LE), (2) the importance of precision in the choice of “anchor” pixels to determine dT and (3) the influence of Rn in controlling LE.
The NDVI uses spectral information at near infrared (NIR) wavelengths (between 0.7 and 1.0 μm) to measure terrestrial photosynthetic activity and structural variations in the canopy [72]. Variations in LE are quantitatively associated with spatial and temporal changes in the vegetation canopy, since under normal conditions of water and nutrient availability there is a strong negative correlation between Ts and NDVI. Although NDVI and LE are highly correlated, two factors are limiting: (i) the saturation of MODIS NDVI in areas where vegetation is quite dense [73]; and (ii) the low correlation between NDVI and water stress. NDVI commonly shows an asymptotic saturation in areas with high biomass indices [74]. These saturation effects can mask changes in vegetation dynamics and biophysical processes. In addition, the ability of NDVI to convey information about vegetation water content is limited, since the index utilizes wavelength related to internal leaf structure and to photosynthetic processes, and does not give a measure directly related to the quantity of water in the leaf and to vegetation water stress [75]. The quantity of water available in a leaf’s internal structure largely controls infrared short-wave (SWIR) wavelengths (between 1.2 and 2.6 μm) [76]. This limitation of NDVI in relation to water stress could be partly overcome by using vegetation indices that are more sensitive to canopy water availability and leaf water content or by incorporating the relation between soil moisture and surface resistance. One alternative is to use the normalized difference water index (NDWI) [77]. The combination of NIR with SWIR removes variations introduced by internal leaf structure and quantities of dry material, improving accuracy in monitoring water stress and giving a measure that is more indicative of water availability than NDVI [7880]. Predicting turbulent fluxes of H constitutes the main step in SEBAL’s partition of energy, incorporating many of the uncertainties generated by the algorithm. The subjective choice of hot and cold pixels determines the accuracy of H and consequently LE, as shown by the high correlation between dT and LE. It is difficult to avoid this subjectivity in the selection of reference pixels. Allen et al. [1,81] suggest that the choice of warm pixels should be determined not from Ts alone, but also with reference to its relationships with other parameters, particularly vegetation indices like NDVI or LAI.

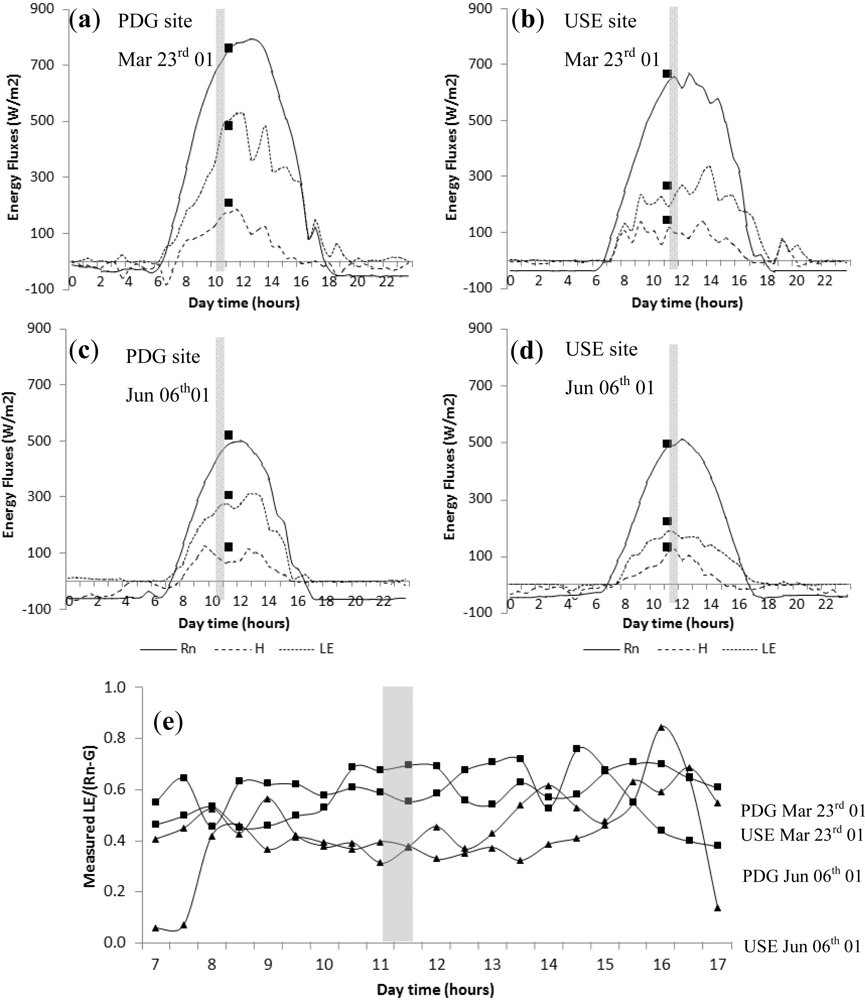
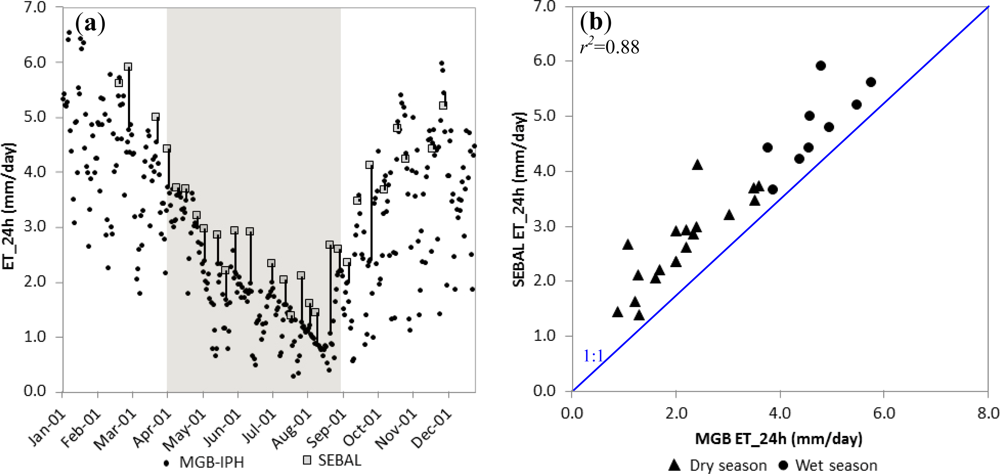
3.3. Scaling SEBAL’s Instantaneous Latent Heat Flux to Daily Evapotranspiration

Estimation of daily ET requires the integration of instantaneous fluxes Rn, G and LE predicted by SEBAL using EF and Rn,24h. As a starting point, the accuracy of estimated EF was assessed relative to the measured data. Next, the validation of the EF as a constant indicator of energy partitioning throughout the day (taken as the period between 7:00 h and 18:00 h) was examined. When the estimated instantaneous EF was compared with observed values, an overestimation by 12% and 18% was found at USE and PDG sites, respectively, most probably as a consequence of underestimation of turbulent fluxes measured by the EC system and in SEBAL’s energy balance closure, causing significant reduction in EF (Figure 3(b)). Figure 5 shows estimates of instantaneous energy fluxes found using SEBAL and the daily energy cycle observed at EC monitoring sites for two days during wet and dry seasons, together with diurnal variability in EF at those sites.
When instantaneous data were converted to daily ET, the estimated seasonal variation in Rn,24h (Figure 6(a)) and ET24h (Figure 6(b)) agreed, respectively, with in situ measurements. Estimated values of Rn,24h significantly explained over 85% of the variation of measured data ate USE site (r2 = 0.85, p < 0.05) and at the PDG site (r2 = 0.86, p < 0.05). Rn,24h was overestimated by about 23 W·m−2 and 26 W·m−2 at USE and PDG sites, since this method (based on Equation (6)) does not correct for the radiation losses observed throughout the day as a function of cloud cover and atmospheric aerosols. Furthermore, this sinoidal model reduces Rn to zero during the night-time when effectively Rn becomes negative. As Rn goes to zero, we are assuming that ET goes to zero as well. According to Fisher et al. [82] without large wet surfaces, night-time ET is minimal because both photosynthesis and transpiration approaches zero as radiation diminishes. Using this simple scheme to predict daily Rn we are trying to overcome the need for ground information as model input.
With regard to ET24h derived from SEBAL, estimated values significantly explained between 66% and 76% of the variation of measured data at the USE site (r2 = 0.76, p < 0.05) and at the PDG site (r2 = 0.66, p < 005), respectively. At USE site, estimated ET24h varied between 5.9 mm·day−1 in the wet season and 1.2 mm·day−1 in the dry season, whilst observed values varied from 5.0 mm·day−1 to 1.5 mm·day−1 in the wet and dry seasons. At PDG site, estimated ET varied from 6.6 mm·day−1 in the wet season to 2.3 mm·day−1 in the dry season, with observed values varying from 6.5 mm·day−1 to 1.2 mm·day−1 in wet and dry seasons. Estimated and observed values had similar standard deviations, but ET was overestimated by 0.8 mm·day−1 at USE, and by 1.15 mm·day−1 at PDG, on average, reflecting the overestimation of EF and Rn,24h.

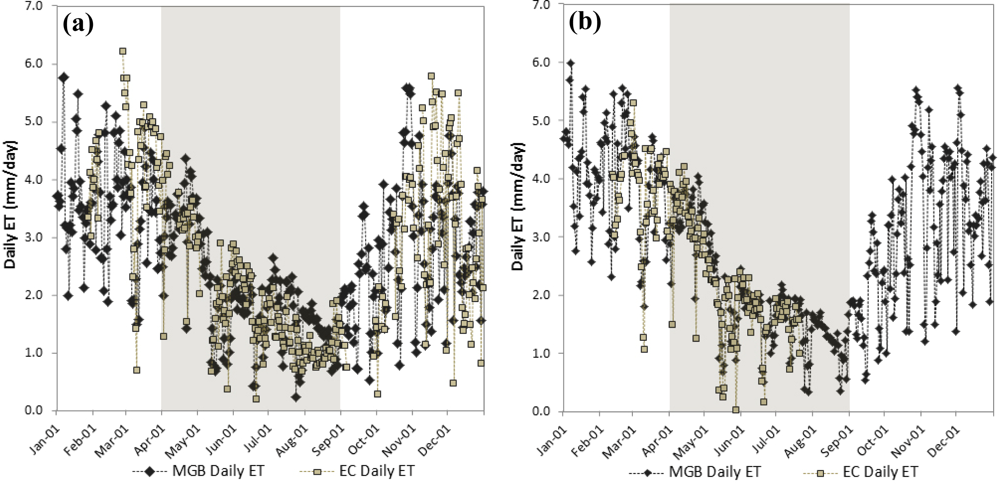
3.4. Estimation of Daily Evapotranspiration by Hydrological Modelling

After calibration and validation the MGB-IPH hydrological model, daily ET estimations were compared with ET measured by EC at the USE and PDG sites. PDG site was compared with HRU 4 (forest and reforested areas on soils with medium storage capacity) and the USE site with HRU 2 (cropland areas with soils of high storage capacity), lying in the same area as the flux towers. At the PDG site the average ET estimated by the MGB-IPH model was 2.5 ± 1.4 mm·day−1, whilst the measured ET was 2.6 ± 1.2 mm·day−1, with RMSE equal to 0.72 mm·day−1 (Figure 7(a)). Average ET estimated by the MGB-IPH model at the USE site was 2.7 ± 1.1 mm·day−1, while the EC-measured ET at the same site was 2.6 ± 1.1 mm·day−1, with RMSE 0.51 mm·day−1 (Figure 7(b)). Compared to measured data, estimated ET24h significantly explained over 64% of the variation of measured data at the PDG site (r2 = 0.64, p < 0.05) and at the USE site (r2 = 0.67, p < 0.05). We also found that the MGB-IPH model overestimated ET at the USE site by about 0.06 mm·day−1, and underestimated it by about 0.13 mm·day−1 at the PDG site.

3.5. Evapotranspiration at Basin Scale

A crucial point in spatial modelling of the energy balance is the capacity of thermal images to distinguish patterns of land use and land cover, since Ts is one of the most important parameters for estimating ET, followed by soil moisture and the fraction of vegetation in each pixel [83]. The great advantage in using MODIS data for estimating ET is the high accuracy of surface temperature images [84,85] associated with the spatial variability of this process at the regional scale. Two analyses were made to validate ET at the basin scale: (i) average ET24h estimated by SEBAL was compared with ET24h estimated by MGB-IPH, in the overlay area for which the two models were applied (an area of about 38,100 km2), and (ii) average ET24h estimated by the two models were compared for different land use and land cover types, taking the hydrological response units (HRU) in the MGB-IPH as the analytical classes.
Modelled mean ET24h for the area of 38,100 km2 explain over 88% of the variation observed in the MGB-IPH model (r2 = 0.88, p < 0.05) (Figure 8) with a RMSE of 0.48 mm day−1. The SEBAL overestimated ET24h by about 0.45 mm·day−1 when compared with the model MGB-IPH, a difference of 14%. In the wet season the overestimation was about 0.16 mm·day−1; while during the dry season the overestimation was about 0.60 mm·day−1. In the wet season the mean ET24h from the MGB-IPH model was 4.6 ± 0.6 mm day−1 in comparison to an average of 4.8 ± 0.6 mm day−1 from the SEBAL model. In the dry season the mean ET24h from the MGB-IPH model was 2.1 ± 0.8 mm·day−1 in comparison to an average of 2.6 ± 0.8 mm·day−1 from the SEBAL model. In both seasons, estimations of ET24h from SEBAL were higher than those given by MGB-IPH, although the difference was greatest in the dry season, related to SEBAL overestimations of instantaneous LE, EF and Rn24h.
Land use and land cover in the Rio Grande basin is a complex mosaic of agricultural and natural areas. Of the six HRU’s used in MGB-IPH, the following four can be found in the overlay area: (1) pasture, fields and agricultural areas in areas of medium infiltration capacity, covering 22% of the area; (2) agricultural areas in soils with high infiltration capacity, covering 36% of the area; (4) forest and reforested areas on soils with medium infiltration capacity, 16% of area; (5) pasture, fields and bare soil where soil has high infiltration capacity, 25% of area. Although SEBAL overestimated ET24h relative to MGB-IPH, correlations between the two models in the four HRU’s were moderate to high, significantly explaining from 46% to 86% of the variation of measured values. Correlation was higher for agricultural areas, fields and pastures on soils with medium and high infiltration capacity; in forested areas, it was lower than for other units (Table 1).
Differences between correlations may be mainly the consequence of the complex system of land use and land cover and of the different input data and parameterizations used by the two models. In the MGB-IPH, the estimate of ET is based mainly on meteorological data obtained from field stations. Surface parameters are adjusted to agree with existing land use and land cover maps. Thus the variation in time and space of vegetation parameters such as albedo, LAI and rs is determined by average values given in the literature, which probably do not accurately describe the best spatial variation in vegetation. For example, HRU 2, covering an area of about 13,600 km2 and characterized by different agricultural cultivation, uses the same surface parameters for all of them. By contrast, the more important input variables to SEBAL, such as NDVI, albedo and Ts more faithfully describe temporal and spatial vegetation processes, giving less attention to micrometeorological information which is difficult to obtain at a regional scale.

4. Concluding Remarks

Because of the large quantities of surface information obtained by MODIS sensor and its available products, estimates of energy fluxes of the Rio Grande basin given by SEBAL algorithm can be regarded as consistent. Instantaneous estimates of Rn, H and LE were significantly related to measured values, yielded a r2 varying from 0.52 to 0.88. We found, however, that the equation for determining G overestimated results, with a RMSE ranging from 35 and 41 W m−2, since this equation was specifically calibrated for semi-arid areas and may not accurately represent the local conditions of our study region. Discrepancies between predicted and measured H and LE may be associated with the low spatial resolution of MODIS products and high heterogeneity in land use and land cover within the same pixel. Results given by energy balance closure showed a r2 of 0.88, suggesting a good agreement between available energy and turbulent fluxes, although the partition of this energy into H and LE does not yet show the same consistency of results as the energy balance suggests. We also found that inputs to which SEBAL is most sensitive are vegetation index (NDVI), gradient of temperature (dT) and net radiation (Rn).
Estimates of ET24h based on SEBAL algorithm were overestimated by 0.80 mm·day−1 at sugarcane croplands and 1.15 mm·day−1at savannas when compared to recorded data by the EC system, probably in consequence of factors such as:
  • The omission of a soil moisture constraint for a region of known water limitations.
  • The description of vegetation water stress by NDVI, which is limited by the asymptotic saturation level in areas where biomass index is high and information about vegetation water content is difficult to obtain.
  • The subjective determination of the gradient of temperature (dT) to estimate sensible heat fluxes (H).
  • Limitations from the compensatory or cumulative errors entered through the residual energy balance, partitioning turbulent fluxes and estimating EF and Rn,24h.
  • The omission of night net radiation (Rn) when it becomes effectively negative or even assuming that average daily soil heat flux (G) is zero can lead to overestimations.
Regarding to the hydrological model MGB-IPH, when compared with measured data yielded a r2 of 0.64 at savannas and 0.67 at sugarcane croplands. Both models, SEBAL and MGB-IPH, provided similar results for average estimated ET over an area of 38,100 km2 with a r2 of 0.88. However it was found that SEBAL overestimated ET by 14% relative to MGB-IPH.
Comparing SEBAL and MGB-IPH to estimate daily ET, both methods have different spatial and temporal capabilities. MGB-IPH hydrological model can be run with different time-steps and levels of data although the overall data requirements is high. SEBAL algorithm has the advantage that the data requirements are low and spatial resolutions is high. The disadvantage is that it only can be applied to clear-sky days. To estimate seasonal ET the necessity of analysing many images can be an expensive problem. Remote sensing data extraction under cloud cover still remains a challenging task considering surface energy balance models to predict ET.
To conclude, results obtained from SEBAL algorithm confirm the potential of modelling surface energy fluxes on clear-sky days. The technique is not restricted to irrigated areas (as originally developed) but can be applied to a broad range of biomes. Despite the overestimation of Rn,24h and ET24h, we argue that the strength of the SEBAL algorithm should be evaluated, not only by how closely the estimated results are from measured data, but by the ability to provide spatial information over large areas.

Acknowledgments

The authors are grateful for the valuable suggestions of Bernardo Barbosa da Silva, Otto Correa Rotunno Filho and Nilza Maria dos Reis Castro, as well as the comments of the anonymous reviewers. This work was supported by the Brazilian Ministry of Science and Technology through the National Council for Scientific and Technological Development (CNPq) (Grant No. 141136/2007-3).

References

  1. Allen, R.G.; Tasumi, M.; Trezza, R. Satellite-Based Energy Balance for Mapping Evapotranspiration with Internalized Calibration (METRIC)—Model. J. Irrig. Drain. Eng 2007, 133, 380–394. [Google Scholar]
  2. Norman, J.M.; Anderson, M.C.; Kustas, W.P.; French, A.N.; Mecikalski, J.; Torn, R.; Diak, G.R.; Schmugge, T.J.; Tanner, B.C.W. Remote sensing of surface energy fluxes at 101m pixel resolutions. Water Resour. Res 2003, 39, 1221–1229. [Google Scholar]
  3. Su, Z. The Surface Energy Balance System (SEBS) for estimation of turbulent heat fluxes. Hydrol. Earth Syst. Sci 2002, 6, 85–99. [Google Scholar]
  4. Roerink, G.J.; Su, Z.; Menenti, M. S-SEBI: A simple remote sensing algorithm to estimate the surface energy balance. Phys. Chem. Earth Pt B 2000, 25, 147–157. [Google Scholar]
  5. Bastiaanssen, W.G.M.; Menenti, M.; Feddes, R.A.; Holtslag, A.M. A remote sensing surface energy balance algorithm for land (SEBAL). 1. Formulation. J. Hydrol 1998, 212–213, 198–212. [Google Scholar]
  6. Bastiaanssen, W.G.M.; Pelgrum, H.; Wang, J.; Ma, Y.; Moreno, J.F.; Roerink, G.J.; Van der Tal, T. A remote sensing surface energy balance algorithm for land (SEBAL). 2. Validation. J. Hydrol 1998, 212–213, 213–229. [Google Scholar]
  7. Norman, J.M.; Kustas, W.; Humes, K. A two-source approach for estimating soil and vegetation energy fluxes from observations of directional radiometric surface temperature. Agr. For. Meteorol 1995, 77, 263–293. [Google Scholar]
  8. Kalma, J.D.; Jupp, D.L.B. Estimating evaporation from pasture using infrared thermometry: evaluation of a one-layer resistance model. Agr. For. Meteorol 1990, 51, 223–246. [Google Scholar]
  9. Zwart, S.J.; Bastiaanssen, W.G.M. SEBAL for detecting spatial variation of water productivity and scope for improvement in eight irrigated wheat systems. Agr. Water Manage 2007, 89, 287–296. [Google Scholar]
  10. Hemakumara, H.M.; Chandrapala, L.; Moene, A.F. Evapotranspiration fluxes over mixed vegetation areas measured from large aperture scintillometer. Agr. Water Manage 2003, 58, 109–122. [Google Scholar]
  11. Allen, R.G.; Tasumi, M.; Trezza, R.; Waters, R.; Bastiaanssen, WG.M. Surface Energy Balance Algorithm for Land (SEBAL)—Advanced Training and User’s Manual; University of Idaho: Kimberly, ID, USA, 2002; p. 98. [Google Scholar]
  12. Lagouarde, J.P.; Jacob, F.; Gu, X.F.; Olioso, A.; Bonnefond, J.M.; Kerr, Y.; Mcaneney, K.J.; Irvine, M. Spazialization of sensible heat flux over a heterogeneous landscape. Agronomie 2002, 22, 627–633. [Google Scholar]
  13. Bastiaanssen, W.G.M. SEBAL-based sensible and latent heat fluxes in the irrigated Gediz Basin, Turkey. J. Hydrol 2000, 229, 87–100. [Google Scholar]
  14. Kite, G.W.; Drogers, P. Comparing evapotranspiration estimates from satellites, hydrological models and field data. J. Hydrol 2000, 229, 3–18. [Google Scholar]
  15. Wang, J.; Ma, Y.; Menenti, M.; Bastiaanssen, W.G.M.; Mistsuta, Y. The scaling-up of processes in the heterogeneous landscape of HEIFE with the aid of satellite remote sensing. J. Meteor. Soc. Jpn 1995, 73, 1235–1244. [Google Scholar]
  16. French, A.N.; Jacob, F.; Anderson, M.C.; Kustas, W.P.; Timmermans, W.; Gieske, A.; Su, Z.; Su, H.; McCabe, M.F.; Li, F.; Prueger, J.; Brunsell, N. Surface energy fluxes with the advanced Spaceborne Thermal Emissions and Reflectation Radiometer (ASTER) at the Iowa 2002 SMACEX site (USA). Remote Sens. Environ 2005, 99, 55–65. [Google Scholar]
  17. Jacob, F.; Olioso, A.; Gu, X.; Su, Z.; Seguin, B. Mapping surface fluxes using airborne visible, near infrared, thermal infrared remote sensing and a spatialized surface energy balance model. Agronomie 2002, 22, 669–680. [Google Scholar]
  18. Vinukollu, R.K.; Wood, E.F.; Ferguson, C.R.; Fisher, J.B. Global estimates of evapotranspiration for climate studies using multi-sensor remote sensing data: Evaluation of three process-based approaches. Remote Sens. Environ 2011, 115, 801–823. [Google Scholar]
  19. Lauer, D.T.; Morain, S.A.; Salomonson, V.V. The Landsat Program: its origins, evolution, and impacts. Photogramm. Eng. Remote Sensing 1997, 63, 831–838. [Google Scholar]
  20. Carmel, Y. Controlling data uncertainty via aggregation in remotely sensed data. IEEE Geosci. Remote Sens. Lett 2004, 1, 39–41. [Google Scholar]
  21. Van Rompaey, A.J.J.; Govers, G.; Baudet, M. A strategy for controlling error of distributed environmental models by aggregation. Int. J. GIS 1999, 13, 577–590. [Google Scholar]
  22. Dai, X.L.; Khorram, S. The effects of image misregistration on the accuracy of remotely sensed change detection. IEEE Trans. Geosci. Remote Sens 1998, 36, 1566–1577. [Google Scholar]
  23. Carmel, Y.; Dean, J.; Flather, C.H. Combining location and classification error sources of estimating multi-temporal database accuracy. Photogramm. Eng. Remote Sensing 2001, 67, 865–872. [Google Scholar]
  24. Gupta, V.K.; Rodriguez-Iturbe, I.; Wood, E.F. Scale Problems in Hydrology; Reidel Publishing Company: Dordrecht, The Netherlands, 1986; p. 260. [Google Scholar]
  25. Mu, Q.; Zhao, M.; Running, S.W. Improvements to a MODIS Global Terrestrial Evapotranspiration Algorithm. Remote Sens. Environ 2011, 115, 1781–1800. [Google Scholar]
  26. Mallick, K.; Bhattacharya, B.K.; Rao, V.U.M.; Reddy, D.R.; Banerjee, S.; Hoshali, V.; Pandey, V.; Kar, G.; Mukherjee, J.; Vyas, S.P.; Gadgil, A.S.; Patel, N.K. Latent heat flux estimation in clear sky days over Indian agroecosystems using noontime satellite remote sensing data. Agr. For. Meteorol 2009, 149, 1646–1665. [Google Scholar]
  27. Venturini, V.; Islam, S.; Rodriguez, L. Estimation of evaporative fraction and evapotranspiration from MODIS products using a complementary based model. Remote Sens. Environ 2008, 112, 132–141. [Google Scholar]
  28. Cleugh, H.A.; Leuning, R.; Mu, Q.; Running, S.W. Regional evaporation estimates from flux tower and MODIS satellite data. Remote Sens. Environ 2007, 106, 285–304. [Google Scholar]
  29. Mu, Q.; Heinsch, F.A.; Zhao, M.; Running, S.W. Development of a global evapotranspiration algorithm based on MODIS and global meteorology data. Remote Sens. Environ 2007, 111, 519–536. [Google Scholar]
  30. Batra, N.; Islam, S.; Venturini, V.; Bisht, G.; Jiang, L. Estimation and comparison of evapotranspiration from MODIS and AVHRR sensors for clear sky days over the Southern Great Plains. Remote Sens. Environ 2006, 103, 1–15. [Google Scholar]
  31. Nishida, K.; Nemani, R.R.; Running, S.W.; Glassy, J.M. An operational remote sensing algorithm for land surface evaporation. J. Geophys. Res 2003, 108, 4270–4283. [Google Scholar]
  32. Nishida, K.; Nemani, R.R.; Running, S.W.; Glassy, J.M. Development of an evapotranspiration index from Aqua/MODIS for monitoring surface moisture status. IEEE Trans. Geosci. Remote Sens 2003, 41, 493–501. [Google Scholar]
  33. Collischonn, W.; Allasia, D.; Silva, B.C.; Tucci, C.E.M. The MGB-IPH model for large scale rainfall runoff modeling. Hydrol. Sci. J 2007, 52, 878–895. [Google Scholar]
  34. Tasumi, M.; Trezza, R.; Allen, R.G.; Wright, J.L. Operational aspects of satellite-based energy balance models for irrigated crops in the semi-arid US. J. Hydrol. Eng 2008, 19, 355–376. [Google Scholar]
  35. Van de Griend, A.A.; Owe, M. On the relationship between thermal emissivity and normalized difference vegetation index for natural surfaces. Int. J. Remote Sens 1993, 14, 1119–1131. [Google Scholar]
  36. Crago, R.D. Conservation and variability of the evaporative fraction during the daytime. J. Hydrol 1996, 180, 173–194. [Google Scholar]
  37. Bisht, G.; Venturini, V.; Islam, S.; Jiang, L. Estimation of the net radiation using MODIS (Moderate Resolution Imaging Spectroradiometer) data for clear sky days. Remote Sens. Environ 2005, 97, 52–67. [Google Scholar]
  38. Brutsaert, W. Hydrology: An Introduction; Cambridge University Press: London, UK, 2005; p. 618. [Google Scholar]
  39. Vermote, E.F.; Kotchenova, S.Y.; Ray, J.P. MODIS Surface Reflectance User’s Guide. 2010. Available online: http://modis-sr.ltdri.org/products/MOD09_UserGuide_v1_2.pdf (accessed on 23 November 2010).
  40. Wan, Z. MODIS Land Surface Temperature Products Users’ Guide. 2010. Available online: http://www.icess.ucsb.edu/modis/LstUsrGuide/MODIS_LST_products_Users_guide_C5.pdf (accessed on 23 November 2010).
  41. Solano, R.; Didan, K.; Jacobson, A.; Huete, A. MODIS Vegetation Indices (MOD13) C5 User’s Guide. 2010. Available online: http://tbrs.arizona.edu/project/MODIS/UsersGuide.pdf (accessed on 23 November 2010).
  42. Wan, Z.; Li, Z.L. Radiance - based validation of the V5 MODIS land - surface temperature product. Int. J. Remote Sens 2008, 29, 5373–5395. [Google Scholar]
  43. Huete, A.; Justice, C.O.; Van Leeuwen, W. MODIS Vegetation Index (MOD13): Algorithm Theoretical Basis Document. 2011. Available online: http://modis.gsfc.nasa.gov/data/atbd/atbd_mod13.pdf (accessed on 8 February 2011).
  44. Paz, A.R.; Collischonn, W. River reach length and slope estimates for large-scale hydrological models based on a relatively high-resolution digital elevation model. J. Hydrol 2007, 343, 127–139. [Google Scholar]
  45. Beven, K. How far can we go in distributed hydrological modelling? Hydrol. Earth Syst. Sci 2001, 5, 1–12. [Google Scholar]
  46. Kouwen, N.; Soulis, E.; Pietroniro, A.; Donald, J.; Harrington, R. Grouped response units for distributed hydrologic modeling. J. Water Res. Pl-ASCE 1993, 119, 289–305. [Google Scholar]
  47. Monteith, J.L. Evaporation and Environment. In The State and Movement of Water in Living Organism; Fogg, B.D., Ed.; Symposium of the Society of Experimental Biology XIX: Cambridge, UK, 1965; pp. 205–234. [Google Scholar]
  48. Wigmosta, M.S.; Vail, L.W.; Lettenmaier, D.P. A distributed hydrology-vegetation model for complex terrain. Water Resour. Res 1994, 30, 1665–1679. [Google Scholar]
  49. Shuttleworth, W.J. Evaporation. In Handbook of Hydrology; Maidment, D.R., Ed.; McGRaw Hill: New York, NY, USA, 1993; pp. 4.1–4.53. [Google Scholar]
  50. Nóbrega, M.T.; Collischonn, W.; Tucci, C.E.M.; Paz, A.R. Uncertainty in climate change impacts on water resources in the Rio Grande Basin, Brazil. Hydrol. Earth Syst. Sci 2011, 15, 585–595. [Google Scholar]
  51. Getirana, A.C.V.; Bonnet, M.P.; Rotunno-Filho, O.C.; Collischonn, W.; Guyot, J.L.; Seyler, F.; Mansur, W.J. Hydrological modelling and water balance of the Negro River basin: evaluation based on in situ and spatial altimetry data. Hydrol. Process 2010, 24, 3219–3236. [Google Scholar]
  52. Collischonn, W.; Silva, B.C.; Tucci, C.E.M.; Allasia, D.G. Large basin simulation experience in South America. IAHS Pub 2006, 303, 360–370. [Google Scholar]
  53. Collischonn, W.; Tucci, C.E.M.; Haas, R.; Andreolli, I. Forecasting river Uruguay flow using rainfall forecasts from a regional weather-prediction model. J. Hydrol 2005, 305, 87–98. [Google Scholar]
  54. Agência Nacional de Águas. HidroWeb—Sistema de Informações Hidrológicas. Available online: http://hidroweb.ana.gov.br/ (accessed on 23 November 2010).
  55. Coordenadoria de Recursos Hídricos do Estado de São Paulo. Sistema Integrado de Gerenciamento de Recursos Hídricos do Estado de São Paulo. Available online: http://www.sigrh.sp.gov.br/ (accessed on 23 November 2010).
  56. Centro de Previsão do Tempo e Estudos Climáticos. Plataformas de coleta de dados. Available online: http://satelite.cptec.inpe.br/PCD/ (accessed on 23 November 2010).
  57. Ministério das Minas e Energia. Projeto RADAM Brasil. Brasília, Brazil. Available online: http://www.projeto.radam.nom.br/ (accessed on 23 November 2010).
  58. Collischonn, W.; Tucci, C.E.M.; Clarke, R.T. Previsão de Afluência a Reservatórios Hidrelétricos: Módulo 1; Universidade Federal do Rio Grande do Sul: Porto Alegre, Brazil, 2007; p. 188. [Google Scholar]
  59. Tucci, C.E.M.; Collischonn, W.; Clarke, R.T.; Paz, A.R.; Allasia, D. Short and long-term flow forecasting in the Rio Grande watershed (Brazil). Atmos. Sci. Lett 2008, 9, 53–56. [Google Scholar]
  60. Juárez, R.I.N. Variabilidade climática regional e controle da vegetação no sudeste: Um estudo de observações sobre cerrado e cana-de-açúcar e modelagem numérica da atmosfera. PhD Thesis, Universidade de São Paulo, São Paulo, Brazil. 2004; 185. [Google Scholar]
  61. Cabral, O.M.R.; Rocha, H.R.; Ligo, M.A.; Brunini, O.; Dias, M.A.F.S. Fluxos turbulentos de calor sensível, vapor d’água e CO2 sobre plantação de cana-de-açúcar (saccharum sp) em Sertãozinho, SP. Rev. Bras. Meteorol 2003, 18, 61–70. [Google Scholar]
  62. Rocha, H.R.; Freitas, H.C.; Dias, M.A.F.S.; Ligo, M.A.; Cabral, O.M.R.; Tannus, R.N.; Rosolem, R. Measurements of CO2 exchange over a woodland savanna (Cerrado sensu stricto) in southeast Brasil. Biota Neotrop 2002, 2, 1–11. [Google Scholar]
  63. Ferguson, C.R.; Wood, E.F.; Sheffield, J.; Gao, H. Quantifying uncertainty in a remote sensing-based estimate of evapotranspiration over continental USA. Int. J. Remote Sens 2010, 31, 3821–3865. [Google Scholar]
  64. Anderson, M.; Norman, J.; Diak, G.; Kustas, W.P.; Mecikalski, J.R. A two-source time integrated model for estimating surface fluxes using thermal infrared remote sensing. Remote Sens. Environ 1997, 60, 195–216. [Google Scholar]
  65. Kustas, W.P.; Humes, K.; Norman, J.M.; Moran, M. Single and dual source modeling of surface energy fluxes with radiometric surface temperature. J. Appl. Meteorol 1996, 35, 110–121. [Google Scholar]
  66. Zhan, X.; Kustas, W.P.; Humes, K. An intercomparison study on models of sensible heat flux over partial canopy surfaces with remotely sensed surface temperature. Remote Sens. Environ 1996, 58, 242–256. [Google Scholar]
  67. Teixeira, A.H.C. Determining regional actual evapotranspiration of irrigated crops and natural vegetation in the São Francisco River Basin (Brazil) using remote sensing and Penman-Monteith Equation. Remote Sens 2010, 2, 1287–1319. [Google Scholar]
  68. Alexandridis, T.K.; Cherif, I.; Chemin, Y.; Silleos, G.N.; Stavrinos, E.; Zalidis, G.C. Integrated methodology for estimating water use in Mediterranean agricultural areas. Remote Sens 2009, 1, 445–465. [Google Scholar]
  69. Foken, T. The energy balance closure problem: An overview. Ecol. Appl 2008, 18, 1351–1367. [Google Scholar]
  70. Culf, A.D.; Foken, T.; Gash, J.H.C. The Energy Balance Closure Problem. In Vegetation, Water, Humans and the Climate: A New Perspective on an Interactive System; Kabat, P., Claussen, M., Dirmeyer, P.A., Gash, J.H.C., Bravo, D.E., Guenni, L., Meybeck, M., Pielke, R., Vörösmarty, C.J., Hutjes, R.W.A., Lütkemeier, S, Eds.; Springer: Berlim, Germany, 2004; pp. 159–166. [Google Scholar]
  71. Wilson, K.; Goldstein, A.; Falge, E.; Aubinet, M.; Baldocchi, D.D.; Berbigier, P.; Bernhofer, C.; Ceulemans, R.; Dolman, H.; Field, C.; et al. Energy balance closure at FLUXNET sites. Agr. For. Meteorol 2002, 113, 223–243. [Google Scholar]
  72. Huete, A.; Didan, K.; Miura, T.; Rodriguez, E.P.; Gao, X.; Ferreira, L.G. Overview of the radiometric and biophysical performance of the MODIS vegetation indices. Remote Sens. Environ 2002, 83, 195–213. [Google Scholar]
  73. Aragão, L.E.O.C.; Shimabukuro, Y.E.; Santo, F.B.E.; Williams, M. Spatial validation of collection 4 MODISLAI product in eastern amazon. IEEE Trans. Geosci. Remote Sens 2005, 43, 2526–2534. [Google Scholar]
  74. Sellers, P.J. Canopy reflectance, photosynthesis and transpiration. Int. J. Remote Sens 1985, 6, 1335–1372. [Google Scholar]
  75. Cecatto, P.; Gobron, N.; Flasse, S.; Pinty, B.; Tarantola, S. Designing a spectral index to estimate vegetation water content from remote sensing data: Part 1: Theoretical approach. Remote Sens. Environ 2002, 82, 188–197. [Google Scholar]
  76. Tucker, C.J. Remote sensing of leaf water content in the near infrared. Remote Sens. Environ 1980, 10, 23–32. [Google Scholar]
  77. Gao, B.C. NDWI—A normalized difference water index for remote sensing of vegetation liquid water from space. Remote Sens. Environ 1996, 58, 257–266. [Google Scholar]
  78. Gu, Y.; Brown, J.F.; Verdin, J.P.; Wardlow, B. A five-year analysis of MODIS NDVI and NDWI for grassland drought assessment over the central Great Plains of the United States. Geophys. Res. Lett 2007, 34, L06407. [Google Scholar]
  79. Delbart, N.; Kergoat, L.; Toan, T.L.; Lhermitte, J.; Picard, G. Determination of phenological dates in boreal regions using normalized difference water index. Remote Sens. Environ 2005, 97, 26–38. [Google Scholar]
  80. Jackson, J.T.; Chen, D.; Cosh, M.; Li, F.; Anderson, M.; Walthall, C.; Doriaswamy, P.; Hunt, E.R. Vegetation water content mapping using Landsat data derived normalized difference water index for corn and soybeans. Remote Sens. Environ 2004, 92, 475–482. [Google Scholar]
  81. Allen, R.G.; Tasumi, M.; Morse, A.; Trezza, R. A Landsat-based energy balance and evapotranspiration model in Western US water rights regulation and planning. Irrig. Drain. Syst 2005, 19, 251–268. [Google Scholar]
  82. Fisher, J.B.; Baldocchi, D.D.; Misson, L.; Dawson, T.E.; Goldstein, A.H. What the towers don’t see at night: nocturnal sap flow in trees and shrubs at two AmeriFlux sites in California. Tree Physiol 2007, 27, 597–610. [Google Scholar]
  83. McCabe, M.F.; Wood, E.F. Scale influences on the remote estimation of evapotranspiration using multiple satellite sensors. Remote Sens. Environ 2006, 105, 271–285. [Google Scholar]
  84. Wan, Z.; Zhang, Y.; Zhang, Q.; Li, Z.L. Quality assessment and validation of the MODIS global land surface temperature. Int. J. Remote Sens 2004, 25, 261–274. [Google Scholar]
  85. Wan, Z.; Zhang, Y.; Zhang, Q.; Li, Z.L. Validation of the land-surface temperature products retrieved from Terra Moderate Resolution Imaging Spectroradiometer data. Remote Sens. Environ 2002, 83, 163–180. [Google Scholar]
Figure 1. Spatial location of the flux tower sites used in this study. The base map is the MODIS land-cover classification during 2001. Dotted area represents a ∼2° ×∼2° square selected to cover the flux tower sites and to apply SEBAL. The overlay between MGB-IPH (basin) and SEBAL (dotted square) in the Rio Grande basin is about 38,100 km2.
Remotesensing 04 00703f1
Figure 2. Comparison between instantaneous on-overpass (11:30am LT) energy fluxes estimated using SEBAL and in situ measured data over savannas (PDG site) and sugarcane croplands (USE site). Labels: Net radiation (a), soil heat flux (b), sensible heat flux (c) and latent heat flux (d).
Remotesensing 04 00703f2
Figure 3. Analysis of the instantaneous on-overpass (11:30am LT) energy balance closure (a) and evaporative fraction for blue-sky days (b) in areas of savannas (PDG site) and sugarcane croplands (USE site).
Remotesensing 04 00703f3
Figure 4. Correlation between inputs and intermediate variables of the SEBAL algorithm and estimated instantaneous latent heat fluxes in areas of savannas (PDG site) and sugarcane croplands (USE site) during dry and wet seasons.
Remotesensing 04 00703f4
Figure 5. In situ measured energy fluxes (continuous and dotted lines) on 23 March 2001 (end of wet season) at PDG site (a) and USE site (b); and on 6 June 2001 (beginning of dry season) at PDG site (c) and USE site (d). Squares show instantaneous on-overpass (11:30am LT) energy fluxes estimated using SEBAL algorithm. Day-time variability of the evaporative fraction calculated from in situ measured data on those days (e). Shaded bars represent MODIS local overpass (11:30am LT).
Remotesensing 04 00703f5
Figure 6. Comparison between daily net radiation (a) and daily evapotranspiration (b) estimations and in situ measured data in areas of savannas (PDG site) and sugarcane croplands (USE site).
Remotesensing 04 00703f6
Figure 7. Daily evapotranspiration estimated from the MGB-IPH hydrological model compared with in situ eddy covariance measured data at the PDG site (a) and USE site (b). The climatological dry season is shaded.
Remotesensing 04 00703f7
Figure 8. Seasonal variation (a) and correlation (b) between daily evapotranspiration estimated using SEBAL algorithm and hydrological model MGB-IPH for an overlay of 38,100 km2. Bars in (a) are the differences between estimates given by the two models. The climatological dry season is shaded.
Remotesensing 04 00703f8
Table 1. Comparisons between daily evapotranspiration estimated by SEBAL and MGB-IPH. Labels: HRU 1 (pasture, grassland and cropland areas with soils of medium storage capacity); HRU 2 (cropland areas with soils of high storage capacity); HRU 4 (forest and reforested areas on soils with medium storage capacity); HRU 5 (pasture, grassland and bare soil on soils with high storage capacity).
HRU 1HRU 2HRU 4HRU 5
Area (Km2)8,51013,6866,0859,364
r20.86 (p < 0.05)0.65 (p < 0.05)0.46 (p < 0.05)0.79 (p < 0.05)
MAE (mm day−1)1.20.40.90.7
RMSE (mm·day−1)1.20.71.10.9
Avg±StDev (mm day−1)MGB-IPH2.4 ± 1.72.6 ± 1.32.8 ± 1.22.5 ± 1.5
SEBAL3.7 ± 1.23.1 ± 1.23.7 ± 1.23.3 ± 1.2

