Article

Analysis of the Phenology in the Mongolian Plateau by Inter-Comparison of Global Vegetation Datasets

1
State Key Laboratory of Earth Surface Processes and Resource Ecology, College of Global Change and Earth System Science, Beijing Normal University, 19 Xinjiekouwai Street, Beijing 100875, China
2
Laboratory for Earth Surface Processes of the Ministry of Education, College of Urban and Environmental Sciences, Peking University, Beijing 100875, China
3
Center for Monsoon System Research and Institute of Atmospheric Physics, Chinese Academy of Science, Beijing 100029, China
*
Author to whom correspondence should be addressed.
These authors contributed equally to this work.
Remote Sens. 2013, 5(10), 5193-5208; https://0-doi-org.brum.beds.ac.uk/10.3390/rs5105193
Submission received: 26 August 2013 / Revised: 8 October 2013 / Accepted: 14 October 2013 / Published: 18 October 2013

Abstract

:
This study evaluates the performances of three global satellite datasets (Advanced Very High Resolution Radiometer (AVHRR), Moderate Resolution Imaging Spectroradiometer (MODIS) and Satellite pour l’ observation de la Terre (SPOT) of the Mongolian Plateau, where in situ observation is insufficient to assess vegetation dynamics on terrestrial systems. We give a comprehensive assessment of the historical changes in vegetation dynamics by using comparative and correlation methods on the three archives using two indices: the growing season’s Normalized Difference Vegetation Index (NDVI) and the Start of the Season Index (SOS). The main findings are: (1) MODIS and SPOT have generally better comparability and consistency in the spatial-temporal trends of NDVI and SOS than AVHRR in this area; (2) all the three archives exhibit better consistency in Inner Mongolia than in Mongolia; (3) integration data analysis of AVHRR (1982–1997) and SPOT (1998–2012) shows that the dynamics of vegetation growth has three distinct phases: enhanced before 1994; a flatter/slightly decreasing trend before 2001; and, then, a rapid recovery between 2001 and 2012 with remarkable spatial heterogeneity, with Inner Mongolia experiencing a significant greening in vegetation NDVI compared with no obvious changes in Mongolia; (4) the temporal average SOS showed no significant “earlier spring” onset during the past 31 years, on the middle and northern Mongolian Plateau.

1. Introduction

Vegetation is the Earth’s natural link between soil, atmosphere and moisture. Since vegetation plays an important role in the interaction between the biosphere and the atmosphere [1], accurate measurements of regional to global scale vegetation dynamics are required to improve models and further the understanding of inter-annual variability in terrestrial ecosystem carbon exchange and climate-biosphere interactions [2]. In particular, there is an urgent need to reduce the uncertainties in remotely-sensed detection of phenological shifts of high latitude ecosystems in response to climate changes in the past few decades [3].
Remote sensing data have significantly improved our understanding of intra- and inter-annual variations in vegetation from a regional to global scale in the past three decades. Three of the major global data archives that are widely used for vegetation monitoring are the Advanced Very High Resolution Radiometer (AVHRR) [47], Moderate Resolution Imaging Spectroradiometer (MODIS) [6,8,9] and Satellite pour l’ observation de la Terre (SPOT) [1012] and their combined time series [1315]. Among the various remote sensing-based vegetation measures, the Normalized Difference Vegetation Index (NDVI) is the most widely used proxy for vegetation cover and production, as it can represent all the components of vegetation dynamics. Phenology, the study of the timing of recurring biological cycles and their connection to climate, is a sensitive and critical measure of vegetation, and it is an independent yardstick of how ecosystems respond to climate change [1618]. Thus, monitoring the vegetation phenology at regional and global scales could help quantify the effects of climate change on terrestrial ecosystems. At an aggregated level, satellite-derived vegetation index time series can approximate some key phenological stages, such as the start of the growing season (SOS). SOS reflects the timing of recurring lifecycle events and is a reliable indicator of the response to natural or anthropogenic disturbances in ecosystems [13,19,20].
As the second largest plateau in Asia, the Inner Mongolia and Mongolia (shorted as MP), main parts of Mongolian Plateau, is characterized by a typical continental climate of rare precipitation and frequent drought, with windy episodes during the winter and spring [19,21,22]. The neighboring Inner Mongolia Province and Mongolia are dominated by similar types of ecosystems, varying from forest to desert; however, they are governed by different social and political systems and faced with related environmental issues [23]. Therefore, the two regions present an opportunity for studies aimed at distinguishing climate change impacts from human activities, especially policies, on vegetation coverage change. Remote sensing data archives have been already used for various aspects of vegetation coverage research in the MP, especially in Inner Mongolia Province, such as vegetation dynamics [19], estimating terrestrial net primary production [24], phenology patterns [25], degradation of grassland [26] and relationships between NDVI (Normalized Difference Vegetation Index) and climatic factors [27]. However, less effort has focused on validating the agreement of the three datasets and building a longer and reliable time series for the MP or the discrepancies between the three datasets for Inner Mongolia Province and Mongolia [14,15,28]. Additionally, comparisons that rely largely on the consistency of the seasonal, sinusoidal-like NDVI patterns are not sensitive enough to assess their consistency for long-term trends. Thus, it is crucial to know whether trends derived from different NDVI archives are comparable with each other and how they can be applied to study the interactions of climate change and the vegetation activities.
Our primary objective in this paper is to evaluate the coherence of the three satellite-derived remote sensing datasets on the trends and variability of average growing season NDVI and SOS: AVHRR (1982–2006), MODIS (1998–2012) and SPOT (1998–2012). The overlapping periods between AVHRR with SPOT (1998–2006) and SPOT with MODIS (2000–2012) make the comparison viable, with SPOT playing the role of a benchmark. Temporal, spatial and pixel correlation analysis comparisons are also conducted in their corresponding periods. We assess their performance on both Inner Mongolia Province and Mongolia. Finally, we analyze trends on NDVI and SOS for both regions based on the combination of AVHRR and SPOT from 1982 to 2012.

2. Materials and Methods
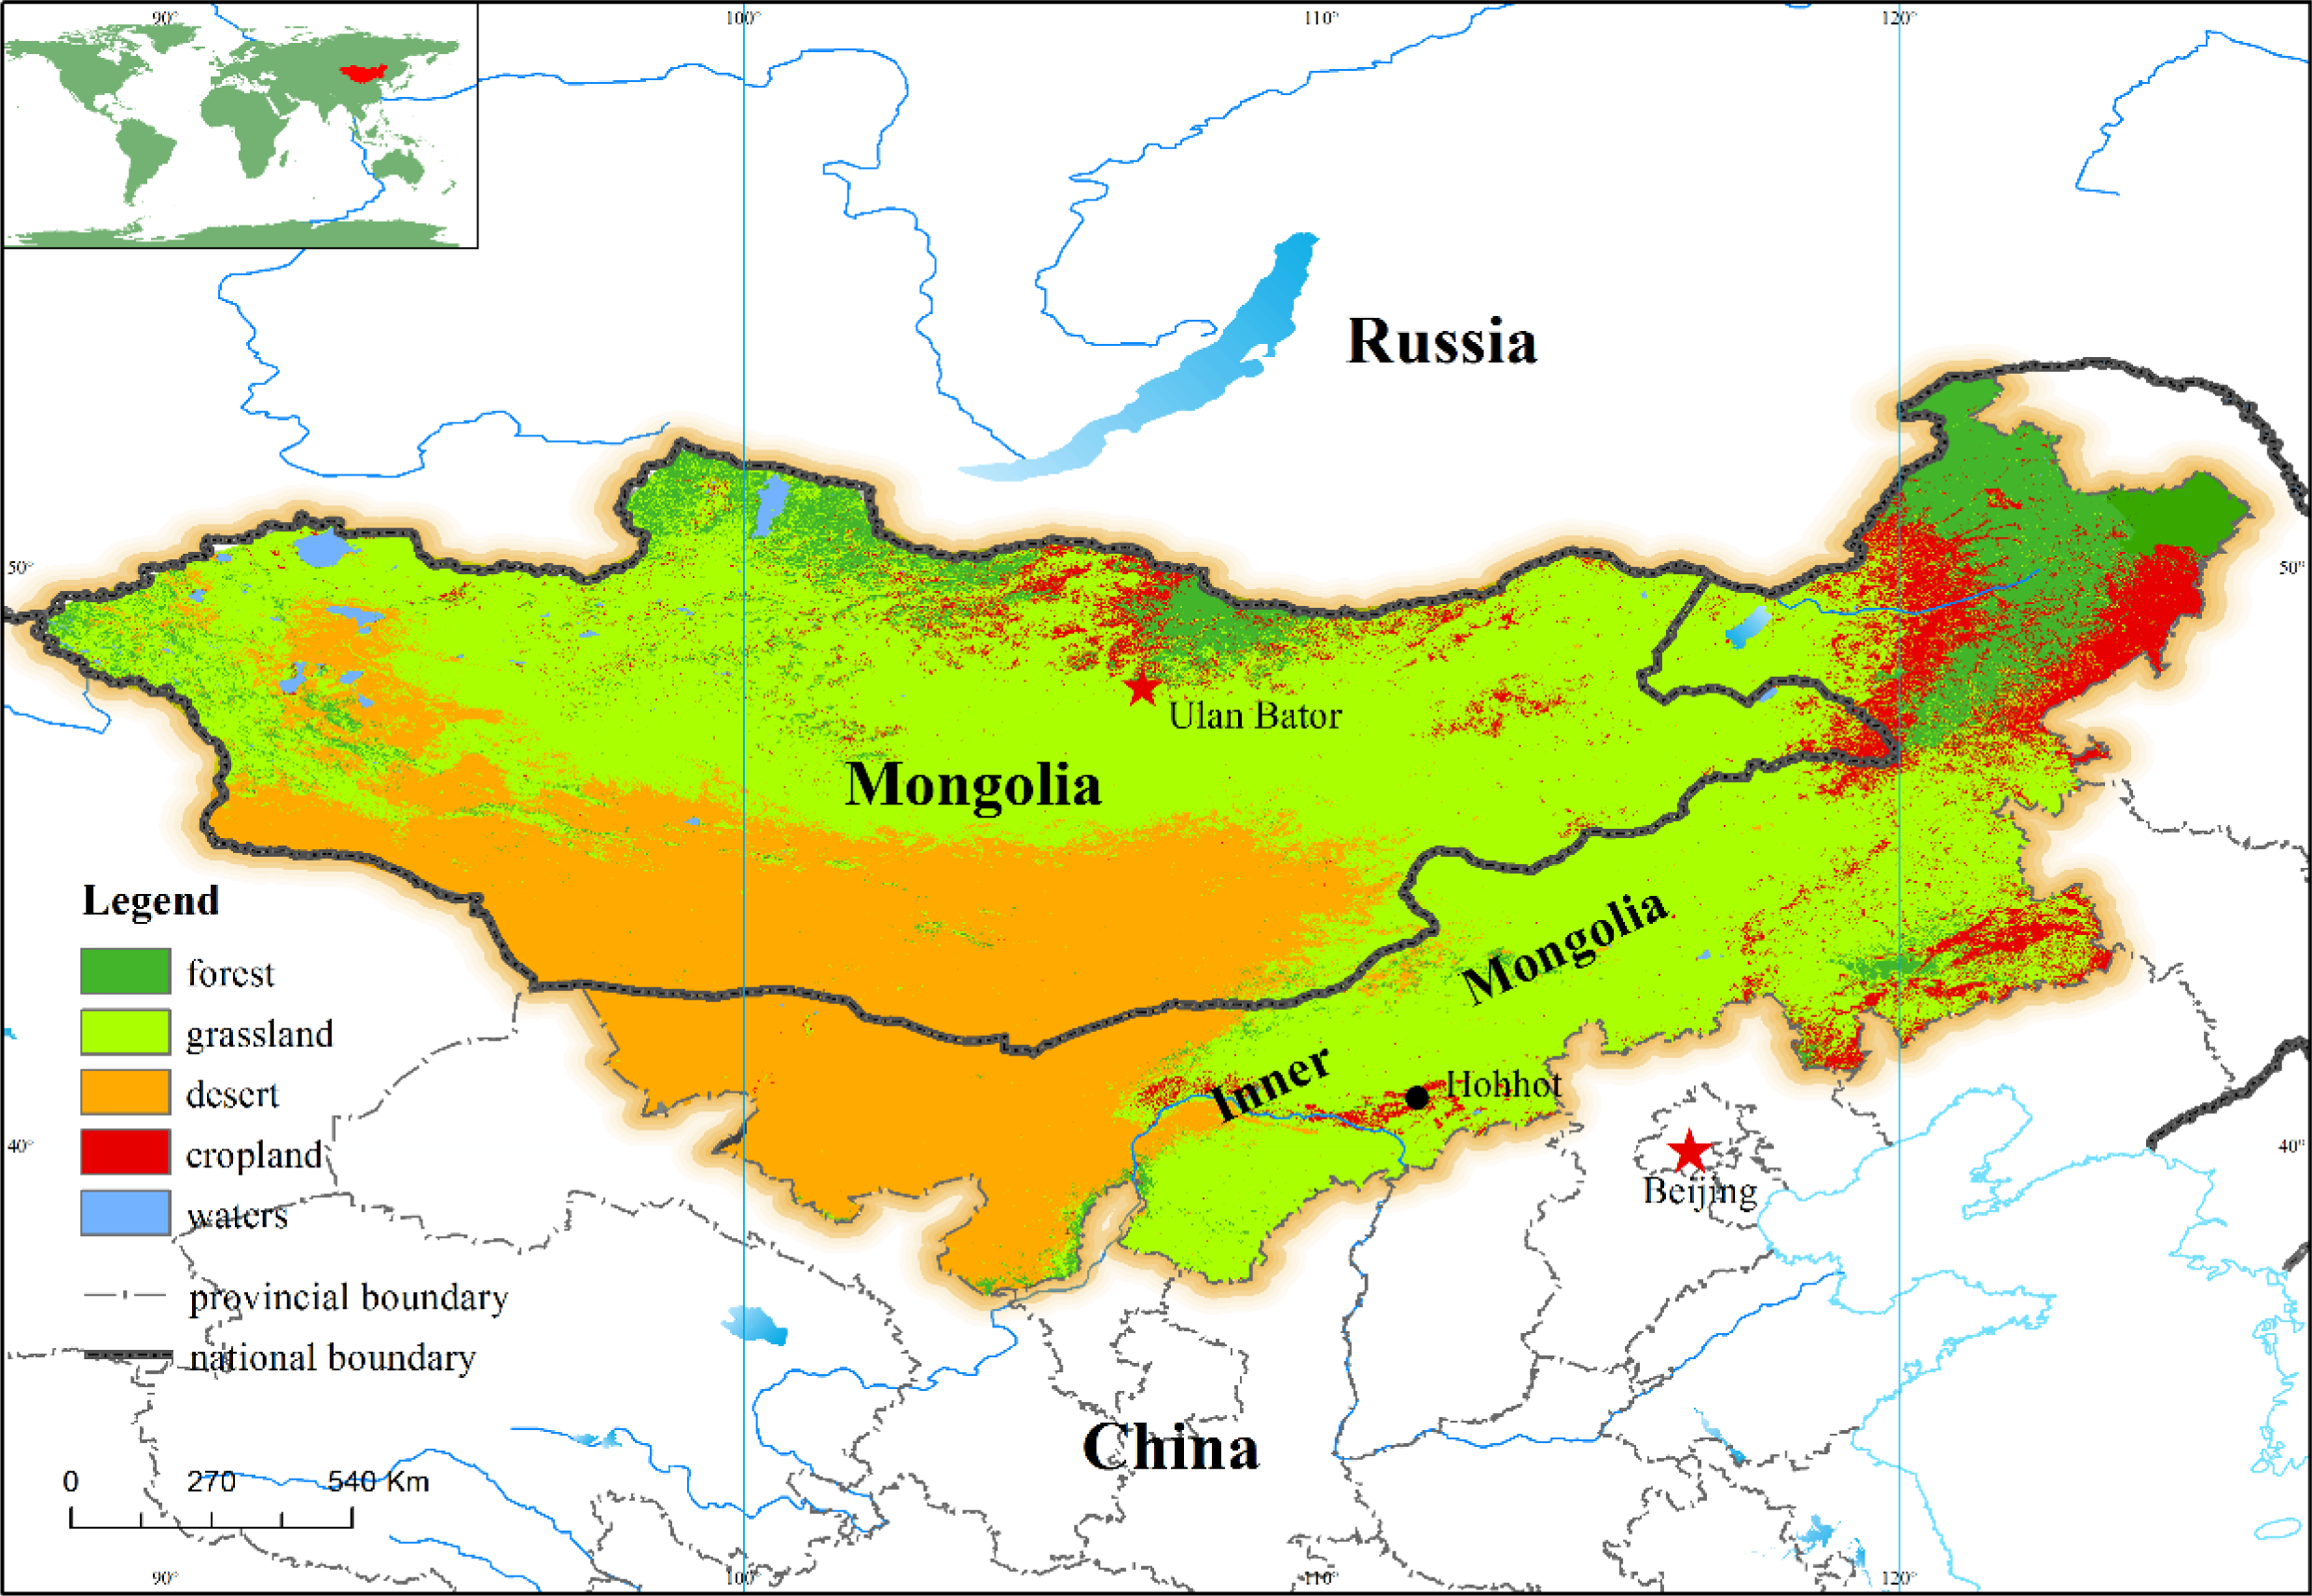
2.1. Study Area

The Mongolian Plateau is one of the world’s largest grassland areas and is famous for its ample mineral resources and peculiar landscape; our study area is located between 37°24′–53°20′N and 87°–126°04′E (Figure 1). Mongolia is one of the largest countries in the circumpolar boreal zone. It is located at the southernmost fringe of the Siberian taiga and the northernmost Central Asian deserts. The country has a total area of over 1.56 million km2 with elevation ranges from 900 to 1,500 m [29]. Inner Mongolia, with a total area of 1.18 million km2, ranks as the 3rd largest province in China. Climate in the MP is a typically temperate continental monsoon climate with an annual precipitation of approximately 200 mm. The region can be divided into three biomes: the arid desert biome in the west, the grassland biome in the center and the forest biome in the northeastern region [30] (Figure 1). The grassland is divided into three types: desert steppe, typical steppe and meadow steppe [31]. The MP is the main sandstorm source region for China.

2.2. Materials

2.2.1. AVHRR 15-Day Composite NDVI Dataset

Acquired by the NOAA (National Oceanic and Atmospheric Administration) satellite and processed by the NASA’s (National Aeronautics and Space Administration) GIMMS (Global Inventory Modeling and Mapping Studies) group, the GIMMS2g data archive is considered the best dataset available for long-term NDVI trend analysis from 1982 to 2006 [15,32,33]. This dataset has a spatial resolution of 8 km and is designed to reduce variations arising from calibration, view geometry and volcanic aerosols and has been verified using stable desert control points [34]. The AVHRR sensor design is characterized by shortcomings, due to the AVHRR channel 2 (near-infrared band) overlapping an atmospheric water vapor absorption band, which influences observed NDVI [15,35,36]. This implies that the GIMMS dataset is dynamic by nature and must be re-calculated every time a new year of data is added [15].

2.2.2. SPOT VEGETATION 10-Day Composite NDVI Dataset

Vegetation Index (NDVI) from SPOT VEGETATION (VEG) satellite at 1 km resolution, produced by the VEGETATION program, is a synthesis product (S10) with 1-km spatial resolution from 1998 to 2012 [37]. The S10-products are derived directly from the physical products, which are atmospherically corrected for molecular and aerosol scattering, water vapor, ozone and other gas absorptions [15]. The SPOT-4 and SPOT-5 VEGETATION instrument’s better atmospheric correction, spatial resolution distortion at off-nadir angles, improved navigation and radiometric sensitivity are advantages over AVHRR [3840].

2.2.3. MODIS Terra 8-Day Composite NDVI Dataset

We use the 500-m MODIS MCD43A4 land surface reflectance product, because it offers nadir and a bidirectional reflectance distribution function with adjusted spectral reflectance bands [41]. This significantly reduces the anisotropic scattering effects of surfaces under different illumination and observation conditions [3941]. For each pixel, a time series is extracted from the first two spectral bands of the dataset during 2000 to 2012 to generate the NDVI.

2.3. Preprocessing

We used the overlapping short time series of SPOT with AVHRR from 1998 to 2006 and MODIS with SPOT from 2000 to 2012 to test how well spatio-temporal patterns can be reproduced by different state-of-the-art NDVI archives. If patterns are dissimilar, then we should be cautious of drawing conclusions using different datasets. Firstly, we filtered the time series and extracted phenological indices, the average growing season NDVI and the SOS, from each NDVI time series. We then correlated the time series. In our study, we define the average growing season NDVI to mean the NDVI average from April to September, the period that covers the major growing season of vegetation.
The NDVI profile generated by the red and near infrared band from MCD43A4 is influenced by snow cover, since melting causes the NDVI value to rise without being related to the increased vegetation activity. Negative bias in the NDVI values during snow cover is corrected by the method of Beck [8,42], using the 2000–2012 MOD10A2 snow cover products.

2.3.1. NDVI Preprocessing

The Maximum Value Composite (MVC) method is used to eliminate the influence of atmospheric conditions, like volcanic aerosols, high solar conditions, low water vapor and near-nadir viewing for each pixel [37]. MVC-based satellite dataset products still include noise from cloud contamination, atmospheric variability and bi-directional effects. To remove this noise, all three datasets are subjected to the iterative Savitzky-Golay filtered algorithm before phenological parameters are extracted [43,44]. NDVI values below 0 and where there was a rise of more than 0.4 NDVI units in 15 days occurring were masked out and interpolated before filtering.

2.3.2. Phenological Indices Extraction

Generally, there are four methods for determining the dates of SOS from the NDVI time series: thresholds, derivatives, smoothing functions and fitting models [45]. We have used the thresholds method by White to extract the phenology from the NDVI time series, since this is considered the simplest and most effective method for phenological study [4547]. This method determines the middle value of maximum and minimum NDVI values per growing season and per pixel as the threshold. Those points where the NDVI profile passed the threshold value in the upward direction are the points of SOS.

2.3.3. Trends and Correlation Analysis

We resample SPOT and MODIS data to match the AVHRR 8-km resolution using the spatial bilinearity method. We select data NDVI > 0.1 at each pixel to eliminate soil background and other noise [13,48]. We select pixels and time periods where NDVI and SOS data from all three datasets are available. Firstly, we compare the general average NDVI values from April to September over the studying area. Linear trends in NDVI and SOS time series were also used to analyze patterns of changes and to test whether a good correlation between NDVI can infer a good correlation between trends from different archives. The test of whether a good coherence from different satellite datasets on these two indices was made by correlation analysis on trends and average values of NDVI and SOS. The strength of linear association was determined by the Pearson product moment correlation per pixel after de-trending [49]. The comparison on spatial distribution is based on the map of average NDVI and SOS and the trends of these two indices. Correlation of time-series values of average NDVI and SOS per pixel represent the spatial distribution of coherence on indices’ developing patterns throughout the period. In terms of quantitative comparison, we use scatter plots of trend values to analyze the coherence between each two archives. The evaluation of coherence is based on the slope value of those scatter points and the correlation values (R2).

3. Results

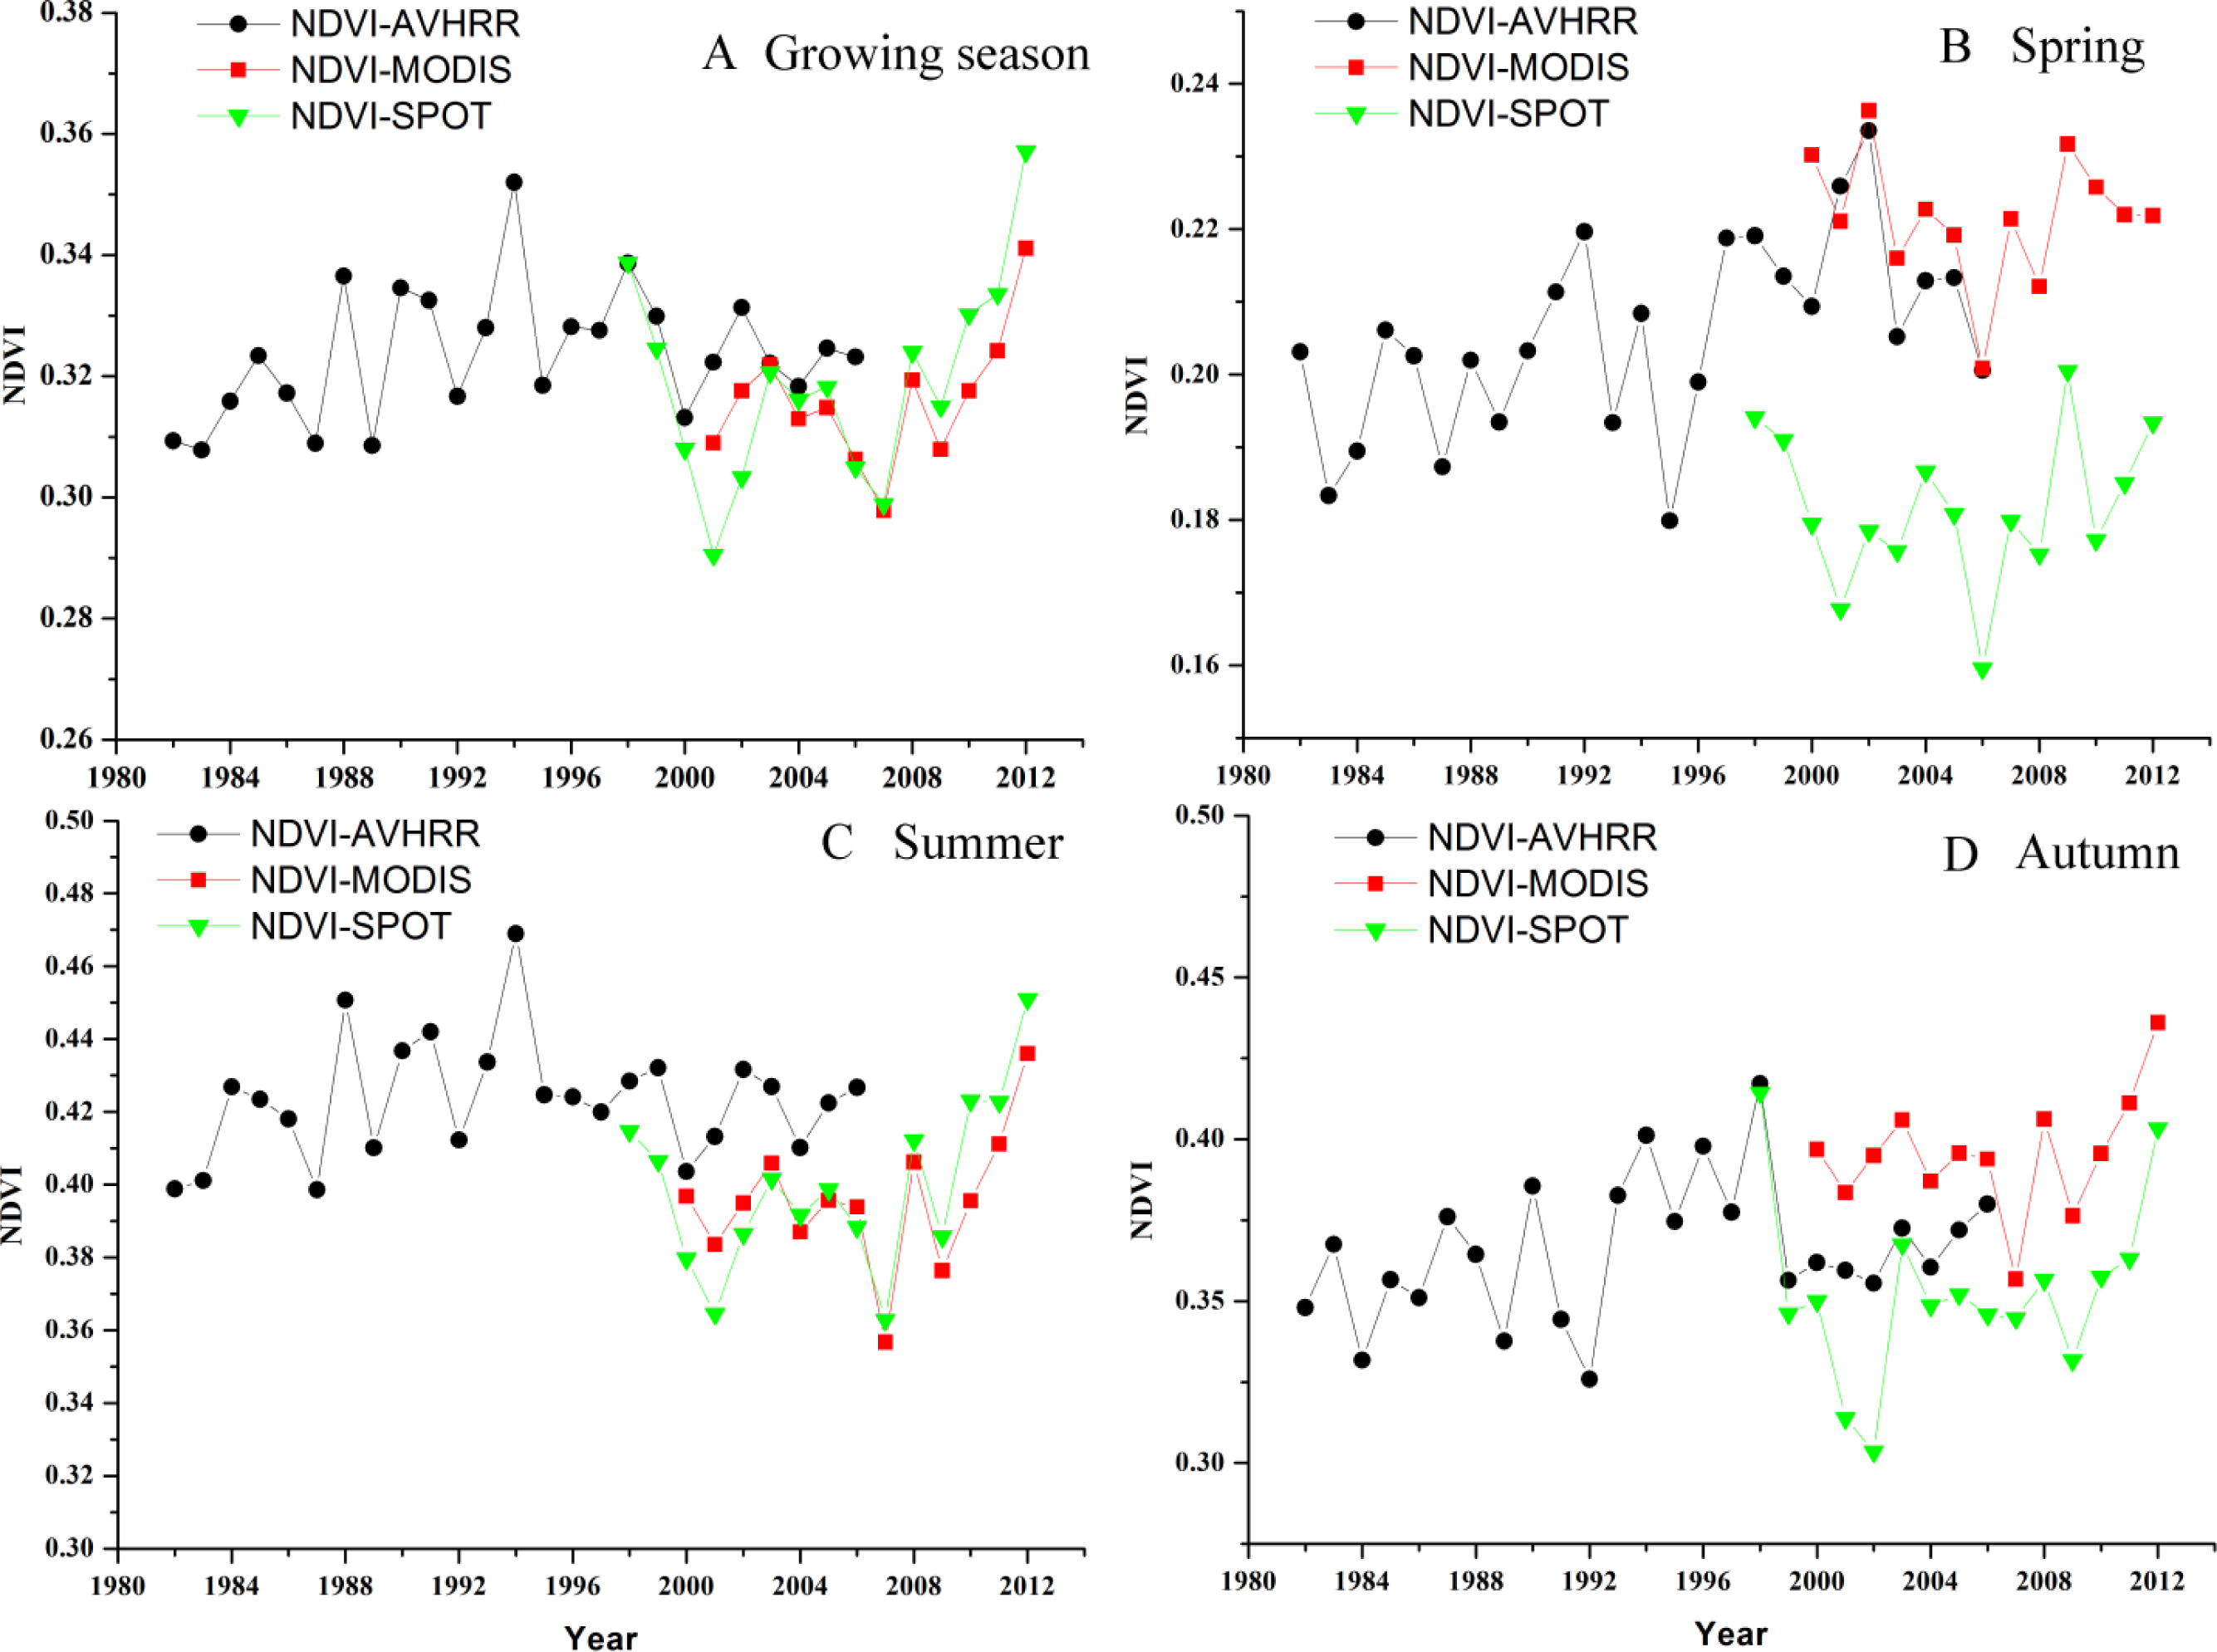
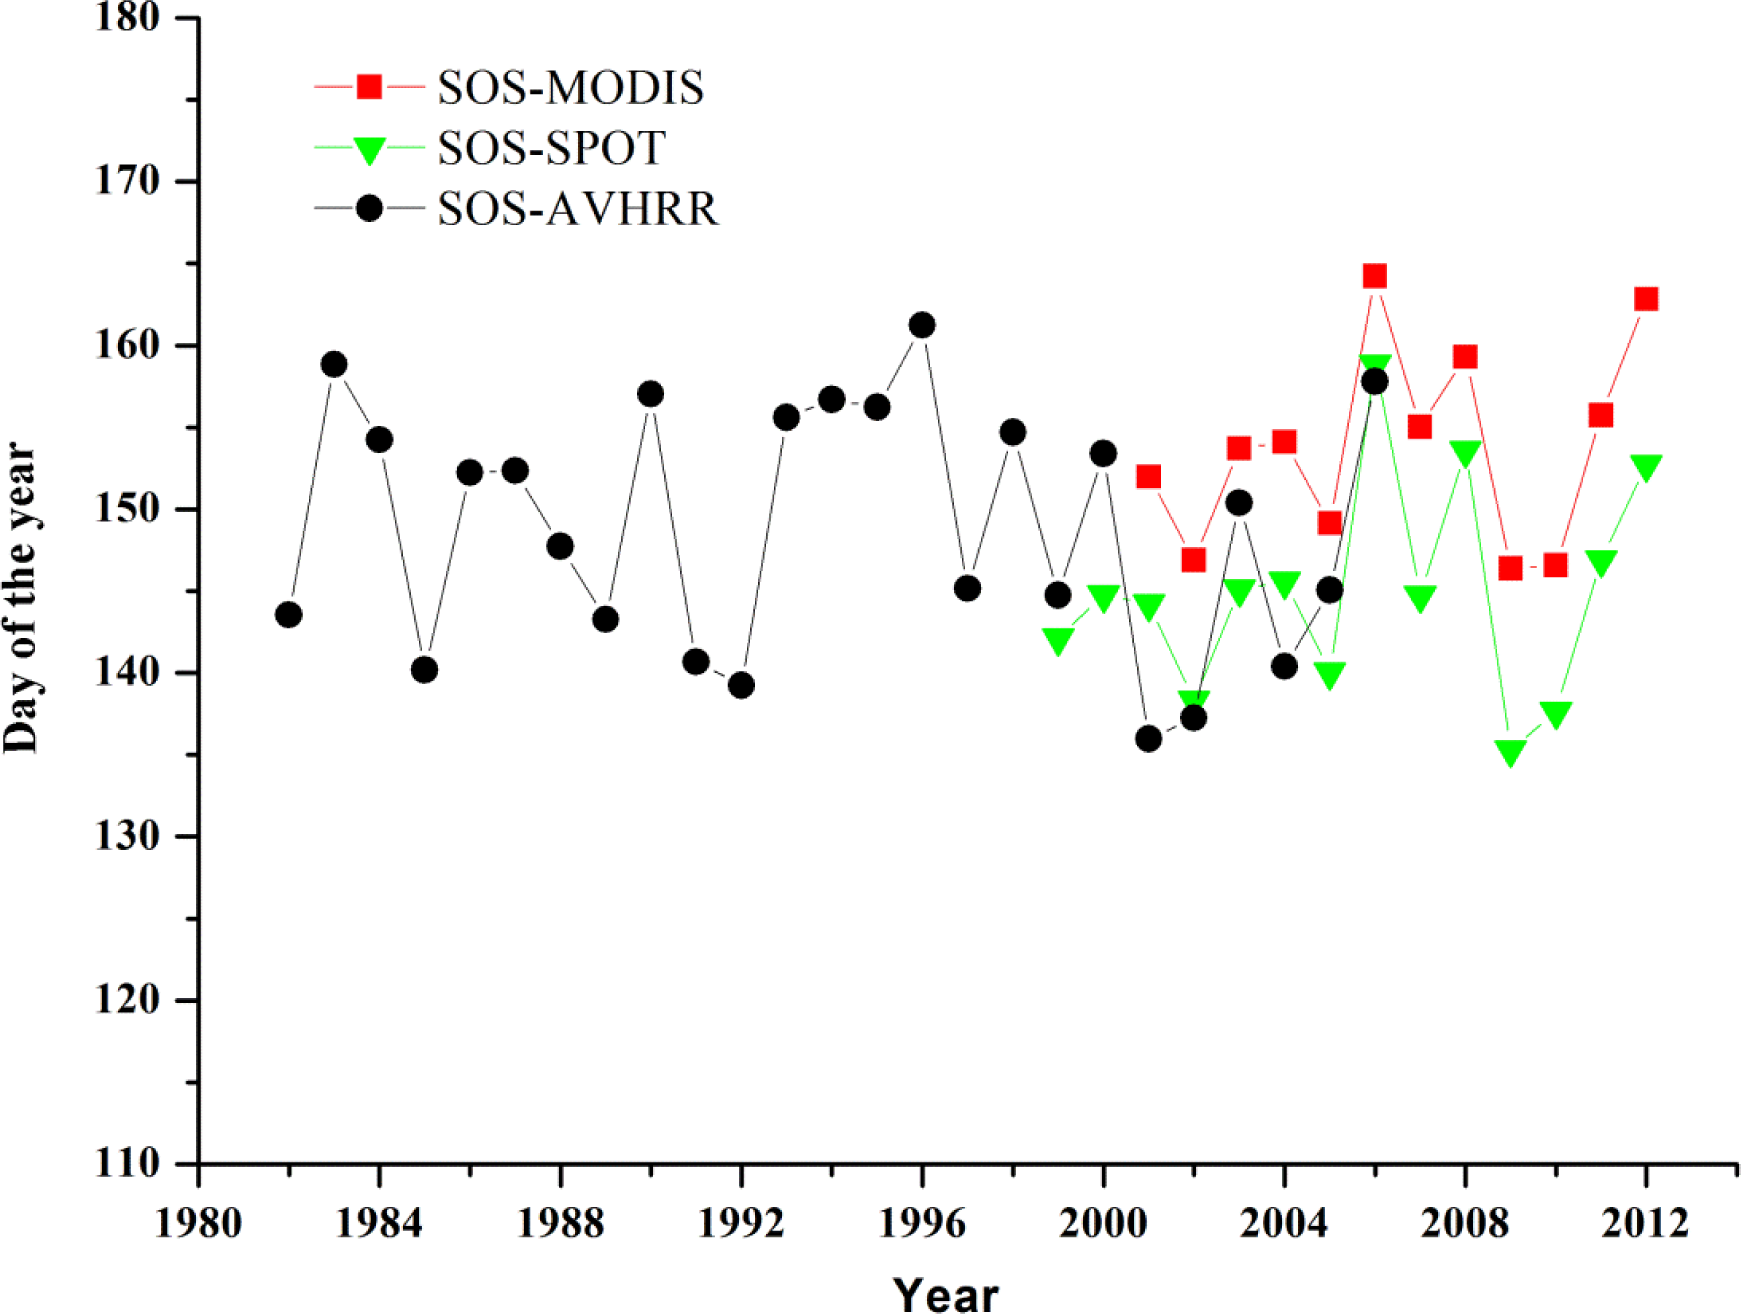
3.1. Annual Temporal Variations in NDVI and SOS Time Series

The average NDVI values for the growing season (April–September), spring (April–May), summer (June–August) and autumn (September) during, 1982–2012, are shown in Figure 2. During the period of 1982–2006, average growing season NDVI from AVHRR shows no trend (Figure 2A). Seasonal NDVI has a marginally significant increase in spring (p = 0.07), while the summer and autumn NDVI has not changed significantly. Over the whole plateau, the four peak NDVI years were 1988, 1994, 1998 and 2012.
Next, we compare the data coherence of AVHRR, SPOT and MODIS. Results show that NDVI in SPOT and MODIS display similar patterns during 2001–2012, especially in the summer season (Figure 2A–D). Mean values of NDVI from AVHRR, MODIS and SPOT are close, except the much lower SPOT NDVI value in spring, and there is a good coherence between MODIS and SPOT.
To examine the variations of phenology based on different datasets, we analyze the average SOS of the study area from 1982 to 2012 based on the three satellite data sources (Figure 3). Average SOS from the SPOT and MODIS products shows much higher consistency in variation pattern with a difference in mean value (day 145 and 154, respectively). The SOS values from the AVHRR dataset (mean day 151) is similar to its counterpart from the SPOT dataset over 1998–2006, but with larger variability than SPOT SOS.

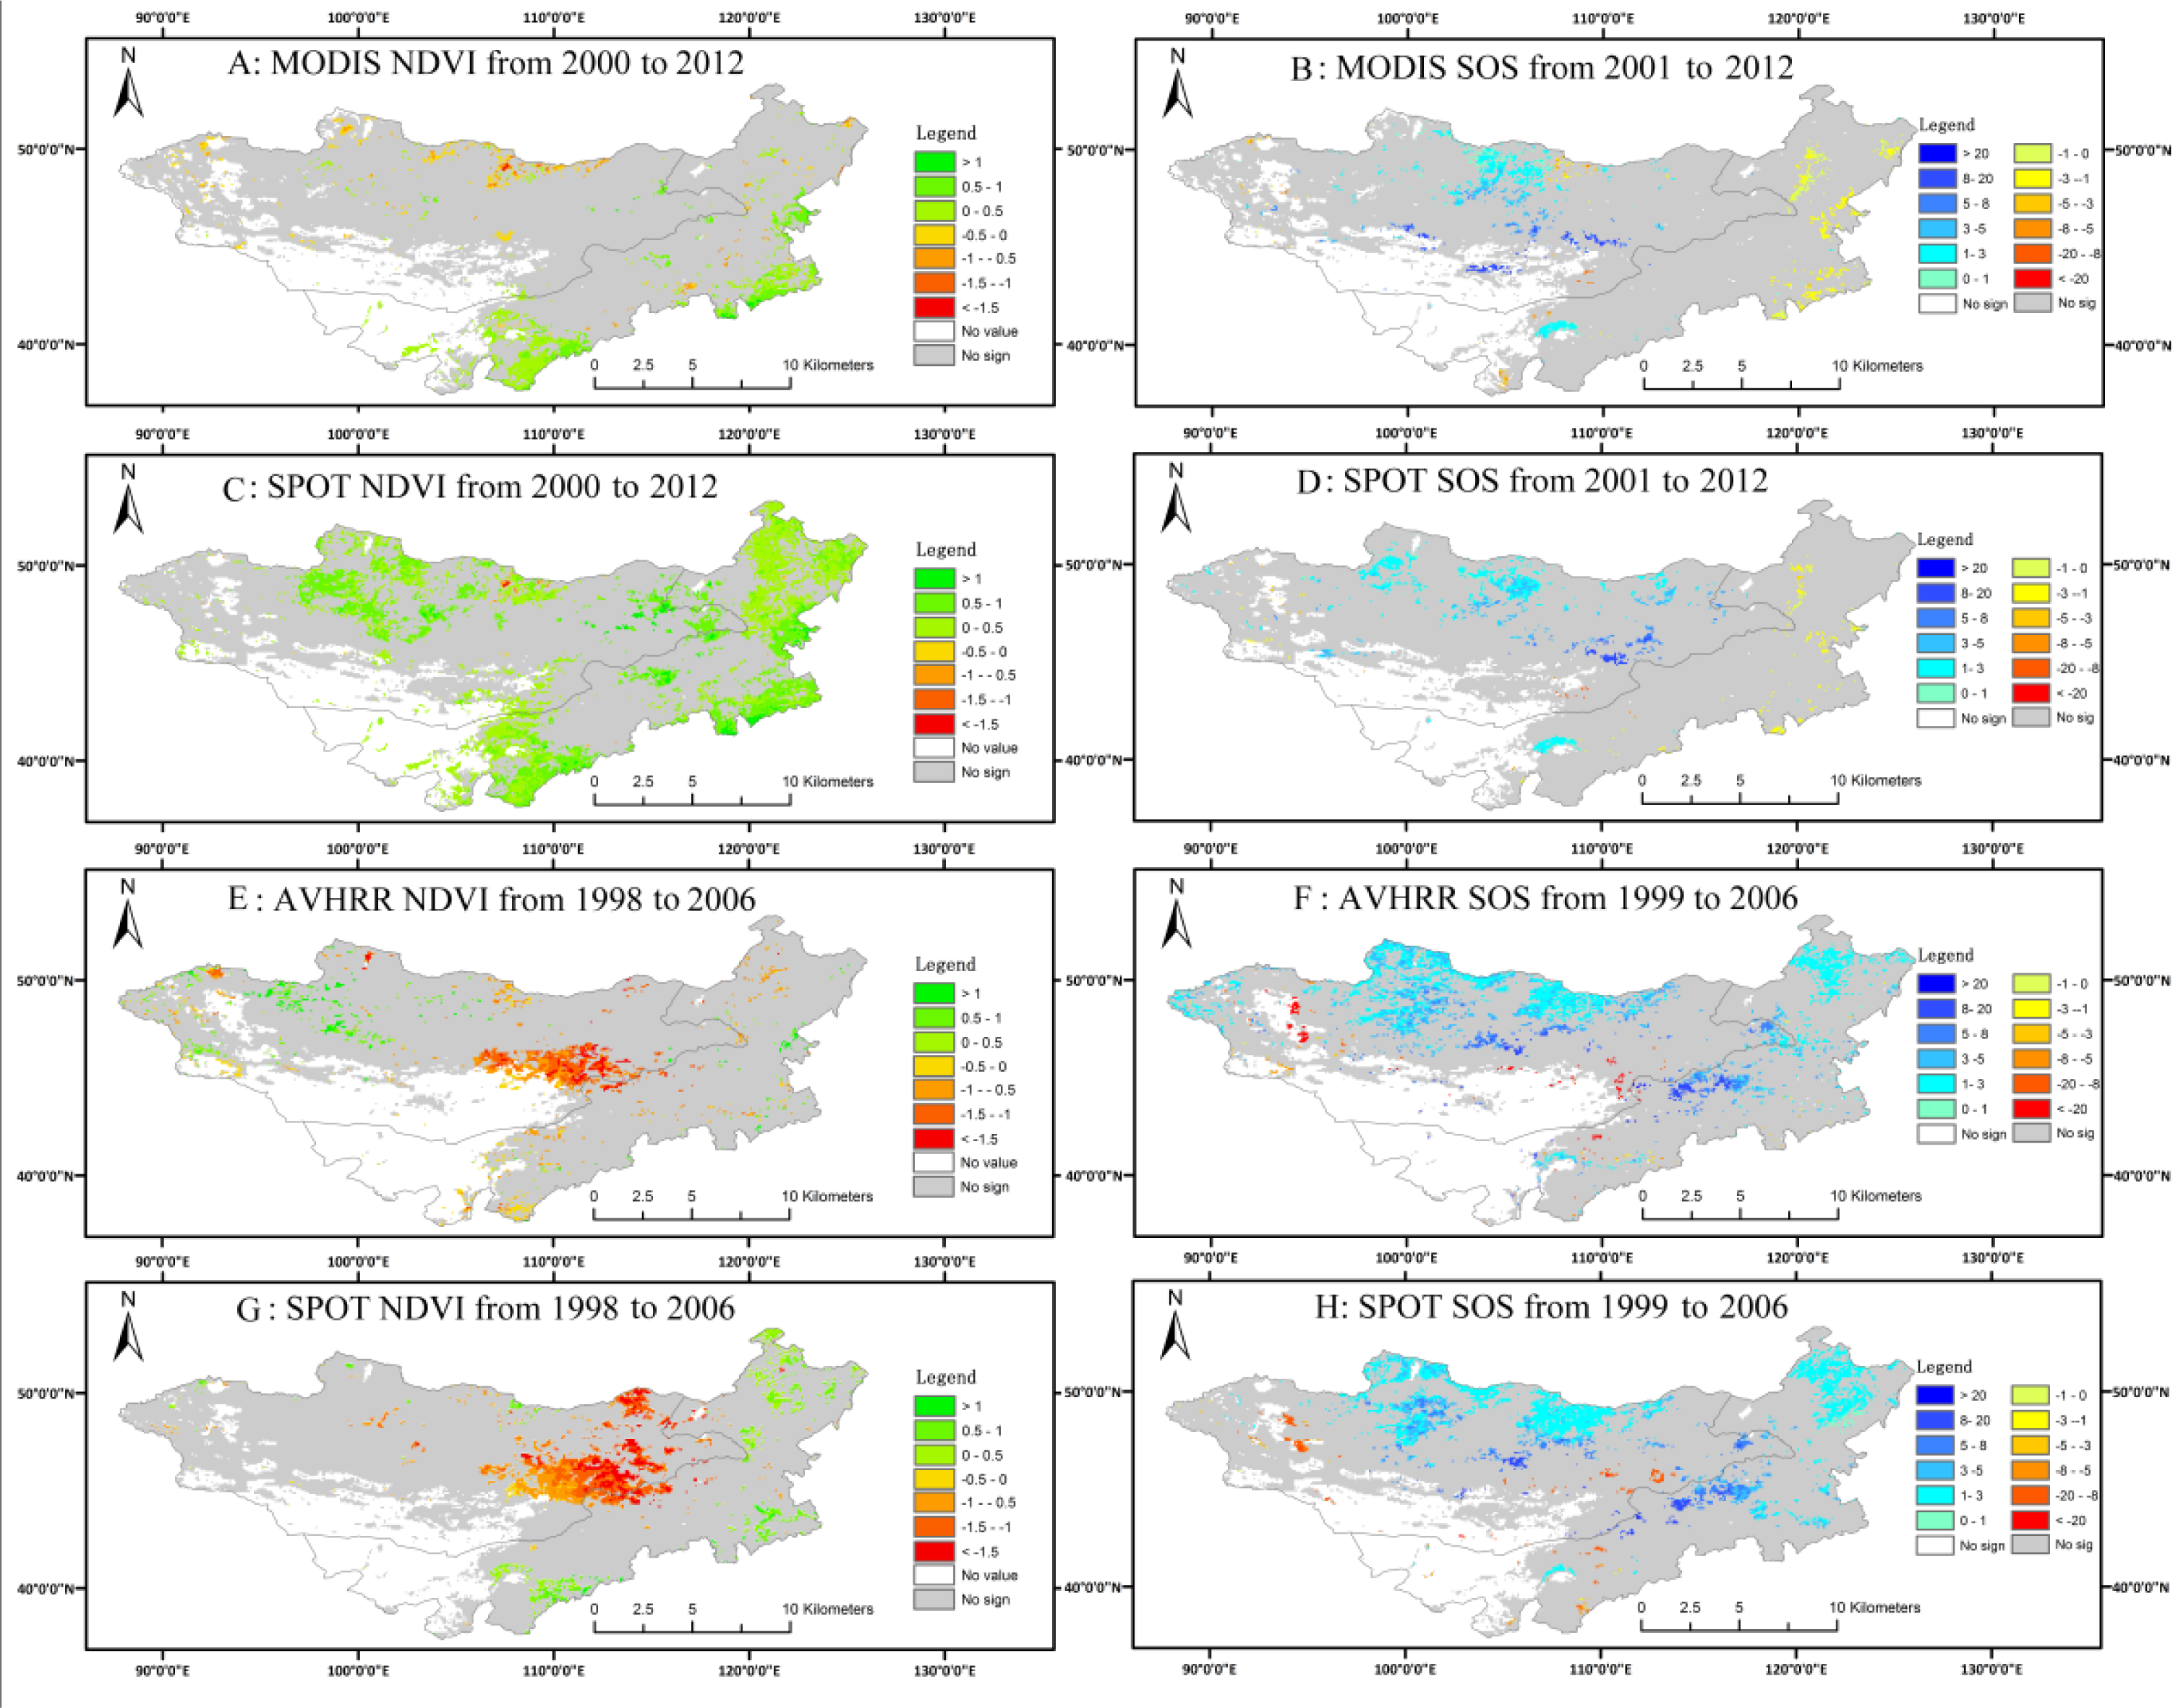
3.2. Spatial Variations in NDVI and SOS

We evaluate the spatial distribution of temporal trends for each index and calculate the correlation of the trends derived from the three archives. In each of the intersecting time periods, the distribution of trends of NDVI and SOS from different datasets shows similar patterns in general (Figure 4). NDVI from MODIS and SPOT both show greening trends during 2000–2012, but a big difference exists in the spatial patterns of the NDVI trend in the MP between the two archives (Figure 4A,C). AVHRR and SPOT display a significant decreasing trend in central parts from 1998 to 2006 (Figure 4E–G), and the spatial distribution of NDVI trends from AVHRR is similar to that from SPOT. MODIS NDVI has less pixels with a significant trend (p < 0.1) (Figure 4A) compared to SPOT and AVHRR. The four maps of the SOS trend (Figure 4B,D,F,H) show that the three archives have similar spatial distribution. The two periods shown in Figure 4 both display trends towards a delay in SOS, but during 1999–2006, more area has a significant increasing trend. Recently, SOS has advanced in much of the north-eastern part of Inner Mongolia and in small areas of northern and central Mongolia (Figure 4B,D).
In Figure 5, we use the correlation coefficient and slope of regression to quantitatively analyze the trends of NDVI from different datasets during several different time intervals. As shown in Figure 5, trend values are in better quantitative agreement between SPOT and MODIS than SPOT and AVHRR, both in Inner Mongolia and Mongolia. For NDVI, both R2 and the slope indicate better consistency in SPOT and MODIS than SPOT and AVHRR. For SOS, R2 are all near 1.0 in both archives’ comparisons and regions; the slope values of the regression of SPOT and MODIS are much closer to 1.0. Therefore, in general, AVHRR and SPOT show better agreement in spatial distribution (Figure 4), while MODIS and SPOT are better in quantitative agreement, for both NDVI and SOS indices (Figure 5). Our approach and result is somewhat different from the previous study, which found differences between AVHRR-related products and SPOT NDVI in Inner Mongolia [14]. According to the scatter plots (Figure 5), the three archives have better agreement in Inner Mongolia than Mongolia on both indices, except for MODIS-SPOT on NDVI (Figure 5A, Inner Mongolia, R2 = 0.768, slope = 1.049; Figure 5B, Mongolia, R2 = 0.926, slope = 1.015).
Figure 6 shows the spatial correlation coefficient of NDVI and SOS from three archives for interacting periods. In general, MODIS-SPOT gives higher correlations in both NDVI and SOS values than AVHRR-SPOT (comparing Figure 6A,C to 6B,D). The spatial distribution of the linear trends between MODIS and SPOT NDVI during 2000 to 2010 shows high consistency over the majority of the MP (Figure 6A, R > 0.7), while AVHRR and SPOT display less consistency in the northern part (Figure 6B). This is the same in SOS comparison (Figure 6C–D). Compared with land use and the land cover map (Figure 1), it seems that inconsistency mainly occurs in the forest region and near the desert area in both Mongolia and Inner Mongolia.
Spatio-temporal correlation of NDVI and SOS from AVHRR and SPOT has less consistency and reliability than SPOT and MODIS in capturing the phenological dynamics, for Inner Mongolia and Mongolia. However, there is better consistency in AVHRR and SPOT from the whole analysis than results on other regions, like the Tibetan Plateau, the Iberian Peninsula and South America [13,14,50,51]. Therefore, we merged AVHRR (1982–1997) and SPOT (1998–2012) datasets to generate a long time series over 30 years for later analysis.

3.3. NDVI, SOS Temporal Dynamics in the Whole MP

Figure 7 shows annual variation of NDVI and SOS in the MP, IM and Mongolia. Overall, the MP has generally not become greener (slope = 0.0002, p = 0.59), in contrast with the global trend [14,34]. However, the mean annual NDVI trend can be divided into three distinct phases: it is enhanced before 1994 (slope = 0.0023, R = 0.66, p = 0.01) following a slightly decreasing trend before 2001 (slope = −0.0045, R = −0.62, p = 0.14) and, finally, a significantly positive recovery from 2001 to 2012 (slope = 0.0038, R = 0.76, p = 0.004) in the MP. The decrease of the vegetation NDVI in the second phase from 1996 to 2000 in IM is mainly due to drought [52,53]. However, in the both regions, increasing spring temperature and precipitation have contributed to vegetation recovery recently [42,5456].
Vegetation dynamics between Inner Mongolia and Mongolia are shown in Figure 5B and 5C, with no significant linear trend in NDVI on the Mongolian Plateau and the Republic of Mongolia. There is a slightly enhanced trend in Inner Mongolia NDVI (R = 0.249, p = 0.005). This may be benefited from the ecological projects by the Chinese government, for instance, Grain for Green [51], the Natural Forest Conversion Program [57] and the Beijing-Tianjin Sand Source Control Program [50,58]. Average SOS is also shown in Figure 7A–C. This reveals no significant “earlier spring” feature in the temporal series during the past 31 years in the Mongolian Plateau.

4. Discussion

Mongolia and the province of Inner Mongolia make two ideal objectives to identify policy and climate impacts on the local environment [59,60]. Previous work using remote sensing data on parts or the whole study region suffered from the short temporal coverage of datasets [19,2427]. In contrast, our work merges two satellite datasets into a dataset covering 30 years (1982–2012), which proves advantageous for the study of trends and to link change trajectories to specific ecological processes. For instance, Chuai (2011) found that the mean growing season NDVI did not change significantly based on analysis of SPOT NDVI from 1998 to 2007 [61]; however, our observations from the longer time series shows there have been changes.
Vegetation recovery in Inner Mongolia is obvious from NDVI changes (R = 0.249, p = 0.005), unlike in Mongolia. Inner Mongolia may have benefited from the ecological projects implemented by the Chinese government, for instance, Grain for Green [51], the Natural Forest Conversion Program [57] and the Beijing-Tianjin Sand Source Control Program [50,58]. Previous studies reported that SOS advanced by 5.2 days in the Northern Hemisphere in the early period (1982–1999), but only by 0.2 days in the later period (2000–2008) [62]. In the northern high latitudes, SOS advanced by 4.7 days per decade [63] and by 1.04 days per year over the Tibetan Plateau [13]. However, our research found no obvious advance of SOS in the Mongolian Plateau. This implies that regreening of vegetation has its local features in different places.

5. Conclusions

This work compared three global satellite-derived datasets on the Mongolian Plateau—AVHRR, MODIS and SPOT—to make a long time series (1982–2012) of the NDVI and SOS indices during the past three decades. The main findings are as follows:
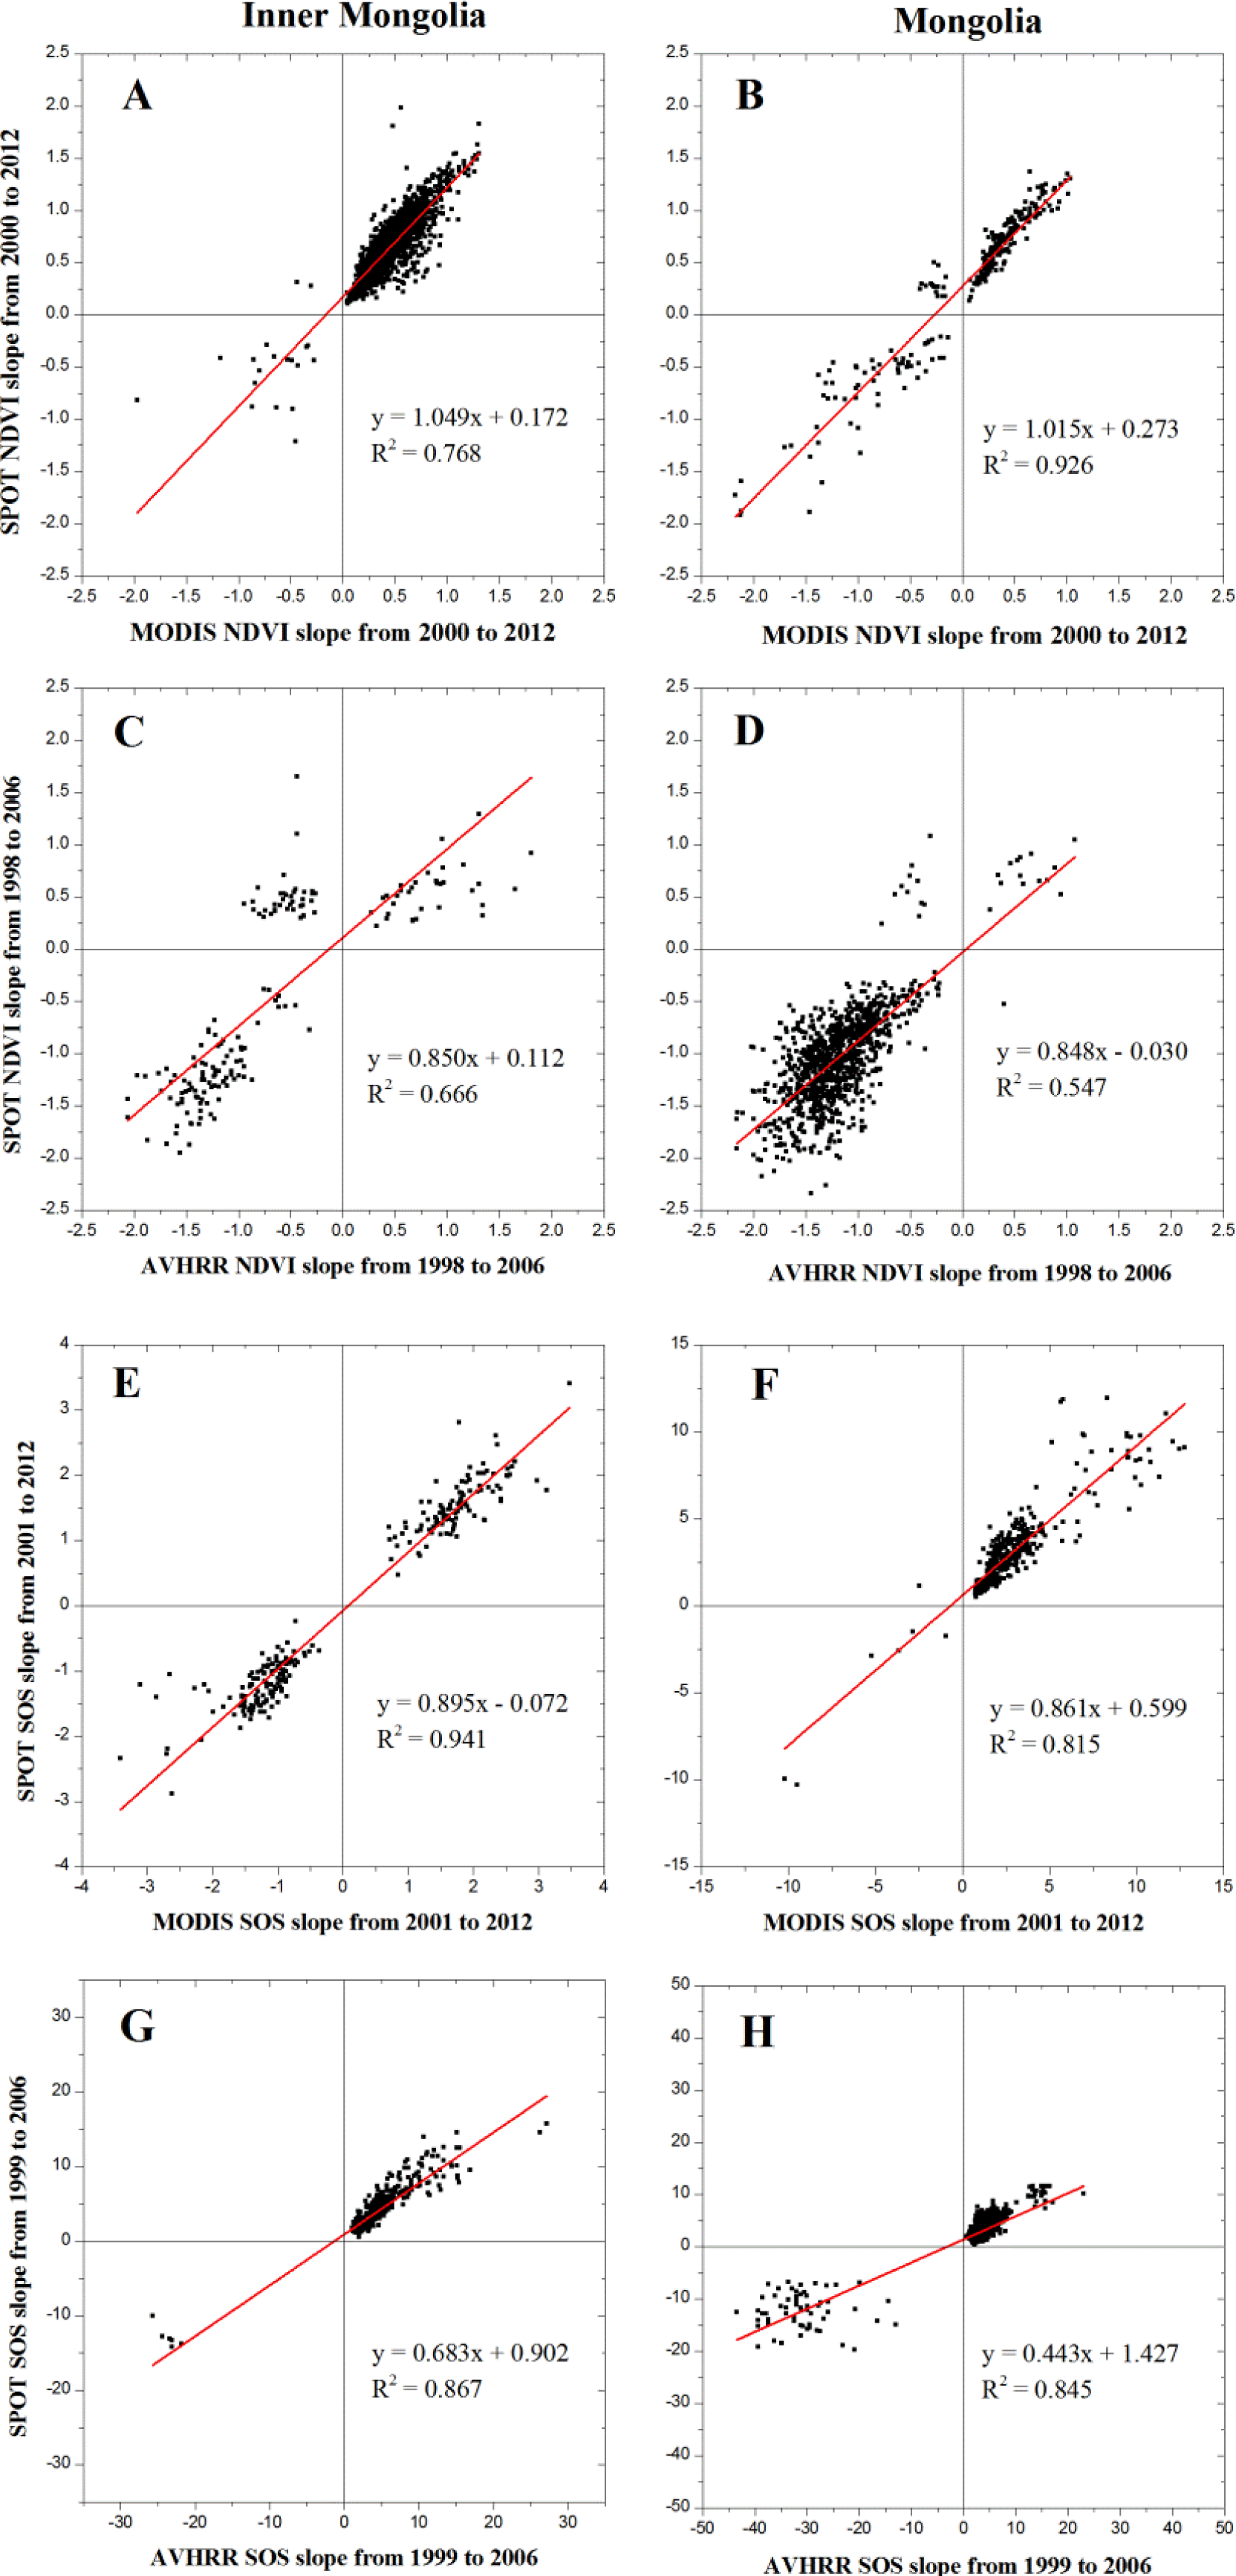
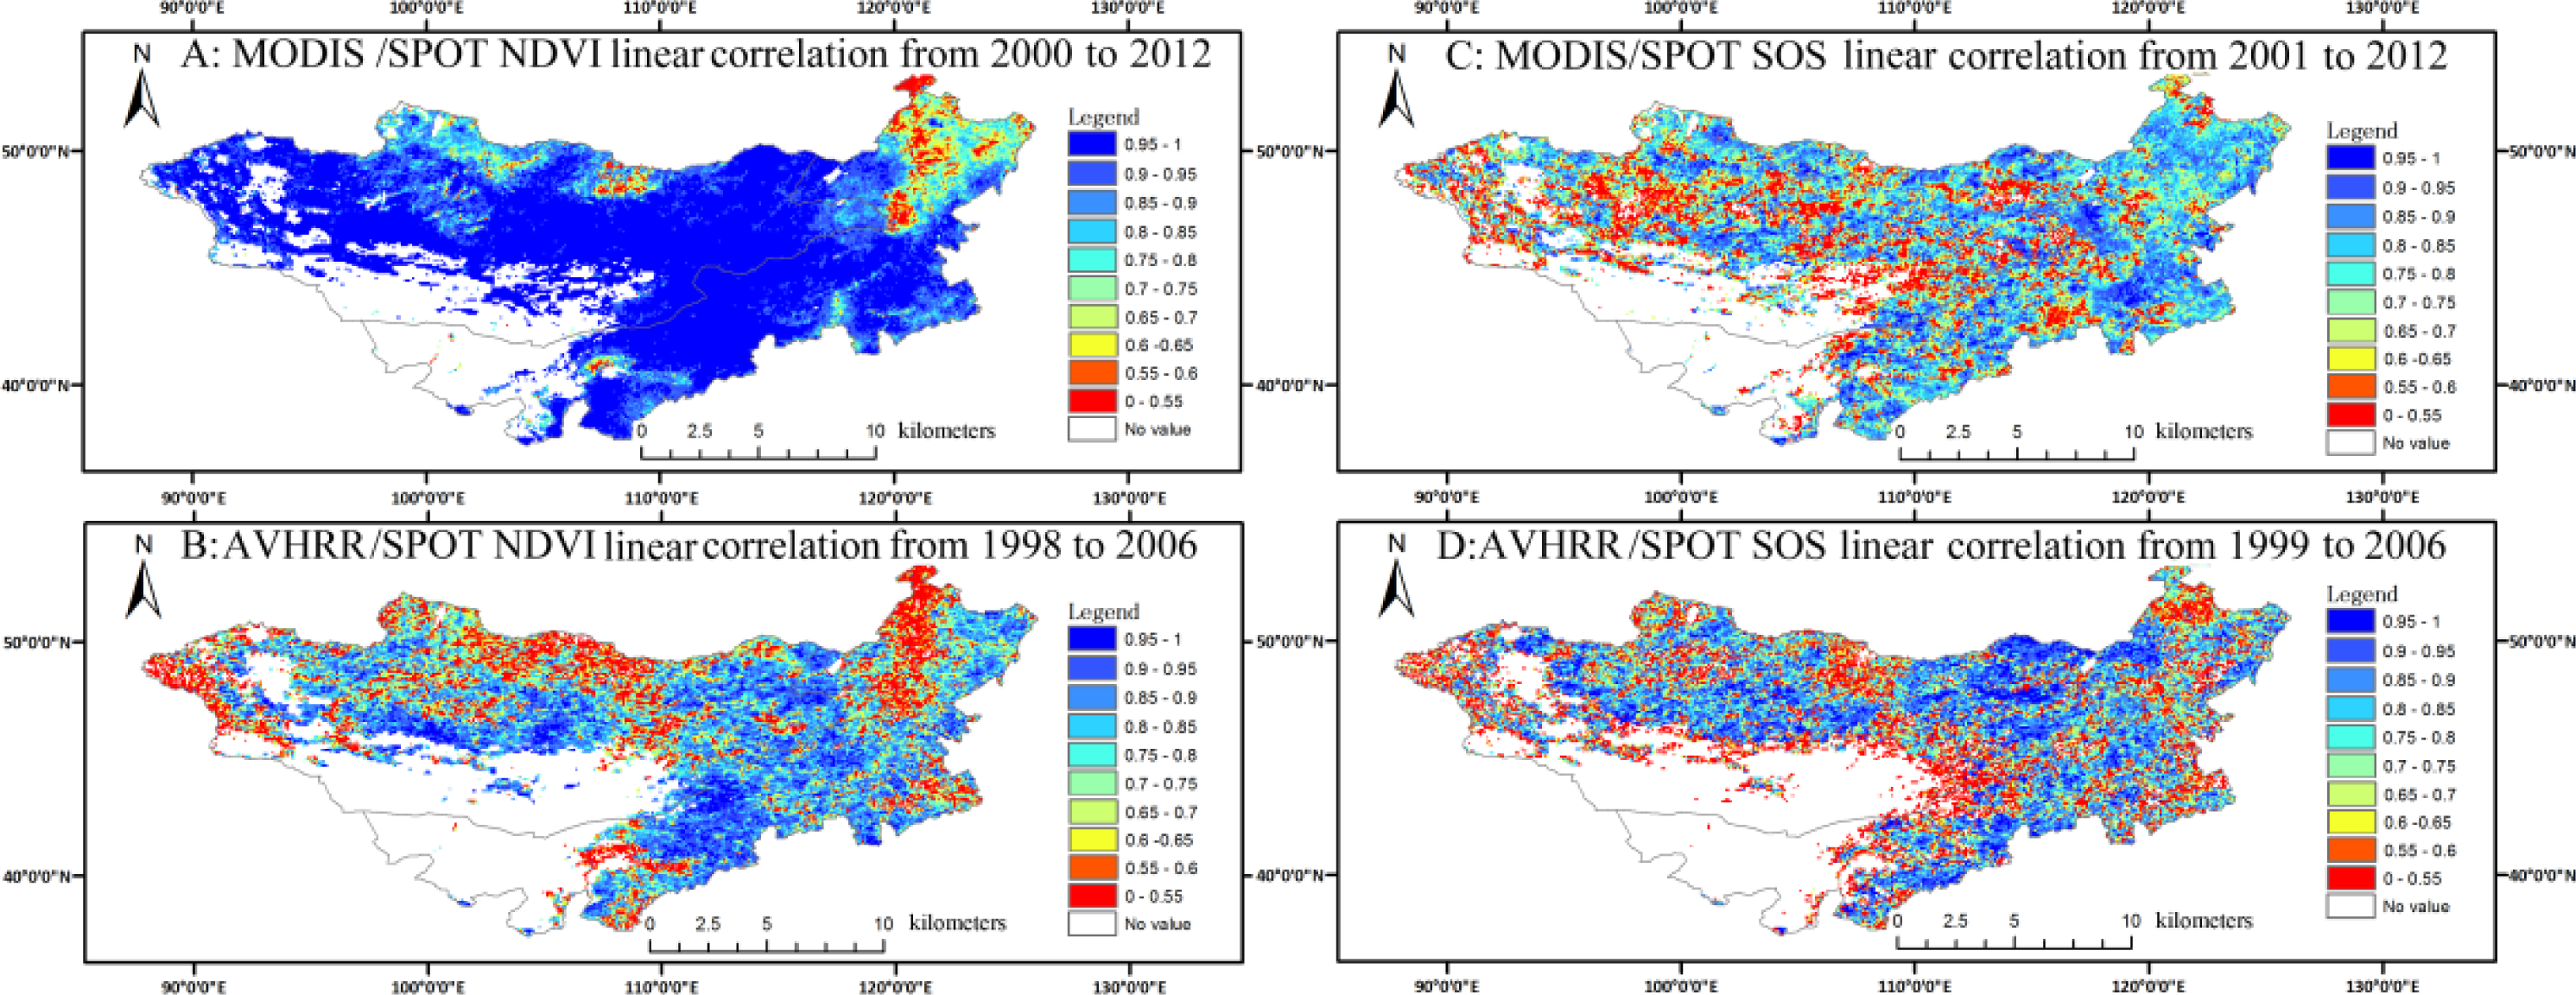
  • In terms of temporal changes, SPOT and MODIS have high similarities and consistency from 2000 to 2012. AVHRR and SPOT also has relatively good consistency on the annual trends of average growing season NDVI and SOS during 1998 to 2006. In the spatial patterns, the three archives are comparable, especially SPOT and AVHRR data. Therefore, it is appropriate to merge AVHRR and SPOT into a longer time series data in the Mongolian Plateau.
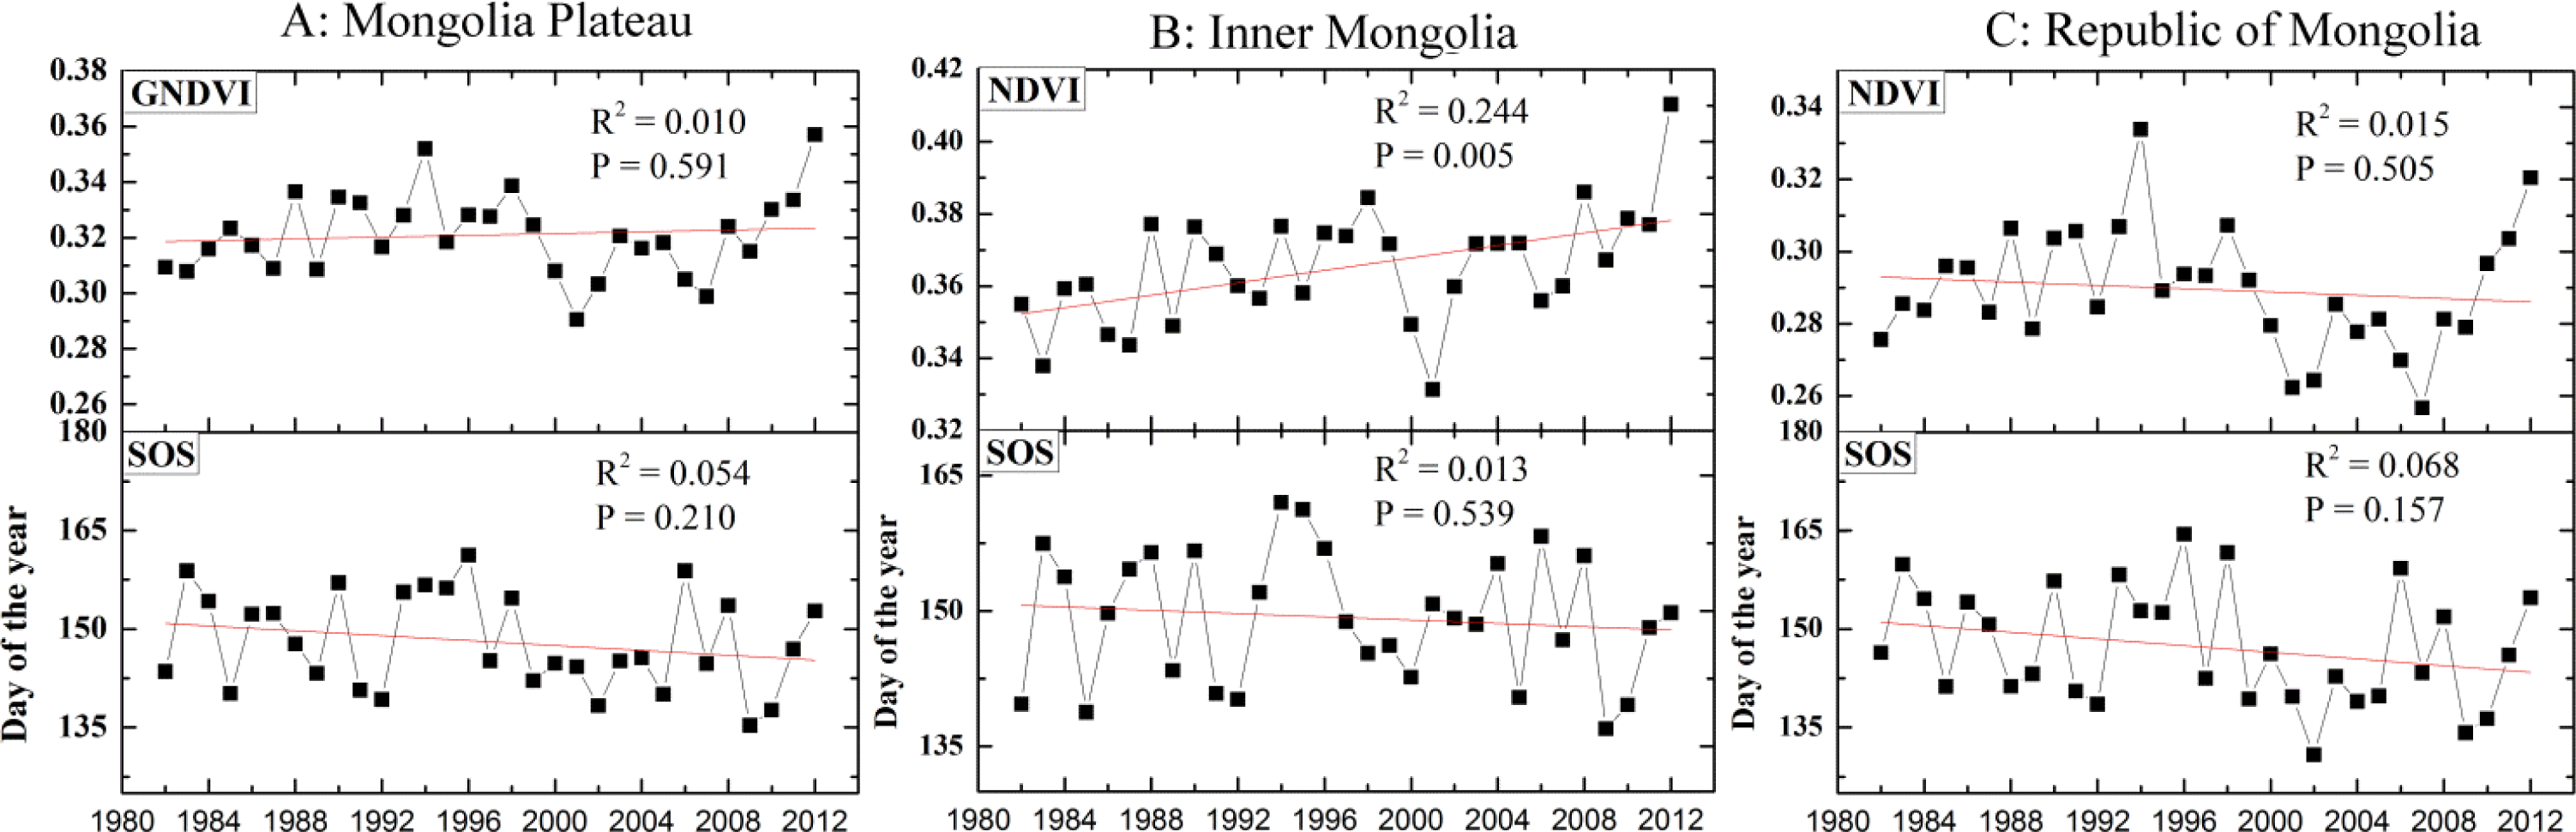
  • Overall, the three archives perform better in Inner Mongolia than in Mongolia based on the scatter plots analysis. Analyzing the combined long time series of AVHRR and SPOT demonstrates that vegetation growth shows a significant ascending trend with three distinct phases in IM: enhanced before 1994 followed by a decreasing trend (severe drought years) until 2001; then, a rapid recovery to 2012. No significant trend is found across 30 years in Mongolia, but it dramatically decreased from 1993 to 2007 and increased afterwards. No significant “earlier spring” feature was found during the past 31 years on the whole Mongolian Plateau.
  • Overall, significant vegetation coverage increases in Inner Mongolia were identified compared with Mongolia and that is likely due to the Chinese grassland ecological policy implemented in recent years.

Acknowledgments

The authors are really grateful for the positive comments from the editor and three anonymous reviewers. The work was financially supported by the National Basic Research Development Program of China (grant no. 2011CB952001 and 2010CB428502), the National Science Foundation of China (grant no. 41271542), the Program for New Century Excellent Talents in University (grant no. NCET-09-0227), the National High Technology Research and Development Program of China (grant no. 2010AA012305) and the Fundamental Research Funds for the Central Universities.

Conflict of Interest

The authors declare no conflict of interest.

References

  1. Cao, M.; Woodward, F.I. Dynamic responses of terrestrial ecosystem carbon cycling to global climate change. Nature 1998, 393, 249–252. [Google Scholar]
  2. Zhang, X.; Friedl, M.A.; Schaaf, C.B.; Strahler, A.H.; Hodges, J.C.F.; Gao, F.; Reed, B.C.; Huete, A. Monitoring vegetation phenology using modis. Remote Sens. Environ 2003, 84, 471–475. [Google Scholar]
  3. Zeng, H.; Jia, G.; Forbes, B. Shifts in arctic phenology in response to climate and anthropogenic factors as detected from multiple satellite time series. Environ. Res. Lett. 2013, 8. [Google Scholar] [CrossRef]
  4. Heumann, B.W.; Seaquist, J.; Eklundh, L.; Jönsson, P. Avhrr derived phenological change in the sahel and soudan, africa, 1982–2005. Remote Sens. Environ 2007, 108, 385–392. [Google Scholar]
  5. Wang, Q.; Tenhunen, J.D. Vegetation mapping with multitemporal ndvi in north eastern china transect (nect). Int. J. Appl. Earth Obs. Geoinf 2004, 6, 17–31. [Google Scholar]
  6. Eastman, J.; Sangermano, F.; Machado, E.; Rogan, J.; Anyamba, A. Global trends in seasonality of normalized difference vegetation index (NDVI), 1982–2011. Remote Sens 2013, 5, 4799–4818. [Google Scholar]
  7. Luo, X.; Chen, X.; Xu, L.; Myneni, R.; Zhu, Z. Assessing performance of ndvi and ndvi3g in monitoring leafunfolding dates of the deciduous broadleaf forest in northern china. Remote Sens 2013, 5, 845–861. [Google Scholar]
  8. Beck, P.S.; Atzberger, C.; Høgda, K.A.; Johansen, B.; Skidmore, A.K. Improved monitoring of vegetation dynamics at very high latitudes: A new method using modis ndvi. Remote Sens. Environ 2006, 100, 321–334. [Google Scholar]
  9. Zhang, J.X.; Liu, Z.G.; Sun, X.X. Changing landscape in the three gorges reservoir area of yangtze river from 1977 to 2005: Land use/land cover, vegetation cover changes estimated using multi-source satellite data. Int. J. Appl. Earth Obs. Geoinf 2009, 11, 403–412. [Google Scholar]
  10. Delbart, N.; Le Toan, T.; Kergoat, L.; Fedotova, V. Remote sensing of spring phenology in boreal regions: A free of snow-effect method using noaa-avhrr and spot-vgt data (1982–2004). Remote Sens. Environ 2006, 101, 52–62. [Google Scholar]
  11. Grégoire, J.-M.; Tansey, K.; Silva, J. The gba2000 initiative: Developing a global burnt area database from spot-vegetation imagery. Int. J. Remote Sens 2003, 24, 1369–1376. [Google Scholar]
  12. Amri, R.; Zribi, M.; Lili-Chabaane, Z.; Duchemin, B.; Gruhier, C.; Chehbouni, A. Analysis of vegetation behavior in a north african semi-arid region, using SPOT-vegetation NDVI data. Remote Sens 2011, 3, 2568–2590. [Google Scholar]
  13. Zhang, G.; Zhang, Y.; Dong, J.; Xiao, X. Green-up dates in the tibetan plateau have continuously advanced from 1982 to 2011. Proc. Natl. Acad. Sci. USA 2013, 110, 4309–4314. [Google Scholar]
  14. Yin, H.; Udelhoven, T.; Fensholt, R.; Pflugmacher, D.; Hostert, P. How normalized difference vegetation index (ndvi) trendsfrom advanced very high resolution radiometer (AVHRR) and système probatoire d’observation de la terre vegetation (spot vgt) time series differ in agricultural areas: An inner mongolian case study. Remote Sens 2012, 4, 3364–3389. [Google Scholar]
  15. Fensholt, R.; Rasmussen, K.; Nielsen, T.T.; Mbow, C. Evaluation of earth observation based long term vegetation trends—Intercomparing ndvi time series trend analysis consistency of sahel from avhrr gimms, terra modis and spot vgt data. Remote Sens. Environ 2009, 113, 1886–1898. [Google Scholar]
  16. Badeck, F.W.; Bondeau, A.; Böttcher, K.; Doktor, D.; Lucht, W.; Schaber, J.; Sitch, S. Responses of spring phenology to climate change. New Phytol 2004, 162, 295–309. [Google Scholar]
  17. Linderholm, H.W. Growing season changes in the last century. Agric. Forest Meteorol 2006, 137, 1–14. [Google Scholar]
  18. Parmesan, C. Ecological and evolutionary responses to recent climate change. Annu. Rev. Ecol. Evol. Syst. 2006, 637–669. [Google Scholar]
  19. Hu, Y.; Ban, Y.; Zhang, Q.; Zhang, X.; Liu, J.; Zhuang, D. Spatial—Temporal Pattern of Gimms NDVI and Its Dynamics in Mongolian Plateau. Proceedings of International Workshop on Earth Observation and Remote Sensing Applications, 2008, EORSA 2008, Beijing, China; 2008; pp. 1–6. [Google Scholar]
  20. Schwartz, M.D.; Hanes, J.M. Intercomparing multiple measures of the onset of spring in eastern north america. Int. J. Climatol 2010, 30, 1614–1626. [Google Scholar]
  21. Altangerel, B.; Sato, T.; Ishikawa, M.; Jamba, T. Performance of dynamic downscaling for extreme weather event in eastern mongolia: Case study of severe windstorm on 26 may 2008. SOLA 2011, 7, 117–120. [Google Scholar]
  22. Marin, A. Riders under storms: Contributions of nomadic herders’ observations to analysing climate change in mongolia. Glob. Environ. Change 2010, 20, 162–176. [Google Scholar]
  23. Sneath, D. State policy and pasture degradation in inner asia. Science 1998, 281, 1147–1148. [Google Scholar]
  24. Zhao, B.R.; Liu, C.; Liu, A.J.; Wang, Z.G. Estimate the yield of grassland using modis-ndvi-a case study of the grassland in xilinguole in inner mongolia. Pratacul Sci 2004, 21, 12. [Google Scholar]
  25. Lee, R.; Yu, F.; Price, K.; Ellis, J.; Shi, P. Evaluating vegetation phenological patterns in inner mongolia using NDVI time-series analysis. Int. J. Remote Sens 2002, 23, 2505–2512. [Google Scholar]
  26. Xin, C.; Zhihui, G.; Jin, C.; Jin, L.; Peijun, S. Analysis of human-induced steppe degradation based on remote sensing in Xilin Gole, Inner Mongolia, China. J. Plant Ecol 2005, 30, 268–277. [Google Scholar]
  27. Piao, S.; Mohammat, A.; Fang, J.; Cai, Q.; Feng, J. Ndvi-based increase in growth of temperate grasslands and its responses to climate changes in china. Glob. Environ. Change 2006, 16, 340–348. [Google Scholar]
  28. Jiang, N.; Zhu, W.; Zheng, Z.; Chen, G.; Fan, D. A comparative analysis between gimss ndvig and ndvi3g for monitoring vegetation activity change in the northern hemisphere during 1982–2008. Remote Sens 2013, 5, 4031–4044. [Google Scholar]
  29. Hirano, A.; Batbileg, B. Identifying trends in the distribution of vegetation in mongolia in the decade after its transition to a market economy. Japan Agric. Res. Q 2013, 47, 203–208. [Google Scholar]
  30. Mu, S.; Yang, H.; Li, J.; Chen, Y.; Gang, C.; Zhou, W.; Ju, W. Spatio-temporal dynamics of vegetation coverage and its relationship with climate factors in inner mongolia, china. J. Geogr. Sci 2013, 23, 231–246. [Google Scholar]
  31. Kang, M.; Dai, C.; Ji, W.; Jiang, Y.; Yuan, Z.; Chen, H.Y. Biomass and its allocation in relation to temperature, precipitation, and soil nutrients in Inner Mongolia grasslands, China. PLoS One 2013, 8. [Google Scholar] [CrossRef]
  32. Tucker, C.J.; Pinzon, J.E.; Brown, M.E.; Slayback, D.A.; Pak, E.W.; Mahoney, R.; Vermote, E.F.; El Saleous, N. An extended avhrr 8-km NDVI dataset compatible with modis and spot vegetation NDVI data. Int. J. Remote Sens 2005, 26, 4485–4498. [Google Scholar]
  33. Beck, H.E.; McVicar, T.R.; van Dijk, A.I.; Schellekens, J.; de Jeu, R.A.; Bruijnzeel, L.A. Global evaluation of four Avhrr–NDVI data sets: Intercomparison and assessment against landsat imagery. Remote Sens. Environ 2011, 115, 2547–2563. [Google Scholar]
  34. Wang, X.; Piao, S.; Ciais, P.; Li, J.; Friedlingstein, P.; Koven, C.; Chen, A. Spring temperature change and its implication in the change of vegetation growth in north america from 1982 to 2006. Proc. Natl Acad. Sci. USA 2011, 108, 1240–1245. [Google Scholar]
  35. Holben, B.; Kimes, D.; Fraser, R.S. Directional reflectance response in Avhrr red and near-IR bands for three cover types and varying atmospheric conditions. Remote Sens. Environ 1986, 19, 213–236. [Google Scholar]
  36. Cihlar, J.; Tcherednichenko, I.; Latifovic, R.; Li, Z.; Chen, J. Impact of variable atmospheric water vapor content on avhrr data corrections over land. IEEE Trans. Geosci. Remote Sens 2001, 39, 173–180. [Google Scholar]
  37. Holben, B.N. Characteristics of maximum-value composite images from temporal avhrr data. Int. J. Remote Sens 1986, 7, 1417–1434. [Google Scholar]
  38. Gobron, N.; Pinty, B.; Verstraete, M.M.; Widlowski, J.-L. Advanced vegetation indices optimized for up-coming sensors: Design, performance, and applications. IEEE Trans. Geosci. Remote Sens 2000, 38, 2489–2505. [Google Scholar]
  39. Huete, A.; Didan, K.; Miura, T.; Rodriguez, E.P.; Gao, X.; Ferreira, L.G. Overview of the radiometric and biophysical performance of the modis vegetation indices. Remote Sens. Environ 2002, 83, 195–213. [Google Scholar]
  40. Vermote, E.F.; El Saleous, N.Z.; Justice, C.O. Atmospheric correction of modis data in the visible to middle infrared: First results. Remote Sens. Environ 2002, 83, 97–111. [Google Scholar]
  41. Schaaf, C.B.; Gao, F.; Strahler, A.H.; Lucht, W.; Li, X.; Tsang, T.; Strugnell, N.C.; Zhang, X.; Jin, Y.; Muller, J.-P. First operational brdf, albedo nadir reflectance products from modis. Remote Sens. Environ 2002, 83, 135–148. [Google Scholar]
  42. Li, A.; Wu, J.; Huang, J. Distinguishing between human-induced and climate-driven vegetation changes: A critical application of restrend in inner mongolia. Landsc. Ecol 2012, 27, 969–982. [Google Scholar]
  43. Chen, J.; Jönsson, P.; Tamura, M.; Gu, Z.; Matsushita, B.; Eklundh, L. A simple method for reconstructing a high-quality ndvi time-series data set based on the Savitzky–Golay filter. Remote Sens. Environ 2004, 91, 332–344. [Google Scholar]
  44. Savitzky, A.; Golay, M.J. Smoothing and differentiation of data by simplified least squares procedures. Anal. Chem 1964, 36, 1627–1639. [Google Scholar]
  45. De Beurs, K.M.; Henebry, G.M. Spatio-Temporal Statistical Methods for Modelling Land Surface Phenology. In Phenological Research; Springer: Blacksburg, VA, USA, 2010; pp. 177–208. [Google Scholar]
  46. White, M.A.; Thornton, P.E.; Running, S.W. A continental phenology model for monitoring vegetation responses to interannual climatic variability. Global Biogeochem. Cy 1997, 11, 217–234. [Google Scholar]
  47. White, M.A.; de Beurs, K.M.; Didan, K.; Inouye, D.W.; Richardson, A.D.; Jensen, O.P.; O'Keefe, J.; Zhang, G.; Nemani, R.R.; van Leeuwen, W.J.D.; et al. Intercomparison, interpretation, and assessment of spring phenology in north america estimated from remote sensing for 1982–2006. Glob. Change Biol 2009, 15, 2335–2359. [Google Scholar]
  48. Vrieling, A.; de Beurs, K.M.; Brown, M.E. Variability of african farming systems from phenological analysis of ndvi time series. Clim. change 2011, 109, 455–477. [Google Scholar]
  49. Zhou, L.; Tucker, C.J.; Kaufmann, R.K.; Slayback, D.; Shabanov, N.V.; Myneni, R.B. Variations in northern vegetation activity inferred from satellite data of vegetation index during 1981 to 1999. J. Geophys. Res.-Atmos 2001, 106, 20069–20083. [Google Scholar]
  50. Alcaraz-Segura, D.; Liras, E.; Tabik, S.; Paruelo, J.; Cabello, J. Evaluating the consistency of the 1982–1999 ndvi trends in the iberian peninsula across four time-series derived from the avhrr sensor: Ltdr, gimms, fasir, and pal-ii. Sensors 2010, 10, 1291–1314. [Google Scholar]
  51. Baldi, G.; Nosetto, M.D.; Aragón, R.; Aversa, F.; Paruelo, J.M.; Jobbágy, E.G. Long-term satellite ndvi data sets: Evaluating their ability to detect ecosystem functional changes in south america. Sensors 2008, 8, 5397–5425. [Google Scholar]
  52. Li, J.; Wang, Y.; Qu, Z.; Ma, L. Characteristics of temporal and spatial distribution of drought occurrence in inner mongolia autonomous region. Agric. Res. Arid Areas 2010, 5, 266–272. [Google Scholar]
  53. Zhang, M. Drought Changes in Inner Mongolia in Last 60 Years; Inner Mongolia Normal University: Beijing, China, 2012. [Google Scholar]
  54. Zhao, X.; Tan, K.; Zhao, S.; Fang, J. Changing climate affects vegetation growth in the arid region of the northwestern china. J. Arid Environ 2011, 75, 946–952. [Google Scholar]
  55. Peng, S.; Piao, S.; Shen, Z.; Ciais, P.; Sun, Z.; Chen, S.; Bacour, C.; Peylin, P.; Chen, A. Precipitation amount, seasonality and frequency regulate carbon cycling of a semi-arid grassland ecosystem in Inner Mongolia, China: A modeling analysis. Agric. For. Meteorol. 2013, 178–179, 46–55. [Google Scholar]
  56. Li, S.; Xie, Y.; Brown, D.G.; Bai, Y.; Hua, J.; Judd, K. Spatial variability of the adaptation of grassland vegetation to climatic change in Inner Mongolia of China. Appl. Geogr 2013, 43, 1–12. [Google Scholar]
  57. Wu, Z.; Wu, J.; Liu, J.; He, B.; Lei, T.; Wang, Q. Increasing terrestrial vegetation activity of ecological restoration program in the Beijing–Tianjin sand source region of China. Ecol. Eng 2013, 52, 37–50. [Google Scholar]
  58. Liu, J.; Wu, J.; Wu, Z.; Liu, M. Response of ndvi dynamics to precipitation in the beijing–tianjin sandstorm source region. Int. J. Remote Sens 2013, 34, 5331–5350. [Google Scholar]
  59. Sneath, D. The End of Nomadism Society?: Society, State and The Environment in Inner Asia; Duke University Press: Cambridge, UK, 1999. [Google Scholar]
  60. Sneath, D. The “age of the market” and the regime of debt: The role of credit in the transformation of pastoral mongolia1. Soc. Anthropol 2012, 20, 458–473. [Google Scholar]
  61. Chuai, X.; Huang, X.; Wang, W.; Bao, G. NDVI, temperature and precipitation changes and their relationships with different vegetation types during 1998–2007 in Inner Mongolia, China. Int. J. Climatol 2012, 33, 1696–1706. [Google Scholar]
  62. Jeong, S.-J.; Ho, C.-H.; Gim, H.-J.; Brown, M.E. Phenology shifts at start vs. End of growing season in temperate vegetation over the northern hemisphere for the period 1982–2008. Glob. Chang. Biol 2011, 17, 2385–2399. [Google Scholar]
  63. Zeng, H.; Jia, G.; Epstein, H. Recent changes in phenology over the northern high latitudes detected from multi-satellite data. Environ. Res. Lett 2011, 6, 045508. [Google Scholar]
Figure 1. Location map of the Mongolian Plateau.
Remotesensing 05 05193f1
Figure 2. Annual variations in the Normalized Difference Vegetation Index (NDVI) based on Advanced Very High Resolution Radiometer (AVHRR) (1982–2006), Satellite pour l’ observation de la Terre (SPOT) (1998–2012) and Moderate Resolution Imaging Spectroradiometer (MODIS) (2001–2012) datasets on the Mongolian Plateau during (A), the planting growing season, (B) spring, (C) summer and (D) autumn.
Remotesensing 05 05193f2
Figure 3. Average Start of the Season Index (SOS) derived from AVHRR, SPOT and MODIS during 1982 to 2012.
Remotesensing 05 05193f3
Figure 4. NDVI and SOS annual trends among different satellites and different time intervals. Trends are only plotted when they are significant at the 90% level. MODIS NDVI slope value from 2000 to 2012 (A), MODIS SOS slope value from 2001 to 2012 (B), SPOT NDVI slope value from 2000 to 2012 (C), SPOT SOS slope value from 2001 to 2012 (D), AVHRR NDVI slope value from 1998 to 2006 (E), AVHRR SOS slope value from 1999 to 2006 (F), SPOT NDVI slope value from 1998 to 2006 (G) and SPOT SOS slope value from 1999 to 2006 (H).
Remotesensing 05 05193f4
Figure 5. NDVI scatter plots and regression lines for Inner Mongolia (AD) and Mongolia (EH) for the different sensors and periods as labeled. Only pixels where the slope of the trend in both sensors is significant at the 90% level are included.
Remotesensing 05 05193f5
Figure 6. Correlation coefficient from MODIS and SPOT, and GIMMS and SPOT, of the NDVI and SOS indices at the 90% level are included. (A) MODIS/SPOT NDVI linear correlation from 2000 to 2012; (B) AVHRR/SPOT NDVI linear correlation from 1989 to 2006; (C) MODIS/SPOT SOS linear correlation from 2001 to 2012; (D) AVHRR/SPOT SOS correlation from 1999 to 2006.
Remotesensing 05 05193f6
Figure 7. Annual variation of NDVI and SOS based on different sensors: AVHRR (1982–1997) and SPOT (1998–2012) for Mongolia Plateau (A), Inner Mongolia Province (B) and Mongolia (C).
Remotesensing 05 05193f7

