A Reliability-Based Multi-Algorithm Fusion Technique in Detecting Changes in Land Cover


Abstract
: Detecting land use or land cover changes is a challenging problem in analyzing images. Change-detection plays a fundamental role in most of land use or cover monitoring systems using remote-sensing techniques. The reliability of individual automatic change-detection algorithms is currently below operating requirements when considering the intrinsic uncertainty of a change-detection algorithm and the complexity of detecting changes in remote-sensing images. In particular, most of these algorithms are only suited for a specific image data source, study area and research purpose. Only a number of comprehensive change-detection methods that consider the reliability of the algorithm in different implementation situations have been reported. This study attempts to explore the advantages of combining several typical change-detection algorithms. This combination is specifically designed for a highly reliable change-detection task. Specifically, a fusion approach based on reliability is proposed for an exclusive land use or land cover change-detection. First, the reliability of each candidate algorithm is evaluated. Then, a fuzzy comprehensive evaluation is used to generate a reliable change-detection approach. This evaluation is a transformation between a one-way evaluation matrix and a weight vector computed using the reliability of each candidate algorithm. Experimental results reveal that the advantages of combining these distinct change-detection techniques are evident.1. Introduction
Land use or land cover change is an important area in global environmental change research. Inventory and monitoring of land use or land cover changes are indispensable aspects for further understanding change mechanisms and for modeling the effect of changes on the environment and associated ecosystems at different scales [1]. Remote sensing data provide a wide range of valuable information on the surface of the Earth; thus, detecting changes in land cover using remote sensing images as data sources is an effective and dominant approach in this research area. After more than 40 years of study, a variety of approaches to detect changes using two-date remote sensing imagery for different methods have been reported. These approaches can be grouped into four general types [2]: (1) Algebraic methods, which detect changes by implementing algebraic operations between remote-sensing images acquired from the same area at two different dates. Change vector analysis (CVA) and its derivatives are examples of well-known algebraic algorithms in change-detection, among other methods presented in [1,3–7]; (2) Classification methods, which include post-classification comparisons, such as those in [8–10], and direct two-time classifications, such as in [11]. In this method, the accuracy of the change-detection result strongly depends on the classification accuracy; (3) Transformation-based change-detection methods, such as principal component analysis (PCA)-based techniques mentioned in [11], multivariate alteration detection (MAD) transformation, as well as combined MAD and maximum autocorrelation analysis transformation techniques, such as those in [12–15]; and (4) Visualization change-detection methods, which can be grouped into two general types: temporal compositing techniques, such as those presented in [16] and visual interpretation-based techniques, such as those in [17,18]. In addition, based on the different applications, we can briefly classify the change-detection methods into direction-unrelated and direction-related methods. In the direction-unrelated methods, some applications are mainly concerning if changes have been occurred on multi-date images, e.g. change-detection for land use update [19], and Sinha [20] gave a comparative study for different binary change-detection methods in detecting land cover change/no-change information in different seasons. This is called “binary change-detection”. In the direction related methods, some applications are not only concerning in the changes, also in the direction of changes. Celik, et al.[21], Kempeneers, et al.[22] and Bovolo, et al.[23] presented direction of changes and used positive and negative signs to represent the different directions of change, in order to describe the growth and loss in forest, lake and crop. Moreover, for different application purposes, some non-spectral data have been used to detect changes, such as, in [24], laser altimetry data was used to detect the changes in ice sheet surface elevation changes. Also, the research of Frolking, et al. demonstrates that multiyear, active Ku-band microwave scatterometry can provide an important geophysical data record documenting change in tropical vegetation canopy status [25]. However, the purpose of this study is to develop a validity method for detecting changes in land cover in order to update land cover databases.
Evidently, a large number of change-detection techniques have been proposed as a result of the extensive research in change-detection. However, limitations are still observed in existing change-detection techniques, e.g., a typical method can only work well on specific images and study area. These techniques cannot take advantage of the performance of different methods to implement an accurate and reliable change-detection system for various images, research purposes and study area. Moreover, selecting a suitable threshold is the key to obtaining a highly accurate change-detection result. Improper thresholds result in low change-detection accuracies. However, selecting a proper threshold for change-detection is difficult.
Therefore, this work proposes a novel, reliability-based fusion change-detection approach, providing a technique for combining different individual change-detection algorithms. This combination aims to generate a comprehensive land cover change-detection method to further improve the performance, adaptability and reliability of exclusive land cover change-detection systems to obtain more accurate and reliable results than from individual methods. In addition, the proposed comprehensive methods do not need a threshold, because the fuzzy comprehensive evaluation technique is used in deciding whether a given pixel is changed or unchanged. This characteristic greatly reduces the uncertainty caused by improper threshold selection. The approach is then applied to actual land cover satellite images acquired from the same area at two or more different dates. Section 2 describes the proposed multi-algorithm fusion method and defines reliability indicators in measuring change-detection results. Section 3 tests the validity of the proposed approach by providing several case studies and gives experimental results. Discussions and conclusions are presented in the final section.
2. Methodology
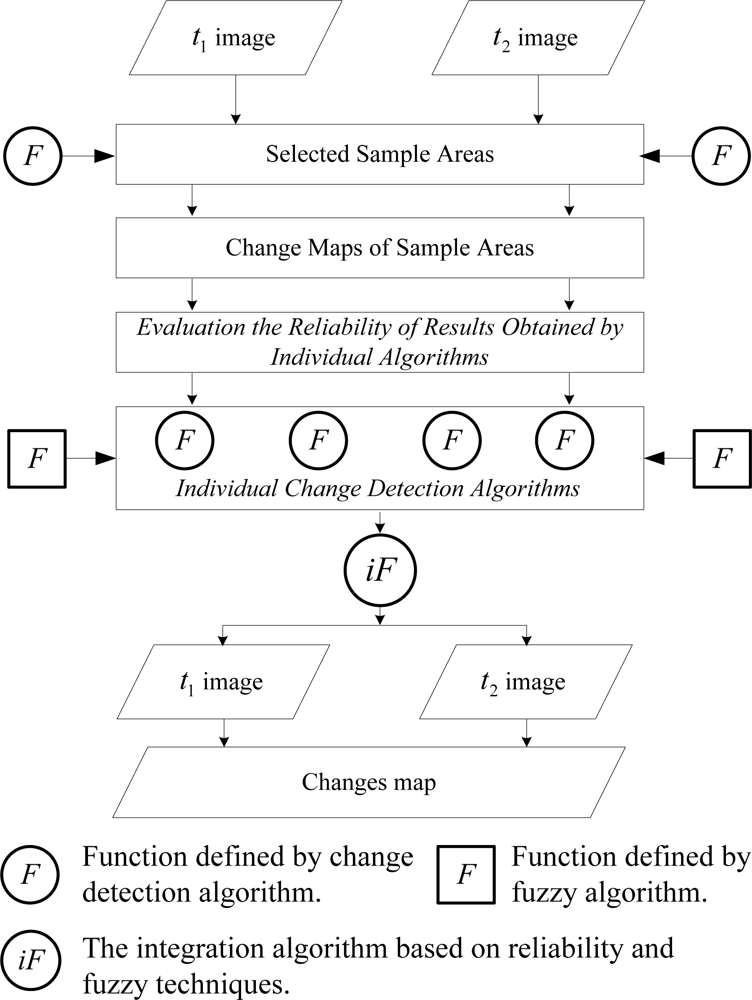
Two registered multi-spectral images, I1 and I2, acquired over the same area at two different dates, t1 and t2, respectively, are considered. Supposing that the size of the images is w × h and that the images are composed of b spectral bands, then the general idea of the proposed approach is shown in Figure 1.
In Figure 1, the reliability of each change-detection algorithm is the basis of the multi-algorithm fusion, that is, evaluating the reliability of each candidate algorithm in detecting land cover changes from two-date images is the precondition of the proposed method. Thus, several sample areas need to be selected from the given two-date images. Each individual algorithm is applied on the areas to detect the changes. Results obtained using each candidate algorithm from the sample areas are used to evaluate the reliability of each candidate algorithm in change-detection. Subsequently, the weight of each candidate algorithm is determined using the reliability of each algorithm in a fuzzy comprehensive evaluation. A reliability-based, fuzzy comprehensive change-detection technique is thus generated. Finally, the fusion method is applied on the given two-date images to detect changes in land cover or land use.
2.1. Definitions of Reliability and Evaluation Indicators
Reliability is defined as the probability that an item can perform its intended function for a specified interval under given conditions [26,27]. In a similar manner, change-detection reliability can be defined as the probability of an algorithm or method to detect changes from specified satellite images under given conditions. Thus, this work proposes measuring the reliability of a change-detection algorithm using the following quantized indicators to evaluate the reliability of a change-detection algorithm:
Integrality (R) refers to the probability of an algorithm or method to correctly detect changes from specified satellite imagery data under the given conditions. Let Ncorrectly_dc be the number of changed pixels correctly detected by the algorithm and Nactual_c be the number of actual changed pixels in the specified images, we then obtain:
In practice, Ncorrectly_dc ≤ Nactual_c is always satisfied; thus, the value of R must be in [0, 1].Correctness (O) refers to the probability of correctly detecting changed pixels in all detected changed pixels. Let Ndetected_change_pixel be the number of detected change pixels by the algorithm, then, the correctness of a change-detection algorithm is defined as:
Error detection rate (E) refers to the probability of incorrectly detecting changed pixels by an algorithm in the overall pixels of an image. Let Nincorrectly_dc be the number of incorrectly detected pixels, then, the error detection rate is defined as:
Consistency ( C ) refers to the ability of an algorithm to maintain its performance in detecting changes when applied to different areas under the given conditions. Let r1 ={R, O, E} and r2 ={R, O, E} represent the vector consisting of reliability indicators obtained at two different sample areas, regardless of whether the land cover classes are the same or different. Then, the consistency of a change-detection algorithm is defined as:
where d(r1, r2) is the Euclidean distance between vectors r1 and r2.
Evidently, the values of R, O, E and C are within the range of [0, 1]. Larger R, O and C values lead to a higher reliability of the algorithm. By contrast, smaller E values lead to a higher reliability of the algorithm.
2.2. Proposed Reliability-Based Fuzzy Comprehensive Change-Detection Technique
Unlike traditional individual change-detection methods, the purpose of the proposed fusion method is to solve problems, such as threshold selection, accuracy and reliability of change-detection results and to generate a robust change-detection algorithm that suits different image data sources, study areas and research purposes. These goals are challenging problems faced by most individual change-detection algorithms. Furthermore, uncertainties widely exist in the entire change-detection procedure, such as difference in geometry, radiometry and resolution between two-date images, as well as the performance of the change-detection method. These uncertainties make fuzziness a common issue or basic characteristic in change-detection. In other words, using a certain threshold to decide whether a pixel is changed or unchanged based on a change-detection algorithm result is difficult. However, we can conclude the possibility of change. Therefore, overcoming these limitations in most individual change-detection algorithms requires introducing a fuzzy comprehensive evaluation combined with a reliability-based weight to solve the fuzziness issue in change decision. The following procedure shows the specific steps of the proposed change-detection method.
Evaluation indicator (EI). Consider a pixel, Ii, in t1 image, in the fuzzy comprehensive evaluation technique to evaluate whether the considered pixel is changed or unchanged. Several indicators should be set. Taking into account the purpose of this study, results computed using selected individual candidate change-detection algorithms are considered to evaluate whether a pixel is changed. Suppose that x = [xi]1 ×n represents selected individual candidate algorithms used to compare the given pixel Ii, with its corresponding pixel in the t2 image to decide if change has occurred, then, the evaluation indicator set is defined as:
Evaluation grade (EG). The ultimate objective of the case is to determine if object, x, has changed; thus, changed, half-changed, unchanged, and so on, may be considered as assessment grades to create an evaluation grade, which is set as follows:
where gJ represents the change grade.One-way evaluation matrix. Let ai,j be the possibility of a change that occurred over a pixel, which is computed by comparing x with its corresponding pixel in the t2 image using the individual candidate change-detection algorithm, i; thus, the one-way evaluation matrix A of this case is given by:
Reliability-based fuzzy comprehensive evaluation. The purpose of the proposed change-detection approach is to improve the reliability and accuracy of the obtained change map. For this purpose, this study proposes a reliability-weighted fuzzy comprehensive evaluation approach to use the advantages of different individual candidate change-detection algorithms employed in comparing two-date images. Let w = [wi]1 ×n be the weight of selected individual candidate algorithms determined by the aforementioned reliability factors through a fuzzy transformation between w and one-way evaluation matrix A, we obtain a fuzzy evaluation set, s, as:
where sJ represents the membership grade. We can then conclude that a change occurred over a pixel according to the principle of maximum membership.
2.3. Accuracy Assessment Methods
Selecting a proper method to assess the accuracy of results obtained by different methods is a key procedure of change-detection. Almutairi [28] stated that the results of the accuracy analysis can be summarized by an overall accuracy percentage and a kappa statistic. In this study, the overall accuracy and kappa coefficient [29,30] were introduced to the study. Here, overall accuracy is defined to be the percentage of pixels correctly detected. Let pa be the proportion of agreement, pe be the chance agreement, and the kappa coefficient is defined as the proportion of agreement among raters after chance agreement has been removed [30], which can be expressed as:
3. Case Study
3.1. Area and Data
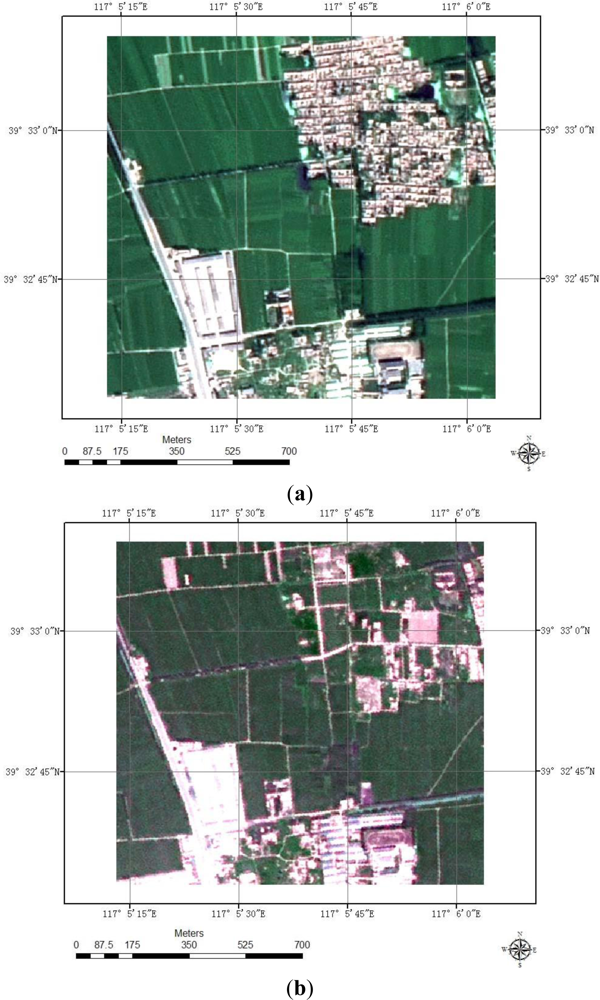
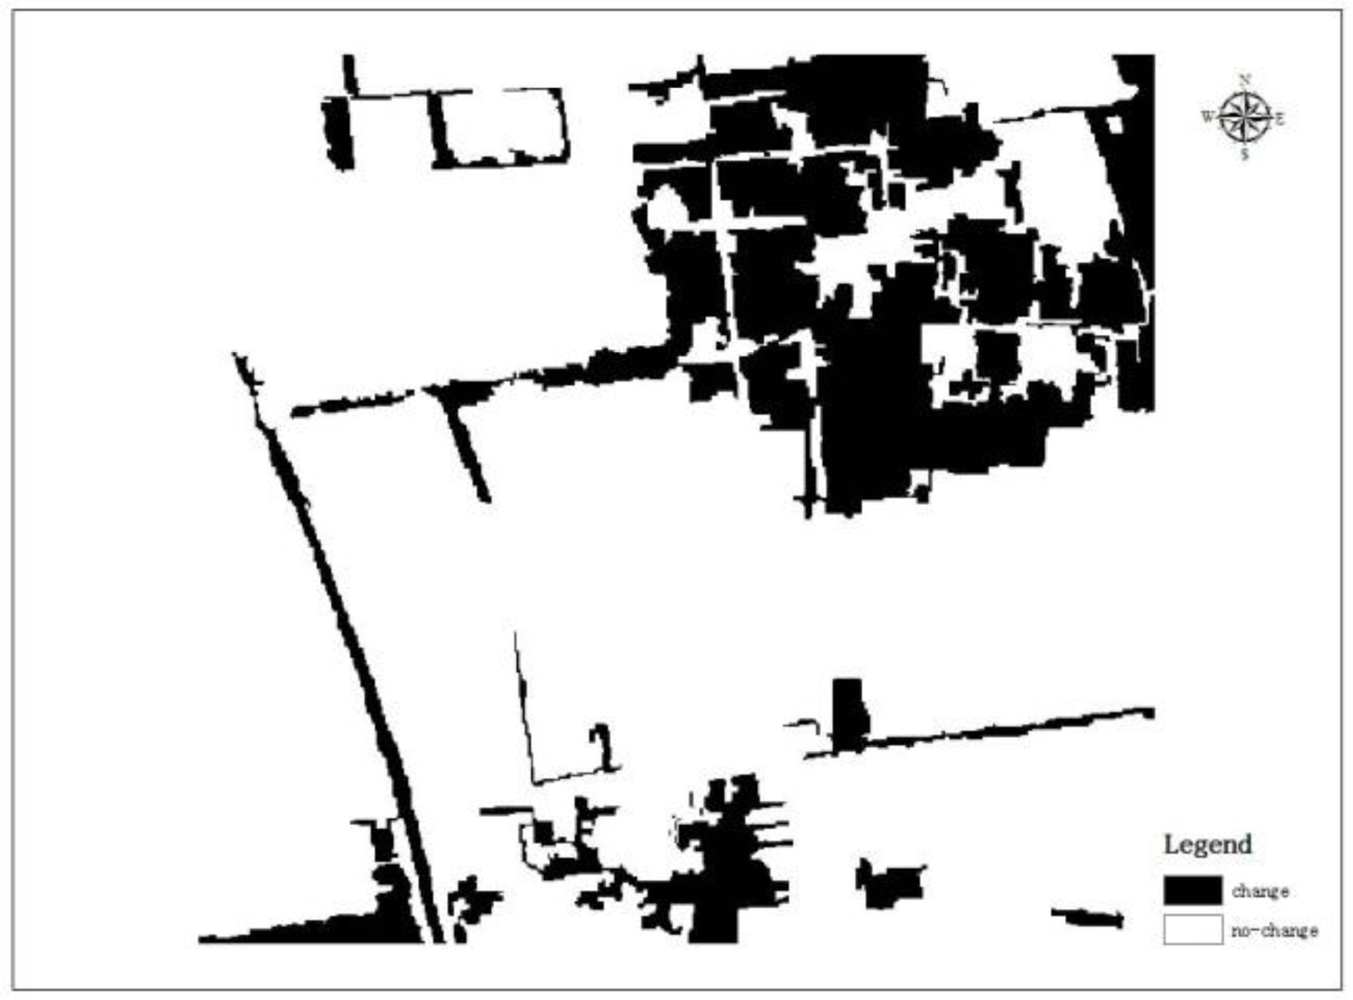
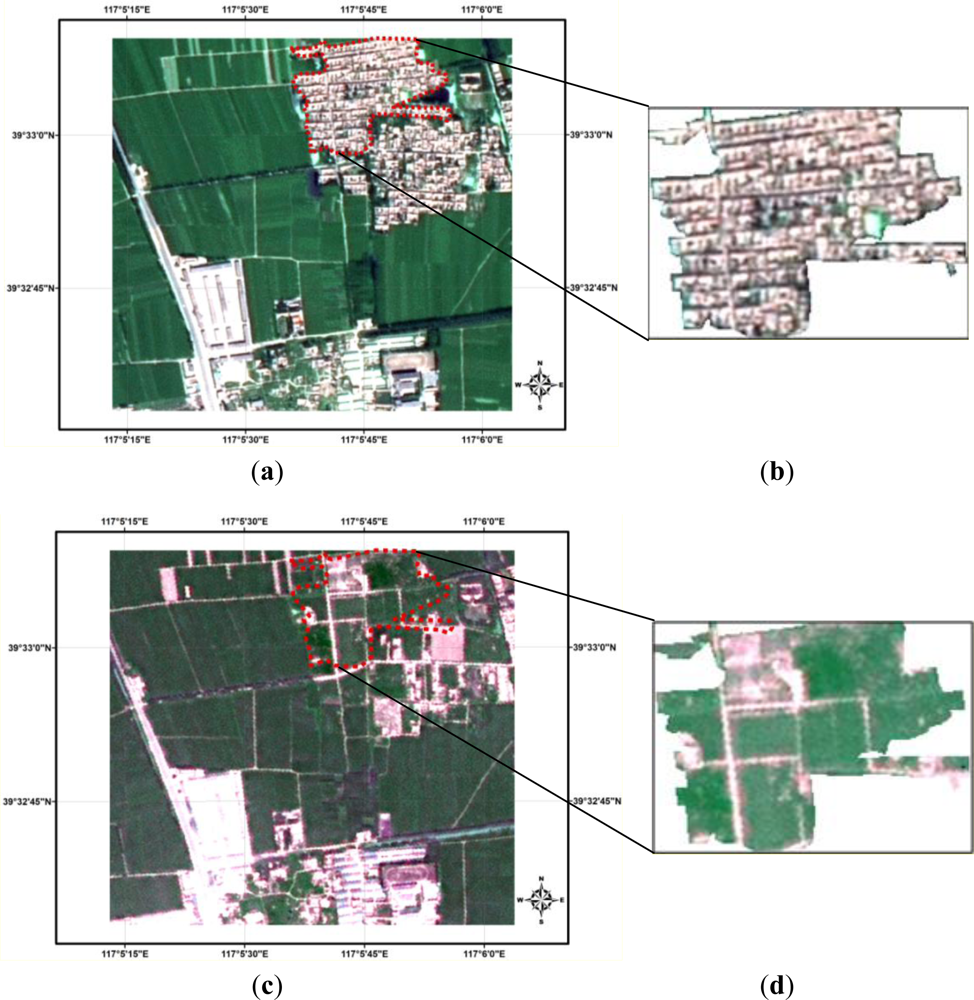
The following sections quantitatively analyze a specific application of the proposed multi-algorithm integrated approach and its potential effects on land cover change-detection. In this study, two ortho-rectified 2.5 m SPOT 5 spatial resolution satellite images were obtained in order to generate a land cover map of WuQin district in Tianjin, China for the years 2009 (t1 image, Figure 2(a)) and 2010 (t2 image, Figure 2(b)). Reference data is always a problem for accuracy assessment of land cover change-detection; inaccurate reference data will lead to improper assessment result. To assess the accuracy of different methods in land cover change-detection, we prepared a man-made change map (Figure 3) as reference data for the accuracy assessment. Since change of land cover is the main focus of this study, so, in the manual interpretation, areas where land cover classes are different in two-date images have been labeled as change areas (e.g., Figure 4).
3.2. Case of Individual Algorithms
In this study, we selected two typical change-detection algorithms to participate in testing the validity of the proposed reliability-based multi-algorithm fusion technique. The following descriptions introduce these two algorithms and the obtained change maps after using them.
CVA is a typical algorithm in algebra-based change-detection method. It is a multivariate change-detection technique that processes the full dimension (spectral + temporal) of the image data and produces two outputs: change magnitude and change direction [31]. The central idea of CVA, which was given by Malila (1980), states that given multi-date pairs of spectral measurements, one computes spectral change vectors and compares their magnitudes to a specified threshold criterion. The decision that a change has occurred is made when that threshold is exceeded [3].The major advantage of the CVA algorithm is its capability to analyze change concurrently in all data layers as opposed to selected bands [31]. In this case, we first generated change vector map using RGB (red, green, blue) features of corresponding pixels in the t1 and t2 image. Then, pixels with a magnitude of change vector exceeding the given threshold (here, it is 1.2-times the average of all change vectors) would be determined as change pixels. Here, we considered the average of the 1.2-times repetition of the change magnitude as the threshold. After applying the standardized CVA algorithm presented in [1] to the two-date imagery shown in Figure 2(a,b), we obtained the change map shown in Figure 5(a).
PCA-based change-detection, which captures maximum variances in a finite number of orthogonal components based on an eigenvector analysis of the data correlation matrix has been used in change-detection for many years and has become one of the most popular techniques, because of its simplicity and capability in enhancing information on change [32]. A standardized PCA of regional-to-continental scale time series using wide-angle sensors proved to be a powerful technique in separating changes taking place at different time frequencies [31]. Thus, the authors recommended the PCA approach as a candidate algorithm, because it identifies change in a more consistent and interpretable manner. The central idea of the principal components is usually calculated using a variance-covariance matrix. The standardization of the covariance matrix into a correlation matrix achieved by division with the appropriate standard deviation reduces all variables to equal importance as measured by scale. As a result, the dimensionality of a data set consisting of a large number of interrelated variables is also reduced, while retaining as much as possible of the variation present in the data set [32,33]. In this case, the PCA transformation algorithm was initially implemented on two-date images to obtain transformed images using ENVI software. Subsequently, the image difference was implemented between the two-date transformed images to obtain the change map shown in Figure 5(b). In the change map generation, we considered 1.2-times the average difference in whole images as the threshold in transformed image difference.
3.3. Reliability-Based Multi-Algorithm Fusion
The fusion of multiple change-detection algorithms to generate a highly reliable and accurate method for detecting changes is the central idea of the proposed approach. The reliability of each individual algorithm is the basis of the fusion. Thus, the proposed approach must first assess the reliability of each candidate algorithm. The next step is to combine the selected candidate algorithms based on reliability to generate a new, more reliable change-detection approach.
3.3.1. Reliability and Weight Evaluation
In general, we consider selecting several sample areas from the given two-date images to evaluate the reliability of the individual candidate algorithms. The size of the selected study area is small; thus, the entire area of the two-date images is used in evaluating reliability. Comparing the results shown in Figure 5 with the reference change map in Figure 3 and combining the definition of reliability factors described in Section 2.2, we obtain the value for each reliability factor and accuracy factor of the two aforementioned candidate algorithms. These values are shown in rows 1–2 of Table 1.
Based on the definition of reliability factors, we note that the error detection rate depends on correctness rate values. Thus, in this case, only integrality, correctness and consistency are used to determine the weight of each individual candidate algorithm. The weight of each individual candidate algorithm is estimated using the entropy of each algorithm. Let ei be the entropy computed based on reliability indices of algorithm i, then, we obtain:
In addition, let vi be the information utility value of candidate algorithm, i, then we have:
The information utility value of a candidate algorithm directly determines its weight in the fusion algorithm. Generally, the larger the value of information utility, the greater the importance of the algorithm in evaluation and the greater weight is given to this algorithm in algorithm fusion. Thus, the weight of each individual algorithm is defined as:
Based on the reliability of each candidate algorithm combined with the aforementioned weighting method, we obtain the weight vector consisting of the weights of the selected candidate algorithms (CVA- and PCA-based algorithms) as:
3.3.2. Fusion Algorithms and Obtaining Reliable Result
The idea of multi-algorithm fusion is to combine candidate change-detection algorithms to generate an integration approach based on the reliability of each candidate algorithm in change-detection. The specific idea can be summarized as follows:
In setting EI, the selected algorithms (CVA-based and PCA-based) consist of the EI. In other words, let ucva and upca be the selected CVA- and PCA-based algorithms, then we have:
In setting EG, changed and unchanged are generally two common assessment aspects for a given pixel or object, x, n change-detection. Thus, when setting changed and unchanged as the evaluation grades in this study, we then obtain:
To compute the value of each element in A, the value of each element in the one-way evaluation matrix, A, is expressed by comparing the properties of the given pixel in the t1 image and its corresponding pixel in the t2 image using the selected candidate algorithms. Specifically, the changed grade of a pixel is expressed by N(an, 1), which is a normalized value compared with the corresponding pixels in t1 and t2 images using each candidate algorithm in EI. Conversely, the unchanged grade of a pixel can be expressed as 1 − N(an, 1). We thus obtain the one-way evaluation matrix of this case as:
To compute for the fuzzy evaluation set of a pixel and to determine if change has occurred, a fuzzy transformation between w, shown in Equation (14), and A, shown in Equation (17), is implemented to obtain a 1 × 2 fuzzy evaluation set, s, and to determine if the pixel has changed based on the maximum membership principle.
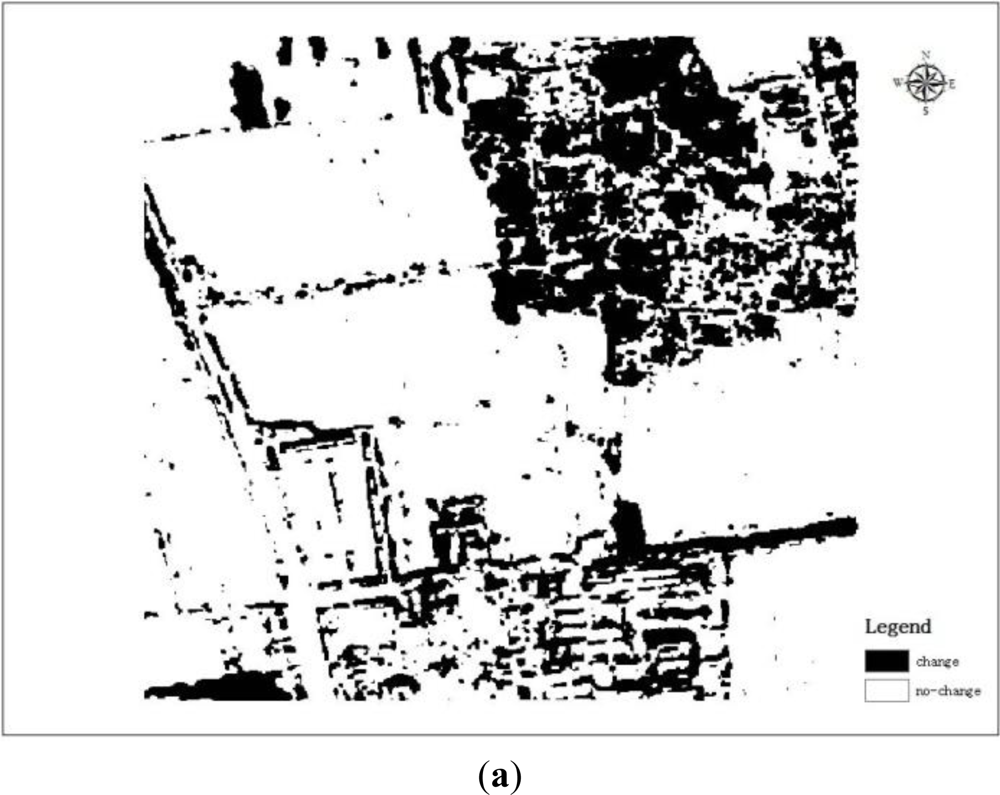
Figure 6(a) shows the change maps obtained using the proposed fusion approach. Table 1 shows the comparison of reliability and accuracy between the results obtained using the proposed fusion approach and each selected individual algorithm.
Evidently, regardless of overall reliability or accuracy values, the proposed method is better than every individual algorithm using the same data source and experimental conditions. The proposed method is applied to another actual data set 2 (Figure 7) to further test it, and similar result are obtained, which are shown in Figure 6(b) and Table 2.
Next, the overall accuracy and kappa coefficient mentioned in Section 2.3 were used to assess the accuracy of change-detection results by applying each individual method and fusion method into different data. The results are shown in Tables 1 and 2. Finally, to further illustrate the validity of the proposed reliability-based fusion approach, we compare it with the post-classification change-detection approach, whose classifier is the support vector machine (SVM) [34], by applying them to data set 2 (Figure 7) under the same conditions. The accuracy of the SVM-based approach is shown on the last row of Table 2. From the results of our experiments, we can conclude that the proposed approach is validity.
4. Conclusions
A timely and accurate land cover or land use change-detection system is extremely important in understanding relationships and interactions between humans and natural phenomena and providing useful information for environmental protection, land planning and decision-making at local, regional, national and global levels [32]. However, land cover change-detection is a difficult and complex task without comprehensive considerations. Thus, the proposed fusion approach attempts to take advantage of the fuzzy comprehensive evaluation technique and the reliability of change-detection methods to overcome the aforementioned limitations in existing change-detection approaches. The results of three experiments using two set of data and comparing with each single candidate change-detection algorithms and the SVM-based post-classification change-detection algorithm showed that, regardless, single candidate algorithms and the SVM algorithm could produce higher reliable and accuracy results than the proposed fusion approach. The main contributions of the proposed approach includes that this study proposes and defines preliminary evaluation indicators for reliability evaluation of change-detection algorithms in detecting changes in specific two-date images; the consideration of reliability of a change-detection algorithm in a multi-algorithm fusion method may make the fusion method well adapted to different image sources, study areas and research purposes; comparing with most change-detection methods, this study solves the selection of a threshold in a change decision by using a fuzzy comprehensive evaluation technique.
In addition, considering three reliability indexes listed above and applied to SPOT 5 spectral images acquired at the one area, the overall accuracy and kappa coefficient of the change-detection results were 0.78856 and 0.787185, respectively. For data of another area, the overall accuracy and kappa coefficient were more than 0.89, and it is nearly 0.2 higher than the estimates of SVM-based post-classification approach.
However, some limitations exist in the proposed fusion technique. First, the proposed method cannot solve the fusion of post-classification change-detection algorithms, because different feature classes are given various new labels, thus losing the original information. In addition, the reliability indices proposed in the paper are very simple, and their scientificity should be further evaluated. Therefore, improving the definition of reliability should be the focus of future studies.
Acknowledgments
The authors greatly appreciate the support of all members of our research group. The authors would also like to thank the reviewers for their helpful comments and suggestions, which improved the presentation of this paper. This work was supported by the National Key Technologies R&D Program of China for the 12th Five-year Plan (2012BAJ15B04).
References
- Chen, J.; Gong, P.; He, C.; Pu, R.; Shi, P. Land use/land cover change-detection using improved change-vector analysis. Photogramm. Eng. Remote Sensing 2003, 69, 369–380. [Google Scholar]
- Menz, G. A Review of Techniques and Challenges in Change-detection. Proceedings of Change-Detection Symposium, Hong Kong, 15–16 December 2011.
- Malila, W.A. Change Vector Analysis: An Approach for Detecting Forest Changes with Landsat. Proceedings of the Sixth Internationl Symposium on Machine Processing of Remotely Sensed Data, West Lafayette, IN, USA, 3–6 June 1980; pp. 326–335.
- Johnson, R.D.; Kasischke, E. Change vector analysis: A technique for the multispectral monitoring of land cover and condition. Int. J. Remote Sens 1998, 19, 411–426. [Google Scholar]
- Silva, P.; Santos, J.; Shimabukuro, Y.; Souza, P.; Graca, P. Change Vector Analysis Technique to Monitor Selective Logging Activities in Amazon. Proceedings of 2003 IEEE International Geoscience and Remote Sensing Symposium (IGARSS’03), Toulouse, France, 21–25 July 2003; 4, pp. 2580–2582.
- Siwe, R.N.; Koch, B. Change vector analysis to categorise land cover change processes using the tasselled cap as biophysical indicator: Description: Implementing Landsat TM and ETM to detect land cover and land use changes in the mount Cameroon region using the CVA technique with the tasselled cap as biophysical indicator. Environ. Monit. Assess 2008, 145, 227–235. [Google Scholar]
- He, C.; Wei, A.; Shi, P.; Zhang, Q.; Zhao, Y. Detecting land use/land cover change in rural-urban fringe areas using extended change-vector analysis. Int. J. Appl. Earth Obs 2011, 13, 572–585. [Google Scholar]
- Khalyani, A.H.; Falkowski, M.J.; Mayer, A.L. Classification of Landsat images based on spectral and topographic variables for land cover change-detection in Zagros forests. Int. J. Remote Sens 2012, 33, 6956–6974. [Google Scholar]
- Yang, Y.; Zhou, Q.; Gong, J.; Wang, Y. An integrated spatio-temporal classification method for urban fringe change-detection analysis. Int. J. Remote Sens 2012, 33, 2516–2531. [Google Scholar]
- Zhou, H.; Jiang, H.; Zhou, G.; Song, X.; Yu, S.; Chang, J.; Liu, S.; Jiang, Z.; Jiang, B. Monitoring the change of urban wetland using high spatial resolution remote sensing data. Int. J. Remote Sens 2010, 31, 1717–1731. [Google Scholar]
- Li, X.; Yeh, A. Principal component analysis of stacked multi-temporal images for the monitoring of rapid urban expansion in the Pearl River Delta. Int. J. Remote Sens 1998, 19, 1501–1518. [Google Scholar]
- Lunetta, R.S.; Knight, J.F.; Ediriwickrema, J.; Lyon, J.G.; Worthy, L.D. Land cover change-detection using multi-temporal MODIS NDVI data. Remote Sens. Environ 2006, 105, 142–154. [Google Scholar]
- Nielsen, A.A. Kernel maximum autocorrelation factor and minimum noise fraction transformations. IEEE Trans. Image Process 2011, 20, 612–624. [Google Scholar]
- Nielsen, A.A.; Conradsen, K.; Simpson, J.J. Multivariate alteration detection (MAD) and MAF postprocessing in multispectral, bitemporal image data: New approaches to change-detection studies. Remote Sens. Environ 1998, 64, 1–19. [Google Scholar]
- Nori, W.; El Nour Elsiddig, I.N. Detection of land cover changes using multi-temporal satellite imagery. Int. Arch. Photogram. Remote Sens. Spat. Inform. Sci 2008, 37, 947–951. [Google Scholar]
- Dennison, P.E.; Roberts, D.A.; Peterson, S.H. Spectral shape-based temporal compositing algorithms for MODIS surface reflectance data. Remote Sens. Environ 2007, 109, 510–522. [Google Scholar]
- Panigrahy, R.K.; Kale, M.P.; Dutta, U.; Mishra, A.; Banerjee, B.; Singh, S. Forest cover change-detection of Western Ghats of Maharashtra using satellite remote sensing based visual interpretation technique. Curr. Sci 2010, 98, 657–664. [Google Scholar]
- Şirinyıldıza, T. Change-Detection Analysis by Using IKONOS Imagery. Proceeding of XXth ISPRS Congress—Geo-Imagery Bridging Continents, Istanbul, Turkish, 12–23 July 2004; pp. 12–23.
- Matikainen, L.; Hyyppa, J.; Ahokas, E.; Markelin, L.; Kaartinen, H. Automatic detection of buildings and changes in buildings for updating of maps. Remote Sens 2010, 2, 1217–1248. [Google Scholar]
- Sinha, P.; Kumar, L. Binary images in seasonal land cover change identification: a comparative study in parts of New South Wales, Australia. Int. J. Remote Sens 2013, 34, 2162–2186. [Google Scholar]
- Celik, T.; Ma, K.K. Unsupervised change-detection for satellite images using dual-tree complex wavelet transform. IEEE Trans. Geosci. Remote Sens 2010, 48, 1199–1210. [Google Scholar]
- Pieter Kempeneers, F.S.; Strobl, Peter; McInerney, Daniel O.; San-Miguel-Ayanz, Jesús. increasing robustness of post classification change-detection using time series of land cover maps. IEEE Trans. Geosci. Remote Sens 2012, 50, 13. [Google Scholar]
- Bovolo, F.; Bruzzone, L. A theoretical framework for unsupervised change-detection based on change vector analysis in the polar domain. IEEE Trans. Geosci. Remote Sens 2007, 45, 218–236. [Google Scholar]
- Schenk, T.; Csatho, B. A new methodology for detecting ice sheet surface elevation changes from laser altimetry data. IEEE Trans. Geosci. Remote Sens 2012, 50, 3302–3316. [Google Scholar]
- Frolking, S.; Hagen, S.; Milliman, T.; Palace, M.; Shimbo, J.Z.; Fahnestock, M. Detection of large-scale forest canopy change in pan-tropical humid forests 2000–2009 with the seawinds KU-band scatterometer. IEEE Trans. Geosci. Remote Sens 2012, 50, 2603–2617. [Google Scholar]
- Barnard, R.W.A. Reliability Engineering: Futility and Error. Proceedings of International Council on Systems Engineering (INCOSE)-Second Annual Chapter Conference, Cape Town, South Africa, 31 August–1 September 2004; pp. 1–7.
- Mil-Hdbk-338B, Electronic Design Reliability Handbook; Barringer and Associates, Inc.: Humble, TX, USA, 1998.
- Almutairi, A.; Warner, T.A. Change-detection accuracy and image properties: A study using simulated data. Remote Sens 2010, 2, 1508–1529. [Google Scholar]
- Foody, G.M. Status of land cover classification accuracy assessment. Remote Sens. Environ 2002, 80, 185–201. [Google Scholar]
- Haley, S.M.; Osberg, J.S. Kappa coefficient calculation using multiple ratings per subject: a special communication. Physical Therapy 1989, 69, 970–974. [Google Scholar]
- Corresponding, P.C.; Jonckheere, I.; Nackaerts, K.; Muys, B.; Lambin, E. Review ArticleDigital change-detection methods in ecosystem monitoring: A review. Int. J. Remote Sens 2004, 25, 1565–1596. [Google Scholar]
- Deng, J.; Wang, K.; Deng, Y.; Qi, G. PCA—Based land use change-detection and analysis using multitemporal and multisensor satellite data. Int. J. Remote Sens 2008, 29, 4823–4838. [Google Scholar]
- Mas, J.F. Monitoring land cover changes: A comparison of change-detection techniques. Int. J. Remote Sens 1999, 20, 139–152. [Google Scholar]
- Srivastava, P.K.; Han, D.; Ramirez, M.R.; Bray, M.; Islam, T. Selection of classification techniques for land use/land cover change investigation. Adv. Space Res 2012, 50, 1250–1265. [Google Scholar]


| Methods | Integrality | Correctness | Consistency | Error Detection Rate | Overall Accuracy | Kappa |
|---|---|---|---|---|---|---|
| CVA-algorithm | 0.497291 | 0.457155 | 0.647084 | 0.129322 | 0.760583 | 0.756656 |
| PCA-algorithm | 0.609330 | 0.355154 | 0.485954 | 0.242294 | 0.672147 | 0.662357 |
| Fusion-method | 0.600460 | 0.514805 | / | 0.123939 | 0.788560 | 0.787185 |
| Methods | Integrality | Correctness | Consistency | Error Detection Rate | Overall Accuracy | Kappa |
|---|---|---|---|---|---|---|
| CVA-algorithm | 0.506653 | 0.393433 | 0.819539 | 0.113262 | 0.815203 | 0.820524 |
| PCA-algorithm | 0.713248 | 0.294357 | 0.793646 | 0.24792 | 0.710498 | 0.709368 |
| Fusion-method | 0.637662 | 0.656498 | / | 0.048379 | 0.899083 | 0.898786 |
| SVM-algorithm | 0.570045 | 0.466003 | / | 0.050965 | 0.871606 | 0.869150 |
Share and Cite
Zhang, P.; Shi, W.; Wong, M.S.; Chen, J. A Reliability-Based Multi-Algorithm Fusion Technique in Detecting Changes in Land Cover. Remote Sens. 2013, 5, 1134-1151. https://0-doi-org.brum.beds.ac.uk/10.3390/rs5031134
Zhang P, Shi W, Wong MS, Chen J. A Reliability-Based Multi-Algorithm Fusion Technique in Detecting Changes in Land Cover. Remote Sensing. 2013; 5(3):1134-1151. https://0-doi-org.brum.beds.ac.uk/10.3390/rs5031134
Chicago/Turabian StyleZhang, Penglin, Wenzhong Shi, Man Sing Wong, and Jiangping Chen. 2013. "A Reliability-Based Multi-Algorithm Fusion Technique in Detecting Changes in Land Cover" Remote Sensing 5, no. 3: 1134-1151. https://0-doi-org.brum.beds.ac.uk/10.3390/rs5031134