Article

Stray Light Artifacts in Imagery from the Landsat 8 Thermal Infrared Sensor

1
Sigma Space Corporation, NASA Goddard Space Flight Center, 8800 Greenbelt Road, Greenbelt, MD 20771, USA
2
Chester F. Carlson Center for Imaging Science, Rochester Institute of Technology, 54 Lomb Memorial Drive, Rochester, NY 14623, USA
3
Catholic University of America, NASA Goddard Space Flight Center, 8800 Greenbelt Road, Greenbelt, MD 20771, USA
4
NASA Goddard Space Flight Center, 8800 Greenbelt Road, Greenbelt, MD 20771, USA
*
Author to whom correspondence should be addressed.
Remote Sens. 2014, 6(11), 10435-10456; https://0-doi-org.brum.beds.ac.uk/10.3390/rs61110435
Submission received: 6 August 2014 / Revised: 15 October 2014 / Accepted: 16 October 2014 / Published: 29 October 2014
(This article belongs to the Special Issue Landsat-8 Sensor Characterization and Calibration)

Abstract

:
The Thermal Infrared Sensor (TIRS) has been collecting imagery of the Earth since its launch aboard Landsat 8 in early 2013. In many respects, TIRS has been exceeding its performance requirements on orbit, particularly in terms of noise and stability. However, several artifacts have been observed in the TIRS data which include banding and absolute calibration discrepancies that violate requirements in some scenes. Banding is undesired structure that appears within and between the focal plane array assemblies. In addition, in situ measurements have shown an error in the TIRS absolute radiometric calibration that appears to vary with season and location within the image. The source of these artifacts has been determined to be out-of-field radiance that scatters onto the detectors thereby adding a non-uniform signal across the field-of-view. The magnitude of this extra signal can be approximately 8% or higher (band 11) and is generally twice as large in band 11 as it is in band 10. A series of lunar scans were obtained to gather information on the source of this out-of-field radiance. Analyses of these scans have produced a preliminary map of stray light, or ghost, source locations in the TIRS out-of-field area. This dataset has been used to produce a synthetic TIRS scene that closely reproduces the banding effects seen in actual TIRS imagery. Now that the cause of the banding has been determined, a stray light optics model is in development that will pin-point the cause of the stray light source. Several methods are also being explored to correct for the banding and the absolute calibration error in TIRS imagery.

Graphical Abstract

1. Introduction

The Thermal Infrared Sensor (TIRS) is the thermal instrument onboard the Landsat 8 observatory. The sensor was designed to continue broadband, long wave infrared measurements of the Earth for the Landsat program. The instrument operates in a push-broom imaging fashion to acquire Earth data in two thermal channels. TIRS has been operationally collecting Earth scene thermal infrared imagery since its activation in March 2013.
After completing the initial on-orbit checkout and calibration activities, banding artifacts were noticed in Earth imagery that seemed to vary from scene to scene. All indications from the instrument telemetry showed that TIRS was thermally and electrically stable and that the radiometric response to the onboard calibration sources was also stable [1]. Modifications to the radiometric calibration parameters of the instrument failed to account for the effects. The suspected cause of the banding artifacts was stray light, or radiance from outside the instrument field-of-view producing an additional non-uniform “ghost” signal on the detectors. The stray light directly affects certain aspects of the instrument performance including the uniformity [1] and the absolute calibration [2]. This paper provides an overview of the investigation which led to the identification of the stray light issue and early attempts at developing a correction methodology.

1.1. TIRS Instrument Design

Key aspects of the instrument design related to the stray light discussion are summarized here while a detailed description of the instrument is available in reference [3]. The optical system contains three germanium (Ge) lenses and one zinc selenide (ZnSe) lens held by brackets, shells, and retaining rings into a telescope structure. The telescope has an effective focal length of 177.6 mm and produces an f/1.64 beam. A flat mirror, known as the Scene Select Mechanism (SSM), attached to the front of the telescope is able to rotate through three preset positions. This mechanism allows the telescope to switch between viewing the Earth (nadir), the deep space calibration port, or the variable temperature blackbody known as the on-board calibrator (OBC).
The focal plane is comprised of three Quantum Well Infrared Photodetector (QWIP) arrays [4]. Each 512 by 640 pixel array, known as a Sensor Chip Assembly (SCA), is manufactured to be sensitive to a broad band of infrared wavelengths centered at approximately 11 µm. Specially designed spectral interference filters are placed over two regions on each array to produce two spectral channels. The design effectively splits the legacy Landsat thermal band into a channel from 10.6 to 11.2 µm and another channel from 11.5 to 12.5 µm. These channels are known as Landsat 8 band 10 and band 11, respectively. Each filter covers approximately 70 rows of detectors and provides unvignetted signal to 30 rows while the rest of the array is masked (Figure 1).
Figure 1. TIRS focal plane. The three arrays are known as Sensor Chip Assembly (SCA) -A through -C. For nominal operations, one combined row from each of the filtered areas centered at 10.9 and 12.0 µm (band 10 and band 11, respectively) are read out. The final image product contains data from all three arrays stitched together to form a ground swath approximately 15° wide. A diagnostic mode provides all rows from each array.
Remotesensing 06 10435 g001
In the standard push-broom imaging mode, only two rows from each of the two filtered regions along with two rows from the masked or “dark” region are read out at a frame rate of 70 Hz. The two rows of detectors from each region allow for a primary and redundant row of image data. Individual detectors from the primary row that do not meet specifications are swapped out in generating the product with the corresponding detectors in the redundant row. The image data from these rows are combined during ground processing to produce an instrument swath of approximately 185 km (15° field-of-view) with a detector ground sample distance of approximately 100 m. The image data are geo-rectified and located to the standard Worldwide Reference System 2 (WRS2) grid in the final image product released to the public [5]. The USGS Earth Resources Observation Systems (EROS) Data Center processes and archives all TIRS imagery [6,7].
The focal plane also has a diagnostic mode in which a group of consecutive rows from each array are read out instead of the usual six rows, albeit at a slower frame rate. The diagnostic mode allows for the inspection of nearly all detectors of the array to track any changes that might otherwise be unseen in the standard six row operation. In this mode, TIRS effectively serves as a two-dimensional imager.

1.2. Calibration Methodology Summary

TIRS was calibrated during pre-flight environmental testing. The calibration process involves three steps to convert raw counts from the detectors into an at-aperture spectral radiance. A linearization step is performed first to ensure that the detected signal from the focal plane arrays is linear with photons. Next, a background frame is subtracted from Earth imagery to remove the effects of dark current and instrument self-radiance. Operationally, frequent views of the deep space port serve as a background reference. Finally, the background-subtracted data is converted to radiance through the use of a look-up table that was constructed from pre-flight measurements of a uniform NIST-calibrated blackbody source. The calibration process requires that the instrument is thermally and electrically stable. Trends in instrument performance are tracked and the calibration is adjusted if necessary. For a full treatment on the calibration of the TIRS instrument refer to reference [8].

1.3. On-Orbit Instrument Performance Summary

The stability of the recorded signal from the instrument while viewing a radiometrically constant source is crucial to the proper performance of TIRS. A brief summary of the on-orbit performance of the instrument is provided here (a complete treatment is available in [1]).
Data from the onboard calibration assets are used to monitor the noise and stability of the instrument. Observations of the OBC at various temperatures show that TIRS is consistently reporting a noise equivalent change in temperature (NEdT) of approximately 0.05 K (well below the design requirement of 0.4 K). Expressed similarly in terms of radiance, the noise equivalent change in radiance (NEdL) calculations result in values of less than 0.01 W/m2/sr/µm [1]. Again, these values are stable over time and well below the design requirement [9].
Dark current stability as measured by observing the detector counts from the dark band, or masked region, on the arrays shows standard deviations of less than one digital count which indicate a stable dark current. Long data collects of the deep space port used to evaluate the stability of the background signal yield variations of approximately 0.1 K or less (in brightness temperature) for both spectral channels over a typical Earth imaging interval (i.e., during the time period between nominal collects of the deep space background reference) [1]. In addition, long data collects of the OBC at 270 K indicate that the response varies by approximately 0.05 K or less in brightness temperature for both spectral channels. An alternative expression is that the 1σ variation in reported signal in terms of percent of the average radiance is less than 0.1% [1].
All indications from image data of the onboard calibration sources are that the TIRS radiance products are stable. In addition, instrument temperature and voltage telemetry also indicate that the instrument is internally stable.

2. Artifacts in TIRS Imagery

While stability was confirmed with onboard sources and instrument telemetry, the radiometric accuracy of Earth scenes is of interest as the sensor was designed to map the Earth’s surface. Although most Earth scene data collected over the first year on-orbit have not shown image artifacts, certain scenes have exhibited varying banding artifacts. In addition, vicarious absolute radiance measurements have revealed a varying error between TIRS image-derived temperature measurements and in situ measurements.

2.1. Earth Scene Data

The TIRS calibration algorithms are designed to produce a uniform radiance across the field-of-view when observing a spatially uniform source [8]. However, particular TIRS scene images have revealed banding across the field-of-view. In general, banding refers to low frequency variation in the across-track direction in the image data from scenes that are expected to be uniform. Prime examples of Earth scenes expected to be essentially uniform are open water scenes. Areas of open water near the overlap between adjacent focal plane arrays (recall Figure 1) should have nearly the same temperature and should therefore report the same radiance on both arrays if properly calibrated. Figure 2 shows an example TIRS image of the Red Sea in the Middle East where this is not true.
Figure 2. TIRS band 11 image of Path/Row 173/41 in the Red Sea (left) and a context map for this scene from USGS Earth Explorer (right) [7]. The image data from the three focal plane arrays is evident due to banding in the across track direction. The intensity stretch ranges from 8.5 to 11.5 W/m2/sr/µm on the TIRS image at left.
Remotesensing 06 10435 g002
The Red Sea is ideally suited to demonstrate the banding artifacts in TIRS as the scene consists mainly of open water while the surrounding area contains land that is distinctly hotter. The banding artifacts in this scene are not consistent in the along-track direction. Consider the ratio of the radiance values in the along-track direction on either side of the boundary between adjacent focal plane arrays in Figure 3. A ratio of one would indicate that both arrays are reporting the same radiance value for the uniform area between the arrays (assuming that the water temperature is the same over the area near the array boundary). Figure 3 illustrates that not only does the ratio differ from one but the ratio changes with frame number (i.e., changes for each TIRS push-broom frame) indicating that an issue other than standard array-to-array banding is present. In the worst case, there is an approximately 2.5% swing in ratio from the north end of the scene to the south end of the scene.
Figure 3. Graph (right) demonstrating the ratio of the radiance values in the along-track direction on either side of the boundary between adjacent focal plane arrays (indicated by the arrow at left). The intensity stretch ranges from 8.5 to 11.5 W/m2/sr/µm on the TIRS image at left.
Remotesensing 06 10435 g003
If the banding was the result of a mis-calibration of the detectors on the focal plane arrays, then the across-track banding should be constant for every push-broom frame. In other words, a relative calibration error in the detectors should produce the same relative error for all frames as the sensor collects push-broom image data. If that were the case then a relative adjustment to the calibration would correct the banding. As demonstrated by the ratio in Figure 3, the fact that the ratio varies in the along-track direction is an indication that the banding is not a result of internal mis-calibration of the detectors.

2.2. Vicarious Absolute Radiometric Calibration

The banding artifacts are not only a visual annoyance, but they also contribute to a varying absolute radiometric error in the instrument. TIRS routinely collects image data over water bodies containing instrumented buoys which provide in situ temperature measurements. The measured water temperature is combined with atmospheric knowledge at the time of measurement to derive a top-of-atmosphere radiance that is compared to the TIRS-reported image radiance [10]. The difference between the buoy-derived top-of-atmosphere radiance and the TIRS image radiance is a measure of the absolute calibration error of the instrument.
Analyses of the in situ data over the first year of operation on-orbit have demonstrated a time-varying absolute calibration error for TIRS. The TIRS image radiance is always higher than the calculated top-of-atmosphere radiance. The error is on-average (0.29 ± 0.12) W/m2/sr/µm in band 10 and (0.51 ± 0.20) W/m2/sr/µm in band 11. Additionally, the magnitude of the error is larger during the summer season and is smaller during the winter. For a full treatment of the vicarious absolute calibration measurements and analysis for TIRS refer to reference [2]. A significant influence on the absolute calibration has since been discovered and is discussed in the following sections.

3. Stray Light and Ghosting in TIRS

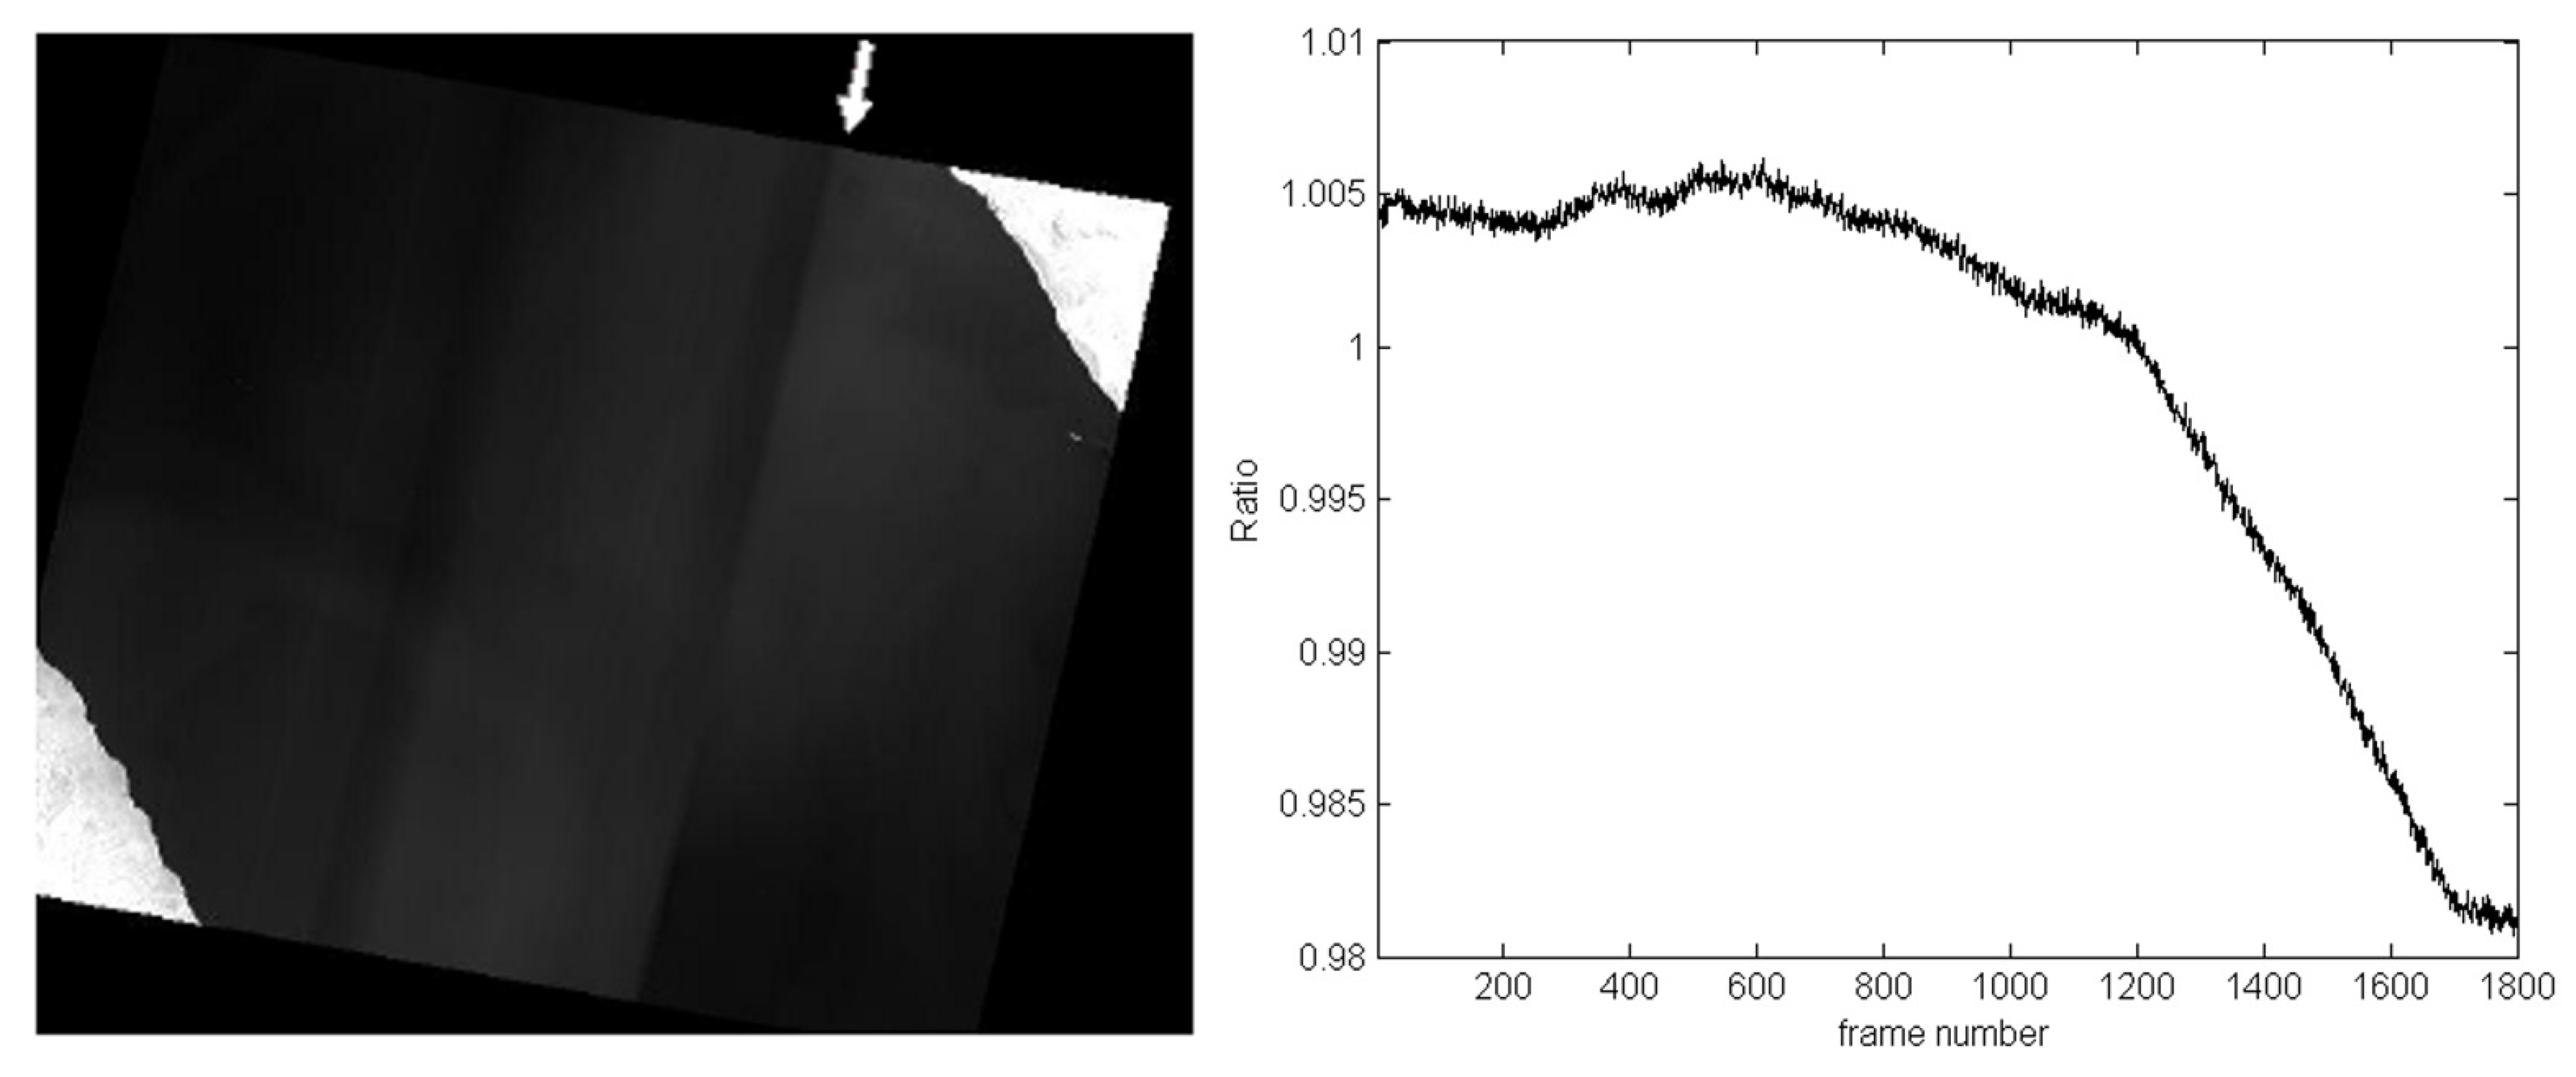
The cause of the artifacts seen in Earth imagery was theorized to be radiance from outside the scene scattering into the field-of-view. The effect of the scattering is not uniform across the field-of-view (i.e., the scattering, or ghosting effect, will be different for each detector across the focal plane). This implies that a unique correction will be required for each detector to correct for the ghosting effect in the TIRS image data.

Special Lunar Collect

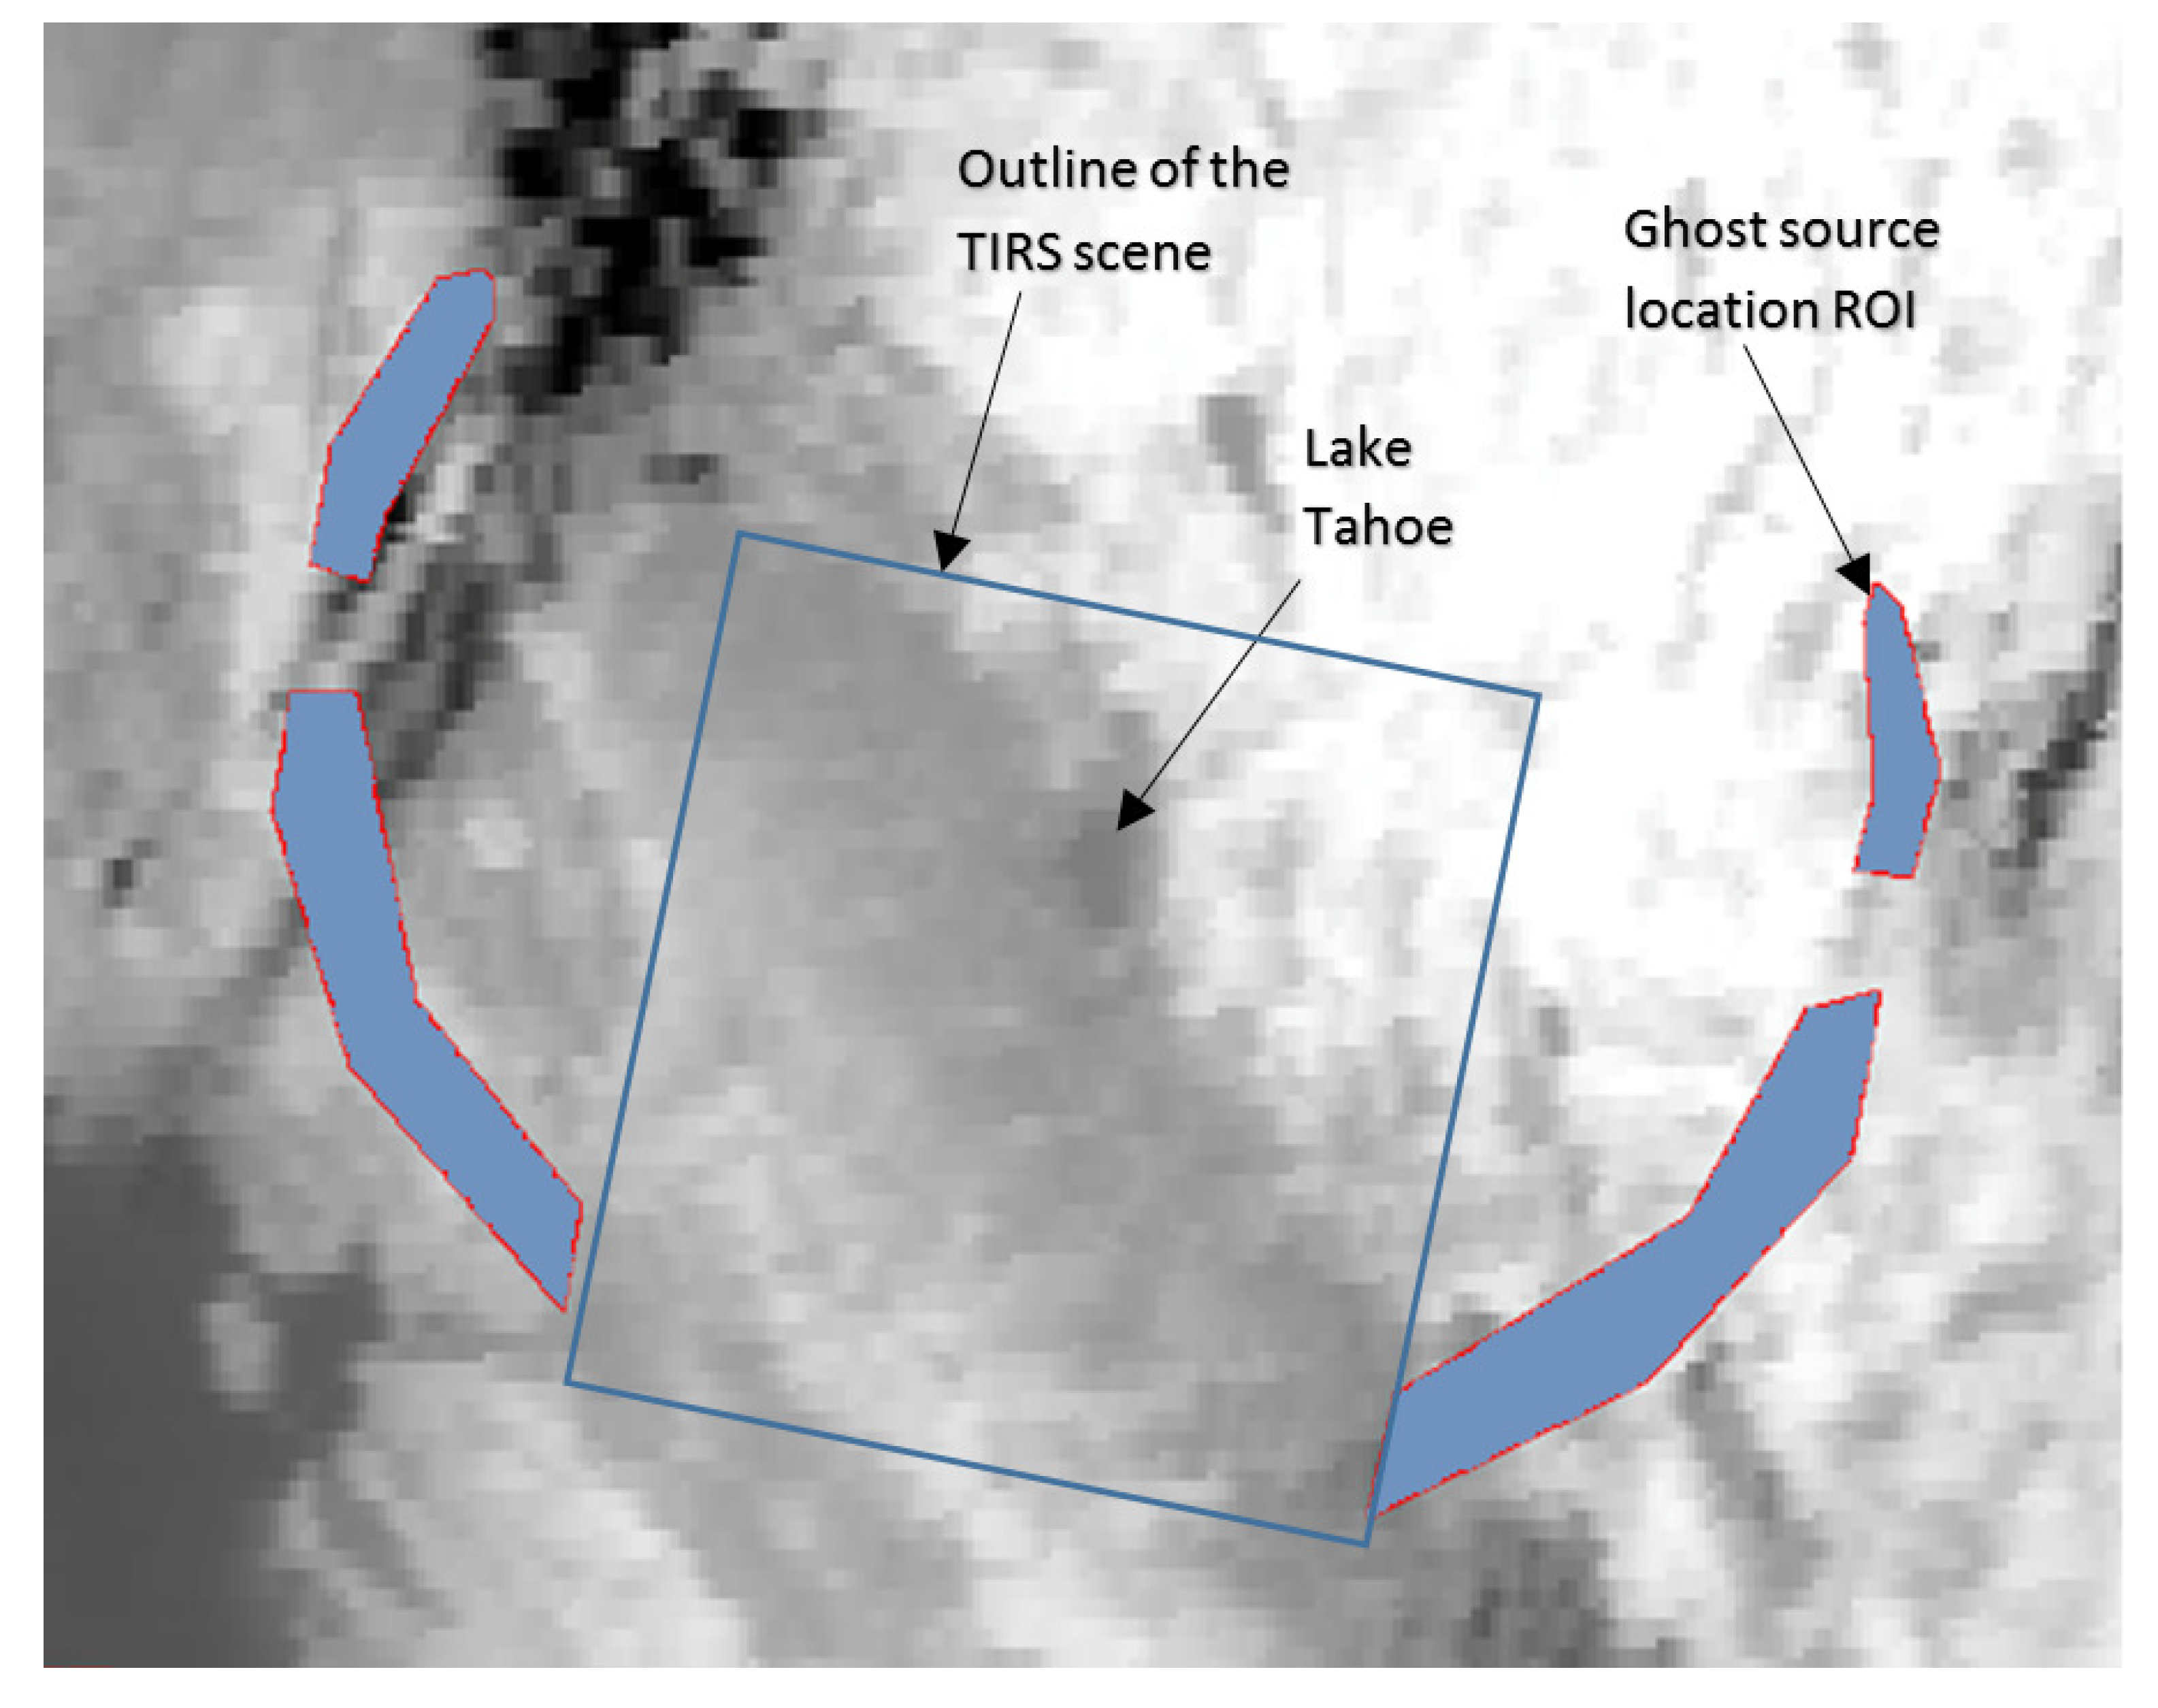
One way to test this theory is to place a concentrated source outside the field-of-view and observe the signal on the focal plane. Ideally, no signal from this source should be detected as the source is not directly viewed by TIRS. Any signal that is detected would be a ghost signal from the out-of-field source from the particular location of the source. If the source is raster scanned throughout the out-of-field area of TIRS, then a map of the ghost source locations for each detector may be constructed. The moon provides such a concentrated source.
Referring to 
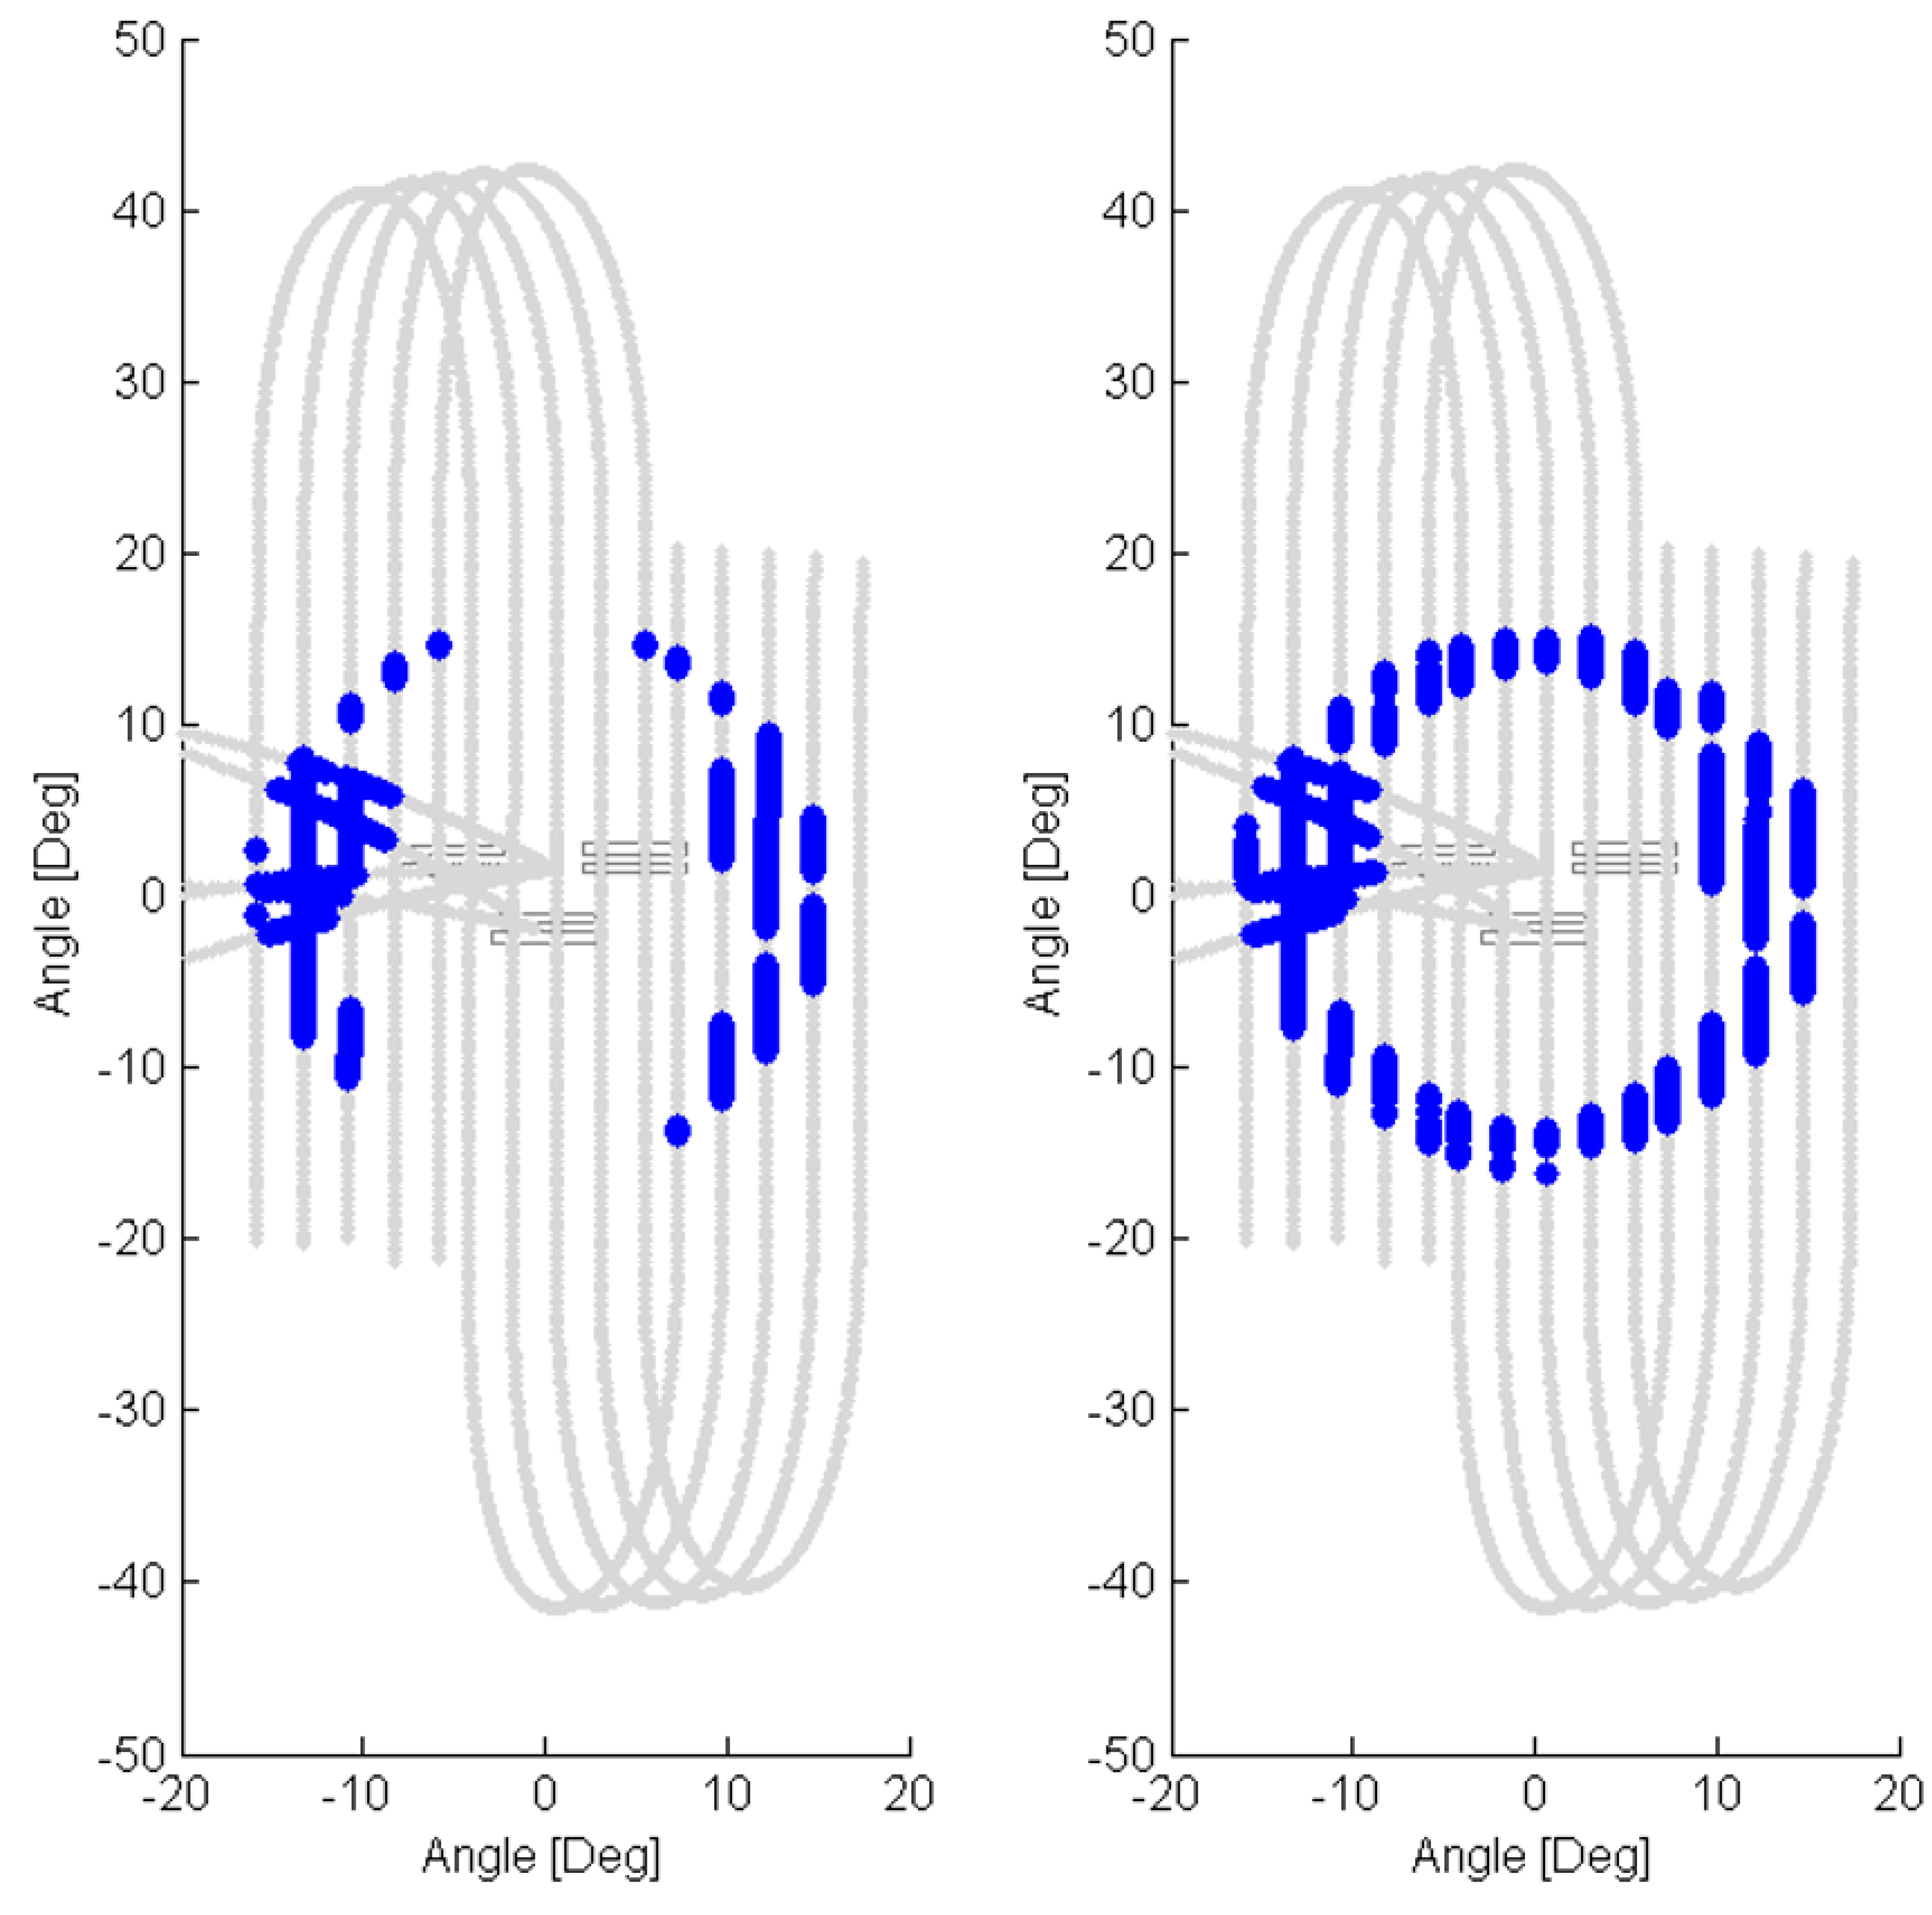
Figure 4, the Landsat 8 observatory was commanded through a series of slews in which the moon was scanned over the TIRS in-field and out-of-field-of-view. A total of five scans were obtained, with each scan consisting of three vertical segments, for a total of 15 vertical segments covering at least ±18° from the instrument boresight in both the across-track and along-track directions. The spacing of the vertical scans in the across-track direction was at most 2.56°. Coverage in the along-track direction reached as far as ±40° due to the operation of the observatory’s attitude control system in executing these maneuvers.
In addition to the special lunar scans, the observatory performs a lunar scan once a month to collect in-field data for the companion Landsat 8 sensor, the Operational Land Imager (OLI). TIRS takes advantage of these routine OLI-driven maneuvers by imaging throughout the Earth-to-Moon slew. Towards the end of the slew, the moon is usually observed crossing one or more of the focal plane arrays. This opportunity allows for additional ghosting data to be collected (to assist in populating the source maps) as the moon approaches from outside the field-of-view before being directly imaged by the arrays. Figure 4 illustrates the track of the moon for all the special lunar scans along with the additional Earth-to-Moon slews.
Figure 4. Illustration of the path of the moon (gray lines) relative to the focal plane array spectral filters during the special lunar scans and the Earth-to-Moon slews. Lunar locations in which a ghost signal was detected anywhere on the band 10 detectors (left) or the band 11 detectors (right) are highlighted in blue. Angles are relative to the optical boresight.
Remotesensing 06 10435 g004
The TIRS focal plane was switched to its diagnostic mode readout for all the lunar collects. The particular diagnostic mode reads out all rows under the spectral filters from each focal plane array at a slower frame rate instead of the usual six rows in the push-broom mode. The frame rate of approximately 2 Hz along with the slew rate of the spacecraft resulted in oversampling of the moon in the along-track direction. Whereas raw Earth imagery are processed to units of radiance in the standard ground processing system [8], the lunar imagery was manually processed for this work. All of the raw data was first linearized. Then, an image frame that contained no direct moon signal or ghost signal was used as a background frame to subtract from the rest of the dataset. Finally, all background-subtracted data was scaled to the direct lunar signal. That is, all data is divided by the signal from the moon when it is directly imaged on the focal plane detectors. The resulting magnitude of the image data is expressed as a fraction of the direct lunar signal.
By design, the moon is usually outside of the direct field-of-view of the detectors during these scans. The location of the moon relative to the TIRS detector arrays can be calculated from the spacecraft pointing telemetry. The spacecraft position relative to the Earth and the pointing quaternions are available in the downlinked telemetry throughout the lunar scans. This information is used with the SPICE system to calculate a direction vector of the moon relative to the TIRS optical boresight [11]. A diagram is constructed for one moment in time (i.e., for one image frame) in which the processed array image data are drawn spatially as they are arranged on the focal plane. A cartoon of the moon is drawn at the appropriate location relative to the array images. This diagram allows for a visual inspection of any ghosting signal on the arrays and also provides a sense of where the moon was located for this particular frame. A diagram is created for all image frames to inspect for ghosting artifacts for all the scanned lunar positions.
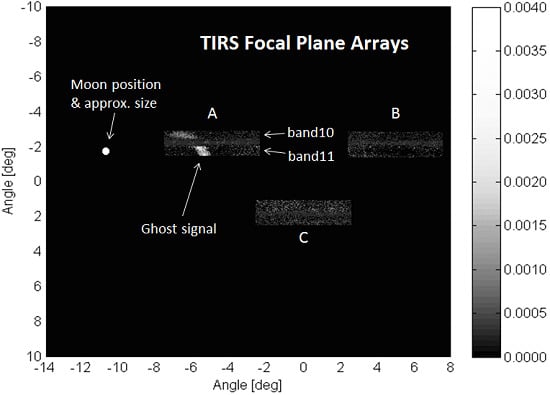
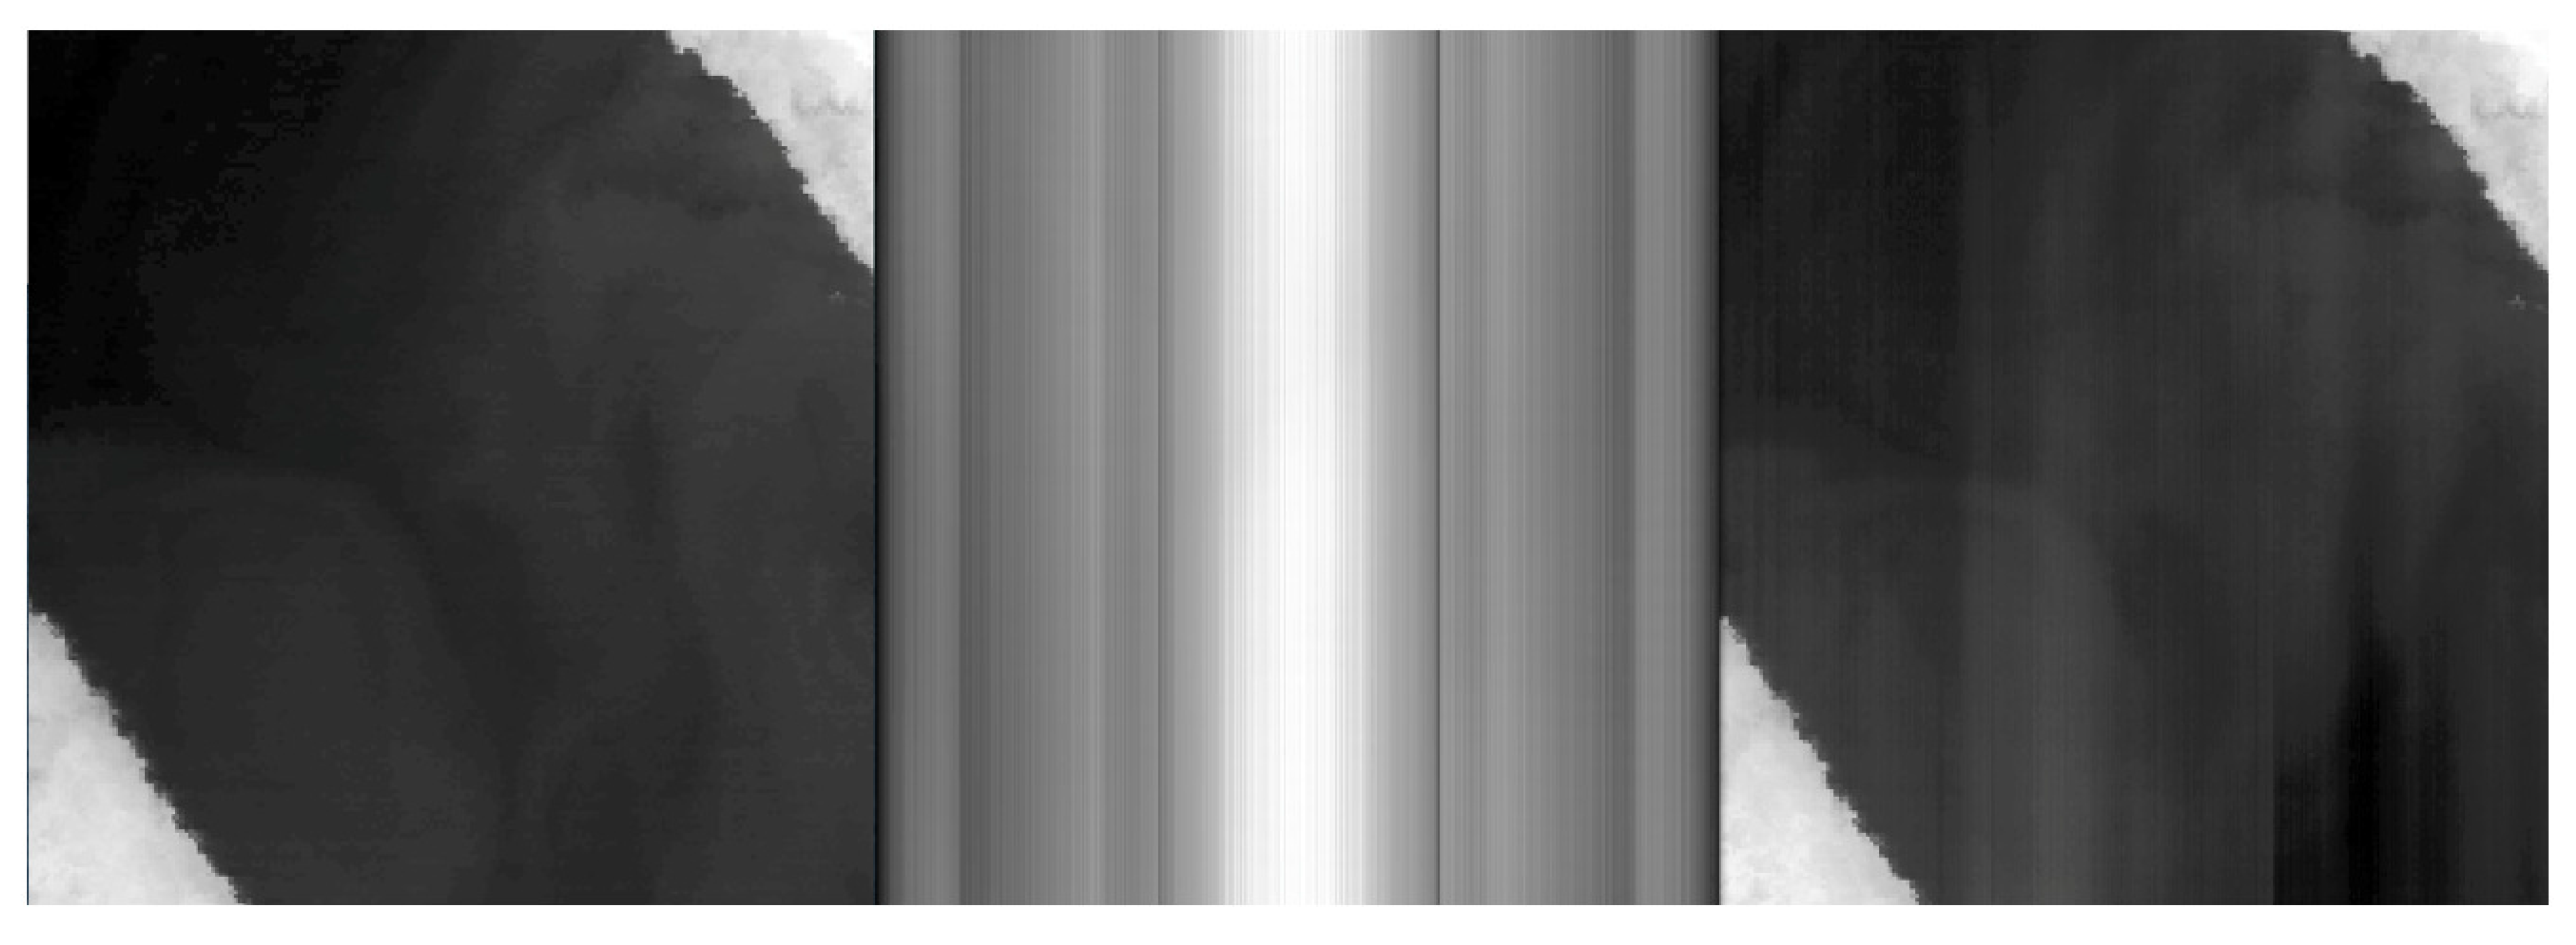
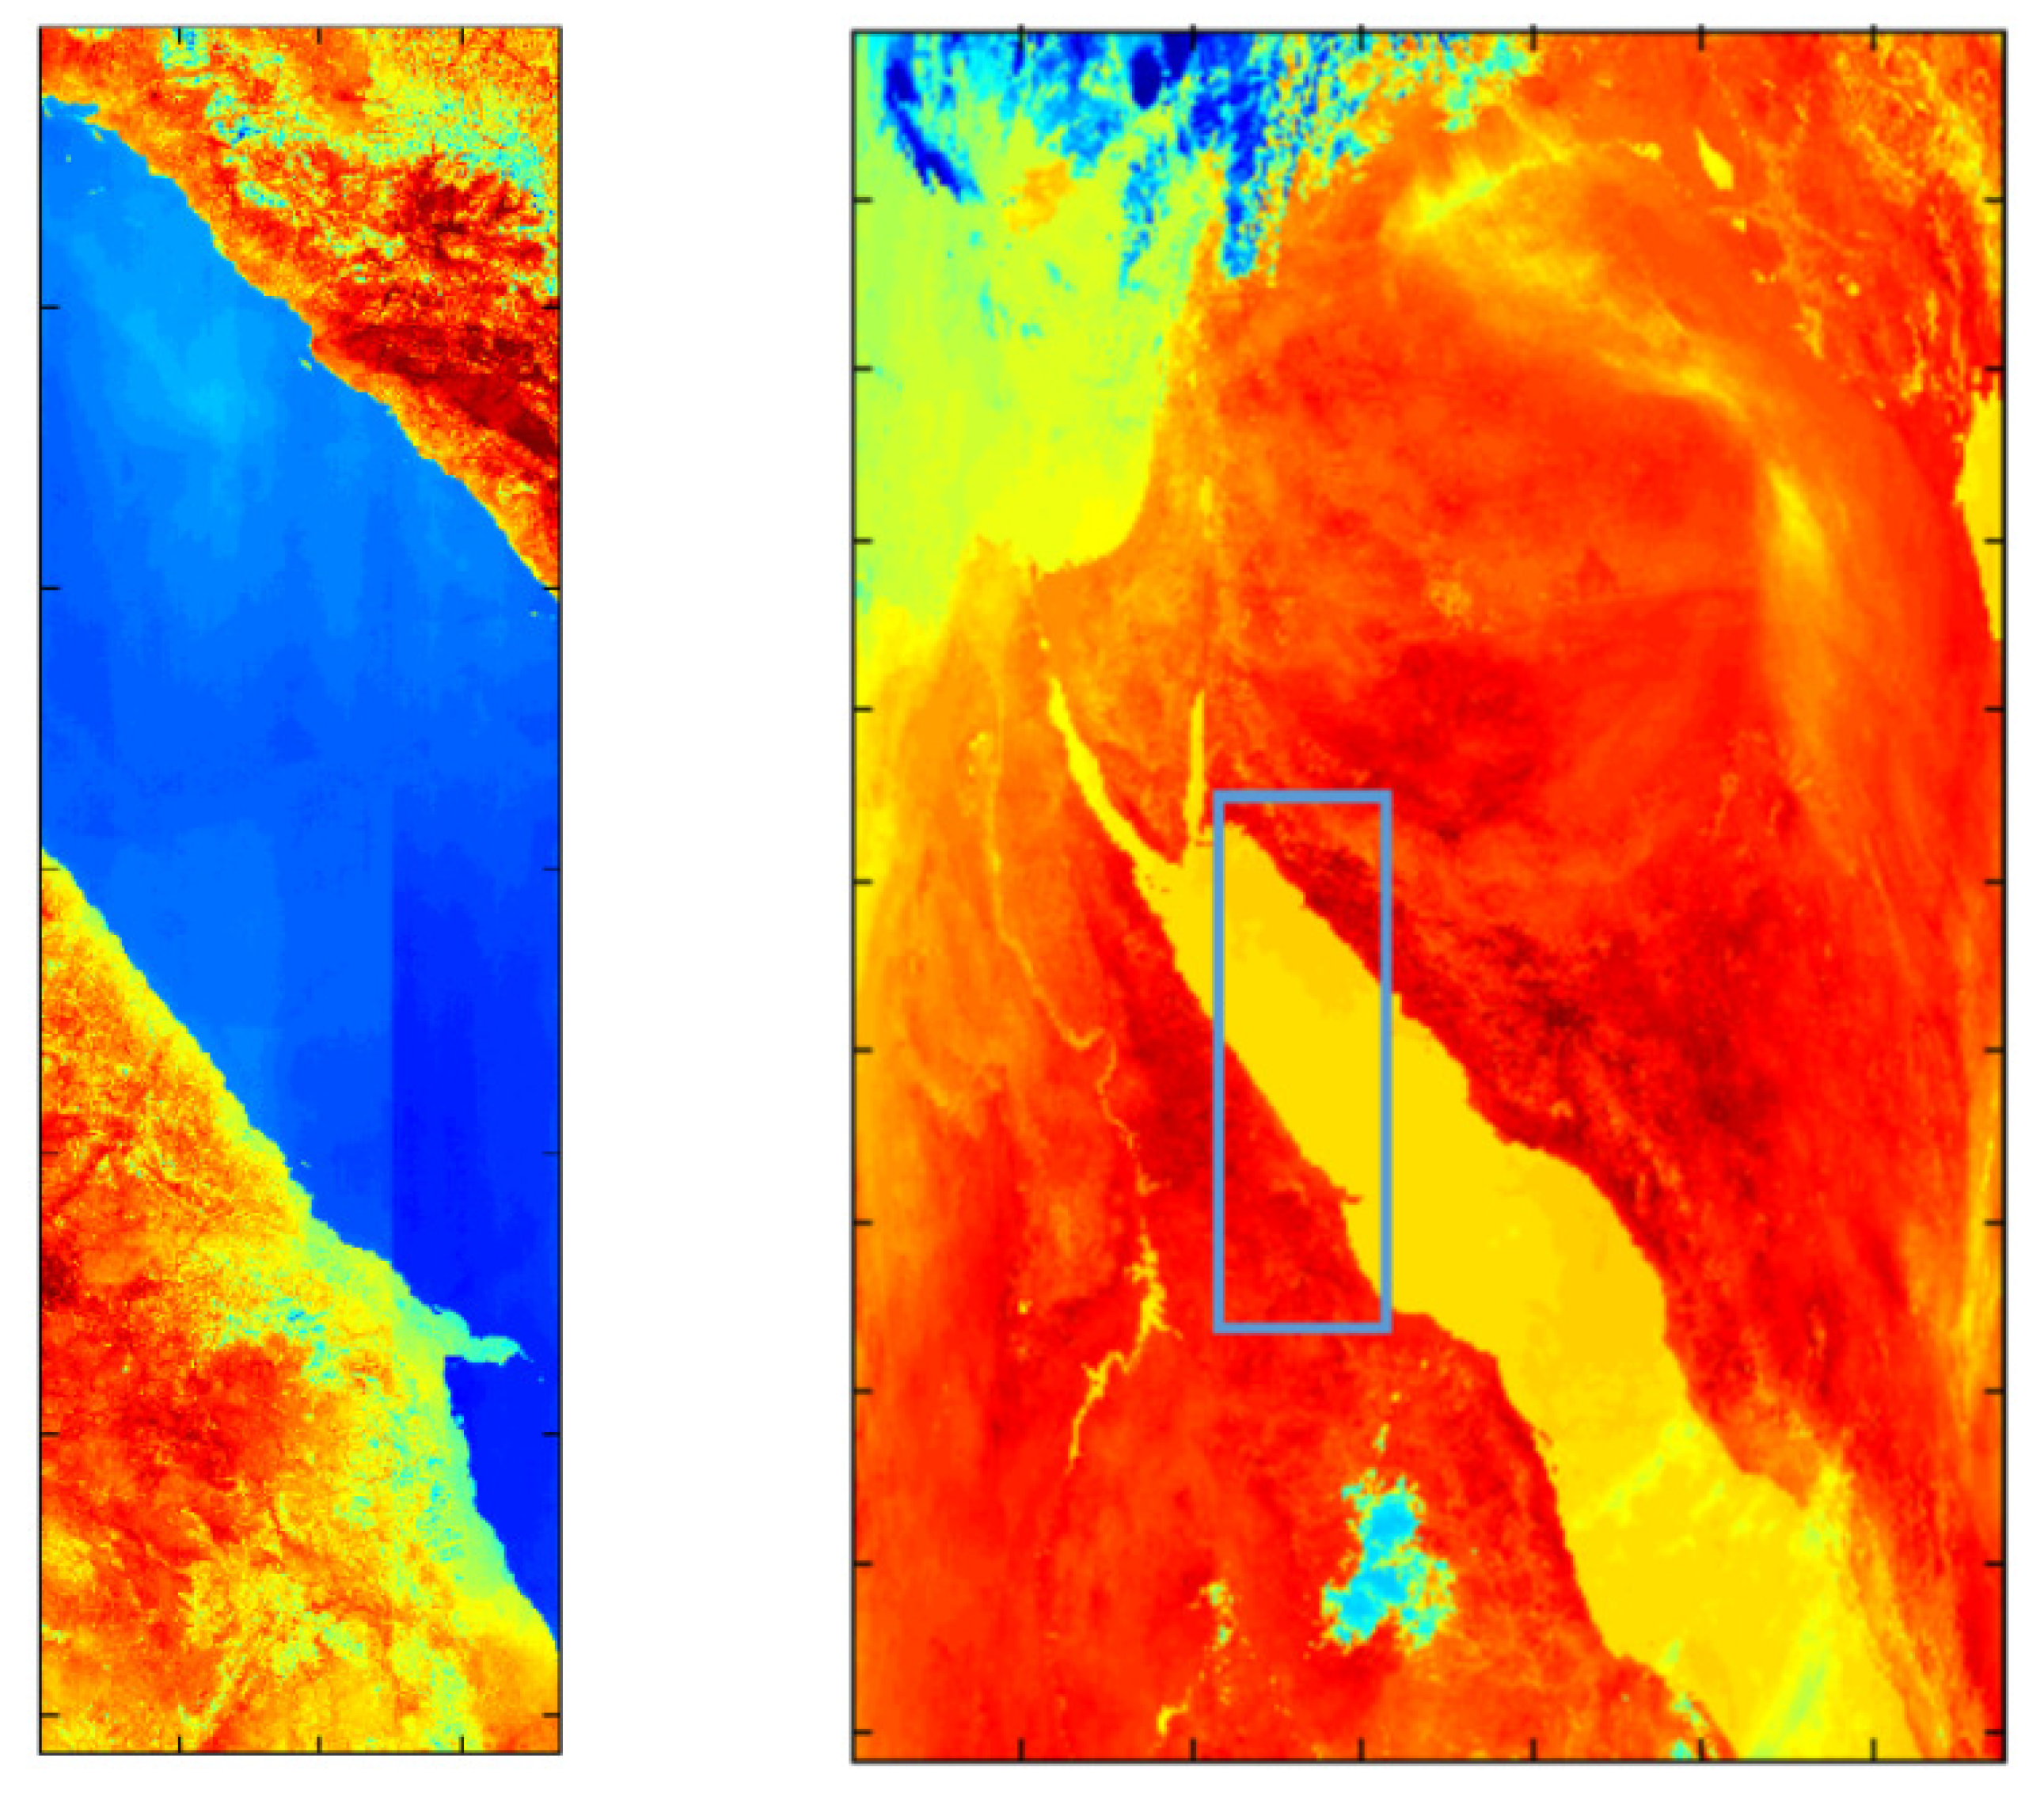
Figure 5. Diagram demonstrating the processed lunar scan data as the focal plane arrays are spatially oriented. The position of the moon relative to the arrays is indicated (angles are relative to the optical boresight). For this particular lunar position, a ghost signal appears on both bands in array -A as indicated. The contrast scale indicates the fraction of the directly-imaged lunar signal.
Remotesensing 06 10435 g005
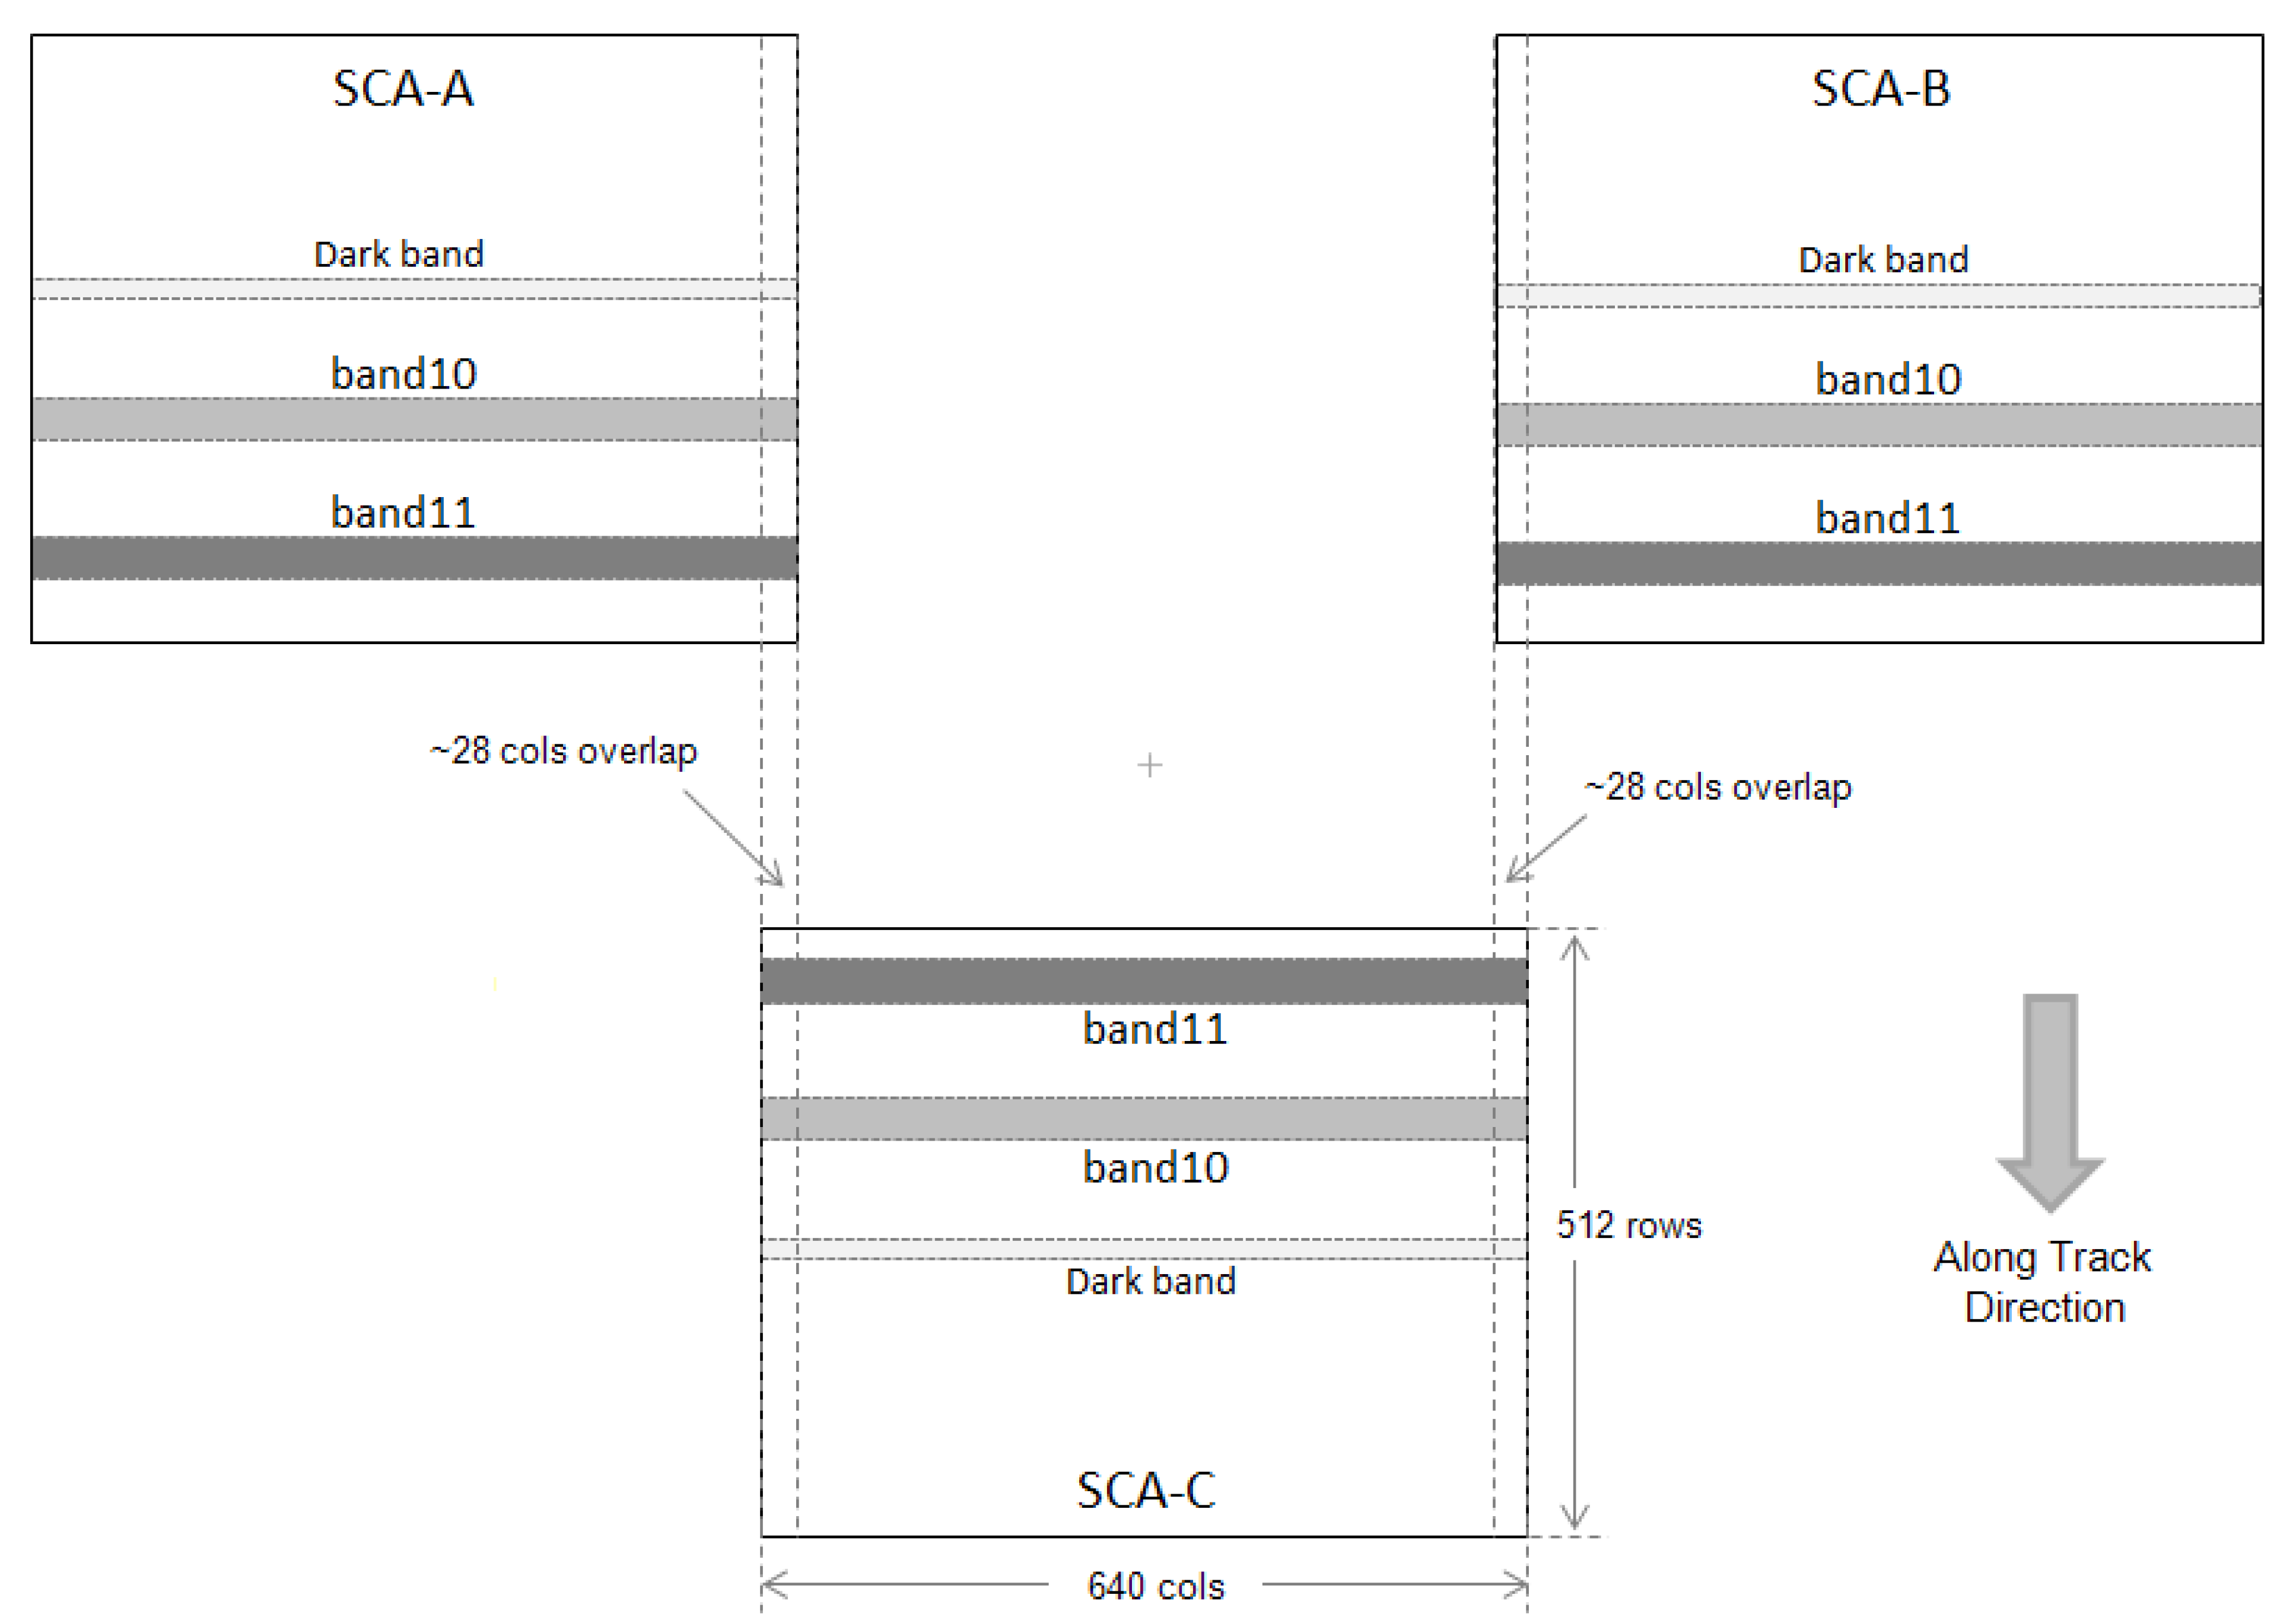
A diagram of one frame from the lunar scans is shown in Figure 5. The image data for the three focal plane arrays are labeled -A, -B, and -C. The particular diagnostic mode used for these collects reads out 180 rows of the 512 total rows from each array. Therefore each array image frame is 180 rows by 640 columns of image data and includes all the rows under and between the spectral filters for band 10 and band 11. The calculated moon position is indicated on the diagram and the size of the moon cartoon is approximately the size of the moon as it would appear to TIRS. The ghost signal has approximate magnitudes of 0.002 and 0.004 of the direct lunar signal for band 10 and band 11, respectively, for the particular lunar location shown in the diagram. The location of the ghost signal changes with the position of the moon (illustrated in 
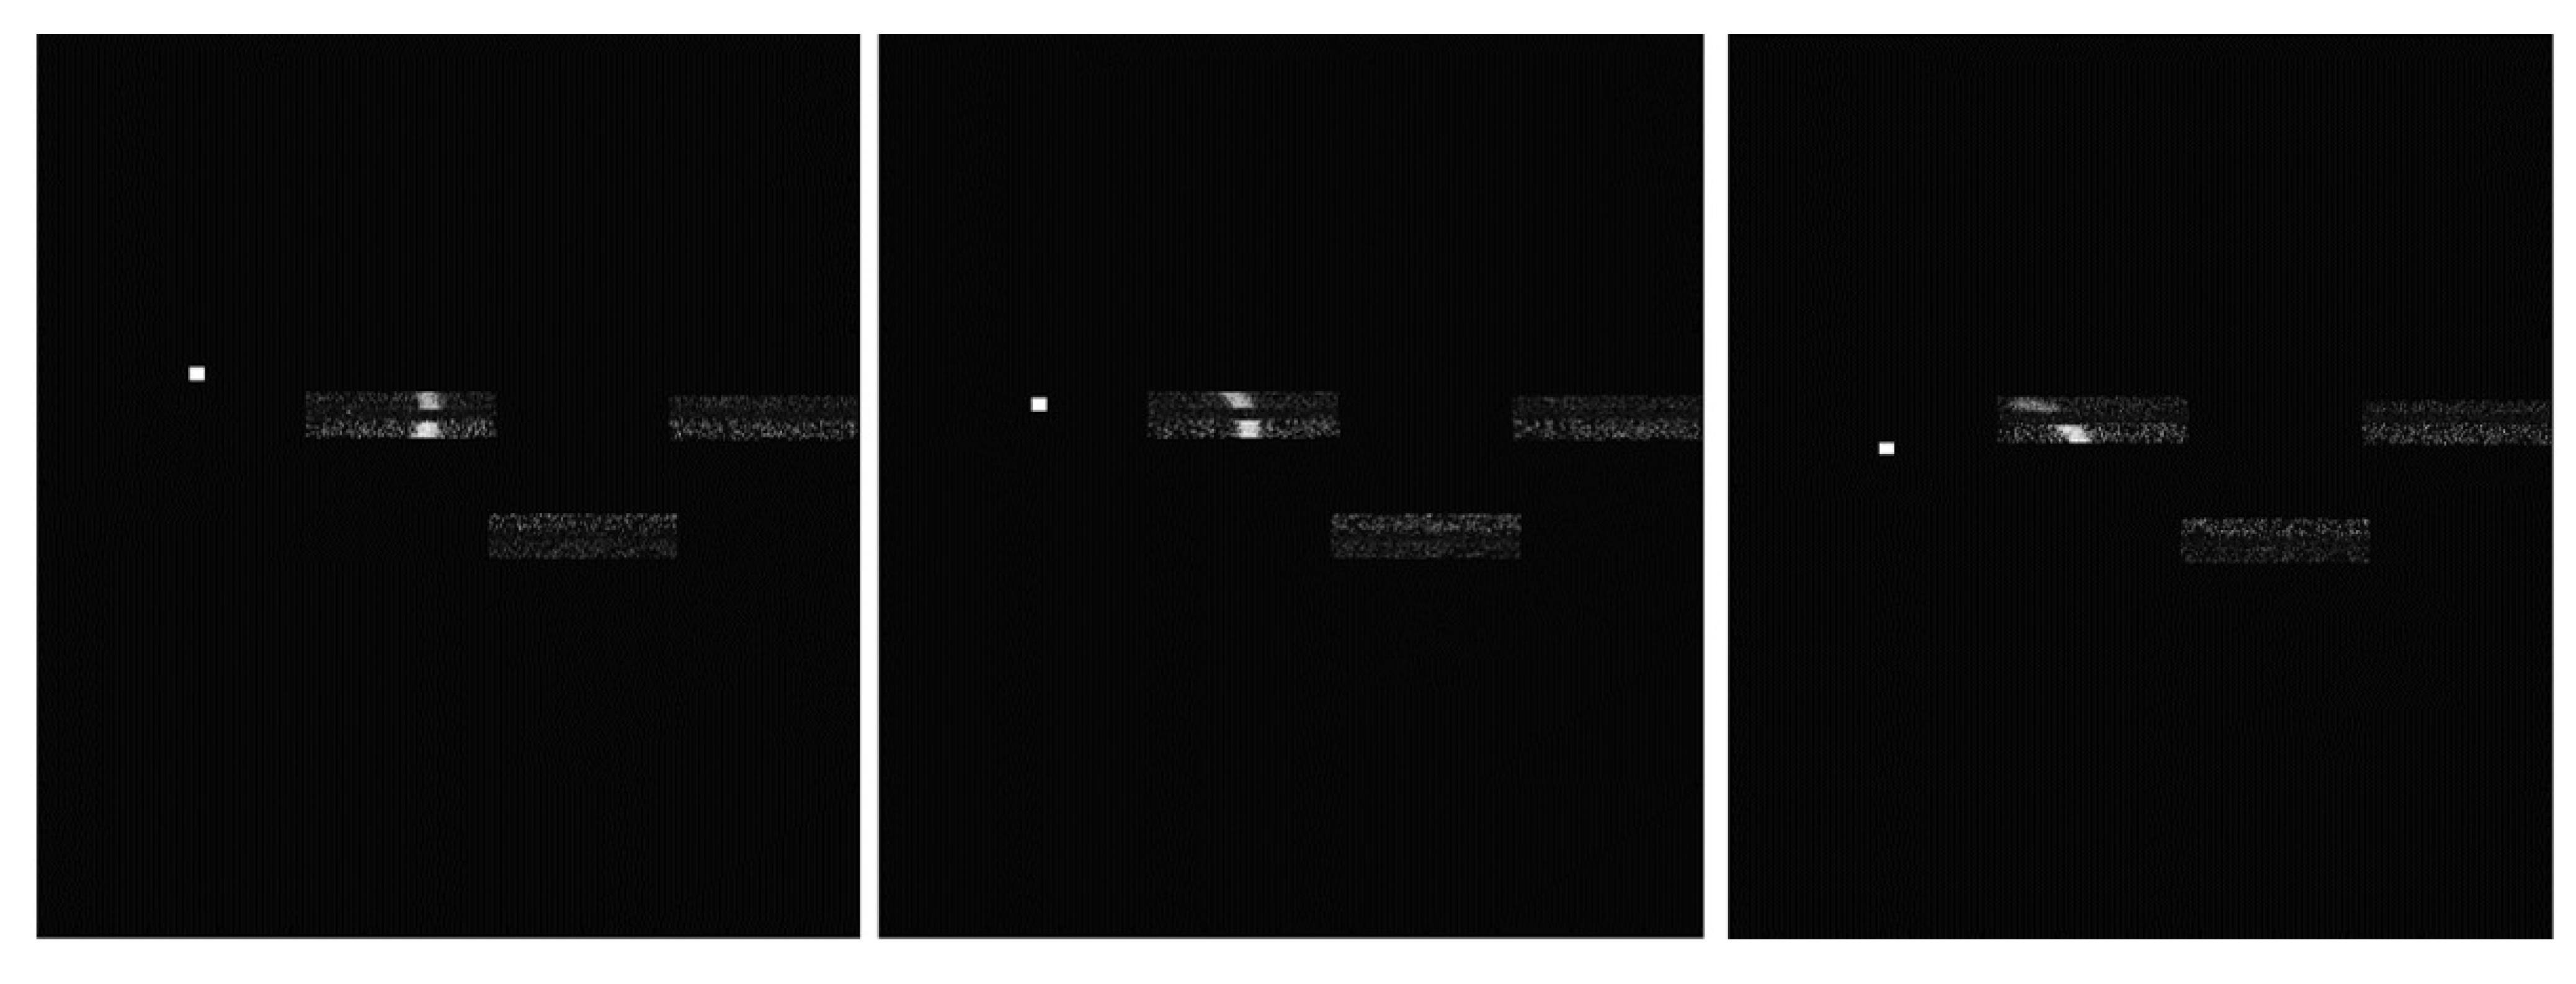
Figure 6) indicating that the ghost signal on a particular detector may originate from multiple out-of-field sources. It also indicates that each detector will have a different ghost signal from different sources.
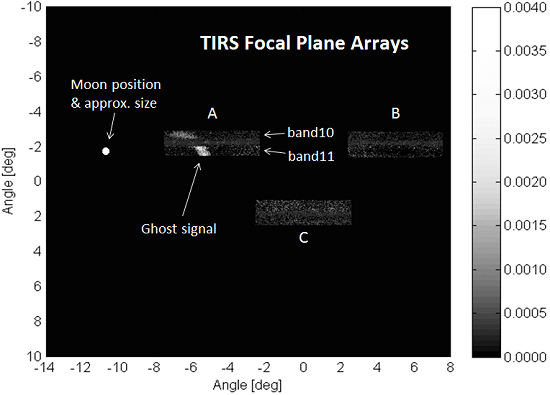
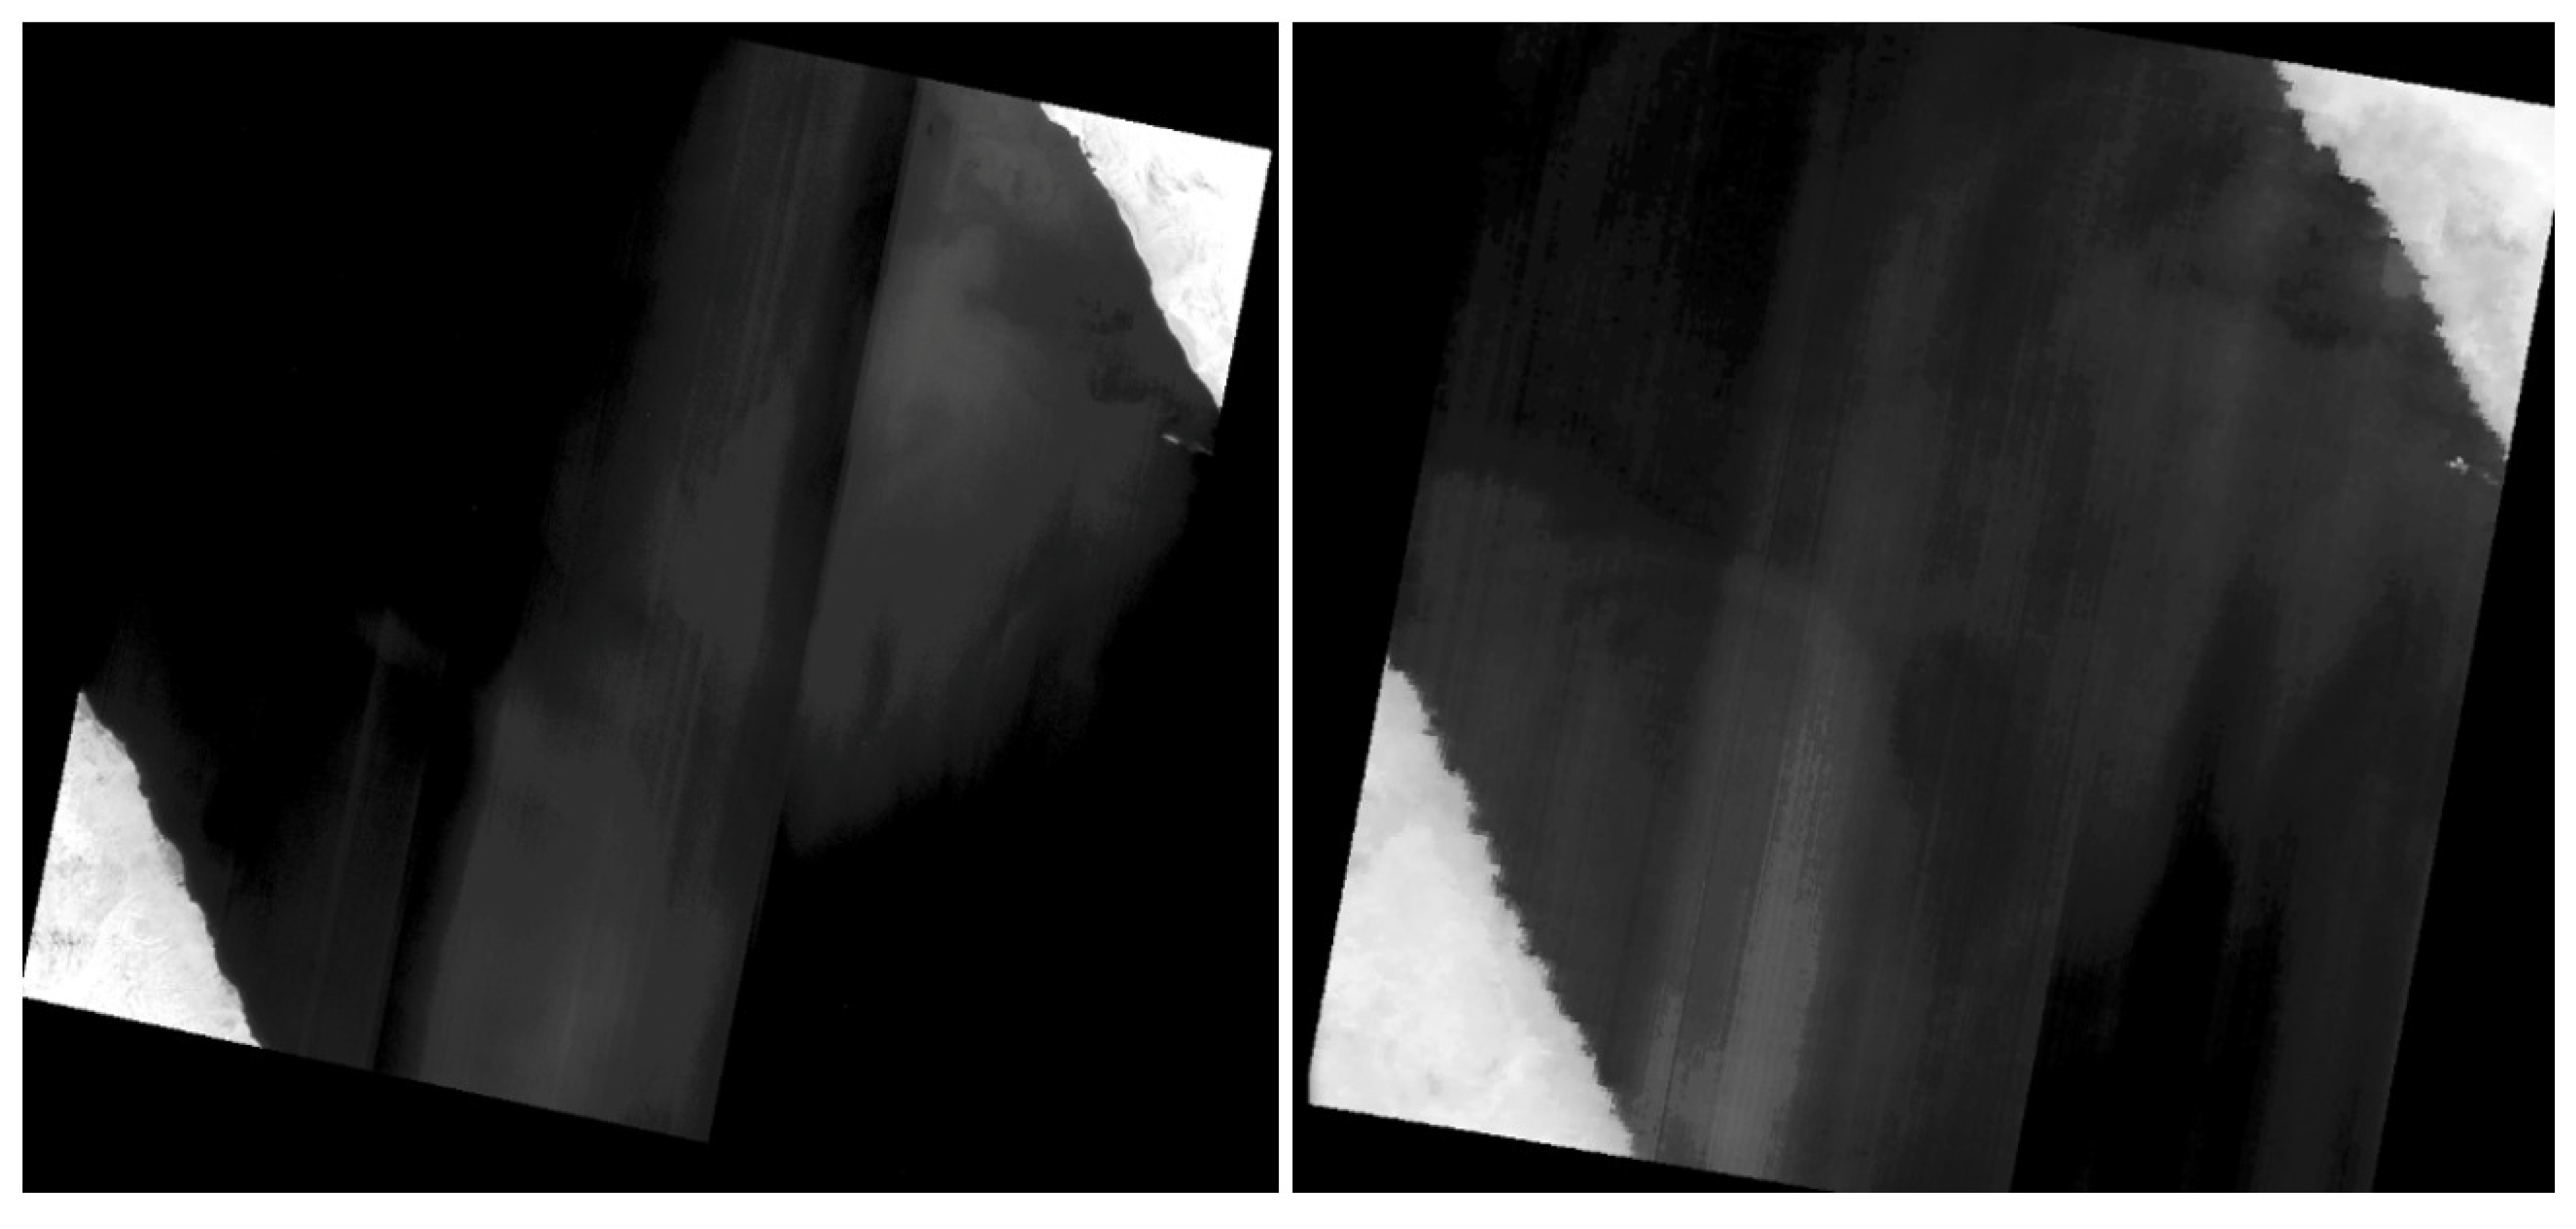
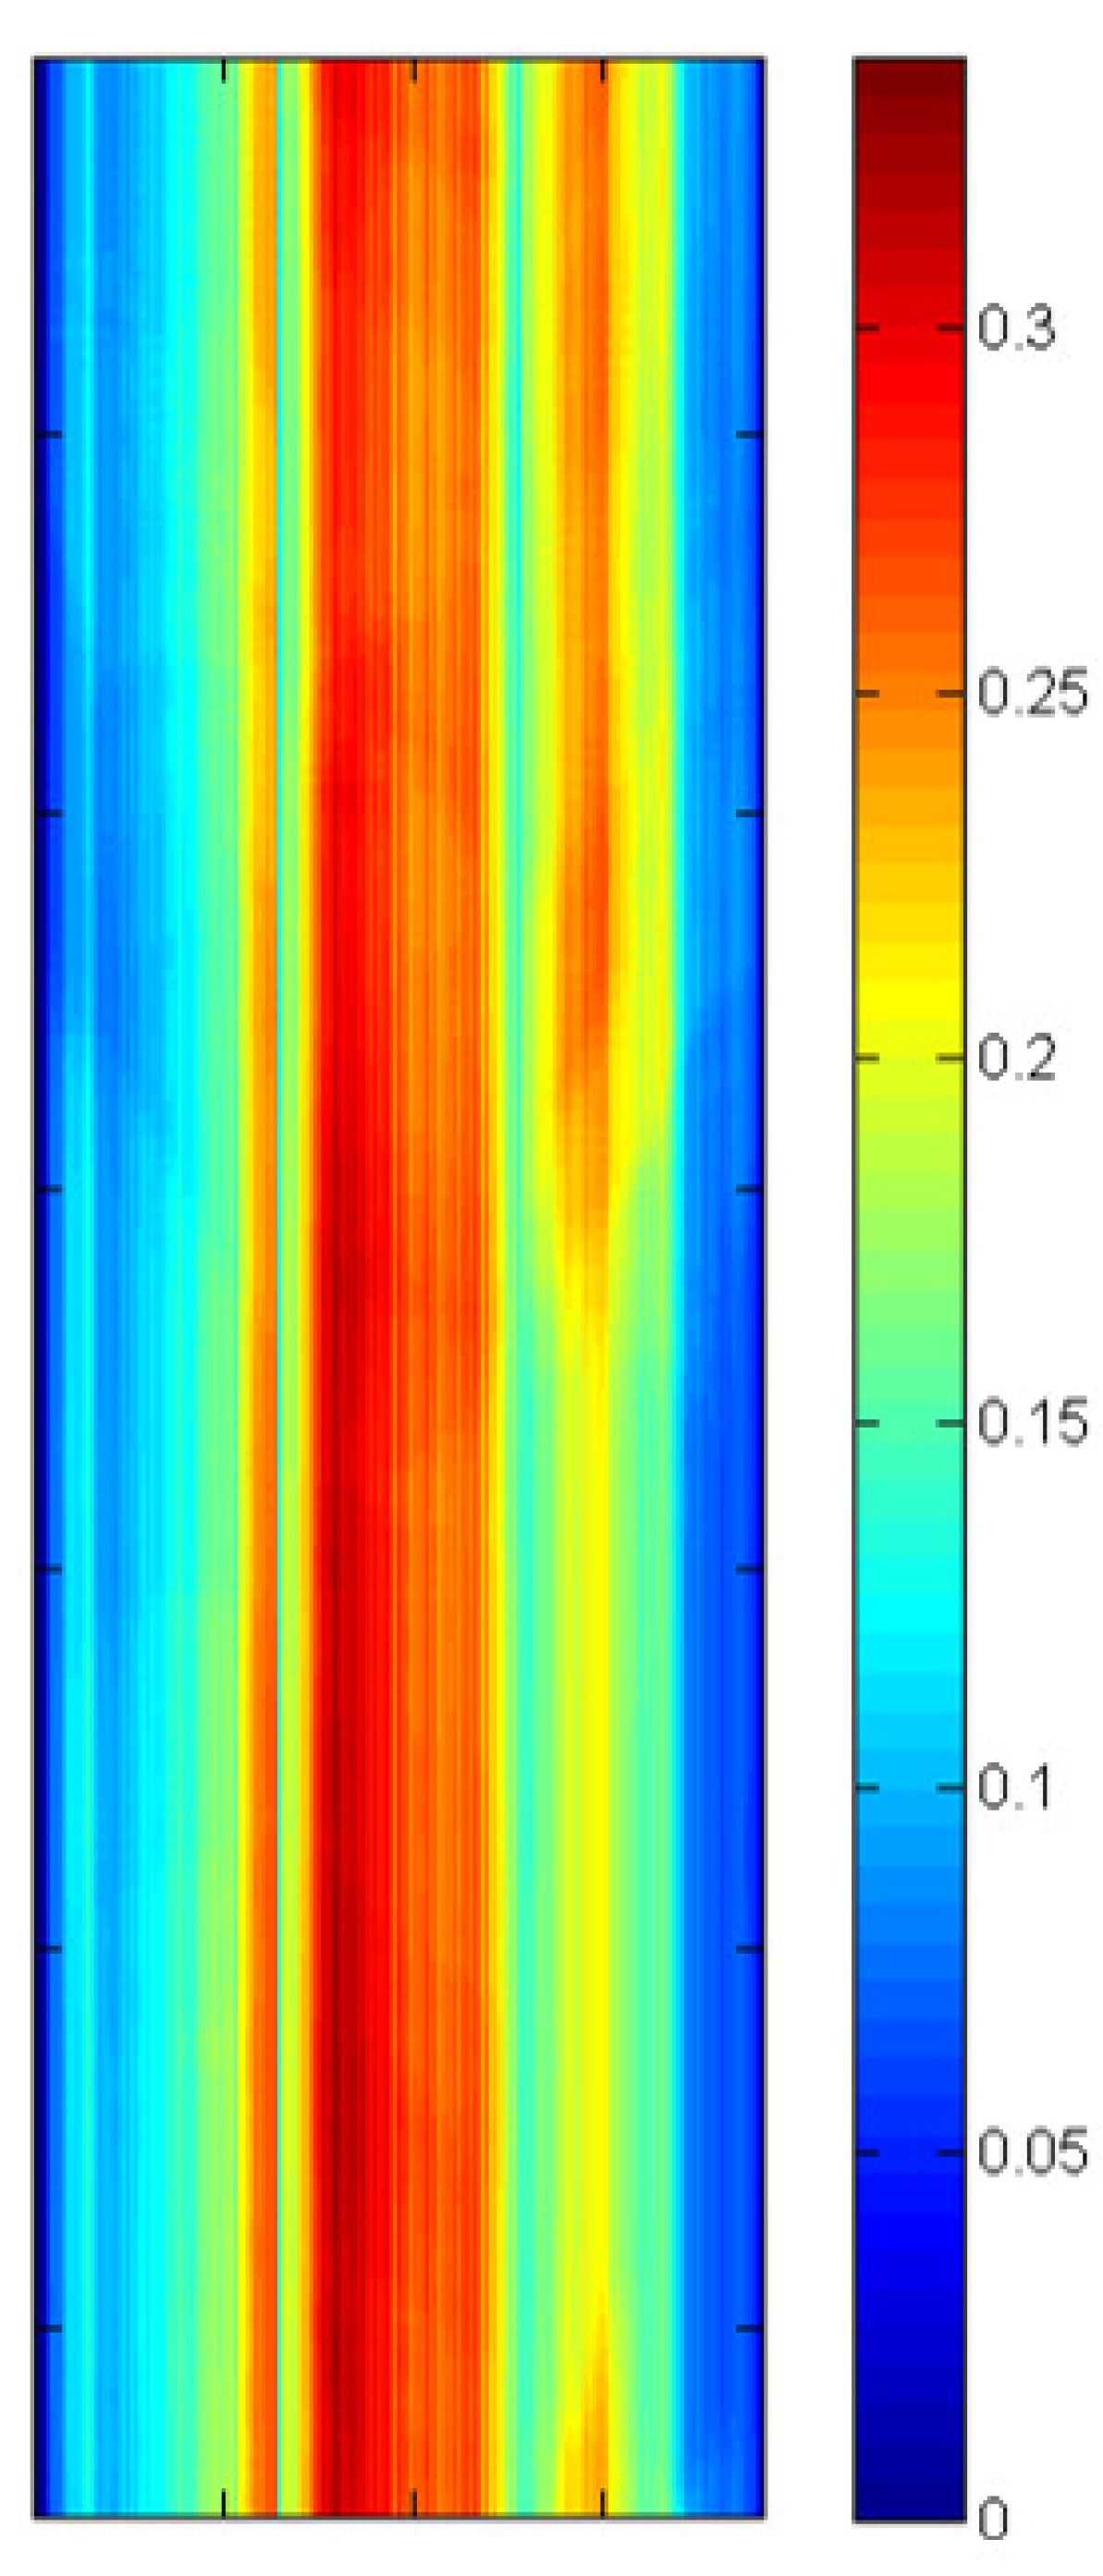
Figure 6. Demonstration that the ghost signal on the arrays is a function of lunar position. The lunar position is different in each of the three figures. The resulting shape of the ghost signal on the arrays is unique for each lunar position.
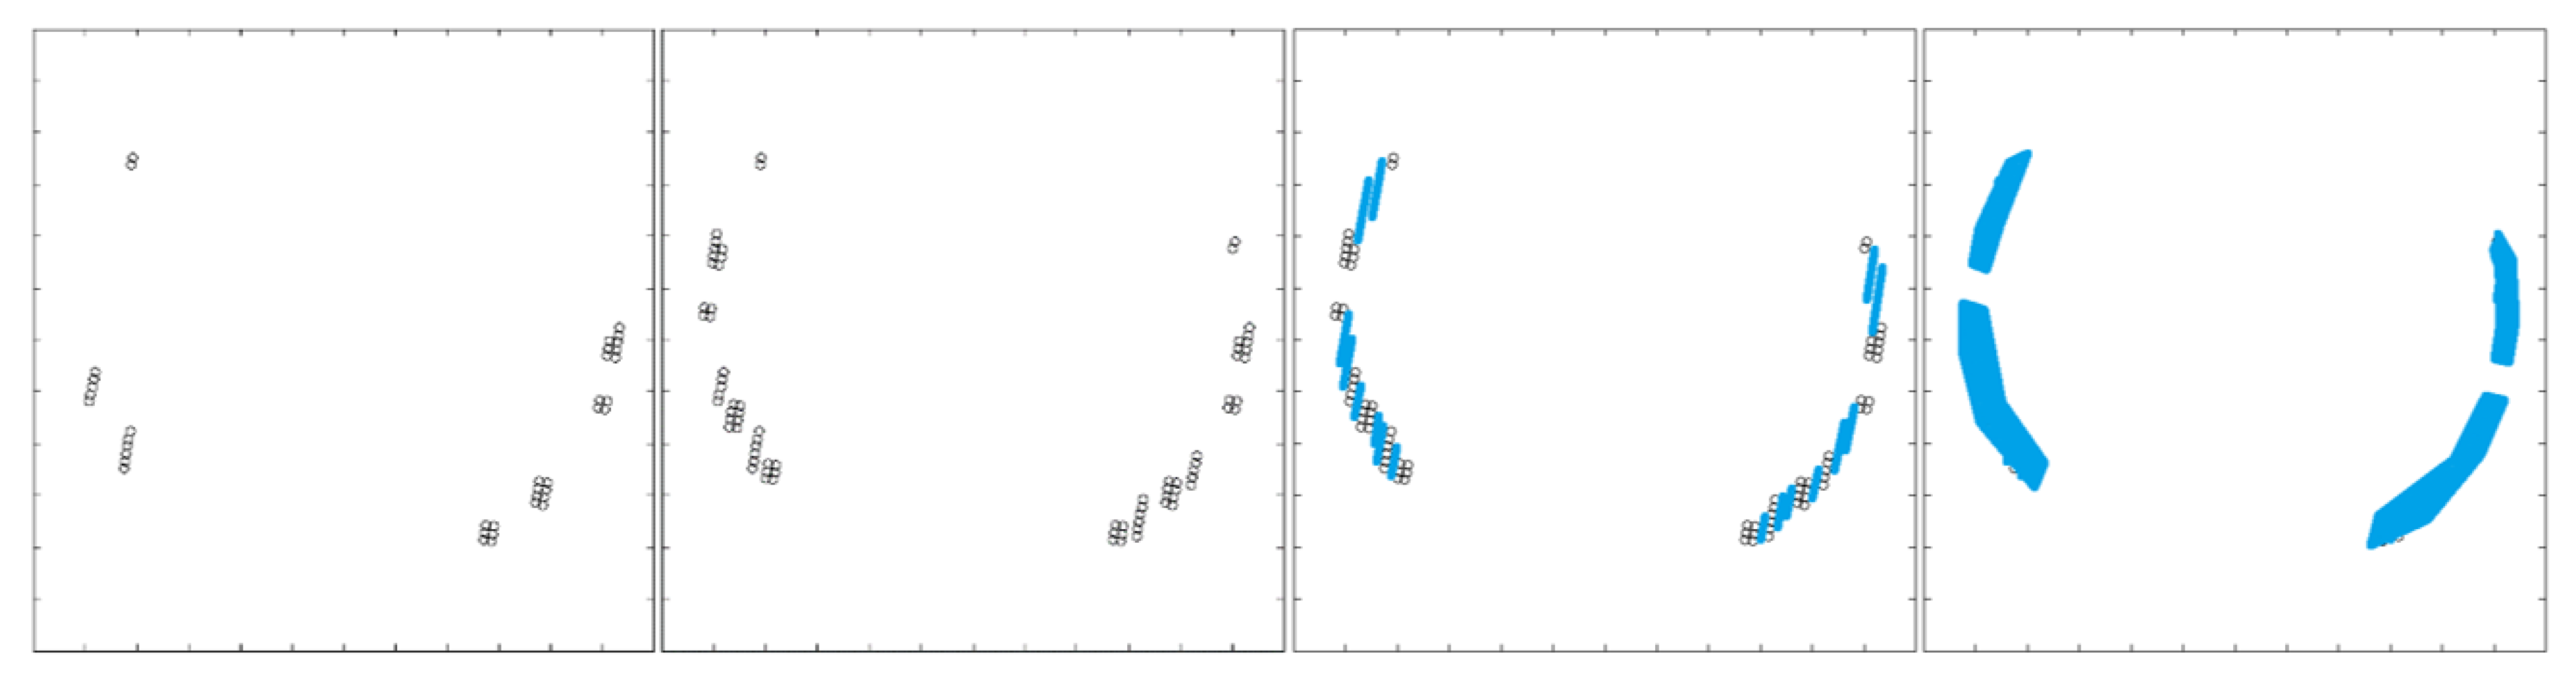
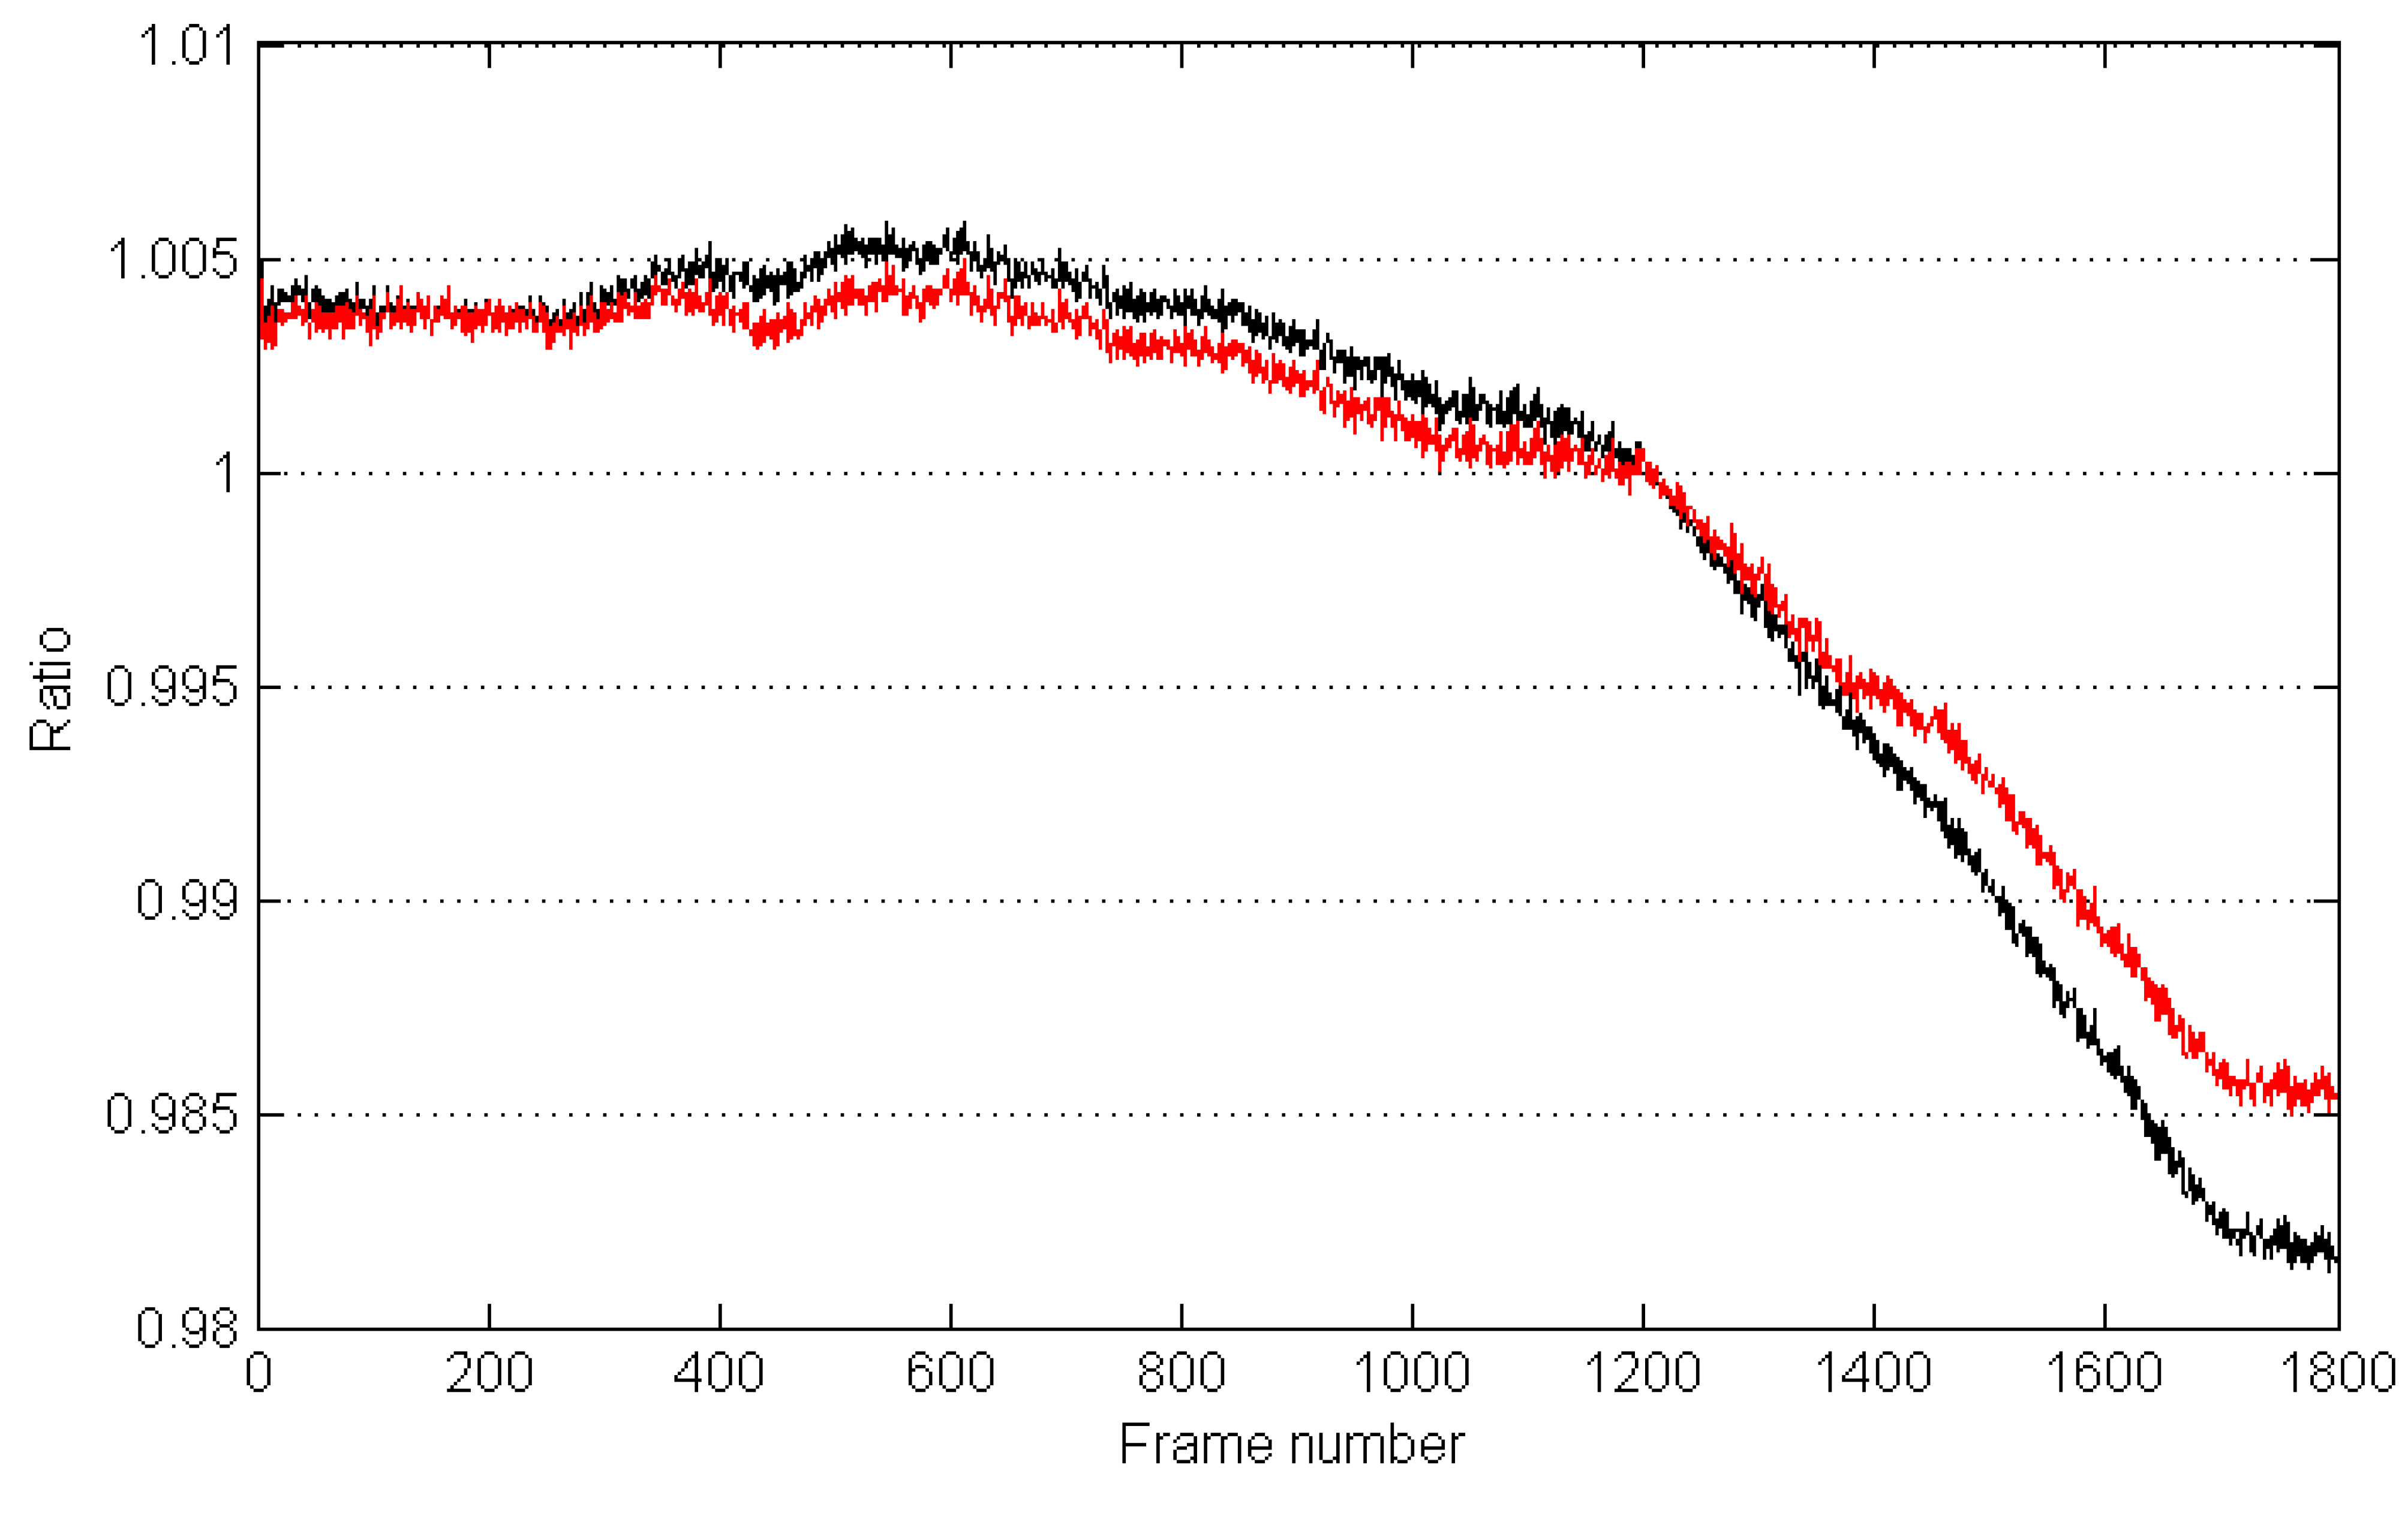
Remotesensing 06 10435 g006
Figure 7. 
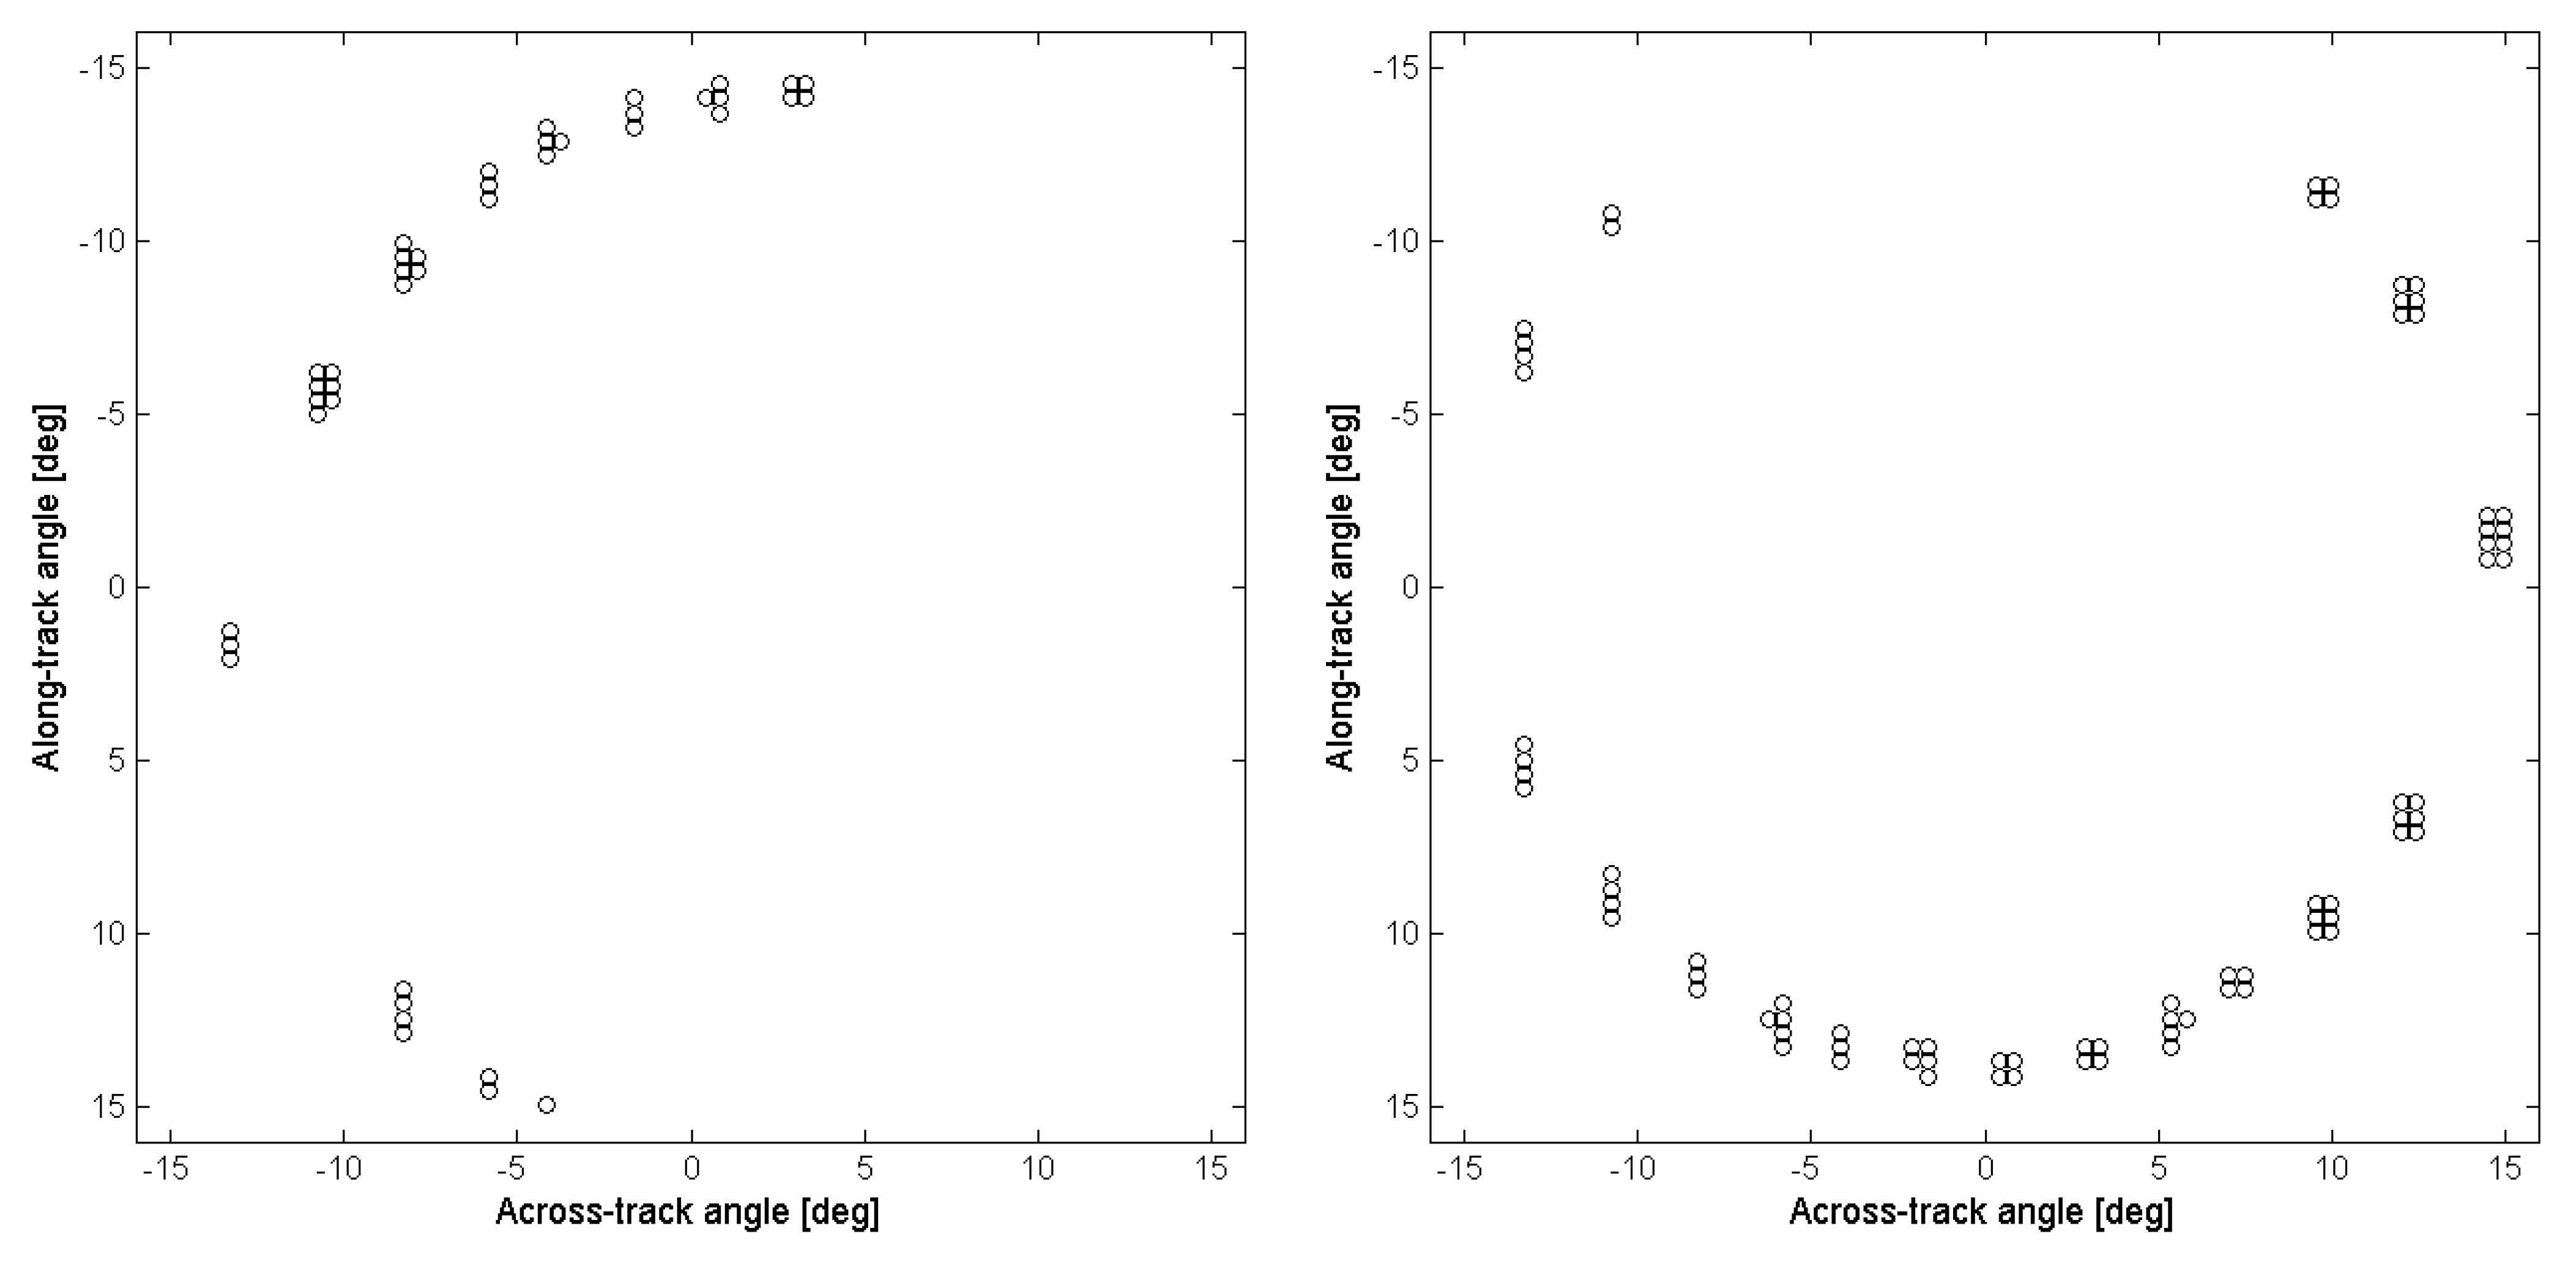
Graphs of the ghosting source locations of two different detectors from array -A (left) and array -C (right) in band 11 based on the lunar scans. Each data point represents a lunar location (an angle in the across-track and along-track direction from the optical boresight) from which a ghost signal was observed for the particular detector. As implied in these diagrams, the ghost sources are different for each detector across the focal plane.
Remotesensing 06 10435 g007
It is clear from the lunar scan diagrams that out-of-field radiance is scattering onto the TIRS detectors. The scans also demonstrate that the scattering sources originate from an area roughly 15° from the optical boresight (Figure 4). To reduce the lunar image data to a manageable form, the image data was pulled for only the detectors used in the final data product (i.e., the rows used in the normal push-broom imaging mode). After smoothing the image data slightly to reduce noise, the data was separated such that any signals above a certain threshold (approximately 0.0005 of the peak lunar signal - roughly the noise level) were flagged as ghosts while any signals below the threshold were considered background noise. Additionally, signals that could be attributed to direct lunar positions (when the moon was directly on or very close to the detectors) were removed since the purpose of these scans was to isolate out-of-field ghost sources only. The resulting dataset contains a list of every detector and all of the associated lunar position vectors in which a ghost occurred for that detector. For example, detector #1 on band 11 of array -A might have 20 position vectors associated with moon locations that produced a ghost signal on that detector. Detector #2 might have 25 lunar position vectors associated with ghosts for that particular detector, and so on. Two examples from this dataset are illustrated in Figure 7.

4. Out-of-Field Ghosting Application

The lunar scan data confirmed the suspicion that stray light from outside the TIRS field-of-view was scattering onto the detectors. The lunar data provides a map for each detector (albeit sparse) of source locations from outside the field-of-view that would produce a ghost signal on the particular detector. The lunar data also provides an estimate of the fraction of the source signal that is detected as a ghost for each source location. The per-detector stray light location maps can be thought of as essentially point-spread functions which provide the direction and magnitude of the out-of-field radiance that is seen by the detector. The total signal on the detector is the weighted sum of all the out-of-field source locations and the directly imaged signal and can be expressed as,
T otal signal = Direct signal + Ghost signal = Directsignal + Σ{wi · L(θi)},
where the Direct signal is the radiance from the direct line-of-sight location. The signal, L(θi), from the ith out-of-field direction is weighted by wi and the summation over all directions is the additional ghost signal that appears on the detector.

4.1. Synthetic Scene Model

The stray light maps derived from the lunar scans are not complete spatial maps since the moon was not scanned over the entire out-of-field area (i.e., there are gaps in the across-track direction between the 15 vertical scans). However given this new stray light information, simulated image data were generated in an effort to recreate the banding observed in Earth imagery. By comparing simulated image data to actual image data, the quality of existing lunar maps could be evaluated and the potential need for additional lunar scans assessed.
The Digital Imaging and Remote Sensing Image Generation (DIRSIG) tool was used to generate simulated image data to support this effort. The DIRSIG software is a physics-based synthetic image generation tool developed at the Rochester Institute of Technology (RIT) that utilizes ray-tracing to simulate the interaction of light with a simulated landscape and atmospheric models in an effort to
generate realistic at-sensor radiance data [12]. Recent enhancements to DIRSIG enable the user to provide line-of-sight vectors for each detector and pointing information for the sensor as input, enabling a unique level of sophistication for sensor modeling [13,14]. When used in conjunction with its orbital model, DIRSIG is able to simulate image data that is both radiometrically and geometrically realistic. The Red Sea Earth scene was chosen as a test site to be modeled in DIRSIG due to the dramatic ghosting exhibited in actual TIRS image data (recall Figure 2).
To accomplish the objective of this study (i.e., create a synthetic TIRS image that resembles actual data observed from TIRS) several realistic data sources must be used as input to the DIRSIG model. While DIRSIG can support sophisticated scene modeling and complex geometries, it can also accept at-sensor radiance data directly as input. To define the simulated landscape for this application, MODIS radiance data was used as input to the model. A Landsat 8 two-line element (TLE) was provided to DIRSIG, which uses the SGP4 orbital model to determine the platform’s position as it moves over the scene of interest. Finally, a two-step approach was used to develop a sensor model and image the scene. First, image data without ghosting effects was generated using the direct line-of-sight information for each detector. Then, the direct line-of-sight vectors were replaced with the stray light map vectors derived from the lunar scan data and simulated data of the ghost signal sampled from the out-of-field radiance was generated. The sum of the direct image and the ghost image serves as an approximation of an actual TIRS scene containing stray light artifacts. Figure 8 illustrates the direct line-of-sight image, the ghost image, and the combined image for an initial simulation over the Red Sea. Banding is evident in the combined simulated TIRS image. A side-by-side comparison of the real TIRS image of the Red Sea from Section 2 and the simulated TIRS image of the same location is illustrated in Figure 9.
The simulated TIRS image reproduces similar banding effects that are seen in real TIRS imagery of the same scene. The simulated image will not exactly reproduce the real TIRS image since the MODIS scene used as input to the model was not acquired coincident with the TIRS data. In addition, the out-of-field radiance was sampled from the incomplete stray light maps containing gaps in the lunar scans. However, despite the absolute differences, the simulation incorporating the ghosting information provides a very strong reassurance that stray light is the cause of the banding effects in TIRS.
Figure 8. Simulated Red Sea direct line-of-sight image (left), ghost signal image (center), and combined image (right).
Remotesensing 06 10435 g008
Figure 9. Real TIRS image of the Red Sea (left) and DIRSIG-generated simulated image (right). Similar banding artifacts observed in the actual TIRS scene are reproduced in the DIRSIG scene.
Remotesensing 06 10435 g009

4.2. Absolute Calibration Model

Stray light will also contribute to the absolute calibration error between TIRS and vicarious buoy measurements. A study was performed to calculate the amount of added signal on TIRS due to ghosting that would be detected in scenes containing buoy measurements. Recall from Section 2.2 and reference [2] that there is an absolute difference between the TIRS-reported radiance and the top-of-atmosphere radiance derived from buoy measurements that is scene dependent and varies with season. For this study, eight TIRS band 10 images of Lake Tahoe were chosen to compare with buoy measurements in the lake. As evident in Figure 10, Lake Tahoe falls in the center of focal plane array -C for all nominal daytime passes over the lake.
A ghost map for the center of focal plane array -C is created by starting with the lunar scan data for the center detectors on the array and then manually filling in the gaps in the lunar coverage and extrapolating the weighting of the ghost source area. This process is illustrated in Figure 11. First the lunar locations that produced a ghost signal on the center of the array are graphed (Figure 11a). Next, to account for the gaps in the lunar coverage, it is assumed that the stray light source locations are roughly symmetric in the across-track direction for these center detectors. This assumption is based on the data presented in Figure 7 and is required since the actual lunar scan locations are not perfectly symmetric on either side of the boresight. The lunar stray light locations are then mirrored about the along-track axis (Figure 11b). Then, the area of the remaining gaps in the lunar coverage is estimated (Figure 11c). Finally, a region of interest (ROI) mask is drawn to encompass the entire filled-in lunar stray light area (Figure 11d). The original lunar data showed that the total magnitude of the ghost signal was 0.5% of the radiance in the stray light source region. Scaling up for the total area filled in between the gaps in the lunar data, the corresponding magnitude of the ghost would be 2.86% of the radiance in the filled-in stray light source region. In other words, the ghost signal in the middle detectors on array -C is 2.86% of the total radiance in the blue area in Figure 11d.
Figure 10. TIRS image of Lake Tahoe (WRS2 Path/Row 043/033). The lake falls on the middle of the center focal plane array (array -C).
Remotesensing 06 10435 g010
Figure 11. From left to right: (a) lunar stray light map for the center detectors on array -C; (b) assuming symmetry in the across-track direction for the center detectors, the stray light source locations are mirrored about the along-track axis to begin to fill in the gaps in the lunar coverage; (c) the remaining gaps are manually approximated; (d) a region of interest (ROI) is drawn to encompass all the stray light source region. The horizontal and vertical axes in the graphs extend approximately ±15° from the boresight.
Remotesensing 06 10435 g011
Now that an approximate stray light map ROI has been created for the center detectors on array -C that image Lake Tahoe, the ROI can be used to sample the out-of-field radiance and properly weighted to calculate the total ghost signal for those detectors. For this study, near coincident image data from the Geostationary Operational Environmental Satellite (GOES) Imager was obtained and sampled with the stray light ROI mask [15]. Figure 12 illustrates the locations on a GOES image of Lake Tahoe that are sampled to calculate the ghost signal.
Figure 12. GOES thermal image of the Lake Tahoe region. Outline of the TIRS scene and the stray light ROI for the center detectors on array -C are shown for reference.
Remotesensing 06 10435 g012
Figure 13. TIRS absolute calibration error based on eight buoy measurements of Lake Tahoe (red) and the absolute calibration error after an adjustment for the estimated ghost signal based on sampling of co-incident GOES imagery (blue). The ghost signal removes the bulk of the absolute calibration error and reduces the standard deviation of the measurements.
Remotesensing 06 10435 g013
Eight TIRS Lake Tahoe scenes spread out over a half year were obtained from the USGS Earth Explorer website and the radiance for the lake was extracted from the images [7]. The coincident top-of-atmosphere (TOA) buoy radiances were provided by Simon Hook at NASA/Jet Propulsion Laboratory (JPL). The difference between the buoy TOA measurements and the TIRS image measurements were calculated. Next, the near-coincident GOES images of the same scenes were obtained. The stray light ROIs were used to sample the GOES imagery and the total radiance in the ROI was weighted by 2.86% to yield the magnitude of the ghost signal. The calculated ghost signal was then subtracted from the TIRS image radiance for the detectors over the lake and these ghost-corrected measurements were compared to the buoy measurements. The results are illustrated in Figure 13.
Although the gaps in the lunar stray light source map were manually filled in, this study demonstrated that the magnitude of the approximated ghost signal matches the magnitude of the error between TIRS and the buoy data to first order. It provides further evidence that stray light is a significant factor in the absolute calibration error for TIRS.

5. Correction Methodologies and Paths Forward

The evidence presented here has demonstrated that stray light is the source of the banding artifacts in certain TIRS Earth scenes and also significantly contributes to the absolute calibration error for TIRS. Various strategies are being studied to correct the stray light problem. Currently the Optics group at NASA/Goddard Space Flight Center (GSFC) is reverse engineering the data from the lunar scans to create a more complete optical model of the stray light source locations for each detector. These maps will provide significantly better knowledge of the stray light source locations and weighting needed to calculate the ghost signal on each detector. The Optics model will also determine the exact cause of the stray light in the optical system.

5.1. Possible Correction Method

Given the current information available, a correction strategy was developed to utilize the existing knowledge of the stray light source locations along with wide-field image data from another imaging sensor to calculate and remove the ghost signal from TIRS imagery. The main objective was to demonstrate a methodology to correct the ghosting with the understanding that a full correction was not currently possible given the resources available at the time (i.e., the incomplete stray light maps).
As demonstrated in Section 4, image data acquired by a sensor with a wider field-of-view than TIRS can provide the out-of-field radiance knowledge required to calculate the ghost signal on TIRS. Radiance data from this sensor must be sampled for every TIRS detector utilizing the lunar stray light source maps. The out-of-field radiance is sampled and weighted by the appropriate fractions to arrive at the amount of signal that must be subtracted from the TIRS detector (recall Equation (1)). This process must be performed for all TIRS detectors using the unique stray light map for the particular detector and must also be performed for every push-broom frame.
The Red Sea area discussed thus far will serve as a test scene to demonstrate the correction concept. The Terra/MODIS sensor was utilized for the out-of-field radiance knowledge for TIRS. The Terra/MODIS instrument acquires imagery approximately a half hour after TIRS. Near-coincident data collection is preferred in order to ensure that the thermal and atmospheric changes in the scene between collection times of the two instruments is kept to a minimum. For the case of Terra/MODIS, the collection time is favorable, however the TIRS scene is located at the extreme viewing angle (60°) of the MODIS sensor due to the orbital geometry of the Landsat 8 and Terra observatories. To avoid off-angle effects in the MODIS imagery, an image from the following day was obtained instead. For this case, the TIRS scene is located in the center of the MODIS scene, thereby eliminating angular effects. Of course comparing a TIRS scene and a MODIS scene on two different days leads to the potential problem of environmental differences between the two non-coincident images. However, for the scenes selected in this study, careful attention was made to choose scenes as close as possible in time (within one day) and scenes with near-zero cloud cover. These constraints will minimize differences between the TIRS and MODIS images. The scenes used in this study are shown in Figure 14.
Figure 14. TIRS band 11 interval of the Red Sea acquired on Day 2013274 (left) along with a Terra/MODIS band 32 interval of the same area acquired on Day 2013275 (right). The blue box in the MODIS image indicates the extent of the TIRS image data.
Remotesensing 06 10435 g014
The lunar stray light maps for each detector are used to sample the MODIS image and calculate the ghost signal for every detector and for every frame. The stray light maps for each detector are expressed as direction vectors relative to the TIRS boresight along with the associated weights. Given the location and pointing telemetry from the observatory, the vectors are projected onto the Earth’s surface to express the stray light map as a series of latitude/longitude points. Transforming the stray light map vectors into geo-located points on the Earth allows a convenient way to sample the appropriate locations in the MODIS image since the MODIS radiance product is geo-located as well [16]. The result of this sampling and weighting of the MODIS scene is an image of the ghost signal for the TIRS interval that must be subtracted from the TIRS data.
Examination of the ghost image (Figure 15) reveals that the sampling method is producing the desired behavior. The amount of ghost signal varies as a function of line number (push-broom frame). This distribution is anticipated since the ghost signal is expected to be greater if the stray light map locations contain higher radiance values (from land, for example). As seen in the MODIS image from Figure 14, the radiance from land and water on the east and west side of the TIRS interval varies as the sensor collects push-broom data from north to south in the interval.
A corrected TIRS interval is constructed by subtracting the ghost image from the original TIRS interval data. The difference between the corrected and the original intervals is best demonstrated by a comparison of the along-track ratio of detectors near the focal plane array boundaries as shown previously in Figure 3. The comparison of the ratio for this methodology study is shown in Figure 16. Recall from Section 2 that ideally the along-track profile ratio should be one if the sensor is properly calibrated and no stray light effects are present. The data in Figure 16 demonstrate that although the ghosting correction has not fully removed the effects of the stray light (due mostly to the incomplete stray light map information), it has moved the ratio closer to one. The power of the per-frame correction is evident in that it corrects areas with a greater absolute difference more than areas with a smaller difference.
Figure 15. Ghost signal image created by sampling the MODIS scene using the per-detector stray light maps derived from lunar scan data (units are in spectral radiance).
Remotesensing 06 10435 g015
Figure 16. Comparison of the along-track profile from the TIRS Red Sea interval before the ghosting correction (black) and after the ghosting correction (red). The profiles are the ratio of the east array to the center array in the overlap region between the arrays.
Remotesensing 06 10435 g016
This study demonstrated the successful use of the methodology of utilizing stray light map information along with coincident radiance data from a wide field-of-view sensor to calculate the contribution of the ghost signal on a per-detector, per-frame basis. The derived ghost signal can then be subtracted out from a TIRS image to remove the effect of the unwanted ghost signal. Although short cuts and assumptions where made in this demonstration and incomplete stray light map data were used, the methodology of the process appears promising towards the development of an operational solution that may be implemented by EROS or by users themselves.

5.2. Paths Forward

A refinement of the correction method just discussed is currently underway. As the TIRS stray light optical model becomes available, complete per-detector stray light maps will be incorporated and will provide a substantial improvement to the calculation of the ghost signal. A strategy is also being investigated into how to best obtain near-coincident wide-field image data over any place on Earth. Finally, analyses of many scenes will allow for statistical approaches to be utilized to further refine the parameters of the correction method.
In addition, other strategies are also being explored. These include utilizing surrounding TIRS scenes from the Landsat data archive as a surrogate for the out-of-field radiance needed to calculate the ghost signal. Another strategy would involve deriving an estimate of the ghost signal based on the in-scene radiance. Different correction schemes will have advantages and disadvantages and ultimately the NASA/USGS Landsat Calibration and Validation team will weigh the various options and decide on a method for implementation.

6. Summary

Although TIRS has demonstrated internal stability over the first year of operation on-orbit, scene-dependent artifacts have been observed in Earth imagery that include banding and absolute calibration errors. The magnitude of both effects are roughly twice in band 11 as they are in band 10. The studies and analyses demonstrated here have shown that stray light is the cause of the banding effects and a significant contributor to the absolute calibration error. Radiance from outside of the instrument field-of-view is producing a non-uniform ghost signal across the focal plane that varies depending on the out-of-scene content. Special extended scans of the moon were performed to map the locations in the out-of-field that contributed a ghost signal on the focal plane arrays. The lunar stray light maps are not fully complete since the moon was not scanned over the entire out-of-field region. However, the maps provide a good initial indication that the stray light sources originate from roughly a 15° annulus from the optical boresight for every detector.
Using the stray light map information, TIRS images were simulated that reproduced the banding structure observed in TIRS Earth imagery thereby confirming the effects of the stray light. The per-detector stray light maps were also used to demonstrate that the absolute calibration error observed between TIRS and in situ temperature measurements could be explained by the same stray light issue. A possible correction strategy was demonstrated by utilizing the lunar-based stray light maps and near-coincident thermal radiance data from another wide field-of-view sensor (i.e., GOES/Imager or Terra/MODIS). The stray light maps were used to sample the out-of-field radiance and appropriately weight and sum that radiance to arrive at a predicted amount of ghost signal that must be removed from the TIRS data. This proposed method would be tailored for use in correcting TIRS imagery only. However, the method of utilizing detector stray light map information along with wide-field image data should be flexible enough to apply to any other imaging sensor that suffers from similar stray light effects.
Early results have shown that this methodology has the potential to correct for the ghost signal once a complete mapping of the stray light signal is constructed. Currently the Optics team at NASA/GSFC is modifying the TIRS stray light optical model to match the lunar measurements in order to produce the desired complete stray light maps. The correction strategy discussed here will be performed using the optical maps as they become available in order to demonstrate the full potential of the proposed correction method. This methodology (or other strategies currently being investigated in parallel) will ultimately be implemented into the USGS Landsat 8 ground processing system to remove the stray light effects from the TIRS imagery available to the user community. In the meantime, it is recommended that band 10 image data should be used in preference to band 11 since the artifacts in band 10 has in general exhibited adequate performance.

Acknowledgements

The authors would like to acknowledge the Landsat 8 Mission Operations Center team for the planning and execution of the lunar acquisition maneuvers and acknowledge Simon Hook and his team at NASA/JPL for providing the radiance measurements for the Lake Tahoe buoys. The work presented here was funded under NASA contract NNG09HP18C and NASA cooperative agreement NNX09AQ57A.

Author Contributions

All authors contributed to this work.

Conflicts of Interest

The authors declare no conflict of interest.

References

  1. Montanaro, M.; Levy, R.; Markham, B. On-orbit radiometric performance of the Landsat 8 Thermal Infrared Sensor. Remote Sens. 2014, in press. [Google Scholar]
  2. Barsi, J.; Schott, J.; Hook, S.; Raqueno, N.; Markham, B. TIRS vicarious radiometric calibration. Remote Sens. 2014, in press. [Google Scholar]
  3. Reuter, D. The Thermal Infrared Sensor (TIRS) On Landsat 8: Design overview and pre-launch characterization. Remote Sens. 2014, in press. [Google Scholar]
  4. Jhabvala, M.; Reuter, D.; Choi, K.; Jhabvala, C.; Sundaram, M. QWIP-based thermal infrared sensor for the landsat data continuity mission. Infrared Phys. Technol. 2009, 52, 424–429. [Google Scholar] [CrossRef]
  5. Bindschadler, R. Landsat coverage of the earth at high latitudes. Photogramm. Eng. Remote Sens. 2003, 69, 1333–1340. [Google Scholar] [CrossRef]
  6. United States Geological Survey. Landsat 8. Available online: http://landsat.usgs.gov/landsat8.php (accessed on 17 July 2014).
  7. United States Geological Survey. Earth Explorer. Available online: http://earthexplorer.usgs.gov/ (accessed on 17 July 2014).
  8. Montanaro, M.; Lunsford, A.; Tesfaye, Z.; Wenny, B.; Reuter, D. Radiometric calibration methodology of the Landsat 8 Thermal Infrared Sensor. Remote Sens. 2014, 6, 8803–8821. [Google Scholar] [CrossRef]
  9. NASA. Landsat Data Continuity Mission Thermal Infrared Sensor Requirements Document—Revision F1; Document Number GSFC 427-15-02; NASA Goddard Space Flight Center: Greenbelt, MD, USA, 2012. [Google Scholar]
  10. Hook, S.; Chander, G.; Barsi, J.; Alley, R.; Abtahi, A.; Palluconi, F.; Markham, B.; Richards, R.; Schladow, S.; Helder, D. In-flight validation and recovery of water surface temperature with Landsat-5 thermal infrared data using an automated high-altitude lake validation site at Lake Tahoe. IEEE Trans. Geosci. Remote Sens. 2004, 42, 2767–2776. [Google Scholar] [CrossRef]
  11. Navigation and Ancillary Information Facility, Jet Propulsion Laboratory, NASA. SPICE Toolkit. Available online: http://naif.jpl.nasa.gov/naif/toolkit.html (accessed on 23 April 2014).
  12. Schott, J.; Brown, S.; Raqueno, R.; Gross, H.; Robinson, G. An advanced synthetic image generation model and its application to multi/hyperspectral algorithm development. Can. J. Remote Sens. 1999, 25, 99–111. [Google Scholar] [CrossRef]
  13. Brown, S.; Sanders, N.; Goodenough, A.; Gartley, M. Modeling space-based multispectral imaging systems with DIRSIG. Proc. SPIE 2011. [Google Scholar] [CrossRef]
  14. Schott, J.; Brown, S.; Gerace, A.; Gartley, M. Modeling the image performance of the Landsat Data Continuity Mission sensors. Proc. SPIE 2011. [Google Scholar] [CrossRef]
  15. NOAA Satellite Information System. GOES Imager Instrument. Available online: http://noaasis.noaa.gov/NOAASIS/ml/imager.html (accessed on 17 July 2014).
  16. Level 1 and Atmosphere Archive and Distribution System (LAADS). LAADS Web. Available online: http://ladsweb.nascom.nasa.gov/ (accessed on 24 July 2014).

