Review

Validating the Remotely Sensed Geography of Crime: A Review of Emerging Issues

Department of Environmental Science, Policy and Management, University of California, Berkeley, 130 Mulford Hall #3110, Berkeley, CA 94720-3114, USA
*
Author to whom correspondence should be addressed.
Remote Sens. 2014, 6(12), 12723-12751; https://0-doi-org.brum.beds.ac.uk/10.3390/rs61212723
Submission received: 19 September 2014 / Revised: 18 November 2014 / Accepted: 19 November 2014 / Published: 18 December 2014

Abstract

:
This paper explores the existing literature on the active detection of crimes using remote sensing technologies. The paper reviews sixty-one studies that use remote sensing to actively detect crime. Considering the serious consequences of misidentifying crimes or sites of crimes (e.g., opening that place and its residents up to potentially needless intrusion, intimidation, surveillance or violence), the authors were surprised to find a lack of rigorous validation of the remote sensing methods utilized in these studies. In some cases, validation was not mentioned, while in others, validation was severely hampered by security issues, rough terrain and weather conditions. The paper also considers the potential hazards of the use of Google Earth to identify crimes and criminals. The paper concludes by considering alternate, “second order” validation techniques that could add vital context and understanding to remotely sensed images in a law enforcement context. With this discussion, the authors seek to initiate a discussion on other potential “second order” validation techniques, as well as on the exponential growth of surveillance in our everyday lives.

1. Introduction

Criminologists call crimes that have occurred, but that are not recorded or reported, the “dark figure of crime”, and they form a group of important missing statistics in understanding crime. Ever since crime statistics began being formally collected in the 19th century, this group of missing statistics has been a problem that has plagued law enforcement and criminologists [1,2]. This dark figure exists for two main reasons: victims fail to report crimes (e.g., because the crime has been committed by a close relation and/or there is fear of reprisal), and law enforcement agents are unable to detect crimes (e.g., because the crimes occur in remote or hidden places or because of a lack of staff or technology to conduct full surveillance of the population). There have been many attempts by law enforcement and criminologists to better estimate crime and diminish this dark figure through improved and new types of surveillance, anonymous reporting systems and victimization surveys, like the National Crime Survey (NCS) (e.g., [3,4,5]). More recently, law enforcement at international, national and regional levels has attempted to detect crime by using remote sensing technologies. Using imagery collected remotely, from sensors onboard aircraft, unmanned aerial vehicles and satellites, law enforcement agents have been able to assess where and when certain kinds of crimes have taken place.
The use of remote sensing, the “observation of earth’s land and water surfaces by means of reflected or emitted electromagnetic energy” [6] or, more simply, a method of “acquiring data about an object without touching it” [7], for surveillance and analysis has obvious benefits for law enforcement agencies (for an excellent conceptual diagram of remote sensing, see Jensen [7]). It greatly expands the supervision of agents of the law in often remote or inaccessible places, reduces the exposure of these agents to dangerous circumstances on the ground and may make up for a lack of manpower (these technologies are referred to as “force multipliers” in some law enforcement fields). At the same time, using remote sensing has at least three serious limitations. First, and perhaps most obviously, remotely sensed images that are gathered from overflying helicopters, aircraft or satellites can only detect crimes or crime’s impacts that are visible from above and for sustained periods of time. For example, remote sensors can identify illegal logging, large-scale drug production, and trails in the desert but they would be much less likely to detect murder, assault, homicide, robbery, or other small-scale, undercover, rapid actions, though some attempts have been made to capture the lasting effects of these things, for examples, see Pringle and others (2012) [8].
Second, remote sensing cannot record the social, political, economic and historical context of landscapes and the actions that take place within them. Crime and criminals are subjective, spatially delineated and historically contingent categories. They are not, nor ever have been, pre-determined or natural classifications. As laws, land use regulations, as well as national and local power relations shift, so do the definitions of crimes and criminals (see [9]). Thus, remote sensing cannot detect crime as it might detect a stand of a certain tree species: crimes, their perpetrators and their forms are defined by the dominant forces in society rather than spectral signatures or texture patterns. Because remotely sensed images are collected remotely (by definition), they lack detailed or nuanced definitions of crime drawn from the context of the landscapes they seek to analyze; they do not tell us why certain things happened or by whom, specifically. They leave understandings of causality and attribution to their interpreters.
Despite the serious imbalances and problems that may arise from the remote sensing of crime, it continues apace, as we have seen from increasing discussions in the popular press and academic journals about the use of unmanned aircraft systems (UASs/UAVs/drones), increasing availability of micro-satellites [10] and Google Earth images in the detection of crime (See Figure 1). The continued and increasing use of remote sensing for these purposes brings us to the third limitation that we will mention here: the issue of validation. As remote sensing scholars, such as Jensen [7], Congalton [11] and Foody [12] note, validation is a critical part of any remote sensing exercise, and these scholars and others have laid forth strict protocols for validation exercises. Validating that crimes are actually occurring in the places that remote sensing algorithms (and their interpreters) say they are is not a simple task, however. On the ground, verification of potential illicit drug production, arms and drug smuggling or even illegal logging, activities which are often protected by, or associated with, armed guards or agents, is often dangerous. The lack of validation in the remote sensing of crime is troubling, however, because drastic military or police actions are often used to intervene where crimes are detected with lasting ecological, economic and social impacts: lives, security and livelihoods can be at stake, not to mention law enforcement credibility and resources. In short, classifying an action as a crime or a person as a criminal may have much higher costs than other classification mistakes. Thus, we must be doubly sure of what we classify as crime using remotely sensed images before we act. Further, such validation may add nuance and greater contextual understanding of the images used for analysis, which may allow for a more fair and balanced law enforcement response.
Figure 1. Results from Google Scholar searches for “crime” and remote sensing terms from 1999 to 2012.
Remotesensing 06 12723 g001
Although all three of the above limitations are important to consider, this paper will take a methodological approach to engage with the issue of the validation of remotely sensed crime. We believe a focus on validation is critical, because as remotely sensed products become increasingly available to our desktops and smartphones, a rising trend of validation-free analysis is emerging. In these circumstances, products, like Google Earth, are used with the assumption that their images portray “the truth”, which should be acted upon [13]. Despite the ease with which these data now flow to us, validation of our findings based on these images remains critical; competing sensors, processing methodologies and the familiarity of analysts with the limitations of the data they are using can present very real challenges to the ethical and accurate use of remote sensing in law enforcement and/or litigation [13].
In this paper, we will first analyze how remote sensing technologies have been used to aid in the detection of crimes that might otherwise go undetected. As other authors have shown, “satellite imagery highlights the spatial footprint of human actors in very real and compelling ways” [14,15,16]. Here, we review the literature that discusses how satellite and airborne technologies have been used in the active detection of felony cases of drug production, smuggling and extra-legal migrations. We use the term “extra-legal” here, rather than “illegal,” in order to highlight the fact that though these acts are prohibited by USA or international law, the prohibition of these actions is often highly political and may not be deemed illegal in all cultures or by all groups. Forensic remote sensing has also been critical (and frequently used) in the detection of environmental crimes, such as extra-legal mining and timber extraction, as well as in detecting oil spills and hazardous waste dumping [14,16,17,18,19]. While the use of remote sensing in environmental forensics of this kind are important, many of the articles on these topics are embedded in larger land-clearance, deforestation and oceanographic literatures that deal with licit, illicit and accidental extraction or pollution, making the attribution of legality associated with the event difficult. Forensic remote sensing can also be used to identify the location of single and mass grave sites, but because most of these studies are experimental or historically oriented, we excluded them from our review [8,15,20]. Remote sensing has also been used to find bodies, munitions and toxic waste that may have drifted based on water-current analysis [21]. While our scope is narrower than that of forensic remote sensing, we do draw upon the advances in crime detection and validation that these studies have advanced in our analysis. Second, building on this literature review, we consider what kinds of validation protocols for the remote sensing of crime have been attempted and what the limitations to these protocols are, geographically, financially, as well as in terms of personnel and time. Third, we seek to generate a discussion on new and less traditional ways that crime may be sensed remotely or validated. While “first order” validation protocols, such as the collection of ground reference data, over flights and the use of higher spectral or spatial resolution images, are critical to assessing the accuracy of remotely sensed processes, they may not always be useful, possible or sufficient in the context of criminal investigations. Here, we propose going beyond the “first order” validation protocols that are standard in remote sensing to ensure accurate assessments of remotely sensed crime are occurring in ethical and contextually-situated ways.

2. Remotely Sensing Crime

Here, we define the remote sensing of crime as the use of airborne and satellite remote imagery to detect crimes that have heretofore gone unreported or undetected. Lein [14] describes forensic remote sensing as considering “the investigative use of image processing technology to support policy decisions regarding the environment and the regulation of human activities that interact with environmental process and amenities.” In this definition the term “forensic” refers to detailed investigation rather than a criminological one (see also: Ruffell and McKinley [16]). As Lien [14] points out, forensic remote sensing (or the remote sensing of crime, in our case) seeks to generate information pertaining to a specific event rather than “provide a broad thematic explanation”. As we note above, not all crimes are well suited to detection by remote sensing, however. Those crimes that have been most successfully detected using remote sensing technologies generally have the following three characteristics: first, they occur over relatively large geographic areas, so that their patterns may be easily detected, even with moderate or low spatial resolution imagery, like Landsat (30-m resolution) or MODIS (250-m resolution); second, the crimes or their evidence are generally visible for extended periods of time, allowing for their detection by satellites or airborne sensors over the length of a day, week or month; and third, they generally have characteristic spatial or spectral patterns that can be recognized from above using object-based analysis or spectral analysis.
This paper focuses on the utility of remote sensing in detecting crimes that are deemed a felony offense under U.S. federal law and are recognized as crimes internationally: arms, drug and human trafficking, repeat extra-legal migration and drug production/possession (see [22,23,24,25,26]). While there exists a plethora of academic papers that test methods that could theoretically be used for the remote sensing of crime—testing algorithms, detection techniques or spectral reflectances of illicit crops (e.g. [27,28,29]) and smuggling trails [30,31]—there are relatively few studies that document the use of remote sensing in the active reconnaissance of criminal activities. In this section, we review studies of active reconnaissance that exist in peer reviewed journals, as well as in gray literature in relationship to drug production, smuggling and extra-legal migrations. The characteristics of these activities fit those described above: they often occur in large geographic and temporal scales and may be uniquely identifiable from the surrounding landscape using aerial images. Because of these attributes, they represent the most common examples in papers regarding remote sensing used in the active detection of crimes.
We reviewed 61 papers, reports from the United Nations Office on Drugs and Crime and master’s theses on these topics that were found through searches in the Google Scholar, Web of Science and Jstor search databases using a number of combined words and phrases (see Figure 2). Some of these reports involved multiple case studies. Though, as Figure 1 shows, there were thousands of results that came from these combinations of search terms, very few of these results dealt with the active reconnaissance of crimes using remote sensing. We do acknowledge that there are probably many more reports and papers available on this topic in the law enforcement literature that are not available to the public. Government agencies, like Homeland Security, the Federal Bureau of Investigation and the Central Intelligence Agency, as well as international law enforcement agencies, like Interpol, may have extensive documentation on these topics that we were unable to access.
Figure 2. Search terms, phrases and combinations thereof used for the literature review.
Remotesensing 06 12723 g002

2.1. Remote Sensing of Illicit Drug Production

Most prevalent in literature involving remote sensing of crime were studies on the detection of the cultivation of illicit substances. While the criminalization of each of these plants and their use is fraught with important political, cultural, economic and militaristic implications, an in-depth discussion of the reasoning behind these criminalizations and their ethics is beyond the purview of this article. Rather, we narrow our focus to the application of remote sensing products to actively detect “crime”, as it is construed by international or national governing powers. The use of remote sensing to detect the cultivation of illicit crops is a trend that has increased over time, perhaps because of the opening of the Landsat archives in 2008, and perhaps because of interest in opium growing in Afghanistan and South East Asia (see Figure 3). We gathered the publicly available literature on the remote sensing of drug production (coca, opium poppies and cannabis) in Afghanistan, Myanmar, Thailand, Laos, Bolivia, Colombia and Peru, countries targeted for drug production monitoring both by the UN’s Office of Drugs and Crime (UNODC) and academic researchers, due to these countries’ historically high exports of illicit substances (see Table 1 [32,33,34,35,36,37,38,39,40,41,42,43,44,45,46,47,48,49,50,51,52,53,54,55,56,57,58,59,60,61,62,63,64,65,66,67,68,69,70,71,72,73,74,75,76,77]).
Figure 3. Results from Google Scholar searches for “drugs” and remote sensing terms, 1999–2012.
Remotesensing 06 12723 g003
Using remote sensing to detect the growth of illicit drugs can be extremely helpful to those seeking to eradicate these plants, apprehend their cultivators, and limit the trade of the substances they produce. Unlike in-person surveys (which the United Nations Office of Drugs and Crime (UNODC) actually does conduct in some areas), which are labor intensive, time consuming, expensive, and potentially life threatening, remote sensing allows a small number of analysts to survey vast stretches of land to locate scattered sites of illicit crop production. Further, illicit crop detection methods that utilize remote sensing enable more frequent and complete surveys of the landscape than in-person surveys would. These techniques can focus the efforts of law enforcement officers, defoliant missions, and outreach programs. Remote sensing techniques may also allow governments and international groups to target drug production sites without putting their agents in harm’s way, or tipping off producers that some kind of action may be taken against them (sensu [32,33]).
Although the war on drugs began in the 1970s, the first publicly available papers we found on the active detection of illicit crop growth using remote sensing technologies were Sadler’s (1990) [78] discussion of opium in Afghanistan and Chuinsiri and others’ (1997) [35] detection of opium growth in Thailand. It was not until 1999 that groups like the UNODC’s Illicit Crop Monitoring Program began using remote sensing techniques to detect the growing of drug crops, particularly coca and opium poppies [79]. The first UNODC cannabis survey was carried out in collaboration with the Afghan Ministry of Counter Narcotics (AMCN) and was not carried out until 2009 [74,79].

2.2. Remote Sensing of Smuggling and Extra-Legal Migration

Like the criminalization of drug production, the criminalization of human movements across national borders either for migration or trade is also fraught with problematic social, political, economic, and militaristic issues and implications. Here, again, in-depth discussion of the reasoning behind these criminalizations and their ethics is beyond the purview of this article and we narrow our focus to the application of remote sensing products to actively detect “crime”, as it is construed by international or national governing powers.
Though border concerns have existed since the conception of the United States, post September 11, 2001, these concerns grew markedly. Fences, walls and guard posts along the U.S. Mexico border were established or fortified. More regular patrols of the borderline by Homeland Security agents were initiated [80]. These infrastructure and personnel investments are expensive to initiate and maintain and are still ineffective at complete surveillance of the 3145-km border; approximately 250,000 people try to cross the border illegally each year [81] (even with the vigilante border patrollers (Minutemen) who have stepped into action). Aside from the human rights violations that such forms of surveillance pose to groups seeking to cross the border, these homeland security activities are also threats to the environment. Environmentalists worry that the new roads, fences and facilities created to accommodate these new forms of surveillance are degrading fragile desert landscapes, ripping up vegetation, compacting soil and threatening wildlife movements (e.g. [82,83]). Finally, these operations seriously threaten precious and irreplaceable archeological sites located along the nations’ borders [84].
Although the use of remote sensing cannot address the human rights violations, geopolitical tensions or cultural and ethical problems posed by current forms of border surveillance, it does offer ways to make homeland security efforts more efficient at recognizing extra-legal migrations, while also potentially lessening the impact of current efforts on the environment and cultural heritage sites. Using aerial and satellite images, remote sensing can allow Homeland Security officers to target their surveillance and enforcement efforts by revealing where smuggling or migrations are taking place by displaying habitual paths through the desert. They may also allow law enforcement agents to stay out of harms’ way during reconnaissance missions [85]. Further, with increasingly advanced technology, remote sensors affixed to light aircraft provide almost real-time detection of human movement across the landscape. Targeted efforts and fewer law enforcement vehicles and patrols for surveillance may lessen the impact of border security on local ecologies. The use of remote sensing for the purposes of detecting illicit migration or trade are increasingly on the rise (see Figure 4).
Table 1. Summary of available studies using remote sensing in the active reconnaissance of drug production.
DrugYears Data CollectedCountriesSensors UsedImage DataCalibration MethodsAccuracy Assessment MethodsNo Accuracy Assessment Due to Security IssuesIncomplete Accuracy Assessment Due to Security IssuesNo Discussion of AccuracyTotal No. of StudiesCitations
Opium1993, 1995, 1999–2009 2011–2013Afghanistan; Laos (Lao PDR); Myanmar; ThailandMODIS; ALOS; ASTER; Landsat TM; Landsat 5; Landsat 7; Landsat 7TM; Landsat 7ETM; IKONOS; EO-1 Hyperion; SPOT5; Squirrel Helicopter photographs/video; QuickBird; GeoEye; WorldView 2; Ultracam D Digital CameraHigh-resolution multispectral images; multi-spectral bands; 4MS band and 4 + 1 (MS + panchromatic bands); band combination 432; true and false color combinationsFieldwork; land cover maps; high resolution images; phenological charts; crop spectral signature; pre-/post-harvest images; individual expertise; aerial photographs; soil map; independent classifications of Landsat images done and compared; comparison with helicopter images; village surveysGround verification; retrospective data and previous surveys to check methods; ground photography; classification checked by experts561537[32,33,34,35,36,37,38,39,40,41,42,43,44,45,46,47,48,49,50,51,52,53,54,55,56,57,58]
Coca2003–2008, 2011–2012Bolivia, Colombia, PeruLandsat 5; Landsat 7ETM+; SPOT 4; SPOT 5; ALOS; IKONOS; GeoEye; ASTER; IRS6-LISS III; AIC Digital CameraRGB (4, 5, 3); RGB (5, 4, 3); RGB (4, 3, 7); RGB (7,3,2); RGB (4, 3, 2); RGB (1, 2, 4); multi-spectral; pan chromatic; near-infrared and mid-infraredSpectral characteristics; field verification; historical flight plans of coca eradication airplanes; overflights, ground information from police; higher resolution; image comparison; expertise; comparison with previous years’ images; land use maps; paper maps; texture, shape, size of plotsGround verification; retrospective data and previous surveys; overflights; comparison with aerial photography15417[59,60,61,62,63,64,65,66,67,68,69,70,71,72,73]
Cannabis2010–2012AfghanistanGeoEye; QuickBirdVery high resolutionGround-truth observations, spectral signatures, overflights, NDVI time series using Landsat 5 and 7 helped produce vegetation indexesNot described2024[74,75,76,77]
Figure 4. Results from Google Scholar searches for “illegal immigration” and “smuggling” and remote sensing terms from 1999–2012.
Remotesensing 06 12723 g004
Remotely detecting smuggling or extra-legal migrations is more difficult than detecting the growth of drug crops, because these illicit activities are not static; people and goods can move across a landscape in a matter of hours. Thus, the adoption of these techniques is still in progress. To try to detect where drug, human and arms smugglers were traveling through the landscape, Kaiser and others (2004) [86] used ADAR (Airborne Data Acquisition and Registration) 5500 mounted on a helicopter to try to detect trails crossing the desert border along the southern limit of the United States. Cao and others conducted a similar study in 2007 [87]. Coulter and others (2012) [88] used a Canon EOS 5D Mark II camera system fixed on a light aircraft to detect the active movement of people through the landscape in near-real time.
In all of the terrestrial cases we reviewed (three), it is assumed that the movement of any people through this landscape is linked with smuggling or extra-legal migrations, since remote sensors are unable to detect the intentions or identities of these people. This, in and of itself, is a problematic assumption given that these areas have traditionally been used by indigenous groups, homesteaders and cattlemen for generations. In situ interactions with people in these areas would facilitate the detection of various people’s identities and intentions. Problematic at a different level, remote sensing would be unable to detect smuggling operations that occur via trucks or through tunnels under the U.S.-Mexico border, which may be equipped with electricity and rail systems (e.g., [89]).
The U.S.-Mexico border is not the only place where remotely sensed surveillance for crimes and criminals is taking place, however. As Zhao (2014) [90] shows, many countries in Europe, Asia and North America are working to develop ship surveillance systems to detect ships that may be used for extra-legal migration, illegal fishing, piracy and smuggling along maritime borders (cf. [91]). These surveillance systems integrate Synthetic Aperture Radar (SAR) satellite data with automatic identification systems (AIS) that are ship, land and space-based. Although we did not find any studies that chronicled the active detection of crime (e.g., piracy, extra-legal immigration, smuggling), there exists a plethora of studies that present theoretical or retrospective case studies of how this might take place. These studies tested the use of TerraSAR-X, TanDEM-X, RapidEye, RADARSAT, Envisat-ASAR, Cosmo-Skymed, MODIS and ALOS images to detect the presence of ships in the Mediterranean, the North Sea, the Gulf of Aden, the Campos Basin, the English Channel, the Port of Halifax, the Bosporus, the Ionian Sea, the Southern Ocean and the Strait of Italy [90,91,92,93,94,95,96,97,98,99,100,101]. There also exists a fairly extensive literature that deals with the active detection of oil spills (e.g., Brekke and Solberg [102]), as well as illicit drift-net fishing (e.g., Horn and Zegers [103]). Both of these topics fall outside the realm of our analysis, however.
While these studies differ from terrestrial studies of human and drug trafficking in that they acknowledge that ships may have many uses that are not nefarious, these studies do seek to survey some of the most vast and unmanned areas on the planet. Differentiating between legitimate ship users and potential pirates or smugglers presents a challenge. Some scholars have proposed methods of differentiating “abnormal behavior” [104] from standard shipping procedures to identify piracy in action. These studies consistently must deal with false alarms in their detection algorithms caused by oceanographic or meteorological phenomena (e.g., breaking waves, surface currents, surface wind) and bathymetry—underwater banks and azimuth ambiguity [99,100].

3. Accuracy Assessments of Remotely Sensed Crime

Any credible remote sensing project should assess the accuracy of its results, and particularly those used in the active detection of crime. In these projects, accuracy or validity can be thought of as the “correctness” of the resulting map or classification product [12]. The means by which accuracy assessments have been carried out have changed over time, starting as an afterthought (at best) [12,105,106] and progressing to a well-defined and necessary component of remote sensing analyses [11,12]. These “first order” accuracy assessment protocols ideally include well-distributed independent samples from the ground or a data source of higher accuracy (e.g., higher resolution imagery), development of error matrix reporting of the overall error, errors of omission and commission per land cover class and the kappa statistic [12,107,108].
Although remote sensing analysts attempting to detect crimes acknowledge that ground-referenced data is the gold standard for accuracy assessment, publicly available gray literature and peer reviewed papers agree that this method is not always feasible, due to security concerns, rugged and remote terrain and funding limitations. Eleven of the 58 studies on drug production that we reviewed reported that their accuracy assessments were limited due to insecurity issues on the ground. Of the same group, eight reported that no accuracy assessments were possible because of insecurity (Table 1). The security concerns addressed in these reports are very serious. For example, a member of a ground survey crew in Afghanistan was killed while collecting data on cannabis production in 2009 [57,74]. Ground validation of extra-legal migrations in U.S. borderlands was also limited by security concerns and dense vegetation [86].
In order to avoid the issues presented by potentially dangerous and/or expensive field missions for ground reference data collection, analysts seeking to assess the accuracy of their illicit drug identification have come up with alternative methods (see Table 1). For example, Chuinsiri et al. [34] used large-scale aerial photographs collected at the same time as the satellite data for accuracy assessment instead of gathering ground reference data. Unfortunately, these aerial surveys may not be as effective as ground surveys. For example, in a similar study, aerial surveys were often unable to detect shade-grown coca [59]. In other cases, bad weather delayed the collection of data from aircraft, putting the utility of the data collected for accuracy assessment into question [73]. Further, one UNODC [63] report notes that even over-flights were too dangerous in certain regions, thus limiting the accuracy assessment within those areas.
In cases where ground or aerial validations proved unfeasible, analysts sought other means of performing accuracy assessments of their detection of illicit crops. In some cases (e.g. [44]), “surrogate” ground-reference data were produced using the visual interpretation of two satellite images using poppy reflectance, disappearance of the vegetation in the second image (harvest), apparent fields (open spaces) surrounded by natural vegetation, distance to populated spaces and accessibility. UNODC [48] used a quality control mechanism that involved each analyst’s work being checked by two other experts and then cross-validating first and second dated photographs rather than using ground validation data. Wang [37] used UNODC and the Islamic Republic of Afghanistan Ministry of Counter Narcotics’ surveys from the same time period as satellite data were collected to calculate the accuracy of his classification of opium crops. Where no survey data were available, Wang [37] used coarsely constructed opium maps.
Surprisingly, over thirty-six percent of the drug production studies reviewed did not mention accuracy assessments in any way (see Table 1). Those that did discuss validation often did so in limited ways. In one study, analysts did not update the previous years’ accuracy assessment, assuming that a similar level of accuracy could be considered for the year at hand [64]. Similarly, in all three of the studies of illicit human movements in the landscape that we reviewed, accuracy assessments either were not performed, or the methods for assessment were not mentioned or clearly discussed. For example, despite the fact that Coulter and others [88] have a table assessing the accuracy of their detections of trails, they do not describe how they calculated these percentages. The lack of discussion of accuracy assessments in drug and human-movement studies is surprising given the potentially serious impacts these reports may have on local communities and ecologies. Because this is a review paper, we were unable to independently research the potentially harmful ecological and social impacts that a lack of validation may have had, but we believe it is important to raise the point that studies with such important real-world implications should be validated; and many are not.
Most of the retrospective and theoretical marine case studies relied on ship-specific automatic identification systems (AIS) data to validate the remote sensing of ships. Posada and others [97] point out three problems with AIS to validate remote sensing. First, AIS equipment is often misused by its operators, resulting in the wrong ship ID numbers being attached to a given vessel, potentially misrepresenting the type of ship that is on the water. Second, AIS messages (terrestrial and space-based) “regularly contain errors (wrong time, position or other fields)”, leading to confusion in ship tracking. Third, AIS do not report ship position rapidly, thus, if there is a significant time gap between when SAR data were collected and when AIS data were reported, the ship may have moved a significant distance, making validation very difficult. Beyond these three limitations, Lehner and others [99] point out that smaller vessels may not have AIS and may also be more difficult to differentiate from false-alarms, like breaking waves. We posit that few ships intent on criminal activity would have AIS either. Finally, Paes and others [96] note that the Earth’s curvature and meteorological influences on data transmission leads to instances where vessels far from the coast are not present in the AIS databases. To get around some of these issues, some scholars used maritime patrol aircraft to survey blank areas [96], had analysts do manual inspection of images [99] or did on-the-ground validations of ships (a method probably only feasible in harbors) [101]. All of these techniques are difficult, time consuming and expensive to enact, thus making it likely that validation of actively identified marine crimes will follow similar trends as terrestrial drug production or smuggling.

4. Google Earth, Crime Detection and Questions of Accuracy

Aside from the more refined remote sensing techniques we mention above, law enforcement and government officials have leveraged the power of freely available remotely sensed products, like Google Earth, to detect crime [109,110]. Although, to date, there is a limited discussion of the use of Google Earth to detect crime in the academic literature, it is widely discussed in the popular press (e.g., [111,112,113,114,115]). These discussions note that Google Earth is being deployed by law enforcement officers, government employees, scientists and even private citizens to actively detect crimes in progress around the world (see Figure 5) [116]. For example, a Swiss police department “stumbled across a large marijuana plantation while using Google Earth” [111,113]. Aside from international agencies and law enforcement departments, researchers, like Anthony Silvaggio, an environmental sociologist at Humboldt State University, have sought to point out where large-scale, unregulated industrial marijuana grow sites are occurring in Humboldt county, California, including in national forests [117]. Amateur searchers have also started seeking out and identifying marijuana growing using Google Earth (e.g., [118,119]).
Google Earth’s use for crime investigation does not stop at drug production, however. In Greece, Italy, Argentina, India and the United States, Google Earth has been used by government officials to identify homes that have violated building codes, built swimming pools without permits and to compare declared home values with actual existing structures [120,121,122]. Though in North Carolina, U.S. government officials only used Google Earth to verify code violation complaints, in places like India, New York, Argentina and Greece, Google Earth was used in the active reconnaissance of committed crimes.
Marine researchers have also used analyses of Google Earth to evaluate the veracity of fish-catch reports made to the UN [123,124]. Spain’s Green Party has reported illegal bottom trawling of beaches for fish using Google Earth images, as well [125,126]. Google Earth has also been used to detect illegal dumping. For example, in Florida, a sheriff’s deputy used Google Earth to apprehend an individual who dumped a large boat; in Mississippi, a landowner identified a stolen and illegally dumped truck on his property using Google Earth; while in Bangalore, Google Earth was used to identify unauthorized and illegal waste dumping sites [112,127,128]. Illegal logging is also actively identified using Google Earth by such groups as local police departments in the Philippines, the Finnish Association for Nature Conservation and their associated NGOs in Russia, the Amazon Conservation Team and associated indigenous groups [129,130,131]. Amateur Google Earth users have reported potential body-dumping based on the imagery available, as well [132].
Some of the issues associated with Google Earth arise from the fact that its images are made available by a privately-owned corporation and are technology driven [133,134]. Thus, as Sheppard and Cizek [135] note, the visualizations of the Earth made available by this interface are more geared towards “efficiency, convenience…entertainment value, popular demand, and profit” than they are towards “truth, deeper understanding, improved civil discourse, safer and more informed decisions, and other ethical considerations”. As these and other authors (e.g., [136,137,138]) point out, realism in landscape visualization is not the same as accuracy or validity. Virtual globes, like Google Earth, may suffer from low data resolution, interfering with image clarity and accuracy, missing data or inaccurately displayed data [135,139]. Further, it is often impossible to know the exact date of the imagery available on Google Earth and whether all images in a scene are from the same date (in some places, this is obvious, given seasonal changes, but in others, it is harder to determine). Thus, a potential crime sighted on Google Earth may be months or even years old or may be exaggerated by differing image dates. Finally, these data may be manipulated by the producers of these virtual globes for various privacy reasons; some areas are intentionally blurred or objects are not displayed.
More significant than spatial and temporal accuracy is the consumption and use of these images by untrained or informal interpreters. These informal interpreters may not understand the temporal or spatial inaccuracies inherent in these data. Goodchild [140] points out that users of Google Earth may be misled to think it is more accurate than it is in reality. Despite the fact that Google Earth images’ absolute positional accuracy is sufficient for assessing remote sensing products of moderate resolution [141], errors and positional inaccuracies are still a problem. Trained remote sensing analysts understand these limitations and may be able to account for them, whereas casual users may not. Untrained remote sensing analysts may also misinterpret the images available to them. For example, in the case mentioned above, where amateur Google Earth users reported a dumped body, their interpretation of the image was flawed. In this case, the “dumped body” turned out to be a swimming dog. The dog’s watery trail on the cedar wood dock and the dog lying on that dock appeared to be a bloodied body rather than a picture of a sunny day at a lake (see Figure 6) [142].
Figure 5. Image of illegal marijuana garden in Oregon, USA, located by local police via a Google Earth image from InfoWorld.com [116].
Remotesensing 06 12723 g005
Un-validated identifications of “crimes” using Google Earth images by amateur analysts unfamiliar with the inaccuracies of these images or the nuances of image interpretation may be problematic for several reasons. First, they may cause law enforcement officers to seek places or things that are not where they are purported to be, are no longer present or never existed in the first place. This may result in a waste of funds, resources and personnel hours. Second, the misidentification of a site as a place where a crime is or has occurred opens that place and its residents up to potentially needless intrusion, intimidation, surveillance or violence. Despite the increasing ease with which satellite images and other spatially explicit data flow to us, ethical and scientific rigor should not be laid aside. Finally, as Purdy and Leung [19] note, Earth Observation data like those used in products like Google Earth may have their evidential weight in a court of law seriously reduced if un-validated, because the medium by which it was taken, the data management systems used or even the date the image was taken may be unknown.
Figure 6. Photo on website titled “Google Sightseeing” featured in an article entitled “Body being dumped into a Dutch canal, caught on Google Maps”. Image from Google Sightseeing Website (unaffiliated with Google) [132].
Remotesensing 06 12723 g006
Given the potential for amateur misinterpretation or overconfidence in Google Earth images, it is obvious that crimes detected in this manner must be validated to ensure appropriate, timely and safe responses by government of law enforcement officers. While there have been a few cases where crimes detected using Google Earth were validated, either by fly-overs or personal ground validation missions (e.g., [113,128]), in the majority of cases, there is no discussion of accuracy assessment or validation. This dangerous trend toward trained and untrained analysts taking Google Earth images as “truth” with no validation may have broad reaching potential impacts on law enforcement efforts and personal security.

5. New Possibilities for Validating the Geography of Crime

Despite the fact that cutting-edge technologies are being used to remotely detect crime, the accuracy assessments of those analyses lag well behind current remote sensing standards. Indeed, as we have shown above, some studies that attempt to remotely sense crime do not perform accuracy assessments at all, depend on the opinions of “experts” or “surrogate ground truth data”, all of which are deemed to be substandard by today’s remote sensing community [12]. Many of the studies noted above performed no accuracy assessment at all; they did not even use Google Earth or Digital Globes to validate their data. Particularly, in situations that may have life-and-death implications or serious environmental effects (e.g., aerial defoliant spraying), law enforcement officers must strive to be as accurate as possible in their targeting of crimes and criminals.
Although drones or unmanned aerial vehicles/systems (UAVs or UASs) may present excellent options for accuracy assessment, offering up quiet, real-time, high resolution imagery of remote or distant areas without threat to human life, they are not ideal solutions in every situation. The equipment, licensing, training and maintenance required to acquire and safely maintain a UAV may be well beyond the means of many local police departments or underfunded government agencies. In the United States, the Federal Aviation Administration (FAA) has seriously restricted the use of unmanned aircraft in national airspace (see [143]). Further, there are serious questions about the constitutionality of using UAVs for law enforcement. Critics of UAV use by law enforcement argue that these vehicles impede an individual’s reasonable expectation of privacy as protected by the fourth amendment (e.g., [144]) Despite these concerns, law enforcement is increasingly using UAVs to detect crimes and facilitate law enforcement (see [145]). In the following section, we propose some alternate or additional means of validating remotely sensed crime. We hope that this initial thought experiment may help spark a conversation about the methods and ethics of remote sensing in law enforcement.
We define “first order” accuracy assessments as those described in the accepted remote sensing protocol (e.g., [12]), which include ground-based validation or the use of imagery of higher resolutions than the imagery to be validated. Since these first order assessments can be limited by security, funding and terrain issues and drone use presents funding and legal issues, we propose a “second order” level of accuracy assessment. This second order accuracy assessment analyzes the larger geographical and social context in which remotely sensed crimes are detected by remote sensors. Such assessments could utilize crowd sourcing, big data mining, landscape-scale ecological data and anonymous surveys to determine whether and how crimes are occurring and where remote sensing analysts think they are. Second order accuracy assessments may allow remote sensors and law enforcement officers to confirm that crimes are taking place where analysts say they are without facing rugged terrain, insecure conditions or using costly overflight methods. Further, second order validation may enable analysts to gain better contextual understandings of those crimes, allowing for more ethical and proportionate responses by law enforcement. While these second order validation techniques may not be as reliable as first order techniques, they are better than no validation at all. Alternatively, these second order techniques could be incorporated into interdisciplinary crime detection techniques that may increase detection accuracy.
Urban areas are well suited to second order accuracy assessments because of the amount of available social data produced and available at any given moment. For example, Oakland’s Domain Awareness Center (DAC) plans to link public and private cameras and sensors within the city limits into a single hub for law enforcement use (see [146]). While highly controversial, these centers present numerous opportunities to validate remotely sensed crimes with closed-circuit television (CCTV), as well as readily available on-the-ground policing. Rural or more remote areas present more of a challenge, however. These places typically lack surveillance cameras and mounted sensors. It is also in these places that large-scale drug production, human and drug smuggling (and the remote sensing of these crimes) frequently occur. Thus, here, we use illicit cannabis production as a case study to think through three potential second order accuracy assessment techniques in non-urban zones. Though we acknowledge that each of these methods would require further development and thought and that methods may exist beyond those we propose here, it is our hope that this will be the first effort in a larger conversation as to second order validation techniques in the remote sensing of crime.
Social media: Location-based social network (LBSN) analysis (such as the geolocated analysis of twitter feeds) may be helpful in validating crimes remotely sensed in other ways through geolocated self-reporting or observations by others. LBSN has been shown to provide reliable spatio-temporal information about incidents occurring in a broad landscape [147]. For example, researchers from the Institute of Environment and Sustainability in Italy used a Twitter application programming interface to retrieve tweets and related metadata for a specific topic, the 2009 Marseille forest fire. These tweets were then organized into meaningful summary statistics (e.g., user locations, geolocated place names mentioned) using data mining and web crawling scripts. These researchers found that the LBSN data collected were temporally synchronized with actual events and provided some geographically accurate reporting. They note that Twitter “could offer promising seeds (starting points) for crawlers to collect event-related data where time and location matter”. Some products already exist to facilitate such second order validation of crimes. Products like SensePlace2 [148], Twitter-based event detection and analysis system (TEDAS) [149], DataSift, Gnip, SABESS [150], and others, enable those interested in crime or emergency detection to gather and aggregate publicly-available, geo-located, time-stamped information in real time about where and when an incident may have occurred, who was involved and how serious it was.
Because these data are publicly available, issues that other forms of remote sensing (e.g., drones) bring up in terms of the invasion of privacy are avoided. Further, because reports are on the ground and produced by humans, they may offer information on the context of crimes and their perpetrators and an interpretation of the events that took place rather than leaving this work up to far-removed remote sensing analysts. While connectivity in rural areas is more limited than in urban spaces, the Pew Research Group has found that as of January 2014, 88% of rural Americans have a cellphone and 43% of rural Americans have smartphones, making such data gathering feasible in these areas [151].
Landscape-scale ecological data: Remote sensing of large-scale cannabis production can be validated using landscape-scale ecological data, as well. Down-stream water quality is one way remote sensing of these grow sites can be validated, for example. Large-scale outdoor cannabis production can threaten water quality through water diversion, erosion and sediment deposition due to grading, terracing, road construction, deforestation and clearing; as well as the inputs of harmful chemicals or other pollutants, such as rodenticides, fungicides, herbicides, fertilizers, trash, human waste, gasoline, oil and insecticides, into local water sources [85]. Using stream water quality analysis that picks up the chemical signatures of such pollutants may be one way to affirm that remote sensing analysts were correct in their characterization of given drug production sites. Though no studies using this approach to detect upstream drug growth exist to date, similar methods have been used in the early detection of sudden oak death. Stream monitoring efforts are able to detect Phytophthora ramorum (the pathogen associated with sudden oak death) even before signs of infection are even visible from over-flights [152].
Surveys of local populations: The U.S. Bureau of Justice Statistics has conducted a National Crime Victimization Survey (NCVS) since 1973. This survey asks a representative sample of the national population about the frequency, characteristics and consequences of crimes they have experienced. This survey allows the Bureau to estimate the likelihood of victimization for certain subsets of the population in given areas. Because only 90,000 households spread across the United States are surveyed each year, these statistics are too dispersed be used for targeted accuracy assessments of remotely sensed crimes. The techniques used by the Bureau of Justice Statistics may be helpful for this purpose, however. This survey uses in-person or phone interviews that are strictly confidential about the nature of victimizations, where they occurred, the victim’s thoughts as to why these crimes happened and where they happened. Using structured phone interviews in the regions surrounding the remotely sensed sites of crime might be another manner in which analysts could assess the accuracy of their analyses. Conducting such interviews would, of course, require serious attention to maintaining the security and confidentiality of respondents, as well as the security of interviewers themselves.
As we pointed out in the Introduction, different crimes occur over different spatial and temporal scales. The different temporal and spatial scales of crime are going to impact the ways in which they can be validated. For example, crimes taking place over larger geographical areas and longer periods of time will be easier to validate. The second order validation methods we propose here together would be most useful in validating crimes occurring over longer periods of time and larger geographical areas. LBSN can, and has been, used in detecting crimes that happen rapidly and over smaller geographical areas, however. Because this is one of the first efforts in a hopefully fruitful conversation of the topic, we hope that future explorations will explore techniques that are scale specific.

6. Concluding Remarks

Maps have always been powerful tools, affecting people’s lives and livelihoods in myriad ways since their inception [153,154,155]. Crime mapping using remote sensing technologies is becoming increasingly quotidian with increasing ease of image access and analysis. Indeed, Purdy and Leung [19] note that despite the limitations of remote sensing technology, “it seems clear that it is going to progressively catch the attention of those in the legal sector seeking to integrate modern technologies into new monitoring approaches—particularly if such approaches can be shown to save money, offer a form of evidence collection not previously available or improve detection and compliance results”.
While such technologies are increasingly important to diminishing the dark figure of crime, shedding light on crimes and criminals that otherwise would not be detected, we argue that care must be taken with this forward step. Due to the potentially extreme and/or serious social and ecological implications of the remote sensing of crime, defining tolerable levels of error, as well as standards for accuracy assessments that incorporate contextual understandings of illegal acts is critical. We posit that by using second order modes of accuracy assessments, remote sensing analysts will both be able to validate their classifications of crimes, but will also be able to gain better and more complete information on how and in what places illicit activities are taking place, by whom and to what effect. Further, these data may help resolve some of the serious ethical and moral issues that arise from the remote sensing of crime. These accuracy assessments may also make remotely sensed crime data more serviceable in courtroom settings and law enforcement planning strategies. While we have painted a few ideas for second order accuracy assessments with a broad brush here, we hope that this paper leads to further, more detailed discussions of innovative accuracy assessments.
In this work, we call for a more broad use of geospatial technology to better validate remotely sensed estimates of crime. Though the more accurate and comprehensive detection of crime is important for the protection of society, there are trade-offs between security and privacy that must be considered. We are aware of the fact that our argument here essentially is a call for more surveillance technology in everyday life, and in some cases, the second order validation methods we mention here are already being used to scrutinize the population at large, with worrying results (see for examples: [156]). Here, we make the call to further open discussions about the use of surveillance/securitization technologies and the importance of transparent methods of their use to society as a whole. As such, this paper is a part of a larger ongoing conversation about the role increased geospatial technology plays in an increasingly surveilled society. We argue that it is only once we fully understand the implications of the powerful technologies we are now able to harness and only once we have found limits to these technologies that are ethically, morally and constitutionally acceptable that we can effectively utilize them in the context of the remote sensing of crime. Though society as a whole may struggle to clearly prioritize security and privacy, a transparent debate over policing methodologies must continue as the powers of spatial technologies grow stronger.
In summary, of the sixty one papers we reviewed, fifty-eight drug related and three dealing with extra-legal migration, twenty one failed to discuss accuracy assessments at all (thirty four percent). While the remaining papers did mention accuracy assessments, twenty studies’ accuracy assessments were limited or completely curtailed by security issues (thirty two percent). This means that only thirty four percent of all of the studies seeking to actively detect crime using remote sensing performed and described their accuracy assessment methods. We find these limitations and lack of attention to accuracy assessments highly troubling.
We believe that if remote sensing continues to be used in the active detection of crime, validation of remotely sensed crime data must be rigorously validated before it is acted upon. While we recognize that first order validation is not always feasible, we have proposed second order validation techniques that may facilitate validation in difficult situations. We do, however, recognize that important trade-offs must be considered between privacy and security. We challenge other scholars to add to the conversation we have begun here to make the use of remote sensing to diminish the dark figure of crime more effective and ethically sound.

Acknowledgments

Thanks to the Kelly Research and Outreach Lab, Tim Bean, Van Butsic and Elizabeth Havice for giving us feedback on early drafts. Alice Kelly’s contribution was funded by NSF, Award #1314091.

Author Contributions

Alice Kelly and Maggi Kelly conceived of and designed the paper together. Alice Kelly and Maggi Kelly reviewed the literature and framed the discussion together. Alice Kelly led the drafting of the article. Maggi Kelly helped revise the article.

Conflicts of Interest

The authors declare no conflict of interest.

References

  1. Bulwer, W.H.L.E. The Lords, the Government, and the Country. A Letter to a Constituent on the Present State of Affairs; Saunders and Otley: London, UK, 1836. [Google Scholar]
  2. Biderman, A.D.; Reiss, A.J. On exploring the “dark figure” of crime. Ann. Am. Acad. Polit. Soc. Sci. 1967, 374, 1–15. [Google Scholar]
  3. Messner, S.F. The “dark figure” and composite indexes of crime: Some empirical explorations of alternative data sources. J. Crim. Justice 1984, 12, 435–444. [Google Scholar] [CrossRef]
  4. Fussey, P. New labour and new surveillance: Theoretical and political ramifications of CCTV implementation in the UK. Surveill. Soc. 2002, 2, 251–269. [Google Scholar]
  5. Slobogin, C. Privacy at risk: The New Government Surveillance and the Fourth Amendment; University of Chicago Press: Chicago, IL, USA, 2008; p. 274. [Google Scholar]
  6. Campbell, J. Introductory Cartography, 2nd ed.; W.C. Brown Publishers: Dubuque, IA, USA, 1991; p. 315. [Google Scholar]
  7. Jensen, J.R. Remote Sensing of the Environment: An Earth Resource Perspective, 2nd ed.; Prentice Hall: Upper Saddle River, NJ, 2000; p. 593. [Google Scholar]
  8. Pringle, J.; Ruffell, A.; Jervis, J.; Donnelly, L.; McKinley, J.; Hansen, J.; Morgan, R.; Pirrie, D.; Harrison, M. The use of geoscience methods for terrestrial forensic searches. Earth-Scie. Rev. 2012, 114, 108–123. [Google Scholar]
  9. Foucault, M. Power/knowledge: Selected interviews and other writings, 1972-1977; Random House LLC: New York, NY, USA, 1980; p. 288. [Google Scholar]
  10. Kramer, H.J.; Cracknell, A.P. An overview of small satellites in remote sensing. Int. J. Remote Sens. 2008, 29, 4285–4337. [Google Scholar] [CrossRef]
  11. Congalton, R.G. Accuracy assessment and validation of remotely sensed and other spatial information. Int. J. Wildland Fire 2001, 10, 321–328. [Google Scholar] [CrossRef]
  12. Foody, G.M. Status of land cover classification accuracy assessment. Remote Sens. Environ. 2002, 80, 185–201. [Google Scholar] [CrossRef]
  13. Harris, R. Science, policy and evidence in EO. In Evidence from Earth Observation Satellites: Emerging Legal Issues; Purdy, R., Leung, D., Eds.; Martinus Nijhoff Publishers: Leiden, The Netherlands, 2013; Vol. 7, pp. 43–64. [Google Scholar]
  14. Lein, J.K. Forensic remote sensing. In Environmental Sensing; Springer: Berlin, Germany, 2012; pp. 279–301. [Google Scholar]
  15. Kalacska, M.E.; Bell, L.S.; Sanchez-Azofeifa, G.A.; Caelli, T. The application of remote sensing for detecting mass graves: An experimental animal case study from Costa Rica. J. Forensic Sci. 2009, 54, 159–166. [Google Scholar] [CrossRef]
  16. Ruffell, A.; McKinley, J. Forensic geoscience: Applications of geology, geomorphology and geophysics to criminal investigations. Earth-Sci. Rev. 2005, 69, 235–247. [Google Scholar] [CrossRef] [Green Version]
  17. Brilis, G.M.; Gerlach, C.L.; Waasbergen, R.J.V. Remote sensing tools assist in environmental forensics. Part I: Traditional methods. Environ. Forensics 2000, 1, 63–67. [Google Scholar]
  18. Brilis, G.M.; van Waasbergen, R.; Stokely, P.; Gerlach, C. Remote sensing tools assist in environmental forensics: Part II—Digital tools. Environ. Forensics 2001, 2, 223–229. [Google Scholar]
  19. Purdy, R.; Leung, D. Evidence from Earth Observation Satellites: Emerging Legal Issues; Martinus Nijhoff Publishers: Boston, MA, USA, 2013; p. 498. [Google Scholar]
  20. Leblanc, G.; Kalacska, M.; Soffer, R. Detection of single graves by airborne hyperspectral imaging. Forensic Sci. Int. 2014, 245, 17–23. [Google Scholar] [CrossRef]
  21. Hardisty, J. Hydrodynamic modelling as investigative and evidential tools in murder enquiries: Examples from the Humber and Thames. In Forensic Geoscience: Principles, Techniques and Applications; Geological Society of London: London, UK, 2003; pp. 3–4. [Google Scholar]
  22. Unlawful Entry, Failure to Depart, Fleeing Immigration Checkpoints, Marriage Fraud, Commercial Enterprise Fraud § 1325. Available online: http://www.justice.gov/usao/eousa/foia_reading_room/usam/title9/crm01911.htm (accessed on 2 February 2014).
  23. Prohibited Acts A § 841. Available online: http://www.law.cornell.edu/uscode/text/21/841 (accessed on 2 February 2014).
  24. US Criminal Code: Definitions 8, Chapter 12 § 1101. Available online: http://www.law.cornell.edu/uscode/text/8/1101 (accessed on 2 February 2014).
  25. UNODC World Drug Report 2013. Available online: http://www.unodc.org/unodc/secured/wdr/wdr2013/World_Drug_Report_2013.pdf (accessed on 12 January 2014).
  26. 1913 Aiding Entry of Certain Criminal or Subversive Aliens § 1327. Available online: http://www.justice.gov/usao/eousa/foia_reading_room/usam/title9/crm01913.htm (accessed on 2 February 2014).
  27. Daughtry, C.S.T.; Walthall, C.L. Spectral discrimination of Cannabis sativa L. Leaves and canopies. Remote Sens. Environ. 1998, 64, 192–201. [Google Scholar]
  28. Kalacska, M.; Bouchard, M. Using police seizure data and hyperspectral imagery to estimate the size of an outdoor cannabis industry. Police Pract. Res. 2011, 12, 424–434. [Google Scholar] [CrossRef]
  29. Lisita, A.; Sano, E.E.; Durieux, L. Identifying potential areas of cannabis sativa plantations using object-based image analysis of spot-5 satellite data. Int. J. Remote Sens. 2013, 34, 5409–5428. [Google Scholar] [CrossRef]
  30. Owens, R.E.; Espinoza, F. Identifying Roads and Trains Under Canopy Using Lidar; Defense Technical Information Center Document: Monterey, CA, USA, 2007. [Google Scholar]
  31. Muha, S.L. Evaluation of LiDAR for Automating Recognition of Roads and Trails Beneath Forest Canopy; Defense Technology Institution Document: Monterey, CA, USA, 2011. [Google Scholar]
  32. UNODC Afghanistan Opium Survey. Available online: http://www.unodc.org/pdf/publications/afg_opium_survey_2002.pdf (accessed on 10 December 2014).
  33. UNODC Laos Opium Survey 2003. Available online: http://www.unodc.org/pdf/publications/lao_opium_survey_2003.pdf (accessed on 9 December 2013).
  34. Chuinsiri, S.; Blasco, F.; Bellan, M.; Kergoat, L. A poppy survey using high resolution remote sensing data. Int. J. Remote Sens. 1997, 18, 393–407. [Google Scholar] [CrossRef]
  35. Taylor, J.; Waine, T.; Juniper, G.; Simms, D.; Brewer, T. Survey and monitoring of opium poppy and wheat in Afghanistan: 2003–2009. Remote Sens. Lett. 2010, 1, 179–185. [Google Scholar] [CrossRef] [Green Version]
  36. Tian, Y.; Wu, B.; Zhang, L.; Li, Q.; Jia, K.; Wen, M. Opium poppy monitoring with remote sensing in north Myanmar. Int. J. Drug Policy 2011, 22, 278–284. [Google Scholar] [CrossRef] [PubMed]
  37. Wang, J. Technical report: Unsupervised detection of opium poppy fields in Afghanistan from EO-1 hyperion data. Geod. Geomat. Eng. 2013, 286, 1–117. [Google Scholar]
  38. UNODC Myanmar Opium Survey 2003. Available online: http://www.unodc.org/pdf/publications/myanmar_opium_survey_2003.pdf (accessed on 11 December 2013).
  39. UNODC Afghanistan Opium Survey 2003. Available online: http://www.unodc.org/documents/crop-monitoring/Afghanistan/Afghanistan_survey_2003_full_report.pdf (accessed on 14 January 2014).
  40. UNODC Laos Opium Survey 2004. Available online: http://www.unodc.org/pdf/laopdr/lao_opium_survey_2004.pdf (accessed on 11 January 2014).
  41. UNODC Afghanistan Opium Survey 2004. Available online: http://www.unodc.org/documents/crop-monitoring/Afghanistan/AFGopiumsurvey04_web.pdfmonitoring/Afghanistan/Afghanistan_survey_2003_full_report.pdf (accessed on 12 January 2014).
  42. UNODC Laos: Opium Survey 2005. Available online: http://www.unodc.org/pdf/laopdr/lao_opium_survey_2005.pdf (accessed on 11 January 2014).
  43. UNODC Afghanistan Opium Survey 2005. Available online: http://www.unodc.org/documents/crop-monitoring/Afghanistan/afg_survey_2005.pdf (accessed on 11 January 2014).
  44. UNODC Myanmar Opium Survey 2005. Available online: http://www.unodc.org/pdf/Myanmar_opium-survey-2005.pdf (accessed on 11 January 2014).
  45. UNODC Afghanistan Opium Survey 2006. Available online: http://www.unodc.org/pdf/research/AFG05_full_web_2006.pdf (accessed on 12 January 2014).
  46. UNODC Opium Poppy Cultivation in the Golden Triangle: Lao PDR, Myanmar, Thailand. Available online: http://www.unodc.org/pdf/research/Golden_triangle_2006.pdf (accessed on 13 January 2014).
  47. UNODC Opium Poppy Cultivation in South East Asia: Lao PDR, Myanmar, Thailand 2007. Available online: http://www.unodc.org/documents/crop-monitoring/2007-opium-SEAsia.pdf (accessed on 11 January 2014).
  48. UNODC Afghanistan Opium Survey 2007. Available online: http://www.unodc.org/documents/crop-monitoring/Afghanistan-Opium-Survey-2007.pdf (accessed on 11 January 2014).
  49. UNODC Afghanistan Opium Survey 2008. Available online: http://www.unodc.org/documents/crop-monitoring/Afghanistan_Opium_Survey_2008.pdf (accessed on 12 January 2014).
  50. UNODC Opium Poppy Cultivation in the Golden Triangle: Lao PDR, Myanmar, Thailand. Available online: http://www.unodc.org/documents/crop-monitoring/East_Asia_Opium_report_2008.pdf (accessed on 12 January 2014).
  51. UNODC Opium Poppy Cultivation in South-East Asia: Lao PDR, Myanmar. Available online: http://www.unodc.org/documents/crop-monitoring/SEA_Opium_survey_2009.pdf (accessed on 11 January 2014).
  52. UNODC Afghanistan Opium Survey 2009. Available online: http://www.unodc.org/documents/crop-monitoring/Afghanistan/Afgh-opiumsurvey2009_web.pdf (accessed on 11 January 2014).
  53. UNODC Opium Poppy Cultivation in South-East Asia: Lao PDR, Myanmar. Available online: http://www.unodc.org/documents/crop-monitoring/sea/SEA_report_2010_withcover_small.pdf (accessed on 12 January 2014).
  54. UNODC Opium Poppy Cultivation in South-East Asia: Lao PDR, Myanmar. Available online: http://www.unodc.org/documents/crop-monitoring/sea/SouthEastAsia_2011_web.pdf (accessed on 12 January 2014).
  55. UNODC Afghanistan Opium Survey 2011. Available online: http://www.unodc.org/documents/crop-monitoring/Afghanistan/Afghanistan_opium_survey_2011_web.pdf (accessed on 12 January 2014).
  56. UNODC Opium Poppy Cultivation in South-East Asia: Lao PDR, Myanmar. Available online: http://www.unodc.org/documents/crop-monitoring/sea/SouthEastAsia_Report_2012_low.pdf (accessed on 12 January 2014).
  57. UNODC Afghanistan Opium Survey 2012. Available online: http://www.unodc.org/documents/crop-monitoring/Afghanistan/Afghanistan_OS_2012_FINAL_web.pdf (accessed on 13 January 2014).
  58. UNODC Afghanistan Opium Survey 2013. Available online: http://www.unodc.org/documents/crop-monitoring/Afghanistan/Afghan_Opium_survey_2013_web_small.pdf (accessed on 12 January 2014).
  59. Dávalos, L.M.; Bejarano, A.C.; Hall, M.A.; Correa, H.L.; Corthals, A.; Espejo, O.J. Forests and drugs: Coca-driven deforestation in tropical biodiversity hotspots. Environ. Sci. Technol. 2011, 45, 1219–1227. [Google Scholar] [CrossRef] [PubMed]
  60. Pesaresi, M. Textural analysis of coca plantations using remotely sensed data with resolution of 1 metre. Int. J. Remote Sens. 2008, 29, 6985–7002. [Google Scholar]
  61. UNODC Peru: Coca Survey for 2002. Available online: http://www.unodc.org/pdf/publications/peru_coca-survey_2002.pdf (accessed on 10 January 2014).
  62. UNODC Colombia: Coca Survey for December 2002 Semi-Annual Estimate for July 2003. Available online: http://www.unodc.org/pdf/publications/colombia_report_2003-09-25.pdf (accessed on 11 January 2014).
  63. UNODC Bolivia: Coca Cultivation Survey. Available online: http://www.unodc.org/pdf/bolivia/bolivia_coca_survey_2003.pdf (accessed on 12 January 2014).
  64. UNODC Coca Cultivation in the Andean Region: A survey of Bolivia, Colombia, and Peru. Available online: http://www.unodc.org/documents/crop-monitoring/Andean-coca-June05.pdf (accessed on 11 January 2014).
  65. UNODC Peru Coca Survey for 2005. Available online: http://www.unodc.org/pdf/andean/Peru_coca_survey_2005.pdf (accessed on 12 January 2014).
  66. UNODC Boliva Coca Cultivation Survey for 2005. Available online: http://www.unodc.org/pdf/andean/Bolivia_coca_survey_2005_eng.pdf (accessed on 10 January 2014).
  67. UNODC Colombia: Coca Survey 2005. Available online: http://www.unodc.org/pdf/andean/Colombia_coca_survey_2005_eng.pdf (accessed on 10 January 2014).
  68. UNODC Bolivia Coca Cultivation Survey for 2006. Available online: http://www.unodc.org/pdf/research/icmp/bolivia_2006_en_web.pdf (accessed on 10 January 2014).
  69. UNODC Colombia Coca Cultivation Survey 2006. Available online: http://www.unodc.org/pdf/research/icmp/colombia_2006_en_web.pdf (accessed on 11 January 2014).
  70. UNODC Plurinational State of Boliva Coca Cultivation Survey for 2008. Available online: http://www.unodc.org/documents/crop-monitoring/Bolivia/Bolivia_Coca_Survey_for2008_En.pdf.pdf (accessed on 10 January 2014).
  71. UNODC Colombia Coca Culitvation Survey 2008. Available online: http://www.unodc.org/documents/crop-monitoring/Colombia_coca_survey_2008.pdf (accessed on 10 January 2014).
  72. UNODC Colombia Coca Cultivation Survey 2011. Available online: http://www.unodc.org/documents/crop-monitoring/Colombia/Colombia_Coca_cultivation_survey_2011.pdf (accessed on 14 January 2014).
  73. UNODC Colombia Coca Cultivation Survey 2012. Available online: http://www.unodc.org/documents/crop-monitoring/Colombia/Colombia_Coca_Cultivation_Survey_2012_web.pdf (accessed on 14 January 2014).
  74. UNODC Afghanistan Cannabis Survey 2009. Available online: http://www.unodc.org/documents/crop-monitoring/Afghanistan/Afghanistan_Cannabis_Survey_2009.pdf (accessed on 12 January 2014).
  75. UNODC Afghanistan Cannabis Survey 2010. Available online: http://www.unodc.org/documents/crop-monitoring/Afghanistan/Afghanistan_Cannabis_Survey_Report_2010_smallwcover.pdf (accessed on 12 January 2014).
  76. UNODC Afghanistan Survey of Commercial Cannabis and Production 2011. United Nations Office of Drugs and Crime: Vienna, Austria, 2012.
  77. UNODC Afghanistan Survey of Commercial Cannabis and Production 2012. Available online: http://www.unodc.org/documents/crop-monitoring/Afghanistan/_Afghanistan_Cannabis_Survey_Report_2012.pdf (accessed on 10 January 2014).
  78. Sadler, S.A. Remote sensing of Narcotics: With a special reference to techniques for detection and monitoring of poppy production in Afghanistan. Available online: http://pdf.usaid.gov/pdf_docs/PNABT431.pdf (accessed on 15 December 2014).
  79. UNODC World Drug Report 2010. Available online: http://www.unodc.org/documents/wdr/WDR_2010/World_Drug_Report_2010_lo-res.pdf (accessed on 12 January 2014).
  80. Doty, R.L. States of exception on the Mexico–US border: Security,“decisions”, and civilian border patrols. Int. Polit. Sociol. 2007, 1, 113–137. [Google Scholar] [CrossRef]
  81. Passel, J.S.; Cohn, D.; Gonzalez-Barrera, A. Net Migration from Mexico Falls to Zero—And Perhaps Less. Available online: http://www.pew hispanic.org/2012/04/23/net-migration-from-mexico-falls-to-zero-and-perhaps-less/ (accessed on 19 August 2014).
  82. Cohn, J.P. The environmental impacts of a border fence. BioScience 2007, 57, 96–96. [Google Scholar]
  83. Sayre, N.F.; Knight, R.L. Potential effects of United States-Mexico border hardening on ecological and human communities in the malpai borderlands. Conserv. Biol. 2010, 24, 345–348. [Google Scholar] [CrossRef]
  84. Governor’s Archaeology Advisory Commission. Recommendations: Management of Cultural Resources Along the International Border. Available online: http://azstateparks.com/committees/downloads/GAAC_Border_Policy_2012.pdf (accessed on 10 August 2014).
  85. California Water Boards Fact Sheet: Marijuana Cultivation on the North Coast Threatens Water Quality and Wildlife. (August 5). Available online: http://www.google.com/url?sa=t&rct=j&q=&esrc=s&source=web&cd=1&ved=0CC8QFjAA&url=http%3A%2F%2Fwww.waterboards.ca.gov%2Fnorthcoast%2Fpublications_and_forms%2Favailable_documents%2Fpdf%2F2013%2F130611_MarijuanFactSheet.pdf&ei=M1qmUvHgAsjboAST3IDQDA&usg=AFQjCNFmPdMRMtw34cLIrKh_I9FVt_acng&bvm=bv.57799294,d.cGU (accessed on 9 December 2014).
  86. Kaiser, J.V.; Stow, D.A.; Cao, L. Evaluation of remote sensing techniques for mapping transborder trails. B Engineer. Remote Sens. 2004, 70, 1441–1447. [Google Scholar]
  87. Cao, L.; Stow, D.; Kaiser, J.; Coulter, L. Monitoring cross-border trails using airborne digital multispectral imagery and interactive image analysis techniques. Geocarto Int. 2007, 22, 107–125. [Google Scholar] [CrossRef]
  88. Coulter, L.; Stow, D.; Tsai, Y.H.; Chavis, C.; McCreight, R.; Lippitt, C.; Fraley, G. A new paradigm for persistent wide area surveillance. In Proceedings of the IEEE Conference on Homeland Security Technologies, Waltham, MA, USA, 13–15 November 2012; pp. 51–60.
  89. Dillon, L.; Lovett, I. Tunnel for Smuggling Found Under US-Mexico Border; Tons of Drugs Seized. Available online: http://www.nytimes.com/2013/11/01/us/tunnel-for-smuggling-found-under-border-tons-of-drugs-seized.html?_r=0 (accessed on 11 August 2014).
  90. Zhao, Z.; Ji, K.; Xing, X.; Zou, H.; Zhou, S. Ship surveillance by integration of space-borne SAR and AIS—Review of current research. J. Navigat. 2014, 67, 177–189. [Google Scholar]
  91. Margarit, G.; Barba Milanés, J.A.; Tabasco, A. Operational ship monitoring system based on synthetic aperture radar processing. Remote Sens. 2009, 1, 375–392. [Google Scholar] [CrossRef]
  92. Gabban, A.; Greidanus, H.; Smith, A.; Anitori, L.; Thoorens, F.; Mallorqui, J. Ship surveillance with Terrasar-X scansar. In Proceedings of the 3rd TerraSAR-X Science Team Meeting, Wessling, Germany, 25–26 November 2008.
  93. Grasso, R.; Mirra, S.; Baldacci, A.; Horstmann, J.; Coffin, M.; Jarvis, M. Performance assessment of a mathematical morphology ship detection algorithm for sar images through comparison with ais data. In Proceedings of 2009 IEEE Ninth International Conference on Intelligent Systems Design and Applications, Pisa, Italy, 30 November–2 December 2009; pp. 602–607.
  94. Saur, G.; Estable, S.; Zielinski, K.; Knabe, S.; Teutsch, M.; Gabel, M. Detection and classification of man-made offshore objects in terrasar-x and rapideye imagery: Selected results of the demarine-deko project. In Proceedings of 2011 IEEE OCEANS, Santander, Spain, 6–9 June 2011; pp. 1–10.
  95. Gurgel, K.-W.; Schlick, T.; Horstmann, J.; Maresca, S. Evaluation of an HF-radar ship detection and tracking algorithm by comparison to AIS and SAR data. In Proceedings of 2010 International Waterside Security Conference (WSS), 3–5 November 2010; pp. 1–6.
  96. Paes, R.L.; Lorenzzetti, J.A.; Gherardi, D.F. Ship detection using terrasar-x images in the campos basin (Brazil). IEEE Geosci. Remote Sens. Lett. 2010, 7, 545–548. [Google Scholar] [CrossRef]
  97. Posada, M.; Greidanus, H.; Alvarez, M.; Vespe, M.; Cokacar, T.; Falchetti, S. Maritime awareness for counter-piracy in the gulf of Aden. In Proceedings of the 2011 IEEE International Geoscience and Remote Sensing Symposium (IGARSS), Vancouver, BC, Canada, 24–29 July 2011; pp. 249–252.
  98. Baumgartner, S.; Krieger, G. Traffic monitoring via satellite. Available online: http://www.eepublishers.co.za/images/upload/posit11/posit-jun11-p57-62.pdf (accessed on 20 August 2014).
  99. Lehner, S.; Brusch, S.; Fritz, T. Ship surveillance by joint use of sar and ais. In Proceedings of the 2009 IEEE OCEANS 2009-EUROPE, Bremen, Germany, 1–14 May 2009; pp. 1–5.
  100. Brusch, S.; Lehner, S.; Fritz, T.; Soccorsi, M.; Soloviev, A.; van Schie, B. Ship surveillance with terrasar-x. IEEE Trans. Geosci. Remote Sens. 2011, 49, 1092–1103. [Google Scholar] [CrossRef]
  101. Marino, A.; Walker, N.; Woodhouse, I. Ship detection with Radarsat-2 quad-pol sar data using a notch filter based on perturbation analysis. In Proceedings of the 2010 IEEE International Geoscience and Remote Sensing Symposium (IGARSS), Honolulu, HI, USA, 25–30 July 2010; pp. 3704–3707.
  102. Brekke, C.; Solberg, A.H. Oil spill detection by satellite remote sensing. Remote Sens. Environ. 2005, 95, 1–13. [Google Scholar] [CrossRef]
  103. Horn, S.; Zegers, A. Near Real-Time Multi-Sensor Fusion for Cued Reconnaissance: Operational Analysis of Operation Driftnet 2009; DTIC Document; Center for Operational Research and Analysis: Ottawa, ON, USA, 2010. [Google Scholar]
  104. Andersson, M.; Johansson, R. Multiple sensor fusion for effective abnormal behaviour detection in counter-piracy operations. In Proceeedings of the 2010 IEEE International Waterside Security Conference (WSS), Carrara, Italy, 3–5 November 2010; pp. 1–7.
  105. Congalton, R.C.; Green, K. Assessing the Accuracy of Remotely Sensed Data: Principles and Practices; CRC Press: Boca Raton, FL, USA, 1999; p. 137. [Google Scholar]
  106. Jensen, J.R. Introductory Digital Image Processing: A Remote Sensing Perspective, 2nd ed.; Prentice Hall: Upper Saddle River, NJ, USA, 1996; p. 318. [Google Scholar]
  107. Congalton, R. Correct formulation of the kappa coefficient of agreement-comment. ASPRS 1987, 53, 422–422. [Google Scholar]
  108. Congalton, R.G. A review of assessing the accuracy of classifications of remotely sensed data. Remote Sens. Environ. 1991, 37, 35–46. [Google Scholar] [CrossRef]
  109. Hoppin, J. Now on Google Earth: Marijuana Fields. Available online: http://www.santacruzsentinel.com/ci_23651607/now-google-earth-marijuana-fields (accessed on 22 April 2014).
  110. Robinson, W. Police Locate Marijuana Farm Using Google Earth. Available online: http://www.dailymail.co.uk/news/article-2471787/Police-locate-marijuana-farm-using-Google-Earth-satellite-images-shows-plants-neatly-lined-row.html (accessed on 22 April 2014).
  111. Terdiman, D. How Law Enforcement Uses Google Earth. Available online: http://news.cnet.com/How-law-enforcement-uses-Google-Earth/2100-1025_3-6208034.html (accessed on 22 April 2014).
  112. The Week Staff. 5 Crimes Solved using Google Earth. Available online: http://theweek.com/article/index/205915/5-crimes-solved-using-google-earth (accessed on 22 April 2014).
  113. Moran, L. Marijuana farmer busted after cops see neat rows of plants on Google Earth. Available online: http://www.nydailynews.com/news/national/pot-farmer-busted-cops-plants-google-earth-article-1.1493680 (accessed on 22 April 2014).
  114. Mellen, M. Discovering Illegal Marijuana Growing Activities with Google Earth. Available online: http://www.gearthblog.com/blog/archives/2012/09/discovering_illegal_marijuana_growi.html (accessed on 14 January 2014).
  115. Gibbs, S. Marijuana Grower Exposed by Google Earth. Available online: http://www.theguardian.com/technology/2013/oct/23/marijuana-grower-google-earth (accessed on 20 April 2014).
  116. Neagle, C. How Cops and Robbers are using Google Earth. Available online: http://www.infoworld.com/article/2606764/applications/129087-How-cops-and-robbers-are-using-Google-Earth.html (accessed on 25 April 2014).
  117. Harkinson, J. How Industrial Pot Growers Ravage the Land: A Google Earth Tour. Available online: http://www.motherjones.com/blue-marble/2013/02/google-earth-tour-marijuana-farms-environment-video (accessed 15 December 2014).
  118. Aravosis, J. Marijuana Farming Deforestation in Northern California, A Google Earth View (video). Available online: http://americablog.com/2013/02/marijuana-farming-deforestation-northern-california-video.html (accessed on 20 April 2014).
  119. Kemp, K. Google Earth and Pot Farms—Scientists and Scholars Study Humbolt from Aerial Photos and Attempt to Change Marijuana Practices. Available online: http://lostcoastoutpost.com/2013/jan/4/growing-dilemna/ (accessed on 15 December 2014).
  120. Besfamille, M.; Olmos, P. Inspectors or Google Earth? Optimal Fiscal Policies under Uncertain Detection of Evaders; Universidad Torcuato Di Tella: Buenos Aires, Argentina, 2010. [Google Scholar]
  121. Knoedler, E. Satellites and municipalities: One town’s use of Google Earth for residential surveillance. Touro L. Rev. 2012, 28, 421–449. [Google Scholar]
  122. Staff, Press Trust of India. Jammu and Kashmir government to use Google Earth to check illegal constructions. Available online: http://www.ndtv.com/article/cities/jammu-and-kashmir-government-to-use-google-earth-to-check-illegal-constructions-254877 (accessed on 15 December 2014).
  123. Trujillo, P.; Piroddi, C.; Jacquet, J. Fish farms at sea: The ground truth from Google Earth. PloS One 2012, 7, e30546. [Google Scholar] [CrossRef] [PubMed]
  124. Al-Abdulrazzak, D.; Pauly, D. Managing fisheries from space: Google Earth improves estimates of distant fish catches. ICES J. Mar. Sci. 2014, 71, 450–454. [Google Scholar]
  125. Green, S. Catching the Catchers: Google Earth Exposes Illegal Fishing on Canary Islands. Available online: http://ogleearth.com/2007/06/catching-the-catchers-google-earth-exposes-illegal-fishing-on-canary-islands/ (accessed on 20 April 2014).
  126. Pais, E. Imágenes de Google Earth ayudan a Los Verdes a denunciar la pesca ilegal en Canarias. Available online: http://tecnologia.elpais.com/tecnologia/2007/06/23/actualidad/1182589263_850215.html (accessed on 20 April 2014).
  127. Chanakya, H.N.S.; Ramachandra, T.V. Estimating unauthorized dumping of usw around cities a case study of bangalore. In Proceedings of the 2nd International conference on solid waste management and exhibition, Kolkata, Indian, 9–11 November 2011; pp. 8–38.
  128. Pearce, M. Mississippi man spots stolen SUV on Google Earth. Available online: http://articles.latimes.com/2013/sep/27/nation/la-na-nn-google-earth-20130927 (accessed on 10 December 2014).
  129. Butler, R. Satellites and Google Earth Prove Potent Conservation Tool. Available online: http://e360.yale.edu/feature/satellites_and_google_earth_prove_potent_conservation_tool/2134/ (accessed on 10 January 2014).
  130. Harrell, E. How Google Earth Can Save the Earth’s Forests. Available online: http://science.time.com/2011/02/10/how-google-earth-can-save-the-earths-forests/ (accessed on 10 January 2014).
  131. Amaroso, E. Laguna cops use Google Earth to locate illegal logging sites. Available online: http://www.philstar.com/nation/810710/laguna-cops-use-google-earth-locate-illegal-logging-sites (accessed on 10 January 2014).
  132. Turnbull, A. Body being dumped into a Dutch canal, caught on Google Maps. Available online: http://googlesightseeing.com/2013/04/body-being-dumped-into-a-dutch-canal-caught-on-google-maps/ (accessed on 12 January 2014).
  133. Zook, M.A.; Graham, M. Mapping Digiplace: Geocoded internet data and the representation of place. Environ. Plan. B: Plan. Des. 2007, 34, 466–482. [Google Scholar] [CrossRef]
  134. Dora, V.D. A World of “Slippy Maps”: Google Earth, Global Visions, and Topographies of Memory. Am. Studies J. 2012, 2, 1–20. [Google Scholar]
  135. Sheppard, S.R.; Cizek, P. The ethics of Google Earth: Crossing thresholds from spatial data to landscape visualisation. J. Environ. Manag. 2009, 90, 2102–2117. [Google Scholar] [CrossRef]
  136. Orland, B.; Budthimedhee, K.; Uusitalo, J. Considering virtual worlds as representations of landscape realities and as tools for landscape planning. Landsc. Urban Plan. 2001, 54, 139–148. [Google Scholar] [CrossRef]
  137. Luymes, D. The rhetoric of visual simulation in forest design: Some research directions. In Forests and Landscapes: Linking Ecology Sustainability and Aesthetics; Cabi Publishing: Wallingford, UK, 2001; pp. 191–204. [Google Scholar]
  138. Peng, Z.-R. Internet GIS for public participation. Environ. Plan. B 2001, 28, 889–906. [Google Scholar] [CrossRef]
  139. Appleton, K.; Lovett, A. GIS-based visualisation of rural landscapes: Defining “sufficient” realism for environmental decision-making. Landsc. Urban Plan. 2003, 65, 117–131. [Google Scholar] [CrossRef]
  140. Goodchild, M.F.; Guo, H.; Annoni, A.; Bian, L.; de Bie, K.; Campbell, F.; Craglia, M.; Ehlers, M.; van Genderen, J.; Jackson, D. Next-generation digital earth. Proc. Natl. Acad. Sci. 2012, 109, 11088–11094. [Google Scholar] [CrossRef] [PubMed]
  141. Potere, D. Horizontal positional accuracy of Google Earth’s high-resolution imagery archive. Sensors 2008, 8, 7973–7981. [Google Scholar] [CrossRef]
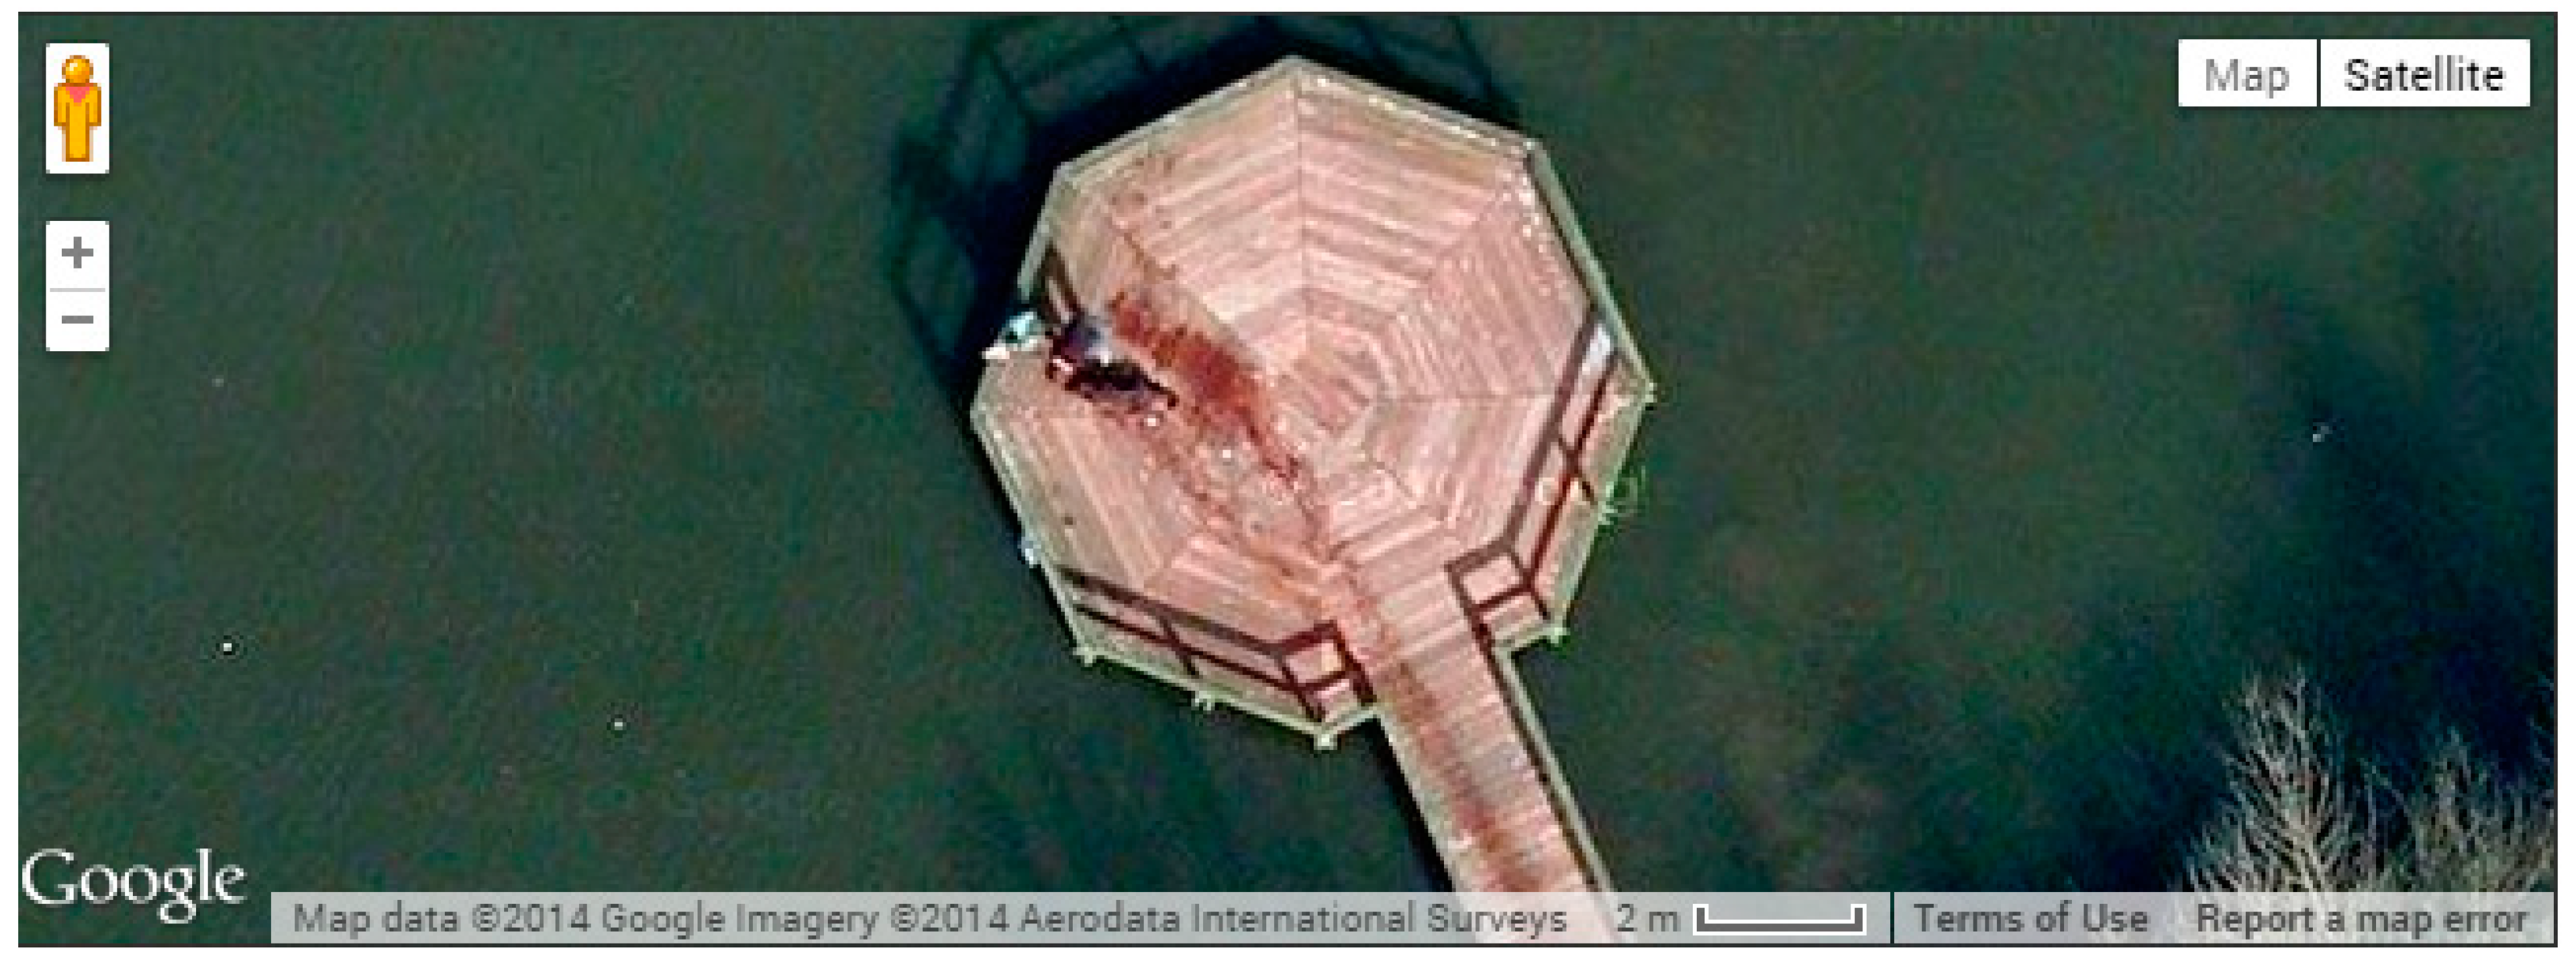
  142. Gayle, D. Google Earth “killer” who left grisly “blood trail” on jetty is revealed to be a wet DOG. Available online: http://www.dailymail.co.uk/news/article-2311010/Swimming-dog-sparks-murder-scare-Google-Earth-killer-wet-dog-called-Rama.html (accessed on 2 December 2014).
  143. Calo, M.R. The drone as privacy catalyst. Stanf. Law Rev. Online 2011, 64, 29–33. [Google Scholar]
  144. Roberts, T. On the radar: Government unmanned aerial vehicles and their effect on public privacy interests from fourth amendment jurisprudence and legislative policy perspectives. Jurimetrics 2009, 49, 491–518. [Google Scholar]
  145. Sengupta, S.U.S. Border Agency Allows Others to Use Its Drones. Available online: http://www.nytimes.com/2013/07/04/business/us-border-agency-is-a-frequent-lender-of-its-drones.html?pagewanted=all&_r=0 (accessed on 31 October 2014).
  146. DAC: Domain Awareness Center Oakland Wiki. Available online: http://oaklandwiki.org/Domain_Awareness_Center (accessed on 22 April 2014).
  147. De Longueville, B.; Smith, R.S.; Luraschi, G. “OMG, from here, I can see the flames!”: A use case of mining location based social networks to acquire spatio-temporal data on forest fires. In Proceedings of the 2009 International Workshop on Location Based Social Networks, Seattle, WA, USA, 3 November 2009; pp. 73–80.
  148. MacEachren, A.M.; Jaiswal, A.; Robinson, A.C.; Pezanowski, S.; Savelyev, A.; Mitra, P.; Zhang, X.; Blanford, J. Senseplace2: Geotwitter analytics support for situational awareness. In Proceedings of the 2011 IEEE Conference on Visual Analytics Science and Technology (VAST), Seattle, WA, USA, 23–28 Octember 2011; pp. 181–190.
  149. Li, R.; Lei, K.H.; Khadiwala, R.; Chang, K.-C. Tedas: A twitter-based event detection and analysis system. In Proceedings of the 28th International Conference on Data Engineering (ICDE), Arlington, Virginia, USA, 1–5 April 2012; pp. 1273–1276.
  150. Klein, B.; Laiseca, X.; Casado-Mansilla, D.; López-de-Ipiña, D.; Nespral, A.P. Detection and extracting of emergency knowledge from twitter streams. In Ubiquitous Computing and Ambient Intelligence; Springer: Berlin, Germany, 2012; pp. 462–469. [Google Scholar]
  151. Pew Research Center Internet Project Survey: Mobile Technology Fact Sheet. Available online: http://www.pewinternet.org/fact-sheets/mobile-technology-fact-sheet (accessed on 20 April 2014).
  152. Sutton, W.; Hansen, E.; Reeser, P.; Kanaskie, A. Stream monitoring for detection of phytophthora ramorum in oregon tanoak forests. Plant Dis. 2009, 93, 1182–1186. [Google Scholar] [CrossRef]
  153. Wood, D. Rethinking the Power of Maps; Guilford Press: New York, NY, USA, 2012; p. 335. [Google Scholar]
  154. Peluso, N.L. Whose woods are these? Counter-mapping forest territories in Kalimantan, Indonesia. Antipode 1995, 27, 383–406. [Google Scholar]
  155. Fairhead, J.; Leach, M. Misreading the African Landscape: Society and Ecology in a Forest-Savanna Mosaic; Cambridge University Press: Cambridge, UK, 1996; p. 384. [Google Scholar]
  156. Smith, G.J.D. Empowered watchers or disempowered workers? In Technologies of Insecurity: The Surveillance of Everyday Life; Aas, K.F., Gundhus, H.O., Lomell, H.M., Eds.; Routledge-Cavendish: Abingdon, Oxon, 2009; pp. 125–146. [Google Scholar]

