Evaluating the SEVIRI Fire Thermal Anomaly Detection Algorithm across the Central African Republic Using the MODIS Active Fire Product


Abstract
:1. Introduction
2. Datasets
2.1. The SEVIRI Active Fire Products
2.2. The MODIS Active Fire Products
3. Selection of the Datasets and the CAR as a Study Site
4. Methods
4.1. Preprocessing
4.2. Identifying Regions of Interest (ROIs)
4.3. SEVIRI Errors of Omission and Commission
5. Results
5.1. SEVIRI Errors of Omission and Commission
5.1.1. Sunglint
5.1.2. SEVIRI’s Background Thermal Characterization
5.1.3. The SEVIRI and MODIS Cloud Masks
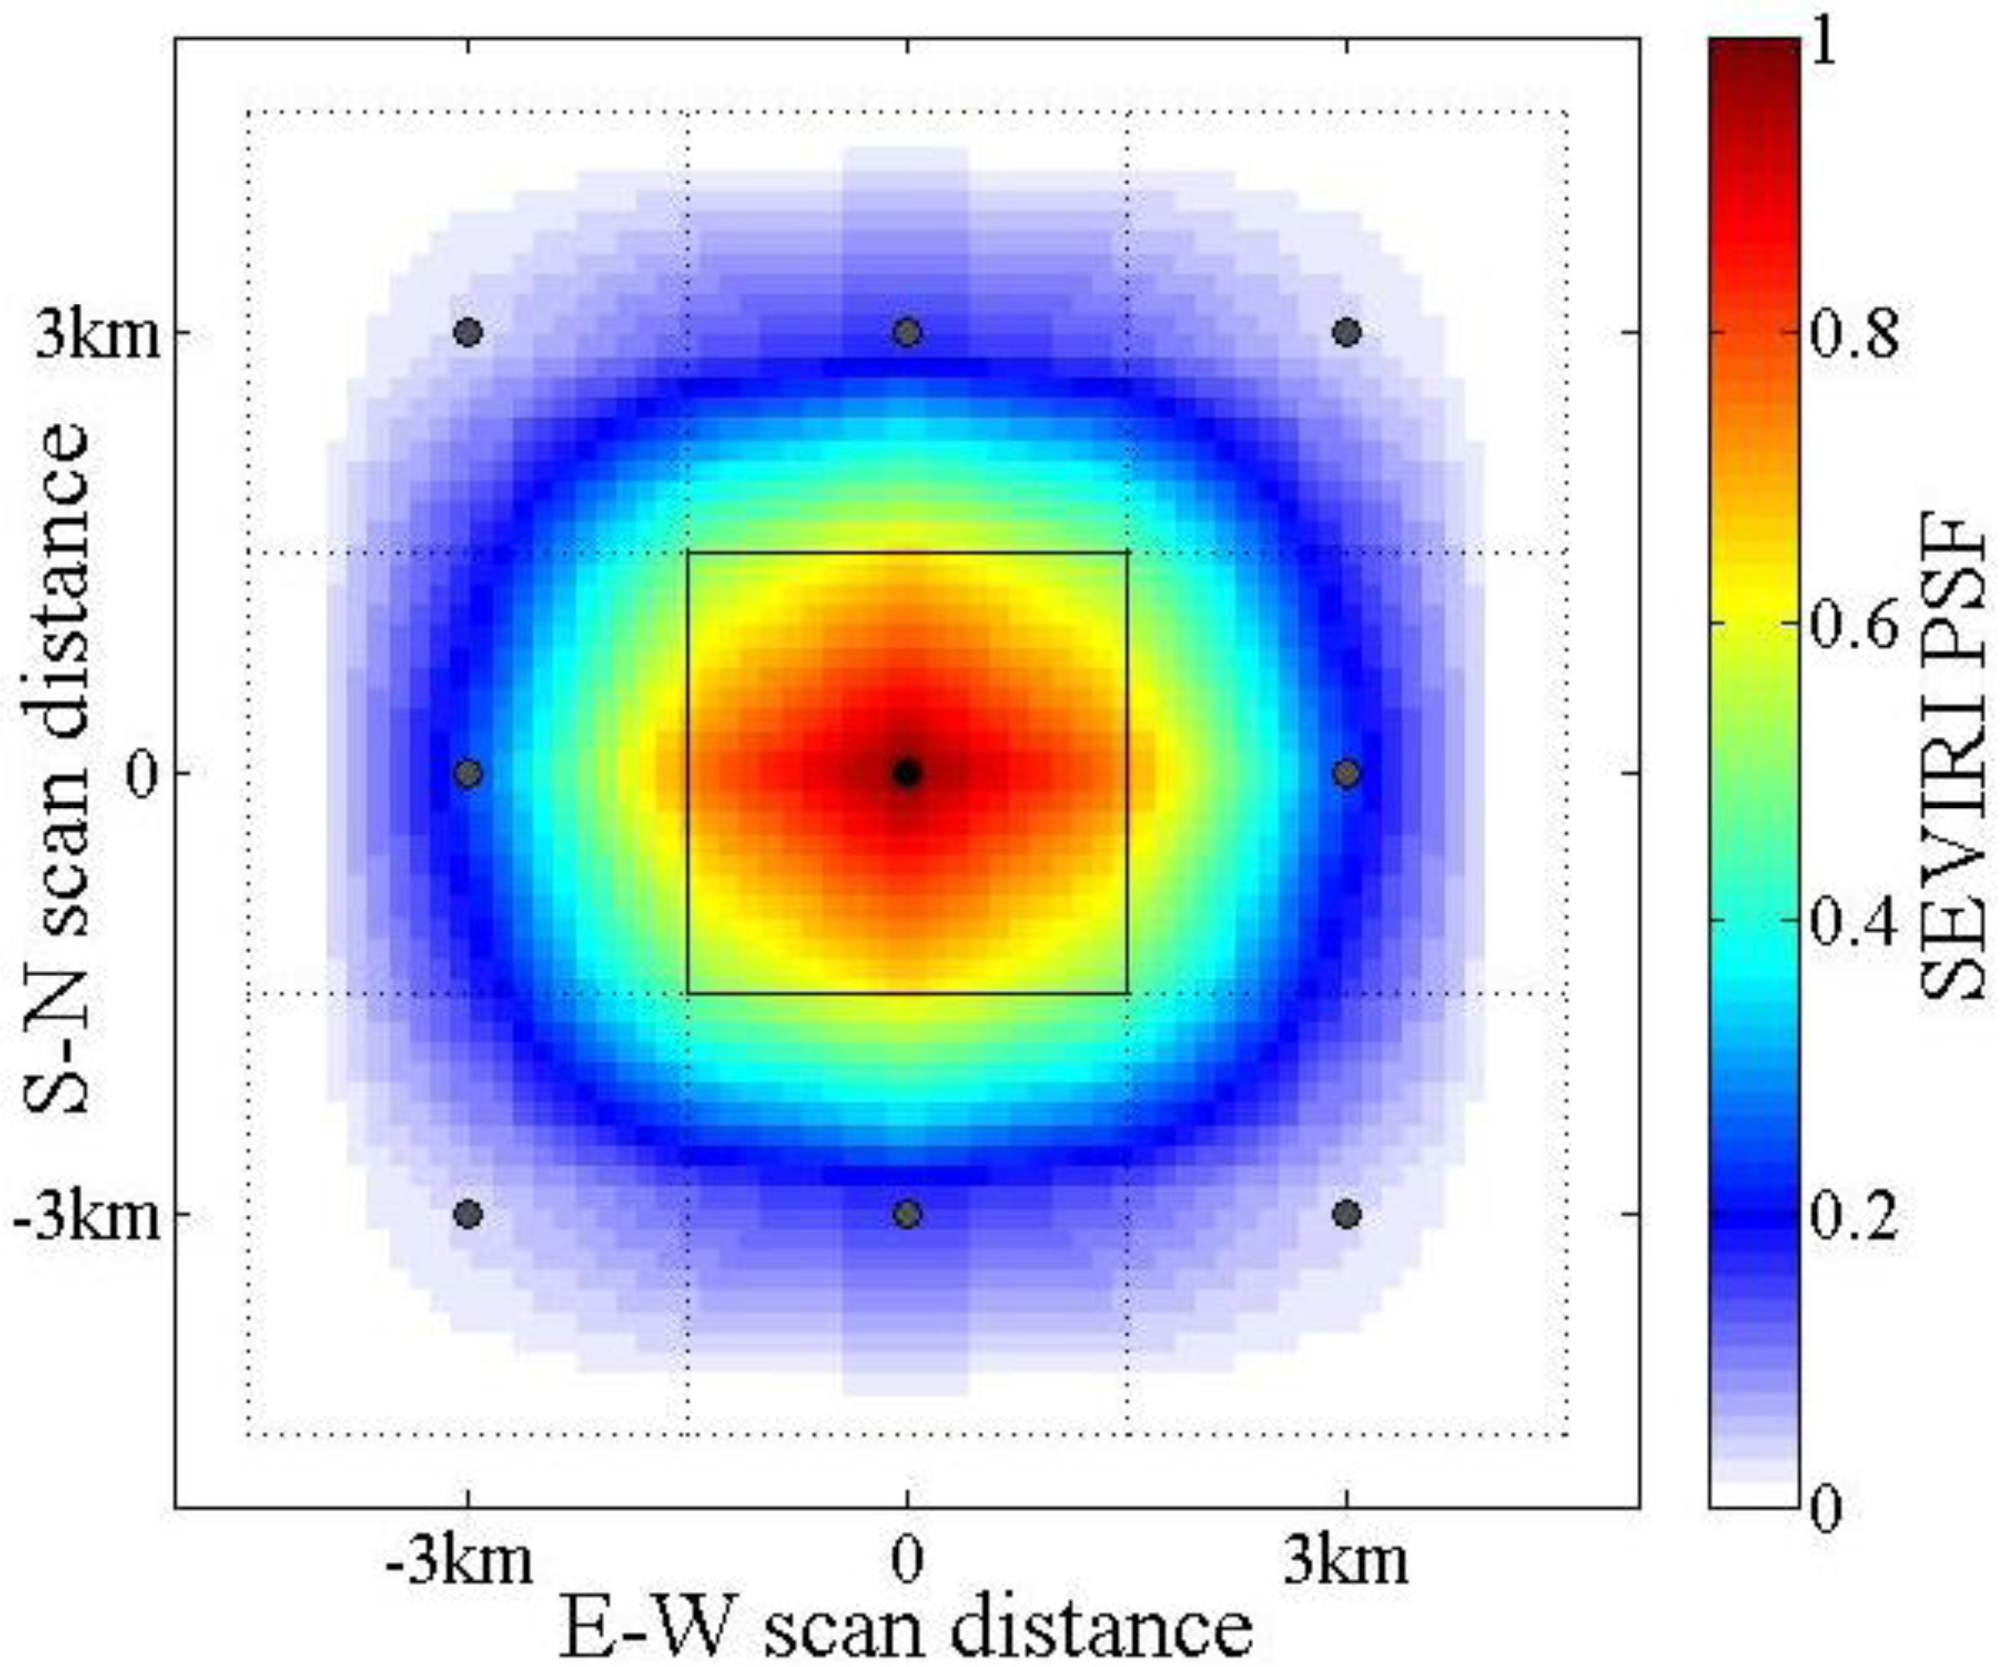
5.1.4. SEVIRI’s Low Spatial Resolution Detection Bias
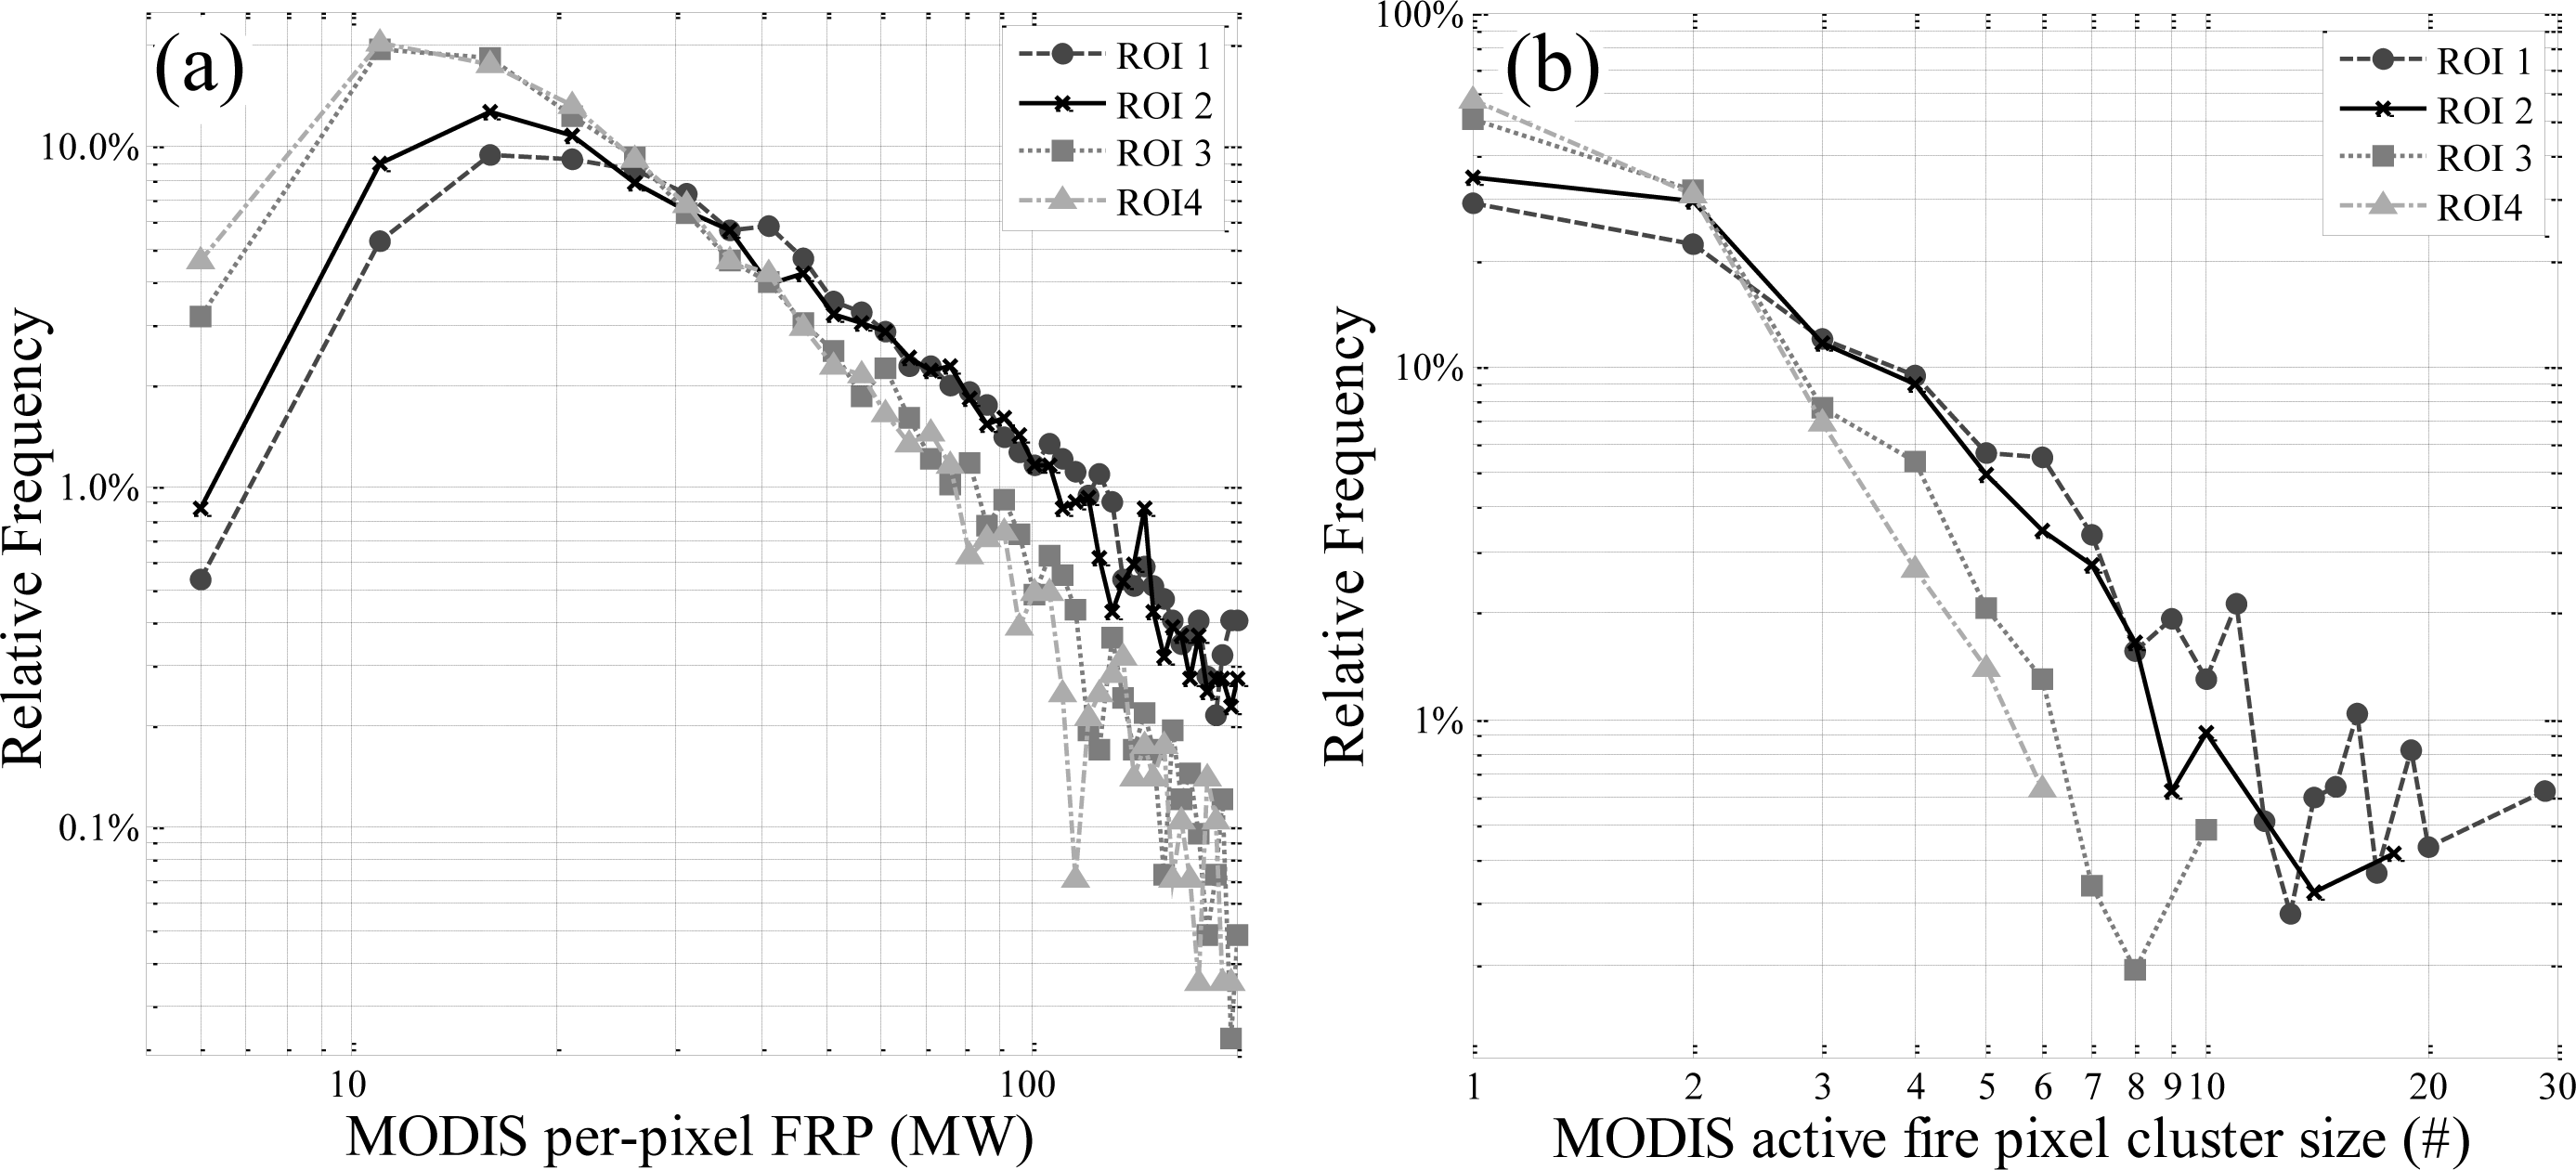
- An independent clustering of MODIS active fire pixels demonstrates that coherent with an increase in SEVIRI’s omission rate, the cluster size of contiguous active fire pixels decreases from ROI 1 to ROI 4 (Figure 8b). Whilst the maximum cluster size progressively decreased from 29 active fire pixels in ROI 1 to six in ROI 4, solitary MODIS active fire pixels accounted for 29% of the clusters in ROI 1 and nearly 60% in ROI 4.
5.2. SEVIRI’s Detection Performance Stratified by Land Cover and Tree Cover
5.3. Impacts of Viewing Geometry on SEVIRI’s Detection Performance
5.4. Verification of the Seasonal Radiative Energy Budget
5.5. SEVIRI’s Daily Omission Rate
6. Conclusions
Acknowledgments
Author Contributions
Conflicts of Interest
References
- Moula, M.; Brustet, J.; Fontan, J. Remote sensing-modelisation approach for diurnal estimation of burnt biomass in the Central African Republic savanna. J. Atmos. Chem 1996, 25, 1–19. [Google Scholar]
- Langaas, S. Temporal and spatial distribution of savanna fires in Senegal and the Gambia, West Africa, 1989–90, derived from multi-temporal AVHRR night images. Int. J. Wildland Fire 1992, 2, 21–36. [Google Scholar]
- Trollope, W.S.W.; de Ronde, C.; Geldenhuys, C.J. Fire Behaviour. In Wildland Fire Management Handbook for Sub-Sahara Africa; Goldammer, J.G., de Ronde, C., Eds.; Global Fire Monitoring Center and Oneworldbooks: Freiburg-Cape Town, South Africa, 2004; pp. 27–55. [Google Scholar]
- Malingreau, J.P. The Contribution of Remote Sensing to the Global Monitoring of Fires in Tropical and Subtropical Ecosystems. In Fire in the Tropical Biota, Ecosystem Processes and Global Challenges; Goldammer, J.G., Ed.; Springer-Verlag: Berlin, Germany, 1990; pp. 337–369. [Google Scholar]
- Justice, C.O.; Korontzi, S. A. Review of the Status of Satellite fire Monitoring and the Requirements for Global Environmental Change Research. In Global and Regional Vegetation Fire Monitoring from Space: Planning a Coordinated International Effort; Ahern, F.J., Goldammer, J.G., Justice, C.O., Eds.; SPB Academic Publishing: New York, NY, USA, 2001; pp. 1–18. [Google Scholar]
- Kennedy, P. Biomass burning studies: The use of remote sensing. Ecol. Bull 1992, 42, 133–148. [Google Scholar]
- Justice, C.O.; Malingreau, J.-P.; Setzer, A.W. Satellite Remote Sensing of Fires: Potential and Limitations. In Fire in the Environment: The Ecological, Atmospheric, and Climatic Importance of Vegetation Fires; Crutzen, P.J., Goldammer, J.G., Eds.; John Wiley & Sons Ltd: New York, NY, USA, 1993; pp. 77–88. [Google Scholar]
- Eva, H.; Lambin, E.F. Remote sensing of biomass burning in tropical regions: Sampling issues and multisensor approach. Remote Sens. Environ 1998, 64, 292–315. [Google Scholar]
- Giglio, L. Characterization of the tropical diurnal fire cycle using VIRS and MODIS observations. Remote Sens. Environ 2007, 108, 407–421. [Google Scholar]
- Vermote, E.; Ellicott, E.; Dubovik, O.; Lapyonok, T.; Chin, M.; Giglio, L.; Roberts, G. An approach to estimate global biomass burning emissions of organic and black carbon from MODIS fire radiative power. J. Geophys. Res. Atmos 2009, 114. [Google Scholar] [CrossRef]
- Ellicott, E.; Vermote, E.; Giglio, L.; Roberts, G. Estimating biomass consumed from fire using MODIS FRE. Geophys. Res. Lett 2009, 36. [Google Scholar] [CrossRef]
- Hyer, E.J.; Reid, J.S.; Prins, E.M.; Hoffman, J.P.; Schmidt, C.C.; Miettinen, J.I.; Giglio, L. Patterns of fire activity over Indonesia and Malaysia from polar and geostationary satellite observations. Atmos. Res 2013, 122, 504–519. [Google Scholar]
- Prins, E.; Menzel, W. Geostationary satellite detection of biomass burning in South America. Int. J. Remote Sens 1992, 13, 2783–2799. [Google Scholar]
- Prins, E.; Feltz, J.; Menzel, W.; Ward, D. An overview of GOES-8 diurnal fire and smoke results for SCAR-B and 1995 fire season in South America. J. Geophys. Res. Atmos 1998, 103, 31821–31835. [Google Scholar]
- Roberts, G.; Wooster, M.; Lagoudakis, E. Annual and diurnal African biomass burning temporal dynamics. Biogeosciences 2009, 6, 849–866. [Google Scholar]
- Schroeder, W.; Prins, E.; Giglio, L.; Csiszar, I.; Schmidt, C.; Morisette, J.; Morton, D. Validation of GOES and MODIS active fire detection products using ASTER and ETM plus data. Remote Sens. Environ 2008, 112, 2711–2726. [Google Scholar]
- Roberts, G.; Wooster, M.; Perry, G.; Drake, N.; Rebelo, L.; Dipotso, F. Retrieval of biomass combustion rates and totals from fire radiative power observations: Application to southern Africa using geostationary SEVIRI imagery. J. Geophys. Res. Atmos 2005, 110. [Google Scholar] [CrossRef]
- Schroeder, W.; Csiszar, I.; Morisette, J. Quantifying the impact of cloud obscuration on remote sensing of active fires in the Brazilian Amazon. Remote Sens. Environ 2008, 112, 456–470. [Google Scholar]
- Mu, M.; Randerson, J.T.; van der Werf, G.R.; Giglio, L.; Kasibhatla, P.; Morton, D.; Collatz, G.J.; DeFries, R.S.; Hyer, E.J.; Prins, E.M.; et al. Daily and 3-hourly variability in global fire emissions and consequences for atmospheric model predictions of carbon monoxide. J. Geophys. Res. Atmos 2011, 116. [Google Scholar] [CrossRef]
- Zhang, X.Y.; Kondragunta, S. Temporal and spatial variability in biomass burned areas across the USA derived from the GOES fire product. Remote Sens. Environ 2008, 112, 2886–2897. [Google Scholar]
- Zhang, X.Y.; Kondragunta, S.; Ram, J.; Schmidt, C.; Huang, H.C. Near-real-time global biomass burning emissions product from geostationary satellite constellation. J. Geophys. Res. Atmos 2012, 117. [Google Scholar] [CrossRef]
- Zhang, X.Y.; Kondragunta, S.; Schmidt, C.; Kogan, F. Near real time monitoring of biomass burning particulate emissions (PM2.5) across contiguous United States using multiple satellite instruments. Atmos. Environ 2008, 42, 6959–6972. [Google Scholar]
- Freitas, S.R.; Longo, K.M.; Chatfield, R.; Latham, D.; Dias, M.A.F.S.; Andreae, M.O.; Prins, E.; Santos, J.C.; Gielow, R.; Carvalho, J.A. Including the sub-grid scale plume rise of vegetation fires in low resolution atmospheric transport models. Atmos. Chem. Phys 2007, 7, 3385–3398. [Google Scholar]
- Sofiev, M.; Vankevich, R.; Ermakova, T.; Hakkarainen, J. Global mapping of maximum emission heights and resulting vertical profiles of wildfire emissions. Atmos. Chem. Phys 2013, 13, 7039–7052. [Google Scholar]
- Wang, J.; Christopher, S.A.; Nair, U.S.; Reid, J.S.; Prins, E.M.; Szykman, J.; Hand, J.L. Mesoscale modeling of Central American smoke transport to the United States: 1. “Top-down” assessment of emission strength and diurnal variation impacts. J. Geophys. Res. Atmos 2006, 111. [Google Scholar] [CrossRef]
- Reid, J.S.; Hyer, E.J.; Prins, E.M.; Westphal, D.L.; Zhang, J.L.; Wang, J.; Christopher, S.A.; Curtis, C.A.; Schmidt, C.C.; Eleuterio, D.P.; et al. Global monitoring and forecasting of biomass-burning smoke: Description of and lessons from the fire locating and modeling of burning emissions (FLAMBE) program. IEEE J. Sel. Top. Appl. Earth Obs. Remote Sens 2009, 2, 144–162. [Google Scholar]
- Cahoon, D.R.; Stocks, B.J.; Levine, J.S.; Cofer, W.R.; Oneill, K.P. Seasonal distribution of African savanna fires. Nature 1992, 359, 812–815. [Google Scholar]
- Langaas, S. Diurnal cycles in savanna fires. Nature 1993, 363. [Google Scholar] [CrossRef]
- Generoso, S.; Breon, F.; Balkanski, Y.; Boucher, O.; Schulz, M. Improving the seasonal cycle and interannual variations of biomass burning aerosol sources. Atmos. Chem. Phys 2003, 3, 1211–1222. [Google Scholar]
- Giglio, L.; Kendall, J.D. Commentary on “Improving the seasonal cycle and interannual variations of biomass burning aerosol sources” by Generoso et al. Atmos. Chem. Phys. 2004, 4, 585–587. [Google Scholar]
- Govaerts, Y.; Wooster, M.; Freeborn, P.; Lattanzio, A.; Roberts, G. Algorithm Theoretical Basis Document for the MSG SEVIRI Fire Radiative Power (FRP) Characterization: FRP Version 2.6. EUMETSAT. 2010. Available online: http://landsaf.meteo.pt/algorithms.jsp?seltab=12&starttab=12 (accessed on 27 February 2014).
- Lattanzio, A.; Govaerts, Y. Product User Manual: PUM FRP Fire Radiative Power. 2010, p. 46. Available online: http://landsaf.meteo.pt/algorithms.jsp?seltab=12&starttab=12 (accessed on 27 February 2014).
- Roberts, G.; Wooster, M. Fire detection and fire characterization over Africa using Meteosat SEVIRI. IEEE Trans. Geosci. Remote Sens 2008, 46, 1200–1218. [Google Scholar]
- Wooster, M.; Zhukov, B.; Oertel, D. Fire radiative energy for quantitative study of biomass burning: Derivation from the BIRD experimental satellite and comparison to MODIS fire products. Remote Sens. Environ 2003, 86, 83–107. [Google Scholar]
- Wooster, M.; Roberts, G.; Perry, G.; Kaufman, Y. Retrieval of biomass combustion rates and totals from fire radiative power observations: FRP derivation and calibration relationships between biomass consumption and fire radiative energy release. J. Geophys. Res.: Atmos 2005, 110. [Google Scholar] [CrossRef]
- Available online: http://landsaf.meteo.pt/algorithms.jsp?seltab=12&starttab=12 (accessed on 27 February 2014).
- Giglio, L. MODIS Collection 5 Active Fire Product User’s Guide: Version 2.5; Department of Geographical Sciences, University of Maryland: College Park, MD, USA, 2013; Available online: https://earthdata.nasa.gov/sites/default/files/field/document/MODIS_Fire_Users_Guide_2.5.pdf (accessed on 27 February 2014).
- Giglio, L.; Descloitres, J.; Justice, C.; Kaufman, Y. An enhanced contextual fire detection algorithm for MODIS. Remote Sens. Environ 2003, 87, 273–282. [Google Scholar]
- Justice, C.; Giglio, L.; Korontzi, S.; Owens, J.; Morisette, J.; Roy, D.; Descloitres, J.; Alleaume, S.; Petitcolin, F.; Kaufman, Y. The MODIS fire products. Remote Sens. Environ 2002, 83, 244–262. [Google Scholar]
- Kaufman, Y.; Justice, C.; Flynn, L.; Kendall, J.; Prins, E.; Giglio, L.; Ward, D.; Menzel, W.; Setzer, A. Potential global fire monitoring from EOS-MODIS. J. Geophys. Res. Atmos 1998, 103, 32215–32238. [Google Scholar]
- Kaufman, Y.; Hobbs, P.; Kirchhoff, V.; Artaxo, P.; Remer, L.; Holben, B.; King, M.; Ward, D.; Prins, E.; Longo, K.; et al. Smoke, clouds, and radiation—Brazil (SCAR-B) experiment. J. Geophys. Res. Atmos 1998, 103, 31783–31808. [Google Scholar]
- Wolfe, R.E.; Nishihama, M.; Fleig, A.J.; Kuyper, J.A.; Roy, D.P.; Storey, J.C.; Patt, F.S. Achieving sub-pixel geolocation accuracy in support of MODIS land science. Remote Sens. Environ 2002, 83, 31–49. [Google Scholar]
- Available online: http://reverb.echo.nasa.gov/reverb/ (accessed on 27 February 2014).
- Morisette, J.; Giglio, L.; Csiszar, I.; Setzer, A.; Schroeder, W.; Morton, D.; Justice, C. Validation of MODIS active fire detection products derived from two algorithms. Earth Interact 2005, 9, 1–25. [Google Scholar]
- Morisette, J.; Giglio, L.; Csiszar, I.; Justice, C. Validation of the MODIS active fire product over Southern Africa with ASTER data. Int. J. Remote Sens 2005, 26, 4239–4264. [Google Scholar]
- Csiszar, I.; Morisette, J.; Giglio, L. Validation of active fire detection from moderate-resolution satellite sensors: The MODIS example in northern Eurasia. IEEE Trans. Geosci. Remote Sens 2006, 44, 1757–1764. [Google Scholar]
- Calle, A.; Gonzalez-Alonso, F.; de Miguel, S. Validation of active forest fires detected by MSG-SEVIRI by means of MODIS hot spots and AWiFS images. Int. J. Remote Sens 2008, 29, 3407–3415. [Google Scholar]
- Amraoui, M.; DaCamara, C.; Pereira, J. Detection and monitoring of African vegetation fires using MSG-SEVIRI imagery. Remote Sens. Environ 2010, 114, 1038–1052. [Google Scholar]
- Prins, E.; Schmetz, J.; Flynn, L.; Hillger, D.; Feltz, J. Overview of Current and Future Diurnal Active Fire Monitoring Using a Suite of International Geostationary Satellites. In Global and Regional Wildfire Monitoring: Current Status and Future Plans; Ahern, F.J., Goldammer, J.G., Justice, C.O., Eds.; SPB Academic Publishing: The Hague, The Netherlands, 2001; pp. 145–170. [Google Scholar]
- Rasmussen, K.; Russell-Smith, J.; Morisette, J.T. Establishing Validation Site Network for Remote Sensing Applications to Fire Research: A Joint Activity between GOFC-Fire and the LPV Subgroup; GOFC-Fire Implementation Team and the CEOS WGCV Land Product Validation Subgroup, 2001. Available online: http://lpvs.gsfc.nasa.gov/PDF/GOFC_LPV_fire_sites.pdf (accessed on 27 February 2014).
- Giglio, L.; Randerson, J.; van der Werf, G.; Kasibhatla, P.; Collatz, G.; Morton, D.; DeFries, R. Assessing variability and long-term trends in burned area by merging multiple satellite fire products. Biogeosciences 2010, 7, 1171–1186. [Google Scholar]
- Van der Werf, G.; Randerson, J.; Giglio, L.; Collatz, G.; Mu, M.; Kasibhatla, P.; Morton, D.; DeFries, R.; Jin, Y.; van Leeuwen, T. Global fire emissions and the contribution of deforestation, savanna, forest, agricultural, and peat fires 1997–2009. Atmos. Chem. Phys 2010, 10, 11707–11735. [Google Scholar]
- Nielsen, T. Characterization of fire regimes in the Experiment for Regional Sources and Sinks of Oxidants (EXPRESSO) study Area. J. Geophys. Res.: Atmos 1999, 104, 30713–30723. [Google Scholar]
- Dwyer, E.; Pereira, J.; Gregoire, J.; DaCamara, C. Characterization of the spatio-temporal patterns of global fire activity using satellite imagery for the period April 1992 to March 1993. J. Biogeogr 2000, 27, 57–69. [Google Scholar]
- Eva, H.; Flasse, S. Contextual and multiple-threshold algorithms for regional active fire detection with AVHRR data. Remote Sens. Rev 1996, 14, 333–351. [Google Scholar]
- Koffi, B.; Gregoire, J.M.; Mahe, G.; Lacaux, J.P. Remote-sensing of bush fire dynamics in central-Africa from 1984 to 1988—Analysis in relation to regional vegetation and pluviometric patterns. Atmos. Res 1995, 39, 179–200. [Google Scholar]
- Freeborn, P.; Wooster, M.; Roberts, G. Addressing the spatiotemporal sampling design of MODIS to provide estimates of the fire radiative energy emitted from Africa. Remote Sens. Environ 2011, 115, 475–489. [Google Scholar]
- Freeborn, P.; Wooster, M.; Roberts, G.; Malamud, B.; Xu, W. Development of a virtual active fire product for Africa through a synthesis of geostationary and polar orbiting satellite data. Remote Sens. Environ 2009, 113, 1700–1711. [Google Scholar]
- Roberts, G.; Wooster, M.; Freeborn, P.; Xu, W. Integration of geostationary FRP and polar-orbiter burned area datasets for an enhanced biomass burning inventory. Remote Sens. Environ 2011, 115, 2047–2061. [Google Scholar]
- Calle, A.; Casanova, J.; Gonzalez-Alonso, F. Impact of point spread function of MSG-SEVIRI on active fire detection. Int. J. Remote Sens 2009, 30, 4567–4579. [Google Scholar]
- Dozier, J. A method for satellite identification of surface temperature fields of subpixel resolution. Remote Sens. Environ 1981, 11, 221–229. [Google Scholar]
- Dennison, P.; Matheson, D. Comparison of fire temperature and fractional area modeled from SWIR, MIR, and TIR multispectral and SWIR hyperspectral airborne data. Remote Sens. Environ 2011, 115, 876–886. [Google Scholar]
- Giglio, L.; Kendall, J. Application of the Dozier retrieval to wildfire characterization—A sensitivity analysis. Remote Sens. Environ 2001, 77, 34–49. [Google Scholar]
- Mayaux, P.; Bartholome, E.; Fritz, S.; Belward, A. A new land-cover map of Africa for the year 2000. J. Biogeogr 2004, 31, 861–877. [Google Scholar]
- Hansen, M.; DeFries, R.; Townshend, J.; Carroll, M.; Dimiceli, C.; Sohlberg, R. Global percent tree cover at a spatial resolution of 500 meters: First results of the MODIS vegetation continuous fields algorithm. Earth Interact 2003, 7, 1–15. [Google Scholar]
- Giglio, L.; Kendall, J. Evaluation of global fire detection algorithms using simulated AVHRR infrared data. Int. J. Remote Sens 1999, 20, 1947–1985. [Google Scholar]
- Kumar, S.; Roy, D.; Boschetti, L.; Kremens, R. Exploiting the power law distribution properties of satellite fire radiative power retrievals: A method to estimate fire radiative energy and biomass burned from sparse satellite observations. J. Geophys. Res. Atmos 2011, 116. [Google Scholar] [CrossRef]
- Mbow, C.; Nielsen, T.T.; Rasmussen, K. Savanna fires in east-central Senegal: Distribution patterns, resource management and perceptions. Hum. Ecol 2000, 28, 561–583. [Google Scholar]
- Wooster, M.J.; Xu, W.; Nightingale, T. Sentinel-3 SLSTR active fire detection and FRP product: Pre-launch algorithm development and performance evaluation using MODIS and ASTER datasets. Remote Sens. Environ 2012, 120, 236–254. [Google Scholar]
- Seielstad, C.A.; Riddering, J.P.; Brown, S.R.; Queen, L.P.; Hao, W.M. Testing the sensitivity of a MODIS-like daytime active fire detection model in Alaska using NOAA/AVHRR infrared data. Photogramm. Eng. Remote Sens 2002, 68, 831–838. [Google Scholar]
- Derrien, M.; le Gleau, H. MSG/SEVIRI cloud mask and type from SAFNWC. Int. J. Remote Sens 2005, 26, 4707–4732. [Google Scholar]
- Calle, A.; Casanova, J.; Romo, A. Fire detection and monitoring using MSG spinning enhanced visible and infrared imager (SEVIRI) data. J. Geophys. Res. Biogeosci 2006, 111. [Google Scholar] [CrossRef]
- Kaiser, J.W.; Heil, A.; Andreae, M.O.; Benedetti, A.; Chubarova, N.; Jones, L.; Morcrette, J.J.; Razinger, M.; Schultz, M.G.; Suttie, M.; et al. Biomass burning emissions estimated with a global fire assimilation system based on observed fire radiative power. Biogeosciences 2012, 9, 527–554. [Google Scholar] [Green Version]
- Schroeder, W.; Csiszar, I.; Giglio, L.; Schmidt, C. On the use of fire radiative power, area, and temperature estimates to characterize biomass burning via moderate to coarse spatial resolution remote sensing data in the Brazilian Amazon. J. Geophys. Res.: Atmos 2010, 115. [Google Scholar] [CrossRef]


| ROI 1 | ROI 2 | ROI 3 | ROI 4 | |||||
|---|---|---|---|---|---|---|---|---|
| ϕFRP = 0.75 | ϕFRP = 0.62 | ϕFRP = 0.50 | ϕFRP = 0.37 | |||||
| SEVIRI | MODIS | SEVIRI | MODIS | SEVIRI | MODIS | SEVIRI | MODIS | |
| Sum of FRP (GW) | 256.8 | 341.4 | 164.9 | 267.4 | 72.4 | 145.6 | 34.0 | 93.1 |
| Min. FRP (MW) | 9.1 | 5.1 | 9.3 | 6.0 | 14.8 | 5.0 | 15.2 | 4.7 |
| Median FRP (MW) | 51.4 | 41.8 | 51.1 | 35.4 | 43.1 | 22.2 | 35.6 | 21.3 |
| Mean FRP (MW) | 73.0 | 73.7 | 68.7 | 61.7 | 52.4 | 35.3 | 42.7 | 32.4 |
| Max. FRP (MW) | 467.5 | 1609.3 | 429.1 | 1432.8 | 397.7 | 626.2 | 239.8 | 647.2 |
| ROI 1 | ROI 2 | ROI 3 | ROI 4 | |
|---|---|---|---|---|
| ϕFRP = 0.75 | ϕFRP = 0.62 | ϕFRP = 0.50 | ϕFRP = 0.37 | |
| SEVIRI error of omission | 25% | 45% | 68% | 74% |
| Surrounded by SEVIRI non-potential fire pixels | 4% (16%) | 13% (28%) | 26% (39%) | 30% (40%) |
| Adjacent to SEVIRI cloud or cloud edge | 12% (49%) | 15% (33%) | 20% (30%) | 23% (31%) |
| Adjacent to SEVIRI potential fire pixel that did not breach the contextual thresholds | 5% (22%) | 13% (29%) | 17% (25%) | 16% (21%) |
| Adjacent to SEVIRI pixel without a defined background temperature | 2% (10%) | 2% (4%) | 2% (3%) | 1% (1%) |
| Adjacent to SEVIRI sunglint pixel or pixel where the test for sunglint failed | 1% (4%) | 2% (4%) | 2% (3%) | 4% (5%) |
| SEVIRI error of commission | 24% | 18% | 32% | 25% |
| ROI 1 | ROI 2 | ROI 3 | ROI 4 | |||||||||
|---|---|---|---|---|---|---|---|---|---|---|---|---|
| ϕFRP = 0.75 | ϕFRP = 0.62 | ϕFRP = 0.50 | ϕFRP = 0.37 | |||||||||
| (GLC2000) Global land Cover classification | Area Covered | SEVIRI Omission Rate | Median MODIS FRP (MW) | Area Covered | SEVIRI Omission Rate | Median MODIS FRP (MW) | Area Covered | SEVIRI Omission Rate | Median MODIS FRP (MW) | Area Covered | SEVIRI Omission Rate | Median MODIS FRP (MW) |
| (1) Closed evergreen lowland forest | - | - | - | 2% | 73% | 28.1 | - | - | - | 3% | 92% | 17.7 |
| (8) Mosaic forest—savannah | - | - | - | 6% | 42% | 44.8 | 10% | 89% | 13.5 | 30% | 79% | 18.7 |
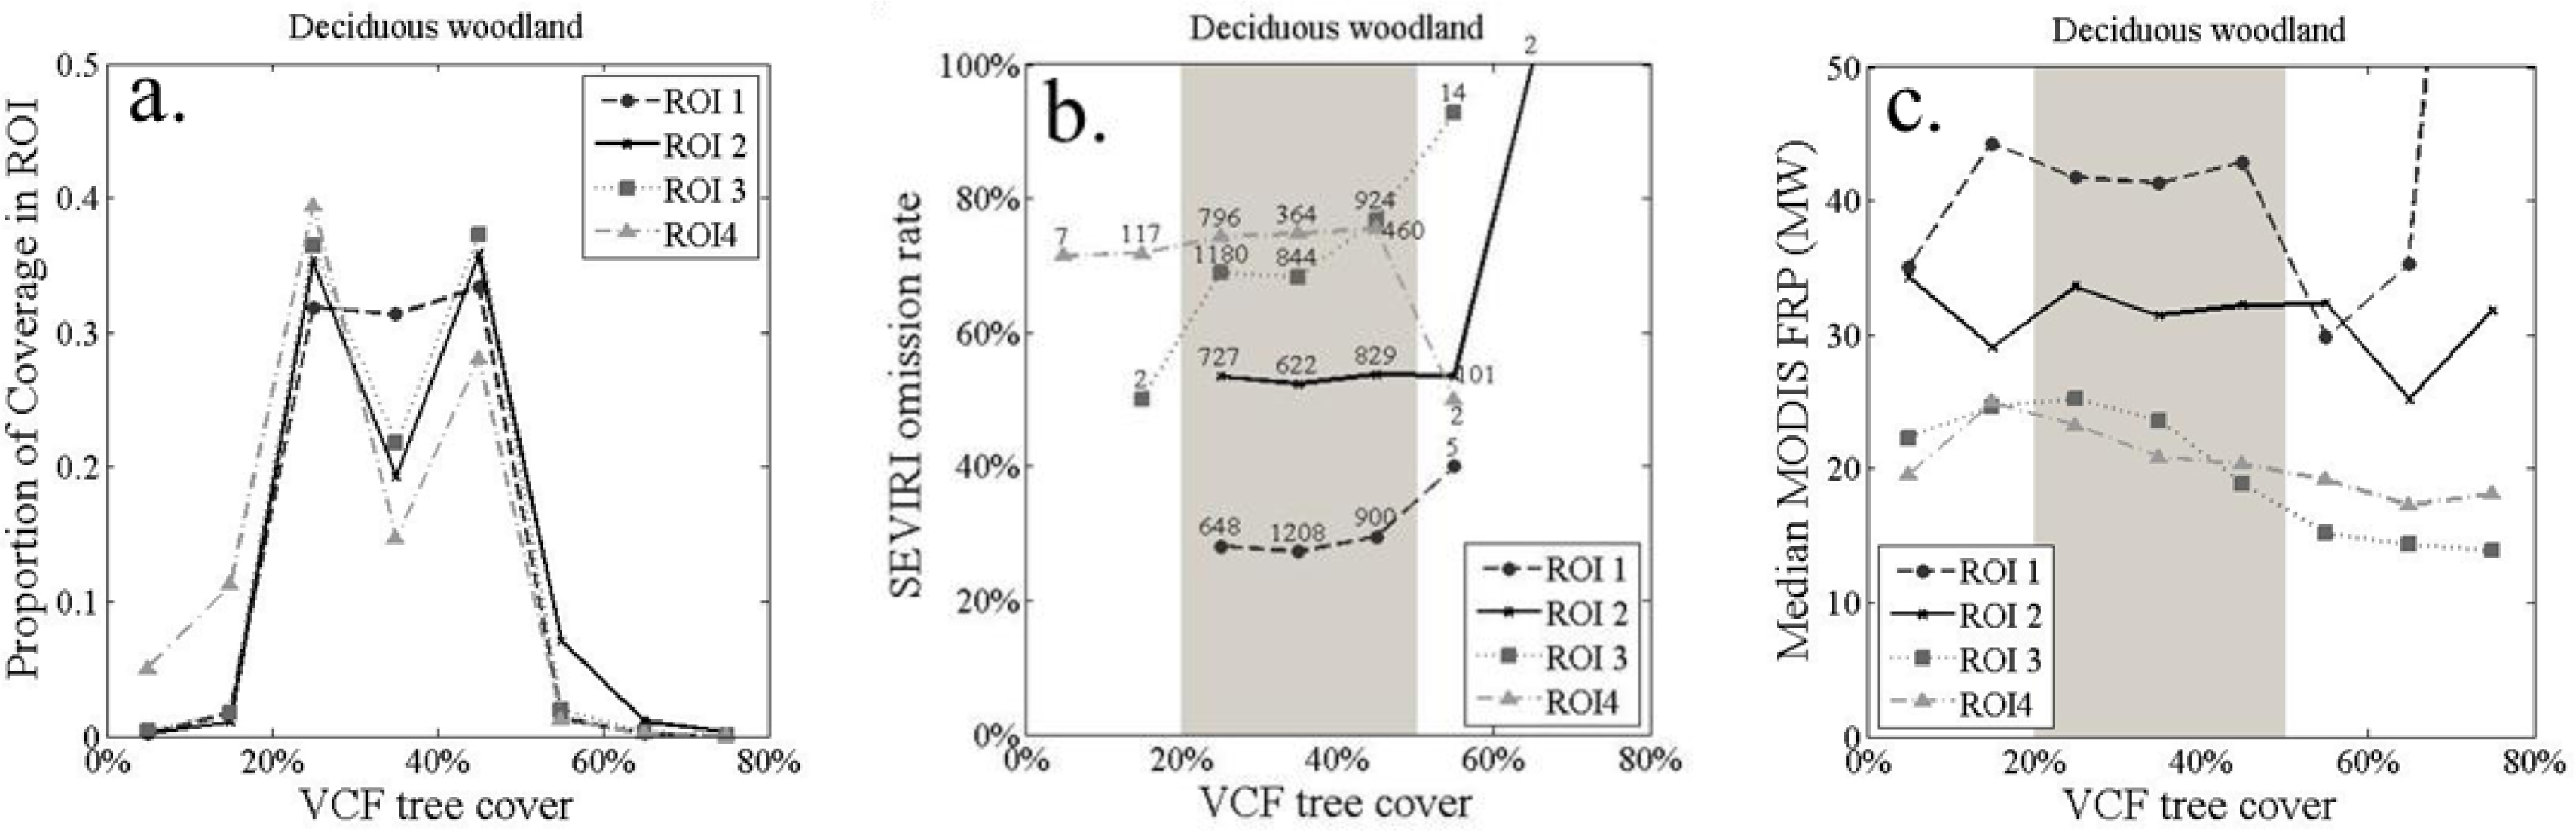
| (10) Deciduous woodland | 100% | 25% | 41.8 | 76% | 49% | 32.4 | 89% | 68% | 22.8 | 67% | 72% | 21.8 |
| (11) Deciduous shrubland with sparse trees | - | - | - | 16% | 30% | 50.6 | 1% | 68% | 24.4 | - | - | - |
© 2014 by the authors; licensee MDPI, Basel, Switzerland This article is an open access article distributed under the terms and conditions of the Creative Commons Attribution license (http://creativecommons.org/licenses/by/3.0/).
Share and Cite
Freeborn, P.H.; Wooster, M.J.; Roberts, G.; Xu, W. Evaluating the SEVIRI Fire Thermal Anomaly Detection Algorithm across the Central African Republic Using the MODIS Active Fire Product. Remote Sens. 2014, 6, 1890-1917. https://0-doi-org.brum.beds.ac.uk/10.3390/rs6031890
Freeborn PH, Wooster MJ, Roberts G, Xu W. Evaluating the SEVIRI Fire Thermal Anomaly Detection Algorithm across the Central African Republic Using the MODIS Active Fire Product. Remote Sensing. 2014; 6(3):1890-1917. https://0-doi-org.brum.beds.ac.uk/10.3390/rs6031890
Chicago/Turabian StyleFreeborn, Patrick H., Martin J. Wooster, Gareth Roberts, and Weidong Xu. 2014. "Evaluating the SEVIRI Fire Thermal Anomaly Detection Algorithm across the Central African Republic Using the MODIS Active Fire Product" Remote Sensing 6, no. 3: 1890-1917. https://0-doi-org.brum.beds.ac.uk/10.3390/rs6031890