Article

Multi-Sensor Imaging and Space-Ground Cross-Validation for 2010 Flood along Indus River, Pakistan

1
School of Civil Engineering and Environmental Sciences, University of Oklahoma, Norman, OK 73019, USA
2
HyDrometeorology & Remote Sensing (HyDROS) Laboratory and Advanced Radar Research Center, National Weather Center Suite 4600, University of Oklahoma, Norman, OK 73072, USA
3
State Key Laboratory of Hydroscience and Engineering, Department of Hydraulic Engineering, Tsinghua University, Beijing 100084, China
4
National Oceanic and Atmospheric Administration/National Severe Storms Laboratory, National Weather Center, Norman, OK 73072, USA
5
Institute of Geographical Information Systems, National University of Sciences and Technology, Islamabad 44000, Pakistan
6
Joint Research Centre of the European Commission, Via Fermi 2147, Ispra 21020, Italy
*
Authors to whom correspondence should be addressed.
Remote Sens. 2014, 6(3), 2393-2407; https://0-doi-org.brum.beds.ac.uk/10.3390/rs6032393
Submission received: 18 December 2013 / Revised: 26 February 2014 / Accepted: 3 March 2014 / Published: 19 March 2014
(This article belongs to the Special Issue Analysis of Remote Sensing Image Data)

Abstract

:
Flood monitoring was conducted using multi-sensor data from space-borne optical, and microwave sensors; with cross-validation by ground-based rain gauges and streamflow stations along the Indus River; Pakistan. First; the optical imagery from the Moderate Resolution Imaging Spectroradiometer (MODIS) was processed to delineate the extent of the 2010 flood along Indus River; Pakistan. Moreover; the all-weather all-time capability of higher resolution imagery from the Advanced Synthetic Aperture Radar (ASAR) is used to monitor flooding in the lower Indus river basin. Then a proxy for river discharge from the Advanced Microwave Scanning Radiometer (AMSR-E) aboard NASA’s Aqua satellite and rainfall estimates from the Tropical Rainfall Measuring Mission (TRMM) are used to study streamflow time series and precipitation patterns. The AMSR-E detected water surface signal was cross-validated with ground-based river discharge observations at multiple streamflow stations along the main Indus River. A high correlation was found; as indicated by a Pearson correlation coefficient of above 0.8 for the discharge gauge stations located in the southwest of Indus River basin. It is concluded that remote-sensing data integrated from multispectral and microwave sensors could be used to supplement stream gauges in sparsely gauged large basins to monitor and detect floods.

1. Introduction

Hydrometeorological disasters cannot be completely avoided, but the impacts and aftereffects can be managed by developing effective risk reduction strategies through application of geospatial tools and decision support systems. Floods commonly cause loss of life and bring about extensive economic losses and social disruptions throughout the world. It was not long ago that the international community fully recognized that sustainable development frameworks should integrate natural disaster risk reduction strategies. This concept was in the “reducing disaster risk” report from the United Nations Development Programme [1] that provided the groundwork for incorporating unconventional data sources for natural disaster risk mitigation. Implementation of similar strategies for a flood monitoring system can potentially help mitigate flood-induced hazards. Such a system typically requires implementation and calibration of a hydrologic model using in-situ observations (e.g., rain gauges and stream gauges). However, global monitoring of earth system processes with satellite remote sensing has improved our understanding of the water cycle both in the atmosphere and on the land surface.
Floods represent one of the most recurrent hydrometeorological disasters in Pakistan that has devastating impacts on human life, food security, the economy and livelihoods in the country. Pakistan is one of the five South Asian countries with the highest annual average number of people physically exposed to floods and landslides, which occur normally due to storm systems during the monsoon from July to September. Floods particularly hit Punjab, Khyber Pakhtunkhwa (KP) and Sindh while torrents tend to affect the hilly areas of Balochistan and the northern and western federally administered areas. The Indus river basin is one such case where river flooding has historically been a very significant problem to socioeconomics. The flood events of 1950, 1992 and 1998 resulted in devastating loss of life and colossal damage to the national economy. Repeated and increasingly frequent flooding every year somehow threatens communities in all the five provinces of Pakistan, as seen during the 2010 floods (Figure 1), and this enhances the need for effective flood risk management. Robust techniques that integrate both in-situ and remotely sensed data can improve the flood monitoring system in the country.
Remotely sensed data provides potential for flood monitoring particularly over many data scarce regions. Recently, remote sensing applications have been shown to characterize the hydrologic processes at varying spatial and temporal footprints over sparsely gauged river basins [2,3]. Satellite-based disaster monitoring systems have become an integral part of disaster management activities in many developed and some developing countries. Apart from high spatial and spectral resolution, the attractiveness of Earth Observing Systems (EOS) lies in the ability to provide seamless data that can be used for flood detection and mapping applications. Remote sensing data integration from multiple sensors (e.g., optical and microwave) have been used within a hydrologic modeling framework for flood monitoring and prediction in Ganges and Brahmaputra river basins in south Asia [4] and Okavango basin in southern Africa [5,6]. Moreover, quantification of flooding through multi-sensors data integration can help to evaluate distributed hydrologic models and, hence, potentially improve flood management strategies in un-gauged catchments [6,7]. Multispectral remotely sensed estimates provide timely and cost-effective hydrologic monitoring in sparsely gauged basins, irrespective of the political boundaries and other geophysical barriers. The application of satellite imagery for flood mapping using MODIS instruments aboard National Aeronautics and Space Administration (NASA) Terra and Aqua satellites offer a unique combination of near-global daily coverage with acceptable spatial resolution (250 m) for major floods. These capabilities are being utilized for flood monitoring at regional and global scale [2]. Satellite sensors such as MODIS and Advanced Spaceborne Thermal Emission and Reflection Radiometer (ASTER) can be used to evaluate and validate hydrologic model predictions [79]. Within existing literature, satellites such as EO-1 (a 10 m panchromatic band plus 30 m multi-spectral bands), along with data from sensors aboard Terra satellite, imagery from France’s Systeme Pour l’Observation de la Terre (SPOT) satellite and other commercial satellites such as GeoEye and QuickBird, provides important land surface imagery which have been used for flood detection in regions with sparse ground observations [1012].
Remotely sensed data acquired at varying microwave frequencies of the electromagnetic spectrum can be effectively used for flood monitoring through cloud cover. Considering these features of microwave sensors, satellite estimates from the Advanced Microwave Scanning Radiometer (AMSR-E) band at 36.5 GHz and also the NASA/Japanese Space Agency TRMM 37 GHz channel are used for river discharge fluctuation measurements over river banks. The AMSR-E sensor measures the microwave radiation emitted by the land surface in vertical and horizontal polarization, expressed in terms of brightness temperature. This approach is attractive due to the fact that ungauged basins especially in developing nations lack gauged networks. The passive microwave sensor can provide river discharge change signal at multiple locations in a catchment and thus can reduce the dependency on gauged runoff observation needed to calibrate hydrologic models at the basin outlet.
The combination of multi-sensor data can be critical to address the need of high pixel resolution data acquisition for all time and all weather conditions. This can be achieved by fusing satellite optical imagery at high temporal resolution with high spatial and spectral resolution data of microwave sensors. The goal of this study is to integrate the readily available satellite products to characterize the spatial extent of inundation in large river basins with sparse in-situ observations. A satellite remote sensing based approach that includes optical imagery as well as active and passive microwave data is used to study the evolution of flooding over Indus river basin.
The main objective of this paper is to evaluate the utility of multisensor remote sensing data for flood monitoring over the Indus river basin as explained in Section 2. Furthermore, Subsection 2.1 details the application of orbital sensors for inundation mapping through delineation of flood extent at multiple resolutions, Subsection 2.2 explains the use of microwave sensors to simulate flood signals at multiple locations that is subsequently compared with gauge-based river discharge observations, and Subsection 2.3 focuses on the comparison of rain gauge data with the latest satellite-based precipitation estimates for monsoon climatology over Pakistan during the 2010 floods. Overall, both active and passive sensors are used as sources of observations, particularly in regions where in-situ networks are sparse. Section 3 concludes how the proposed techniques can be applied for the flood detection with better spatiotemporal resolution along the Indus river basin.

2. Datasets and Methodology

2.1. Multispectral Data for Flood Extent Mapping

Advanced photogrammetric and pattern recognition methods for remote sensing data processing can provide objective information that may help to detect and monitor the progression of floods at high spatial resolution [57]. For example, orbital sensors, such as MODIS, provide necessary data to help detecting floods in regions where no other means are available for flood monitoring with reasonable accuracy [2,13]. Such data, after certain processing are capable of providing timely information on flood extents with global coverage and frequent observations.
The MODIS instruments on the NASA’s Aqua and Terra satellites together provide near global observations of the Earth surface in daylight conditions twice each day with a spatial resolution between 250 m and 1000 m. MODIS instruments are a practicable choice for rapid response for large scale flood events because of the high temporal resolution of Aqua and Terra. However, one limitation of optical sensors, such as MODIS, is that it cannot penetrate cloud cover and thus suffers from cloud contamination. Pattern recognition using image classification techniques were used to delineate the flooding extent from the MODIS imagery. For that purpose, the Iterative Self-Organizing Data Analysis Technique (ISODATA) algorithm [14] was applied to delineate the flood extent from the MODIS false color composite image. A detailed explanation and step by step process for the image classification technique used is explained by [8].

2.2. Radar Remote Sensing for Flood Monitoring

Recently, satellite radar imagery has proved invaluable in mapping flood extent [1012]. In the past, flood extent maps derived from Synthetic Aperture Radar (SAR) sensors have been used to validate hydraulic models [15,16]. However, limitations of the SAR include inability to detect flooding in urban areas, inaccurate image calibration that leads to geometric and radiometric distortions, difficulties for data processing, and more prohibitively, low temporal resolution of the current radar satellites with a revisit time of 35 days [17]. However, the Advanced Synthetic Aperture Radar (ASAR) instrument aboard ENVISAT with a spatial resolution of (150–1000 m) and a revisit time of a few days for higher resolution inundation maps [3,15,17] have been utilized for high resolution flood inundation mapping. In addition, ASAR can detect inundation in all weather conditions, while optical sensors are difficult to observe flooded conditions timely due to usually cloud conditions during the period of flooding.
The ASAR sensor is a C-Band sensor that can operate in different modes of varying spatial and temporal resolution. The underlying principle behind ASAR flood detection technique is that the backscattering of the incident radar beam by water surfaces is distinguishable than the backscatter of other objects that is observed by the sensor [18,19]. There are well established radar image processing techniques used for change detection and flood mapping, some detailed comparison are provided by Matgen et al. [19], Schumann et al. [20], Gstaiger et al. [21] and Kuenzer et al. [22]. Here we used a semi-automated histogram thresholding technique to extract flood pixel is used based on the low backscatter values with in the image. A detailed step by step process for an optimal grey level threshold can be found in the references listed above. This detection method is straightforward and commonly used technique to demarcate water and no water pixel from images. A criterion measure is applied to evaluate the between-class variance of a threshold at a given level computed from a normalized image histogram of gray levels.

2.3. Microwave Remote Sensing for Flood Detection

The motivation is to use remotely sensed data from advanced microwave sensor such as brightness temperature to indirectly detect surface water changes at every pixel location from the satellite foot print. The AMSR-E based proxy discharge is the ratio of brightness temperatures at 36.5 GHz H-polarization of the sensor at a wet pixel (M) centered over the river and its floodplain and dry area near the site referred to as the calibration pixel (C) area. Since the thermal conductivity, volumetric heat capacity, and emission properties of land and water is different, the observed microwave radiation detects a lower brightness temperature values for water and higher for land. The passive microwave sensor detected water surface signal (M/C ratio) is an indirect means for river water surface change [2]. The Global Flood Detection System (GFDS) of the Joint Research Centre of the European Commission ( http://old.gdacs.org/flooddetection/overview.aspx) and River Watch 2 ( http://floodobservatory.colorado.edu/DischargeAccess.html) are using this technique for global flood detection [23,24]. The AMSR-E based discharge measurements monitors water surface signals at more than 10,000 monitoring areas in different river basins throughout Africa, Asia, America and Europe.
The development in satellite based remote sensing datasets and techniques offers the potential to address flood prediction problems in sparsely gauged basins. The advances in precipitation estimation from space involve combination of infrared (IR) measurements from geostationary satellites with passive microwave (MW) measurements from polar-orbiting satellites [2529]. The current TRMM mission particularly contributes towards this effort, with a goal to enable improved hydrologic prediction applications over tropical regions. The primary advantage of using remotely sensed precipitation estimates over surface rain gauge measurements is the high temporal coverage and with large areal coverage. These advantages are more pronounced in unreachable areas, where rugged terrain hampers the installation of rain gauge networks. In addition, the problem of inaccessibility of gauge network observations and lack of data sharing between different organizations can be tackled by using remotely sensed data. Therefore, in this analysis country-wide precipitation estimates of TRMM Multi-satellite Precipitation Analysis (TMPA) are shown, that provides overall monsoon climatology.
To define the spatial characteristics of 2010 Monsoon season, the TRMM Multi-satellite Precipitation Analysis (TMPA) algorithm based latest precipitation estimates, developed by the NASA [27], are used. The TMPA provides a 3-h, real-time, precipitation product (hereafter 3B42V7 for Version-7) with spatial resolution of 0.25° × 0.25°.

3. Results

3.1. MODIS and ASAR for Inundation Mapping

Considering the advantages and limitation of orbital sensors, imagery from two different instruments with varying spatial resolution is used for flood mapping. First, a moderate resolution data from MODIS sensor is used to map the extent of inundation throughout the Indus river basin. Second, higher resolution imagery from the ASAR is used for the lower Indus river basin. MODIS imagery-based map for 10 August shows the inundation of the adjacent areas along the Indus river basin. Figure 1a shows the false-color composite (bands 7, 2, 1) from MODIS scenes. This image for 10 August is used to extract the flood extent using an unsupervised classification technique, explained in Section 2.1 (Figure 1b). A reference layer that includes water features such as lakes and rivers was used to identify and separate the evolution of the 2010 Indus flood (Figure 1b).
To characterize the extreme inundation during overcast conditions over lower Indus basin the high resolution ASAR image is used to estimate inundation extent during this 2010 flood over lower Indus River (Figure 2b). The datasets required in this study are readily accessible and in fact used for flood monitoring applications around the world. As such, the applicability of the method and thus the skill to provide flood estimates is potentially worldwide for sparsely observed basins and large rivers.

3.2. Passive Microwave Satellite Based Discharge Estimation

In this analysis, passive microwave derived river width change estimates are utilized for flood detection along the upper and lower Indus River. AMSR-E detected water surface signal are compared with the river discharge data at multiple gauge stations throughout the Indus River basin. The gauged river discharge was obtained from the Federal Flood Commission (FFC) that archived the daily river flows and water levels in the reservoirs in coordination with the Pakistan Meteorological Department (PMD). The river discharge data is selected based on the length of record, completeness and reliability of data. The available discharge gauges maintained by PMD are listed in Table 1. The time period for this analysis was selected from 2008–2011, which includes the 2010 flood.
To assess the agreement between simulated and observed discharge, the Pearson Correlation Coefficient (CC) is used, as explained in Equation (1) below
CC = i = 1 n ( Q Gau i Q Gau ¯ ) ( Q Sat i Q Sat ¯ ) i = 1 n ( Q Gau i Q Gau ¯ ) 2 i = 1 n ( Q Sat i Q Sat ¯ ) 2
where, QGaui is the observed discharge of the ith time step. QSati is the simulated discharge of the ith time step.
The AMSR-E detected water surface signal matched closely with the observed runoff with a Pearson correlation coefficient of 0.7, 0.72, 0.7, at Tarbela, Kalabagh, Chashma gauge discharge stations, respectively (Figure 3a, Table 1). Similarly, for the lower Indus basin the flood signal corresponds well with observed flood hydrographs in monitoring stations where the river overflows the bank in the Sindh province. The correlation coefficient was 0.82, 0.84, 0.88, 0.83 for stations at Taunsa, Guddu, Sukkur, Kotri, respectively (Figure 3b, Table 1).
Overall, the remotely sensed river discharge proxy show high correlation with in-situ data and detects the floods that produced havoc along the upper and lower reaches of the Indus River. The AMSR-E detected water surface signal (M/C ratio) captures high flow peaks each year, however the signal is insensitive to discharge fluctuations during low flows. The method was designed with the realization that the AMSR-E signal provides no direct information about discharge magnitude, but is highly correlated with observed discharge for significant flows. The results for all the tested sites show a good agreement with “ground truth” measured discharge at multiple gauge locations along the upper and lower Indus River.

3.3. Satellite Precipitation Estimates

In order to get the overview of the monsoon variability during the 2010 floods, first a quantitative evaluation of 3B42V7 is performed by comparing the satellite precipitation product and rain gauge observations over the intense monsoon zone. The rain gauge data used for evaluation is acquired from the Pakistan Meteorological Department (PMD) (Figure 4a). Since the PMD gauge observation are at daily time scale the same spatial resolution is maintained for the TMPA product, by accumulating the 3 h precipitation estimates of TRMM 3B42V7 to daily precipitation estimates. This study examines the spatial and temporal distribution of the Monsoon (JAS) seasons in Pakistan for 2010 flood year. Precipitation climatology for Monsoon (JAS) based on daily rain gauge observations is shown in Figure 4a, while the latest TMPA 3B42V7 accumulated precipitation (mm) estimates are illustrated in Figure 4b.
Precipitation comparison of satellite estimates with rain gauge observations over Pakistan is shown in Figure 5. Average precipitation data for the 2010 Monsoon season were used to compare each gauge station against satellite pixels for the eight selected rain gauge stations over the intense monsoon zone (31–35°N) latitude bands (Figure 5a). Quantitative statistical indices are used to quantify the spatial error structure of satellite precipitation. Plots of daily Tropical Rainfall Measuring Mission (TRMM) 3B42V7 vs. rain gauge comparison statistics including Correlation Coefficient (Equation (1)), % Bias (Equation (2)), and Root Mean Square Error (Equation (3)) are shown graphically in Figure 5b–d, respectively.
RMSE = 1 n i = 1 n ( P Sat i P Gau i ) 2
BIAS = i = 1 n ( P Sat i P Gau i ) i = 1 n P Gau i × 100 %
Pearson correlation coefficient (CC) is used to assess the scale of agreement that reflects the level of linear correlation. Moreover, four statistical indices are used for validation to check for error and bias between satellite precipitation and gauge observations. The root mean square error (RMSE) evaluates magnitude of mean error. The relative bias (BIAS) provides information on the magnitude of difference between the two datasets. We used this index to quantify the systematic error in the satellite precipitation data. Comparisons of 3B42V7 at daily scale for the 2010 flood year showed significantly higher agreement with bias ranging from ±20% for any selected gauge station as shown in Figure 5b. Statistical indices showed an association with the geo-topographic distribution of the gauge stations as well as the precipitation intensity. For example, underestimation is generally for gauge stations located to the far north at higher elevation and with relatively intense rainfall (Figure 5b).
Recently, the authors evaluated the spatial and temporal characteristics of the Asian monsoon over Pakistan by comparing multiple year rain gauge rainfall observations with the TRMM 3B42V7 and other satellite precipitation products. Quantitative validation showed a significant correlation of 0.87 for the stations in the southwest and 0.63 in the Northeast Monsoon region [30]. In this study, the overall high correlation (0.7) was observed at the higher latitudes with the exception of a few low values around 0.3 (Figure 5c). The error statistics show an RMSE ranging from 10% to 25% (Figure 5d).

4. Conclusion and Future Work

The datasets required in this study are readily accessible and in fact used for flood monitoring applications around the world. As such, the applicability of the method and thus the capability to provide flood estimates is potentially global for sparsely observed regions and river basins. In this paper, an integrated approach is developed by utilizing optical imagery from the MODIS and high resolution ASAR data to detect water inundation during the intense monsoon season in 2010. Moreover, the latest rainfall estimates from the Tropical Rainfall Measuring Mission (TRMM) along with passive microwave sensor retrieved land surface brightness temperatures from Advanced Microwave Scanning Radiometer (AMSR-E) are used to monitor floods over the Indus river basin in south Asia. It is evident that no single sensor can be sufficient for a reliable flood monitoring. However, combining many of the readily accessible satellite remote sensing data products can be the way forward in flood disaster risk reduction. In this paper, the floods that devastated Pakistan in 2010 are studied from the perspective of satellite multi-sensor data application. This case study demonstrated the potential of satellite remote-sensing data for flood monitoring in sparsely gauged basins. Following are the main highlights and conclusions of this paper.
(1)
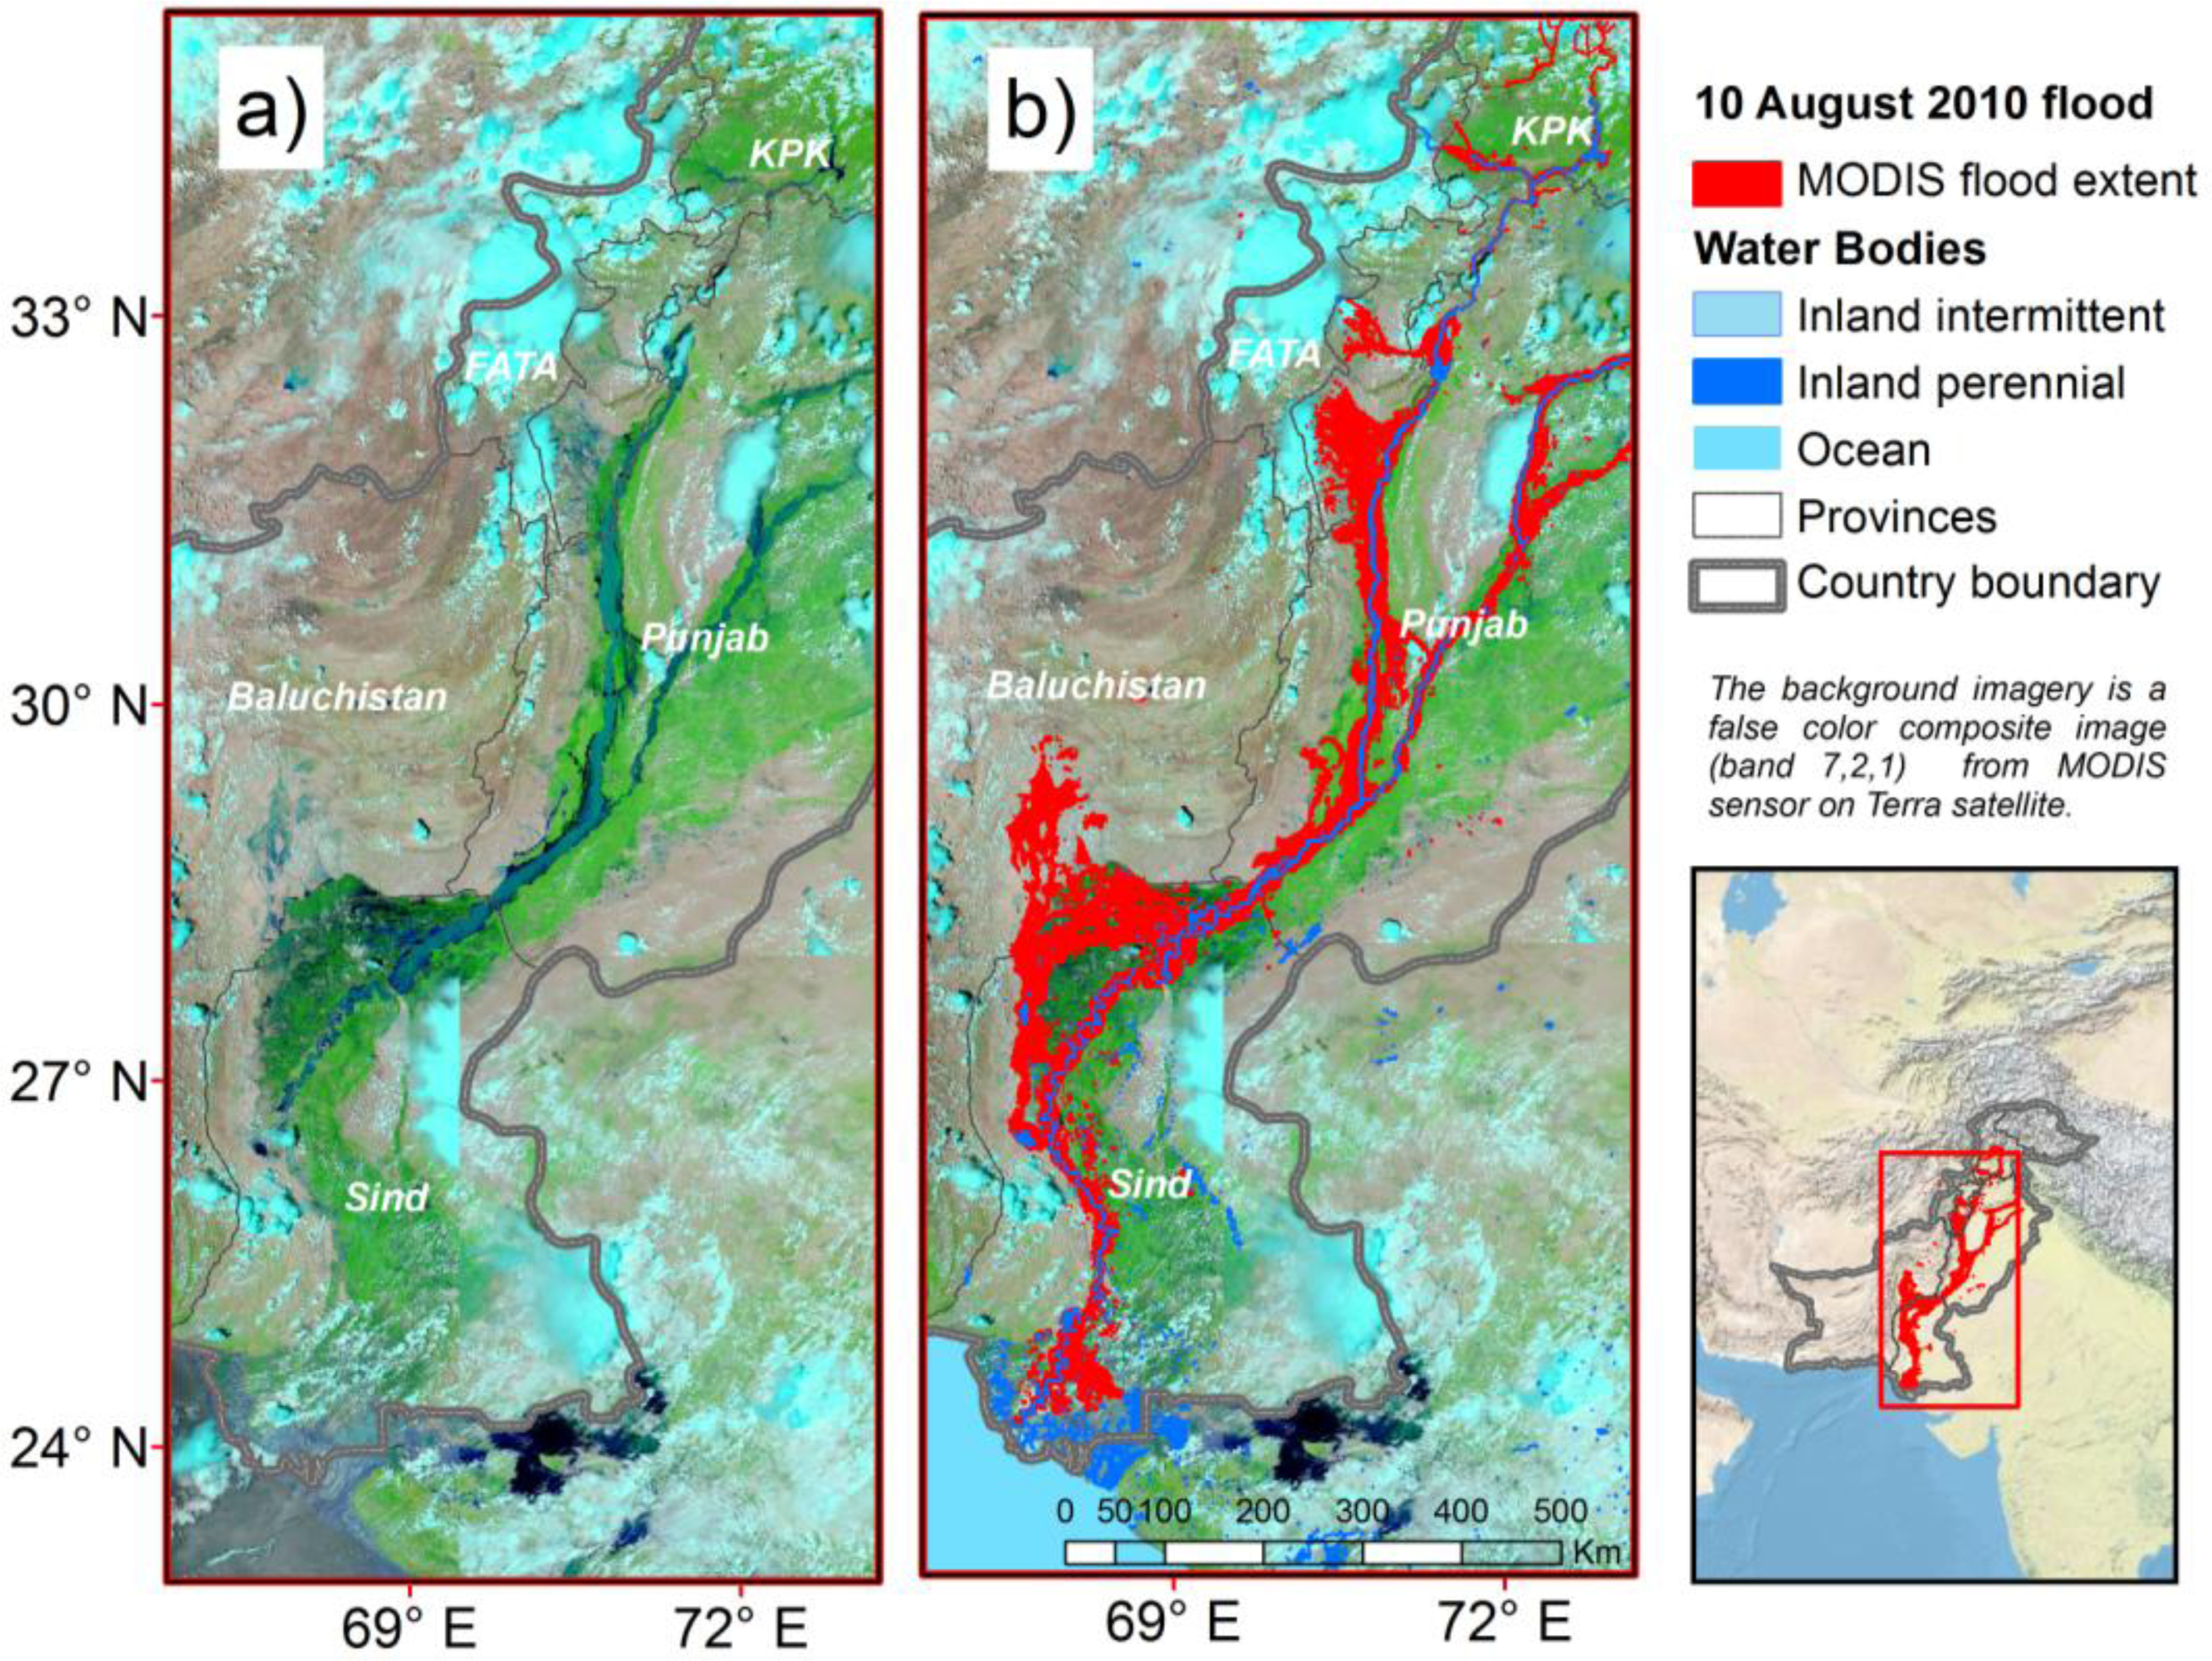
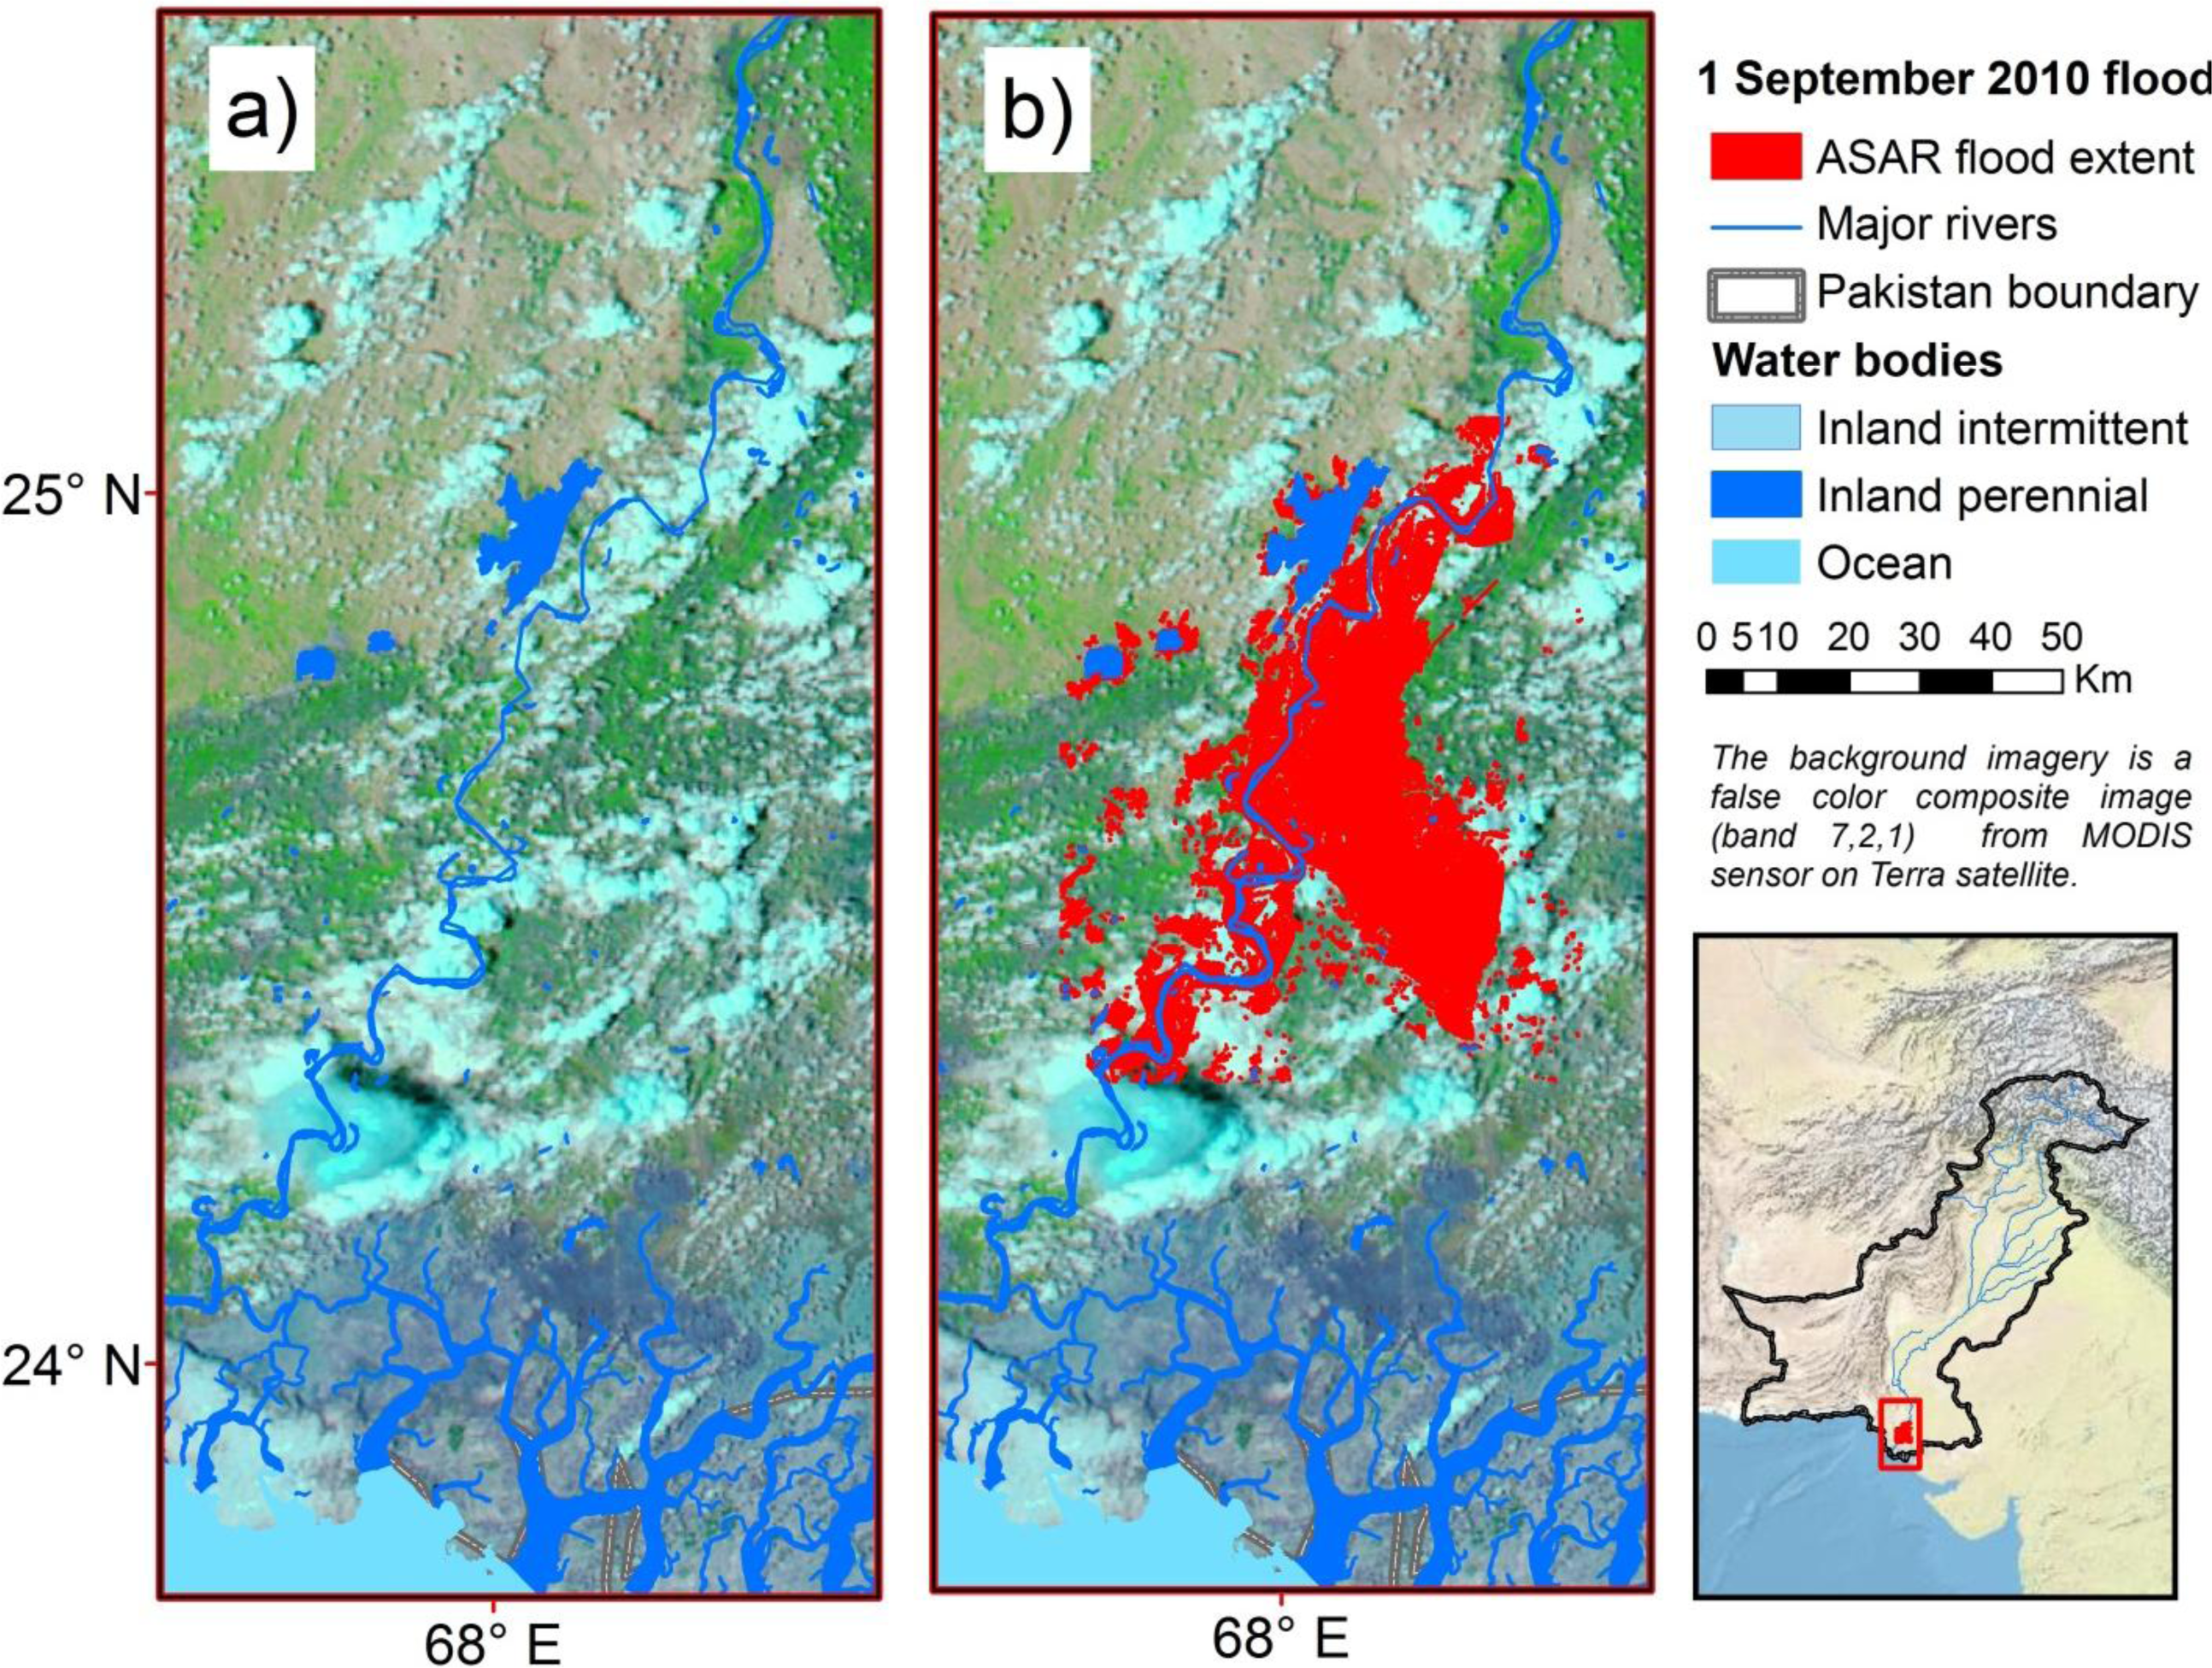
To delineate the extent of the 2010 flood along the Indus River, the MODIS sensor data is used, based on the advantage of frequent revisits and large areal coverage. Moreover, the all-weather and all-time capability of higher resolution imagery from the ASAR is utilized to detect floods over the lower Indus river basin. This binary approach to flood prediction will be very useful to providing simple flood vs. no flood estimates to any basin where in-situ observations are scarce.
(2)
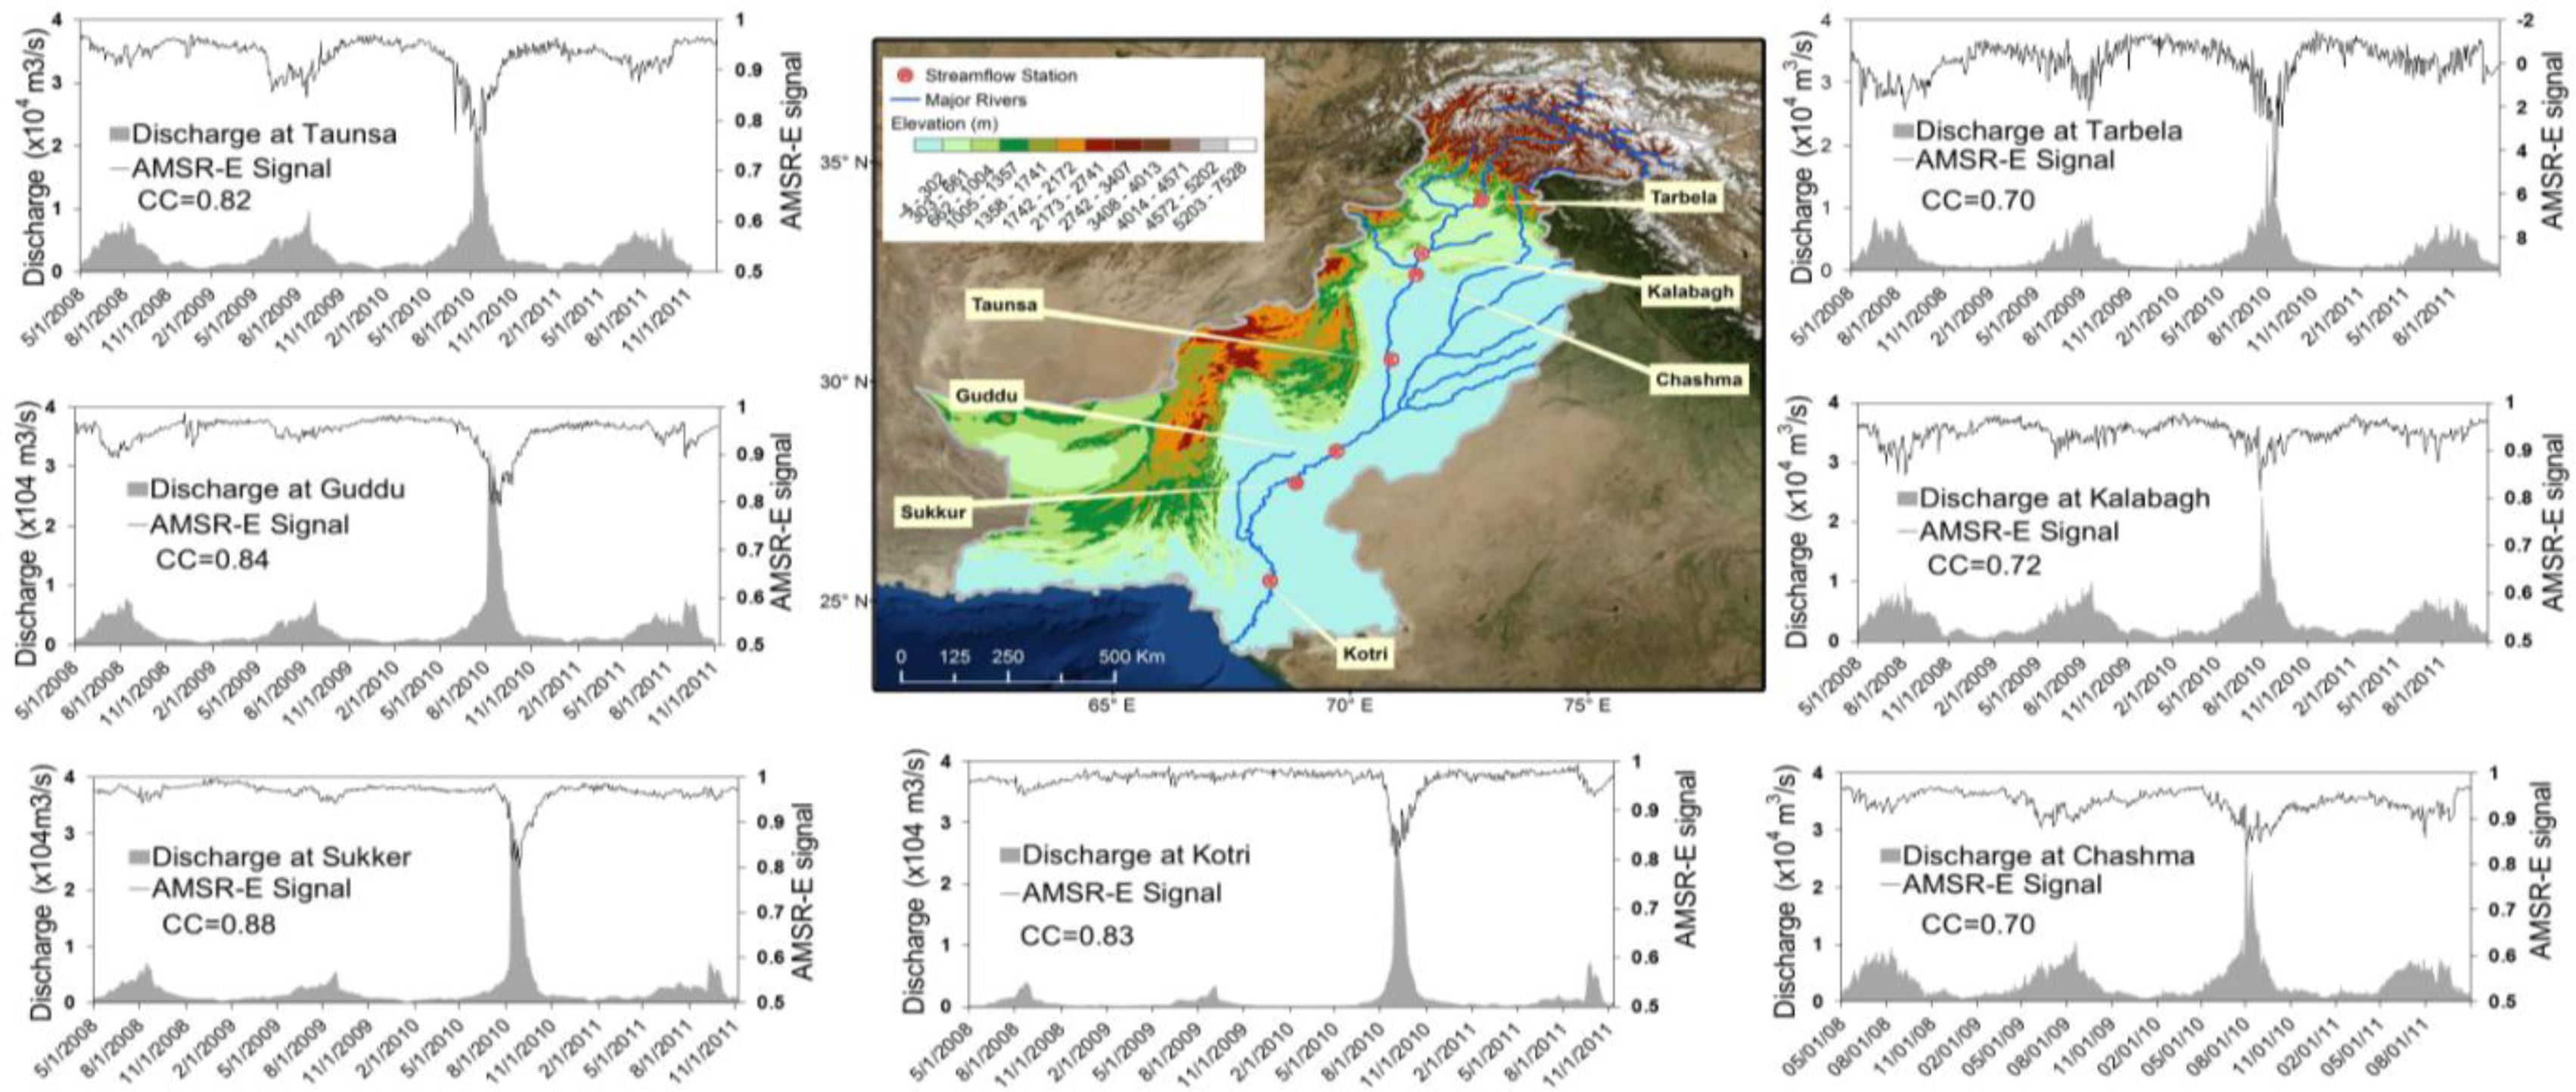
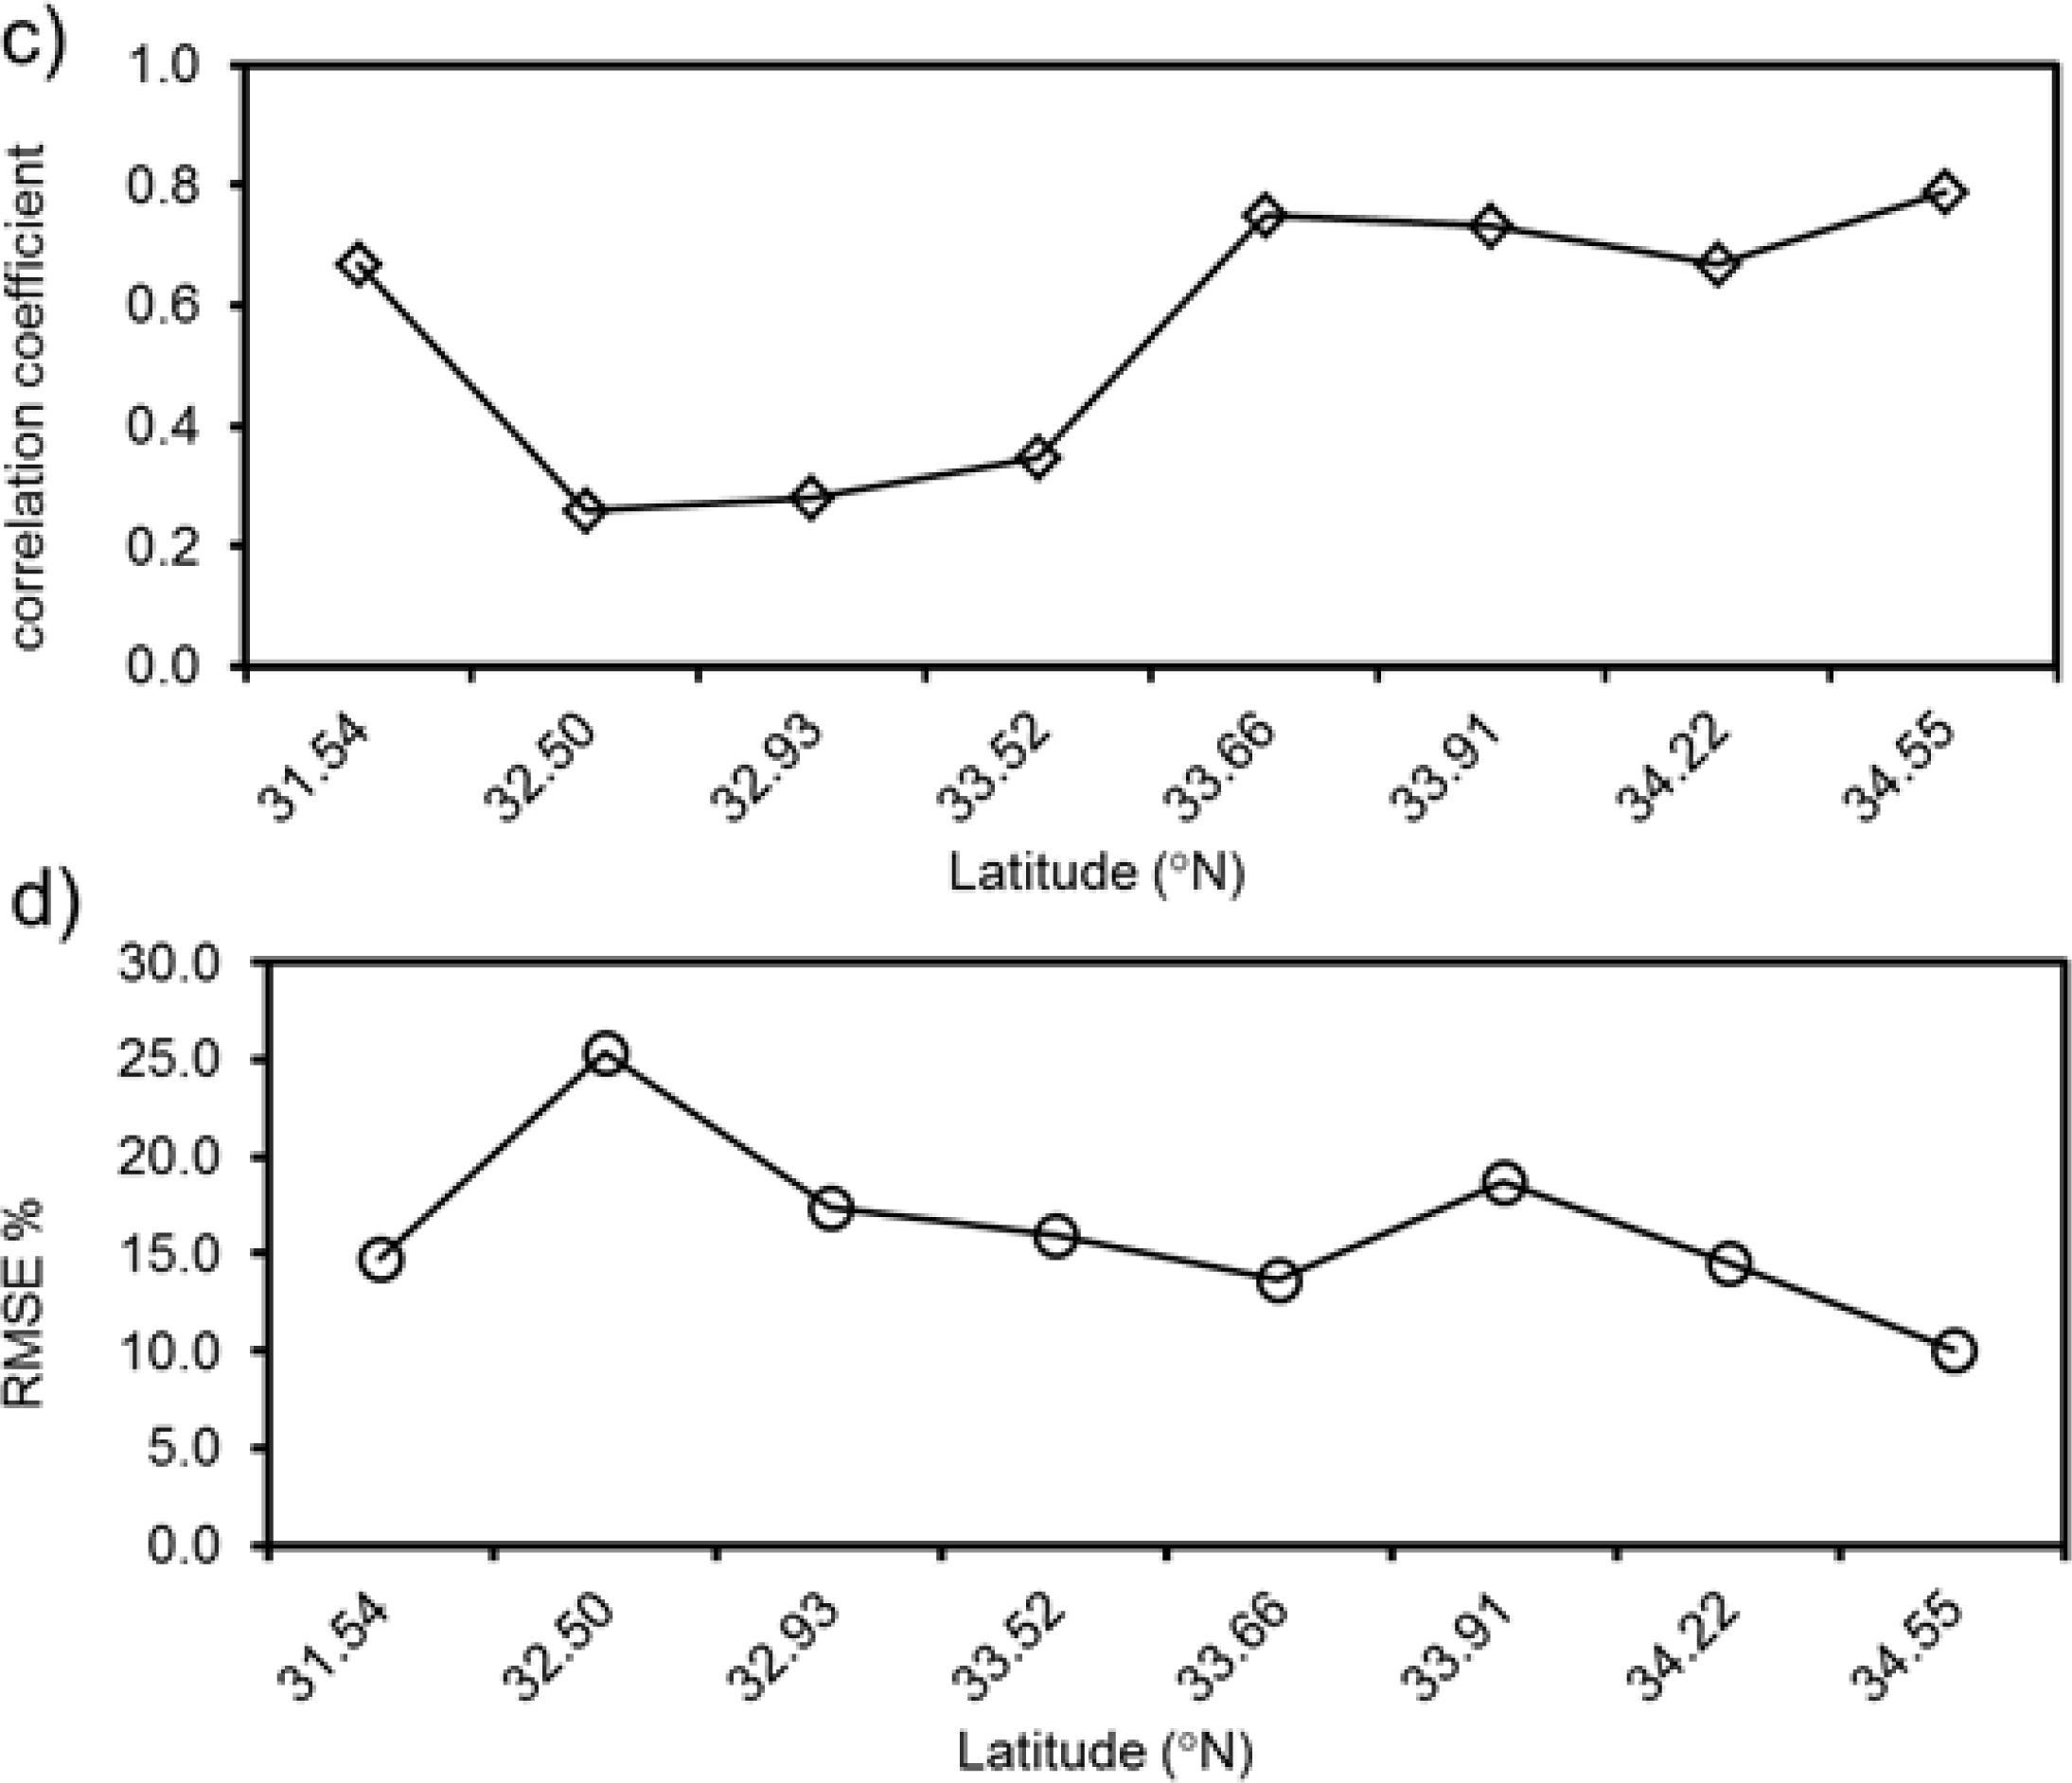
Satellite based surface water change signal is supplemented with the sparse gauge runoff observations to observe the evolution of the 2010 flood throughout the Indus River. Moreover, long-term, consistent, and sustained observation of discharge observation from selected gauge stations are used to cross-validate the AMSR-E based flood signals. It is concluded that the passive microwave sensor was able to detect flood (M/C signal) and corresponds very well with gauge discharge data (CC 0.7–0.8). There are ongoing efforts to assimilate this river discharge signal with other satellite data into hydrologic models for flood monitoring in ungauged basins [6,7]. These studies revealed that microwave sensors can be used to evaluate distributed hydrological models for predicting floods in ungauged basins. The attractive feature of this approach is that it can reduce the dependency on gauged runoff and precipitation data to calibrate hydrologic models. Moreover, models are typically calibrated at point locations in the watershed; in contrast, the geo-spatio-temporal passive microwave data allows monitoring of the watershed at every pixel throughout the river reach.
(3)
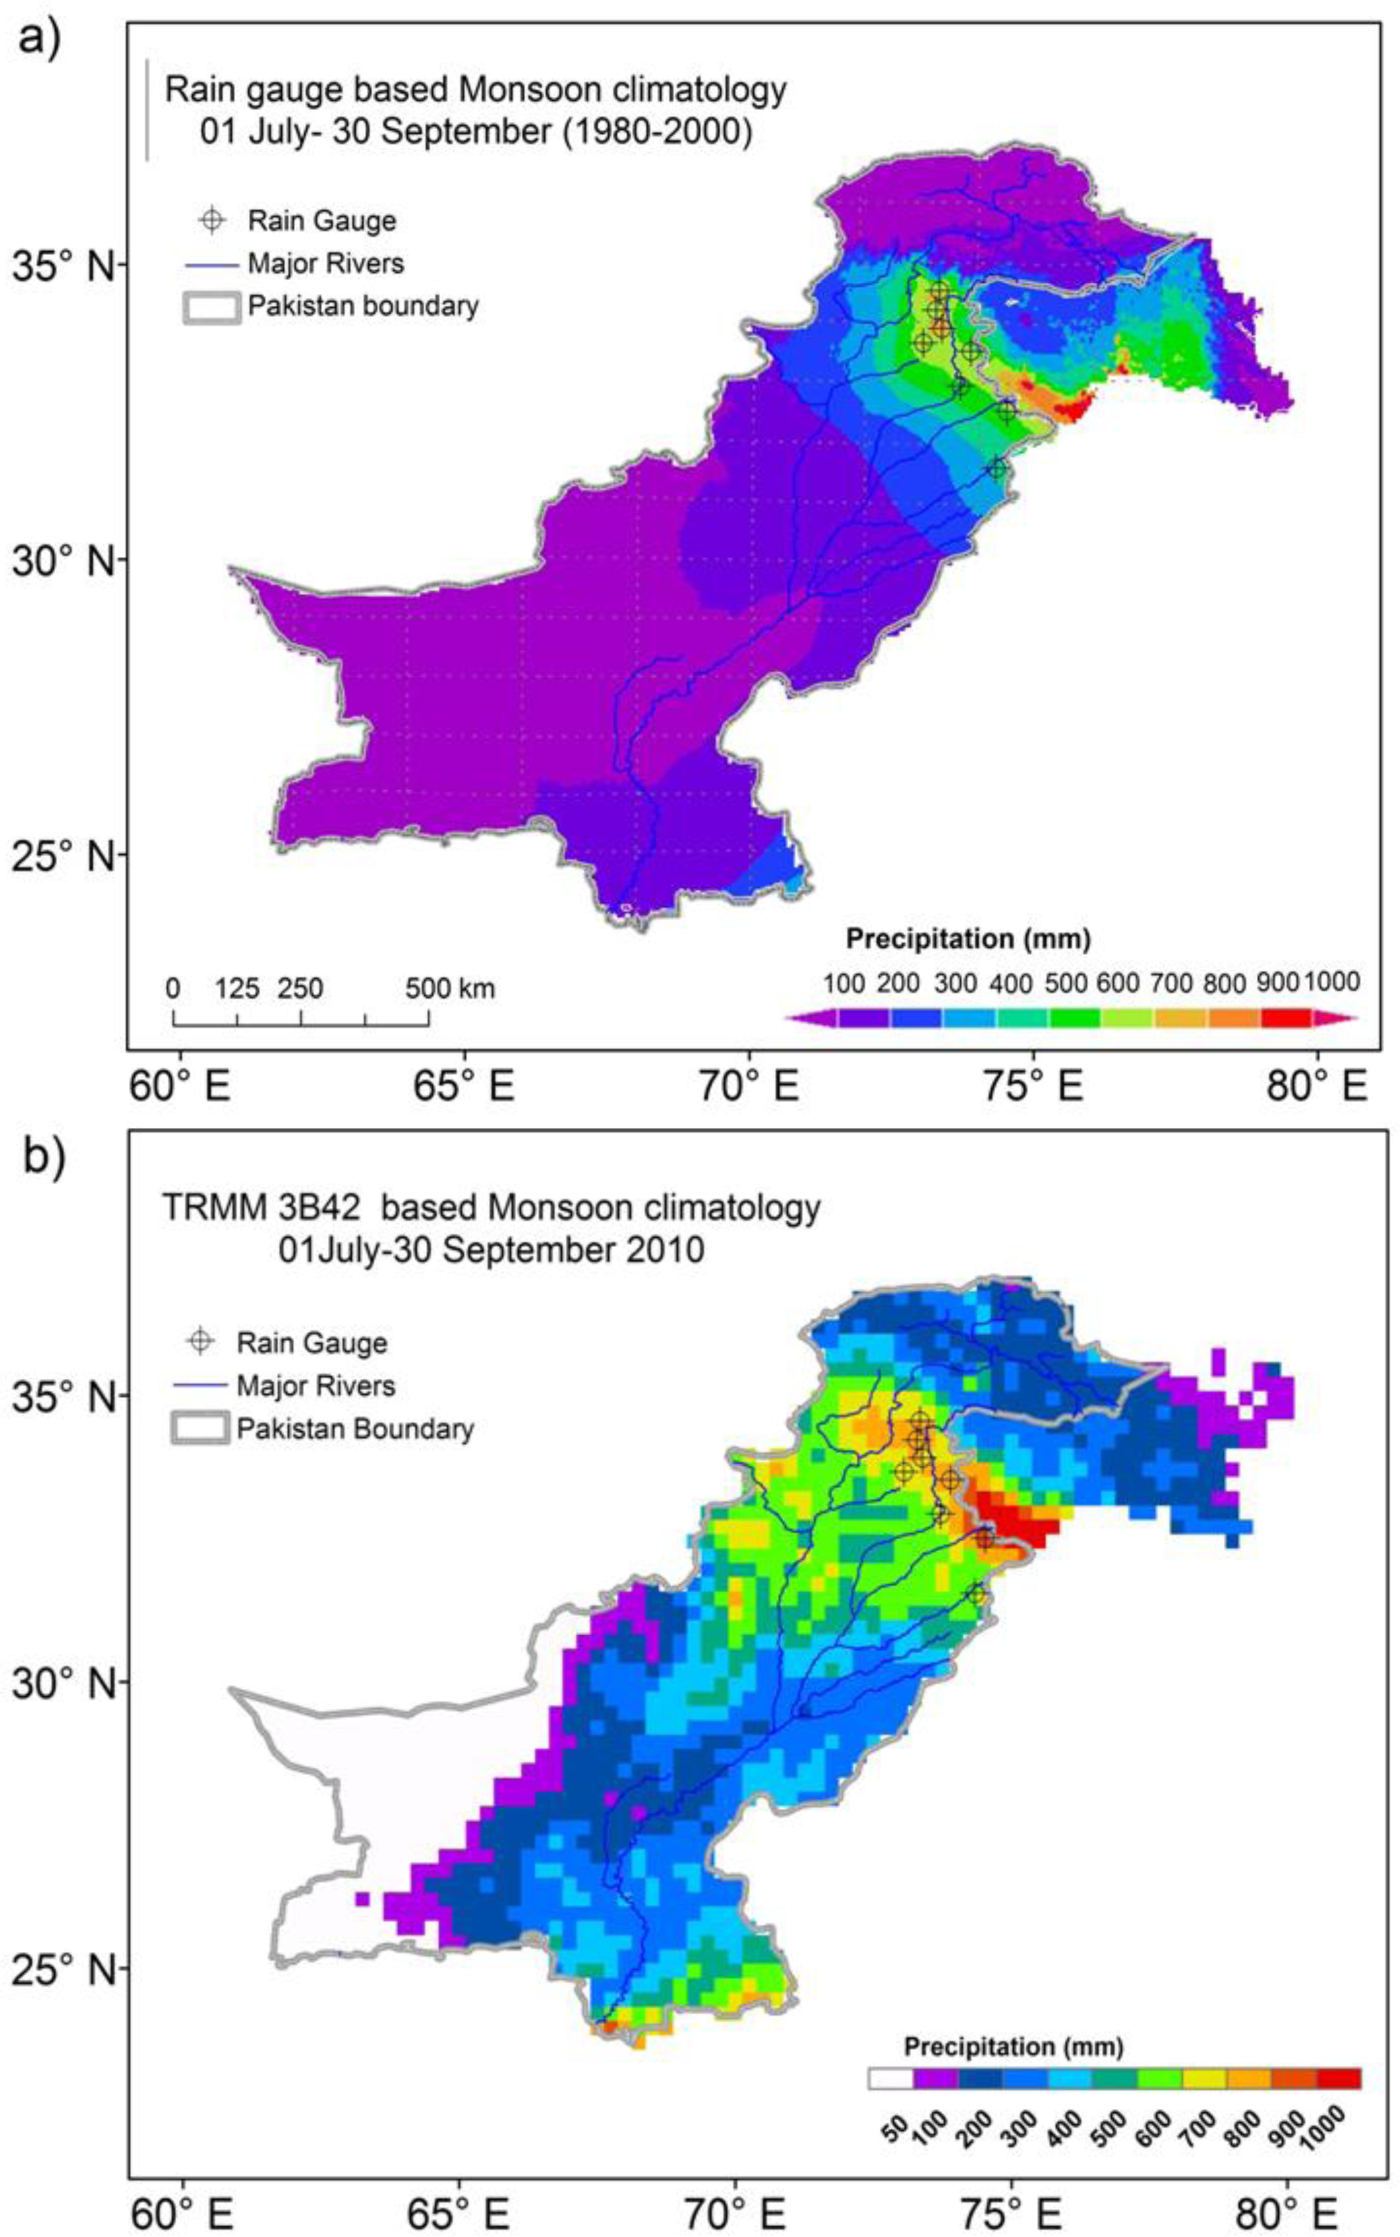
Remote sensing precipitation estimates are uniquely suited to provide timely and uniform information during the monsoon season that are needed to evaluate flood hazards triggered by intense precipitation over upper Indus basin. The 2010 Monsoon that occurred over the northeastern region of the Indus river basin is captured by the TMPA’s latest version products. The overall precipitation pattern and intensity during the monsoon season was captured by the latest satellite precipitation estimates. It is anticipated that the planned successor mission to TRMM, the Global Precipitation Mission (GPM) is designed to improve measurement of light rainfall, and snowfall through improved radiometric capacities.
(4)
The study has further demonstrated that the capability to detect ongoing flooding situations in its upper reaches can be valuable for spatially distributed flood monitoring and even prediction in the lower reaches of the Indus river basin. This is particularly practical and imperative in providing major improvements to river flow forecasts downstream in Pakistan, a region with limited availability of ground based rain gauges and river discharge measurements.
It is concluded that remote-sensing data integrated from multispectral and microwave sensors can be used to supplement stream gauges in sparsely gauged basins to detect floods. The skill of MODIS and ASAR to detect flood vs. non-flood, AMSR-E to detect water surface signals, and TRMM precipitation product to capture monsoon variability shows practical applications for large river basins. Given the global availability of estimates from instruments and mission (MODIS, ASAR, TRMM) and future missions (GPM, SMAP, NPP, Sentinels, SWOT), this multi-sensor integration approach can be potentially expanded to improve flood monitoring and prediction in sparsely gauged basins throughout the world.

Acknowledgments

This research work was funded under the Pakistan-US Science and Technology Cooperation Program managed by the United States National Academy of Sciences. The authors would like to acknowledge Climate Data Processing Centre of Pakistan Meteorological Department for providing rainfall data. TMPA data used in this study were acquired using the GES-DISC Interactive Online Visualization and analysis Infrastructure (Giovanni) as part of the NASA’s Goddard Earth Sciences (GES) Data and Information Services Center (DISC). We also thank the United Nations Institute for Training and Research/Operational Satellite Applications Programme (UNITAR/UNOSAT) team for providing the Advanced Synthetic Aperture Radar (ASAR) data. The authors are very grateful for the insightful and detailed comments offered by the four anonymous reviewers.

Author Contributions

Sadiq I. Khan and Yang Hong developed the research framework. As first author, Sadiq I. Khan analyzed the data, outlined the finding in graphical form, and wrote the manuscript. Jonathan J. Gourley contributed in written some portions of the manuscript and helped in editing it. Umar Khattak and Tom De Groeve contributed in in-situ and satellite remote sensing data acquisition and interpretation.

Conflicts of Interest

The authors declare no conflict of interest.

References

  1. Pelling, M.; Maskrev, A.; Ruiz, P.; Hall, L. Reducing Disaster Risk: A Challenge for Development. In UNDP Global Report; United Nations Development Program: New York, NY, USA, 2004. [Google Scholar]
  2. Brakenridge, G.R.; Nghiem, S.V.; Anderson, E.; Mic, R. Orbital microwave measurement of river discharge and ice status. Water Resour. Res 2007, 43. [Google Scholar] [CrossRef]
  3. Schumann, G.; Bates, P.; Horritt, M.; Matgen, P.; Pappenberger, F. Progress in integration of remote sensing-derived flood extent and stage data and hydraulic models. Rev. Geophys 2009, 47. [Google Scholar] [CrossRef]
  4. Hirpa, F.A.; Hopson, T.M.; de Groeve, T.; Brakenridge, G.R.; Gebremichael, M.; Restrepo, P.J. Upstream satellite remote sensing for river discharge forecasting: Application to major rivers in south Asia. Remote Sens. Environ 2013, 131, 140–151. [Google Scholar]
  5. Zhang, Y.; Hong, Y.; Wang, X.; Gourley, J.J.; Gao, J.; Vergara, H.J.; Yong, B. Assimilation of passive microwave streamflow signals for improving flood forecasting: A first study in Cubango river basin, Africa. IEEE J. Sel. Top. Appl. Earth Observ. Remote Sens 2013, 6, 2375–2390. [Google Scholar]
  6. Khan, S.I.; Hong, Y.; Vergara, H.J.; Gourley, J.J.; Brakenridge, G.; de Groeve, T.; Flamig, Z.L.; Policelli, F.; Yong, B. Microwave satellite data for hydrologic modeling in ungauged basins. IEEE Geosci. Remote Sens. Lett 2012, 9, 663–667. [Google Scholar]
  7. Robert Brakenridge, G.; Cohen, S.; Kettner, A.J.; de Groeve, T.; Nghiem, S.V.; Syvitski, J.P.M.; Fekete, B.M. Calibration of satellite measurements of river discharge using a global hydrology model. J. Hydrol 2012, 475, 123–136. [Google Scholar]
  8. Khan, S.I.; Hong, Y.; Wang, J.; Yilmaz, K.K.; Gourley, J.J.; Adler, R.F.; Brakenridge, G.R.; Policelli, F.; Habib, S.; Irwin, D. Satellite remote sensing and hydrologic modeling for flood inundation mapping in lake victoria basin: Implications for hydrologic prediction in ungauged basins. IEEE Trans. Geosci. Remote Sens 2011, 49, 85–95. [Google Scholar]
  9. Huang, C.; Chen, Y.; Wu, J. Mapping spatio-temporal flood inundation dynamics at large river basin scale using time-series flow data and modis imagery. Int. J. Appl. Earth Observ. Geoinf 2014, 26, 350–362. [Google Scholar]
  10. Blasco, F.; Bellan, M.F.; Chaudhury, M.U. Estimating the extent of floods in Bangladesh using spot data. Remote Sens. Environ 1992, 39, 167–178. [Google Scholar]
  11. Byun, Y. A texture-based fusion scheme to integrate high-resolution satellite SAR and optical images. Remote Sens. Lett 2014. [Google Scholar] [CrossRef]
  12. Li, P.; Xu, H.; Guo, J. Urban building damage detection from very high resolution imagery using OCSVM and spatial features. Int. J. Remote Sens 2010, 31, 3393–3409. [Google Scholar]
  13. Brakenridge, R. MODIS-Based Flood Detection, Mapping and Measurement: The Potential for Operational Hydrological Applications. In Transboundary Floods: Reducing Risks through Flood Management; Springer Verlag: Houten, The Netherlands, 2006; Volume 1, pp. 1–12. [Google Scholar]
  14. Jensen, J. Introductory Digital Image Processing: A Remote Sensing Perspective; Prentice Hall: Upper Saddle River, NJ, USA, 2005. [Google Scholar]
  15. Di Baldassarre, G.; Schumann, G.; Bates, P.D. A technique for the calibration of hydraulic models using uncertain satellite observations of flood extent. J. Hydrol 2009, 367, 276–282. [Google Scholar]
  16. Horritt, M.S.; Di Baldassarre, G.; Bates, P.D.; Brath, A. Comparing the performance of a 2-D finite element and a 2-D finite volume model of floodplain inundation using airborne SAR imagery. Hydrol. Process 2007, 21, 2745–2759. [Google Scholar]
  17. Schumann, G.; Hostache, R.; Puech, C.; Hoffmann, L.; Matgen, P.; Pappenberger, F.; Pfister, L. High-resolution 3-D flood information from radar imagery for flood hazard management. IEEE Trans. Geosci. Remote Sens 2007, 45, 1715–1725. [Google Scholar]
  18. Bartsch, A.; Doubkova, M.; Pathe, C.; Sabel, D.; Wagner, W.; Wolski, P. River Flow & Wetland Monitoring with Envisat ASAR Global Mode in the Okavango Basin and Delta. Proceedings of the Second IASTED African Conference Water Resource Management (AfricaWRM 2008), Gaborone, Botswana, 8–10 September 2008; pp. 8–10.
  19. Matgen, P.; Hostache, R.; Schumann, G.; Pfister, L.; Hoffmann, L.; Savenije, H.H.G. Towards an automated sar-based flood monitoring system: Lessons learned from two case studies. Phys. Chem. Earth Parts A/B/C 2011, 36, 241–252. [Google Scholar]
  20. Schumann, G.; di Baldassarre, G.; Bates, P.D. The utility of spaceborne radar to render flood inundation maps based on multialgorithm ensembles. IEEE Trans. Geosci. Remote Sens 2009, 47, 2801–2807. [Google Scholar]
  21. Gstaiger, V.; Huth, J.; Gebhardt, S.; Wehrmann, T.; Kuenzer, C. Multi-sensoral and automated derivation of inundated areas using TerraSAR-X and Envisat ASAR data. Int. J. Remote Sens 2012, 33, 7291–7304. [Google Scholar]
  22. Kuenzer, C.; Guo, H.; Huth, J.; Leinenkugel, P.; Li, X.; Dech, S. Flood mapping and flood dynamics of the Mekong delta: Envisat-ASAR-WSM based time series analyses. Remote Sens 2013, 5, 687–715. [Google Scholar]
  23. De Groeve, T. Flood monitoring and mapping using passive microwave remote sensing in Namibia. Geomat. Nat. Hazards Risk 2010, 1, 19–35. [Google Scholar]
  24. Kugler, Z.; de Groeve, T. The Global Flood Detection System; Office for Official Publications of the European Communities: Ispra, Italy, 2007. [Google Scholar]
  25. Behrangi, A.; Imam, B.; Hsu, K.; Sorooshian, S.; Bellerby, T.J.; Huffman, G.J. Refame: Rain estimation using forward-adjusted advection of microwave estimates. J. Hydrometeorol 2010, 11, 1305–1321. [Google Scholar]
  26. Hsu, K.-L.; Gao, X.; Sorooshian, S.; Gupta, H.V. Precipitation estimation from remotely sensed information using artificial neural networks. J. Appl. Meteorol 1997, 36, 1176–1190. [Google Scholar]
  27. Huffman, G.J.; Bolvin, D.T.; Nelkin, E.J.; Wolff, D.B.; Adler, R.F.; Gu, G.; Hong, Y.; Bowman, K.P.; Stocker, E.F. The TRMM Multisatellite Precipitation Analysis (TMPA): Quasi-global, multiyear, combined-sensor precipitation estimates at fine scales. J. Hydrometeorol 2007, 8, 38–55. [Google Scholar]
  28. Joyce, R.J.; Janowiak, J.E.; Arkin, P.A.; Xie, P. CMORPH: A method that produces global precipitation estimates from passive microwave and infrared data at high spatial and temporal resolution. J. Hydrometeorol 2004, 5, 487–503. [Google Scholar]
  29. Ushio, T.; Sasashige, K.; Kubota, T.; Shige, S.; Okamoto, K.I.; Aonashi, K.; Inoue, T.; Takahashi, N.; Iguchi, T.; Kachi, M. A Kalman filter approach to the Global Satellite Mapping of Precipitation (GSMaP) from combined passive microwave and infrared radiometric data. J. Meteorol. Soc. Jpn 2009, 87, 137–151. [Google Scholar]
  30. Khan, S.I.; Hong, Y.; Yong, B.; Gourley, J.J.; Khattak, U.K.; Vergara, H.J. Evaluation of three high-resolution satellite precipitation estimates: Potential for monsoon monitoring over Pakistan. Adv. Space Res 2013, in press. [Google Scholar]
Figure 1. (a) Moderate Resolution Imaging Spectroradiometer (MODIS) color composite (bands 7, 2, 1) for 10 August 2010; (b) Indus river flood extent delineated from the false color image.
Remotesensing 06 02393f1
Figure 2. (a) MODIS false color composite (bands 7, 2, 1) for 1 September 2010; (b) Lower Indus River and delta flood extent delineated from the Advanced Synthetic Aperture Radar (ASAR) image.
Remotesensing 06 02393f2
Figure 3. Advanced Microwave Scanning Radiometer (AMSR-E) based flood detection and flood hydrographs during the 2008–2011 period for discharge stations at Tarbela, Kalabagh and Chashma, Taunsa, Guddu, Sukkur and Kotri discharge gauge stations over the Indus River.
Remotesensing 06 02393f3
Figure 4. Precipitation climatology for Monsoon (JAS) using (a) daily rain gauge observations; (b) 2010 monsoon climatology using the latest TRMM 3B42V7 daily product.
Remotesensing 06 02393f4
Figure 5. Precipitation comparison of satellite with rain gauge observations for 2010 Monsoon season over (31–35°N latitude bands; (a) mean precipitation comparison between TRMM 3B42V7 and Rain gauge; (b) Bias (%); (c) Pearson’s correlation coefficient; (d) Root Mean Squared Error.
Remotesensing 06 02393f5aRemotesensing 06 02393f5b
Table 1. River discharge from the selected guage stations over Indus River basin for monsoon and pre-monsoon seasons based on the daily river flows.
Gauge StationLat.Long.Elevation (m)2008–2009 Discharge (m3/s)2010 Discharge (m3/s)Correlation b/t AMSR-E and Gauge Discharge

MonsoonPre-MonsoonMonsoonPre-Monsoon
Tarbela34.1272.7543052972410777315950.7
Kalabagh32.9271.5020059093331898925060.72
Chashma32.4371.391806329335410,02023770.7
Taunsa30.5070.8612056642861967719950.82
Guddu28.4169.71754838198711,47612940.84
Sukkur27.6969.71603222150610,48810170.88
Kotri25.4768.3122164432876061560.83

