Framework of Jitter Detection and Compensation for High Resolution Satellites


Abstract
: Attitude jitter is a common phenomenon in the application of high resolution satellites, which may result in large errors of geo-positioning and mapping accuracy. Therefore, it is critical to detect and compensate attitude jitter to explore the full geometric potential of high resolution satellites. In this paper, a framework of jitter detection and compensation for high resolution satellites is proposed and some preliminary investigation is performed. Three methods for jitter detection are presented as follows. (1) The first one is based on multispectral images using parallax between two different bands in the image; (2) The second is based on stereo images using rational polynomial coefficients (RPCs); (3) The third is based on panchromatic images employing orthorectification processing. Based on the calculated parallax maps, the frequency and amplitude of the detected jitter are obtained. Subsequently, two approaches for jitter compensation are conducted. (1) The first one is to conduct the compensation on image, which uses the derived parallax observations for resampling; (2) The second is to conduct the compensation on attitude data, which treats the influence of jitter on attitude as correction of charge-coupled device (CCD) viewing angles. Experiments with images from several satellites, such as ASTER (Advanced Spaceborne Thermal Emission and Reflection Radiaometer), LRO (Lunar Reconnaissance Orbiter) and ZY-3 (ZiYuan-3) demonstrate the promising performance and feasibility of the proposed framework.
1. Introduction
Over the past decade, high resolution satellite images obtained from linear array CCD sensor have been widely used in surveying and mapping. For the sake of accurate geo-positioning and co-registration, good geometric performance is crucial for the processing of satellite data [1–4]. According to [5–7], the accuracy of spacecraft position and attitude are two vital factors that affect geometric performance of high resolution satellites. The spacecraft position is determined by high-accuracy on-board global position system receiver and its accuracy can be enhanced with help of post-processing using accurate ephemeris if the device’s performance cannot meet the requirements or some malfunctions happen [8]. By contrast, the attitude of spacecraft is merely obtained from the star-tracker and gyro onboard and the performance of these devices make a dominant contribution to its accuracy. Consequently, accurate attitude estimation is a crucial issue for improving the accuracy of geo-positioning and mapping with high resolution satellites.
With respect to the satellite equipped with CCD linear array sensors, the attitude jitter, which refers to the instability and distortion of satellite attitude, could deteriorate geo-positioning and mapping accuracy of high resolution satellites in both plane and height. With the increasing complexity of satellite platforms and agility of satellite observation, most earth-observation satellites suffer from attitude jitter on the impact of various noise and disturbance torques, which are mainly caused by satellite dynamic structure, body thermal change, attitude control operation and other impacting factors [9]. However, for the majority of remote sensing satellite currently in use, their attitude information is estimated by interpolating the measurement data of star-tracker and gyros sampled at a relatively low frequency. When the frequency of satellite jitter is higher than the sampling rate of attitude data, the geometric processing of imagery would be affected by the undetected and uncompensated attitude distortions [3]. Moreover, the requirement of attitude stability will become more and more severe with increasing spatial resolution of remote-sensing missions. Therefore, it is necessary to estimate and correct the spacecraft attitude jitter information accurately with additional methods in order to improve the geometric performance of satellite images.
Generally, there are two traditional ways to detect and analyze spacecraft attitude jitter [9]. The first is to use ground control points (GCPs) in the scene [10,11], and the second is to use high-performance attitude sensors to obtain the attitude information with high time and angular resolutions [12]. However, those methods that depend on accurate GCPs or high-performance attitude sensors are economically and technically infeasible for many on-orbit satellites. For such reasons, a number of studies have been carried out to detect and analyze attitude jitter based on imagery, provided attitude data, RPCs and products such as digital elevation model (DEM) and orthoimages [3,13–20].
Some of the researchers have taken advantage of the property of the high resolution sensors to detect and retrieve the attitude instabilities. Iwasaki and Teshima used the parallax between the short-wave infrared (SWIR) sensors of ASTER to detect and estimate the frequency and amplitude of the fluctuation of Terra satellite [3]. In their studies, a fluctuation with a frequency of around 1.5 Hz is discovered. Kirk et al. used the parallax resulted from the adjacent CCD arrays of the focal plane to detect the jitter components of High Resolution Imaging Science Experiment (HiRISE) [13]. With the help of the software module hijitreg of ISIS 3.0 developed by USGS, the jitter components were generated from the HiRISE imagery and the accuracy of digital surface model (DSM) product was enhanced by compensating the jitter effect. Similarly, the parallax formed by a pair of narrow angle cameras onboard the LRO was utilized by Mattason et al. [14]. They succeeded in acquiring the frequency and amplitude of jitter. Furthermore, using the parallax formed by neighbouring multispectral sensors, Amberg et al. detected the attitude micro-vibration of PLEIADES-HR satellite without the help of additional devices [15].
In addition, some jitter analysis methods, which consider the provided attitude data, RPCs and digital products, have been proposed. Li et al. evaluated HiRISE jitter effects by differencing the SPICE kernel (telemetry) EO parameters and EO parameters calculated from third-order polynomials. In their study, attitude jitter was compensated by introducing three high-frequency terms in the polynomials which were used in the bundle adjustment (BA) model [16]. Schneider et al. found the periodic residuals on ALOS-PRISM images when generating RPCs to replace the rigorous sensor model [17]. The reason is that the inherent defects of RPCs could not inherit validly high-order distortions from the satellite attitude [21]. Schwind et al. constructed the satellite attitude by attaching sinusoidal disturbance in the geometric simulator for the hyperspectral satellite Environmental Mapping and Analysis Program (EnMAP). They corrected the images geometrically with the rigorous sensor model [18]. Kirk and Mattson identified the problem of jitter of HiRISE and LRO through unexpected ripples on DTM products [13,14]. Ayoub et al. detected the attitude jitter of ASTER, QuickBird and HiRISE satellites by analyzing undulating pattern on parallax maps obtained from dense matching of two orthoimages, and thus eliminated these artifacts on orthoimages [19]. Nuth and Kääb proposed a co-registration method for elevation data and found jitter of ASTER through significant biases in DEM after 3D co-registration [20].
The objective of this paper is to develop a framework of satellite attitude jitter detection and compensation for high resolution satellites, and to illustrate a preliminary investigation on jitter detection and compensation methods using various high resolution satellite images which are acquired from linear array CCD sensors. The contribution of this study lies in the following: (1) A comprehensive investigation of jitter detection and compensation methods with respect to different types of data and processing modes are presented; (2) An initial study on jitter detection and compensation of China ZY-3 satellite is performed, and the results of attitude jitter for ZY-3 is reported for the first time.
2. Framework
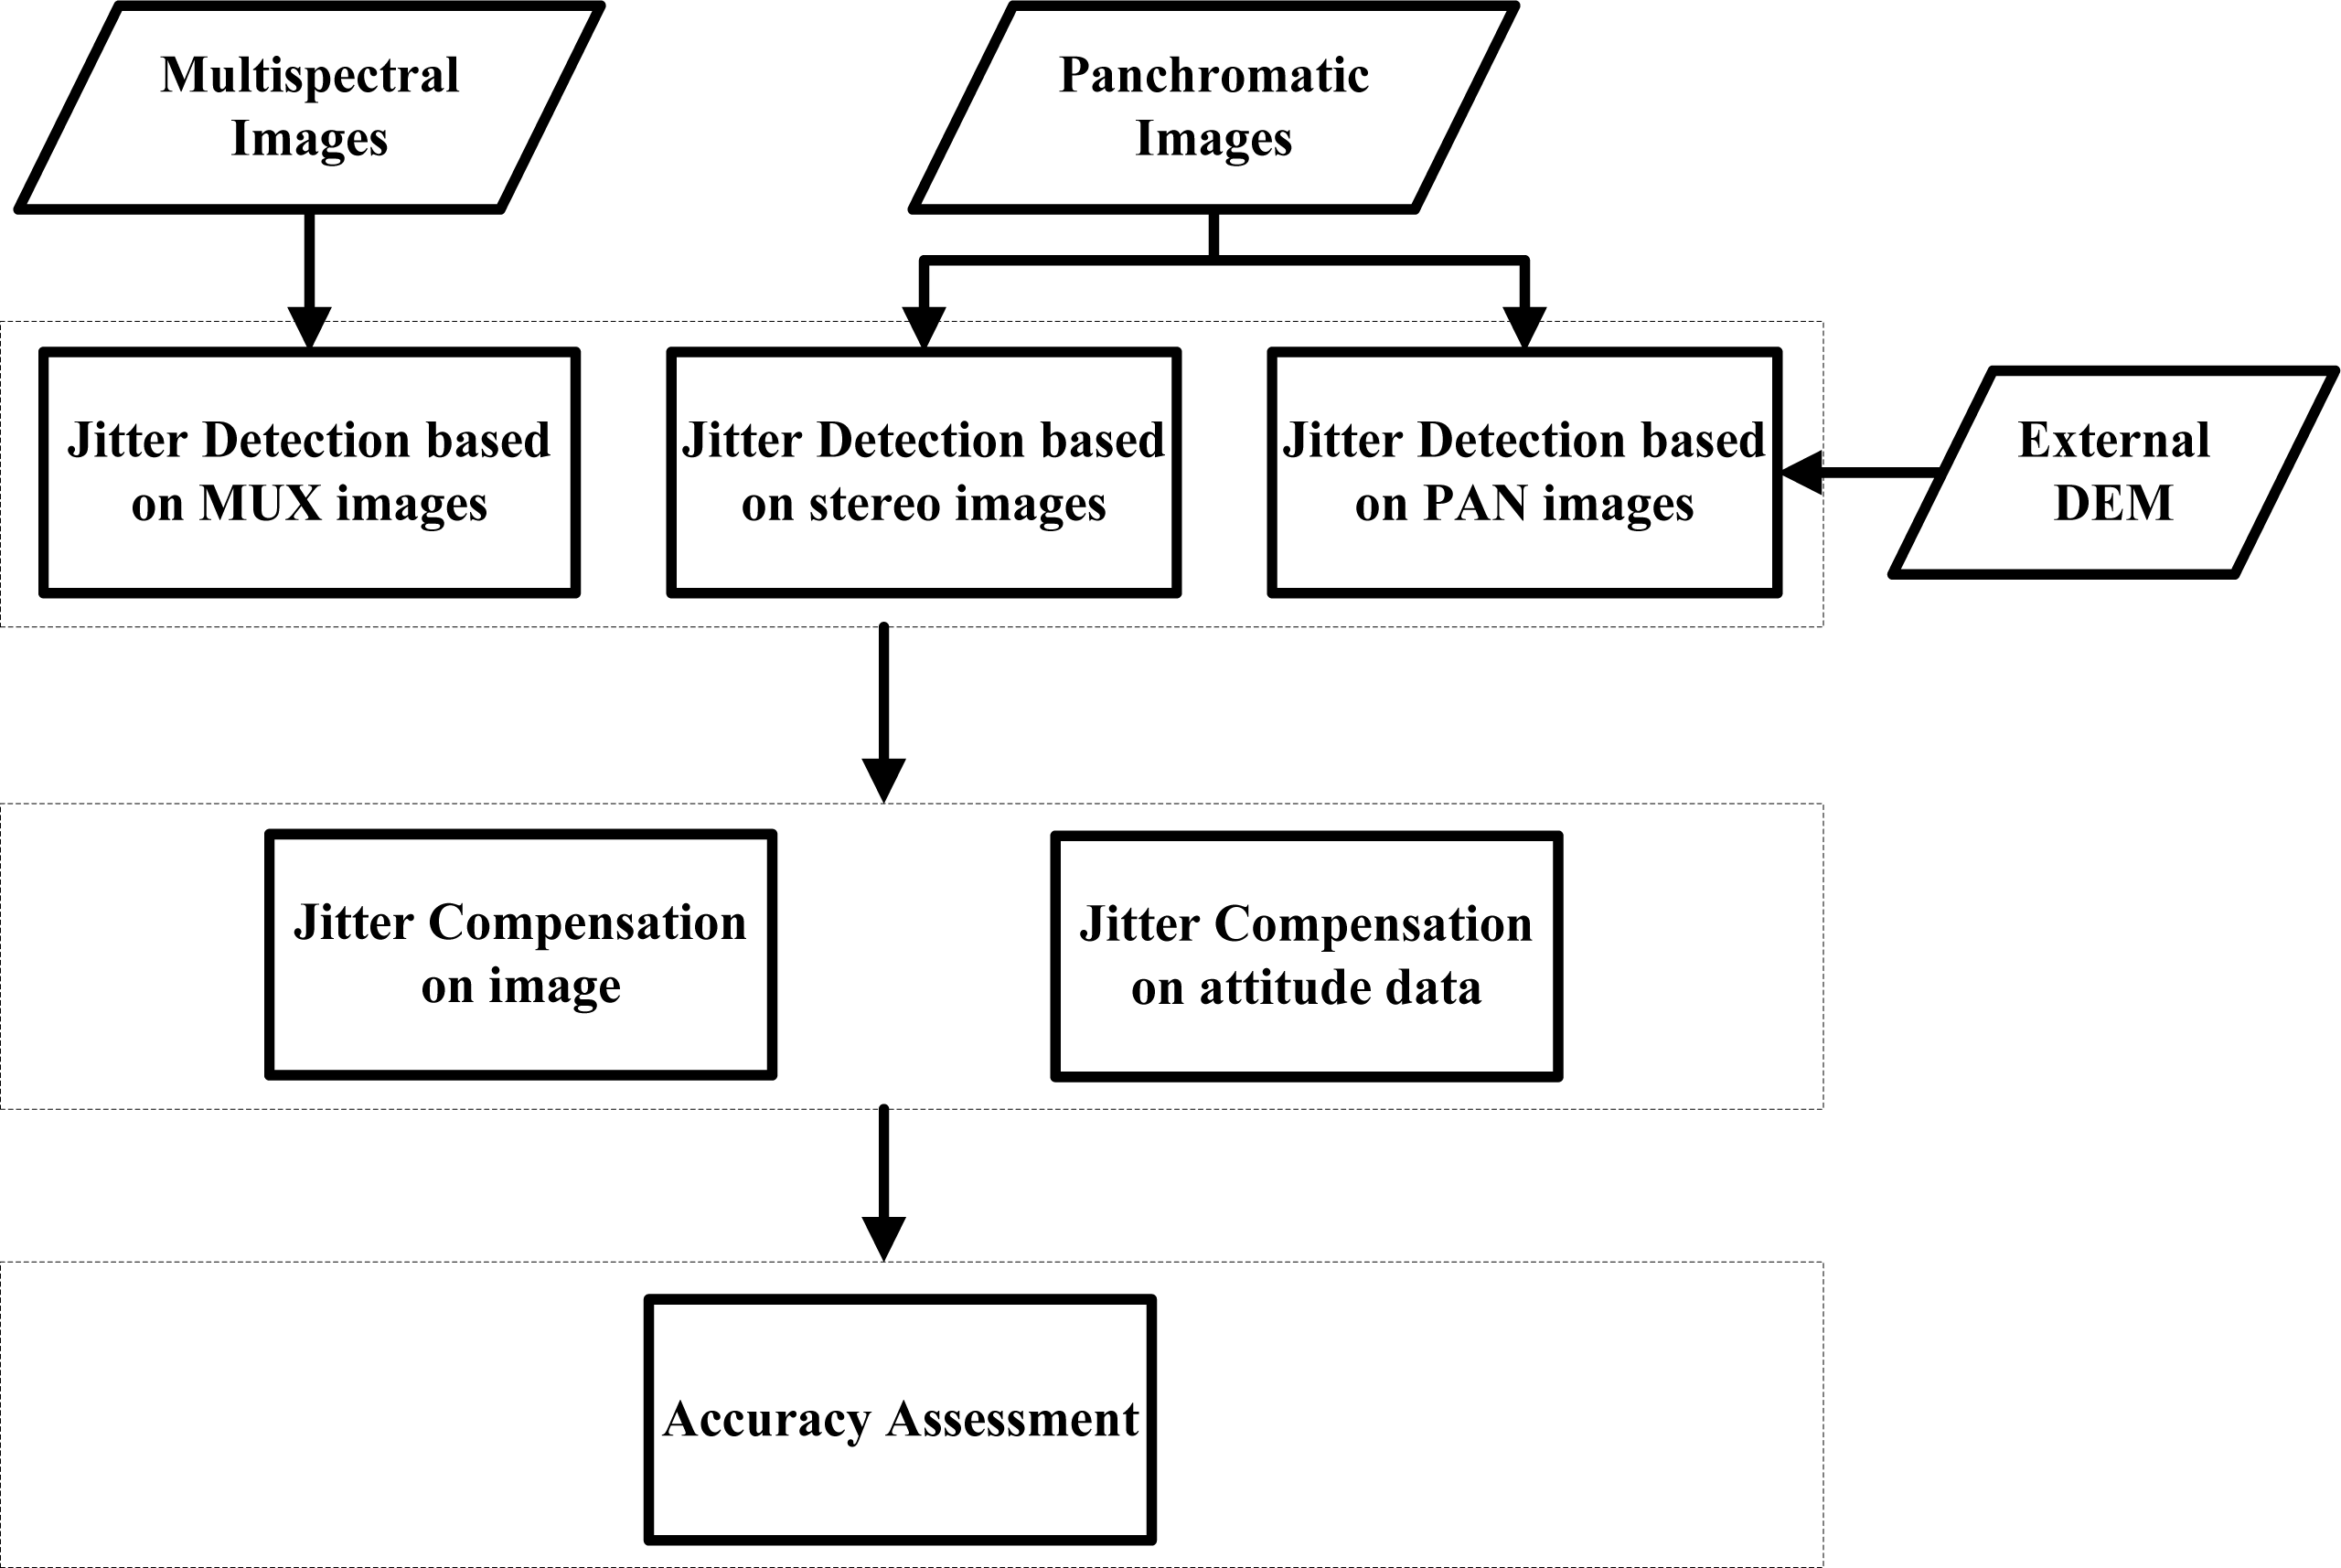
The proposed framework for attitude jitter detection and compensation includes three main components, which is depicted in Figure 1.
2.1. Jitter Detection
With respect to the different types of sensors used in the satellite, three methods for jitter detection are investigated. (1) The first one is based on multispectral (MUX) images using parallax between two different bands in the image; (2) The second is based on stereo images using rational polynomial coefficients (RPCs); (3) The third is based on panchromatic (PAN) images employing orthorectification processing. All these three methods make use of satellite images acquired from linear array CCD sensors, which will be described in the following sections.
2.1.1. Jitter Detection Based on Multispectral Images
The idea of jitter detection based on multispectral images is to utilize the small parallax formed by the multispectral sensors with a short interval of observation time. This kind of observation system is often called the parallax observation system [9].
In the parallax observation system, each linear sensor scans the identical ground feature at different times. In other words, there exists a time difference between the observation moments of each linear sensor’s scanning in along-track direction. In an overlapping area of the two images obtained from a linear sensor system with parallax observation, an object is supposed to be imaged at the exact same location in the two images but at different times [14]. However, during the interval of observation time, some exterior orientation elements of the camera used in the observation system might have some small changes due to attitude jitter, and thus the same ground object might be imaged at slightly different locations on the two images. As a result, if we match a specific ground target between the two images, the matching result of the overlapping area between the two images would be affected by attitude fluctuation of the satellite [9].
Therefore, the parallax disparity φ(t) of each pixel in both along-track and cross-track directions can be measured based on the overlapping area between the two images. This relationship is described as follows:
In the case that there is no influence of jitter displacement, the attitude change of the satellite is supposed to be smooth, and the parallax interval between the two sensors is fixed and associated with the arrangement of focal plane. As a result, the measured value of parallax disparity φ(t) should be a constant one. However, if the satellite attitude information contains jitter components, the offsets φ(0 < t < t0) during the entire time series of image observation would show some obvious periodic characteristics or witness a periodical trend in both along-track and cross-track directions.
With respect to the differential value of jitter displacement f(t), the frequency and amplitude of φ(t) are different accordingly. The frequency of f(t) is equal to that of φ(t) based on the principle of synchronous vibration, and the frequency of φ(t) can be obtained using spectral analysis. To retrieve the amplitude of f(t), we first calculate the phase difference caused by Δt, and then revise the amplitude of φ(t) with the phase difference so that the amplitude of f(t) can be acquired.
Therefore, the detection method based on multispectral images consists of three essential steps as follows:
- (1)
Co-registration of multispectral images from different bands. The original image pairs are mutually registered in order to remove the entire shift between the two images. This kind of shift results from the arrangement of focal plane.
- (2)
Dense matching of registered image pairs based on subpixel phase correlation. In order to obtain the accurate parallax disparities, a dense matching strategy based on phase correlation using a peak evaluation formula (PEF) approach [22] is adopted. Phase correlation is more accurate and effective than the traditionally used area-based matching methods, such as normalized cross correlation [23]. It is based on the well-known Fourier shift property: a shift in the spatial coordinate frame results in a linear phase difference in the frequency domain of the Fourier Transforms [24]. Therefore, the pixel-level displacements between two images can be calculated from inverse Fourier transformed results of phase difference in Fourier space approximated by finding the peak position of the delta function [24]. The basic principle of PEF is to utilize a peak evaluation formula to directly estimate the peak location from the actual data array of the phase correlation function [22]. The closed-form expression of the phase correlation function is given by:
where α is the peak value which is normally assumed to be lower than 1 in practice, a and b represent the peak location and the displacement between two images, and i and j are the indices of pixel in matching template. According to [22], the displacements a and b can be estimated in one dimension independently when assuming that the parameters of the other dimension are fixed.where N represents the size of the matching template, and V is an odd integer satisfying 0 ≤ V ≤ N, which defines the size of weighing function. Equation (3) illustrates the one dimensional correlation peak model. The accurate displacements can be estimated by sampling the selected point values set in one dimension around the peak and applying the least square method [22].- (2)
Subsequently, correlation coefficients threshold of 0.7 is set in this stage to ensure that most of the mismatched points can be masked off. The parallax disparity is averaged at each scan line with removal of abnormal measurements that exceed the range of threefold standard deviation compared to the averaged value in each line.
- (3)
Acquisition of jitter displacement. A spectral analysis is conducted to acquire the frequency of the jitter. Afterwards, the amplitude is retrieved from the amplitude of the parallax disparity with the help of the phase difference caused by Δt in Fourier space [15].
2.1.2. Jitter Detection Based on Stereo Images
Owing to the long time interval between the stereo images and different pointing views, the parallaxes disparities cannot be measured directly between the stereo images. Thus, we proposed a new method to detect the jitter displacement in the cross-track direction using stereo images.
The method of jitter detection based on stereo images includes two main steps as follows:
- (1)
Image matching based on geometrically constrained cross-correlation and least squares matching. The grid points with 100 pixels space are selected as the reference points on nadir image. The corresponding conjugate points on forward and backward images are matched based on geometrically constrained cross-correlation (GC3) [25]. Then, the least squares matching (LSM) [26] is performed to refine conjugate points (CPs) to subpixel accuracy (about 0.2 pixel accuracy). The mismatching points are eliminated with the threshold of the correlation coefficients (for instance, 0.7 in this study).
- (2)
Relative orientation and back-projection. Relative orientation is firstly conducted to minimize the relative geometric inconsistencies among the image triplet. Afterward, two photogrammetric stereo models with CPs are defined, which are ND-FW (nadir and forward) and ND-BW (nadir and backward) images. Two sets of object coordinates are then calculated from the two stereo models with RPCs respectively, and they are back-projected to the nadir image. The RPCs model can be expressed as [27]:
where (S, L) denote the normalized image sample and line coordinates of the CPs, Pi(i = 1, 2, 3, 4) are the polynomial coefficients, and (X, Y, Z) are the normalized ground coordinates.
The CPs in the nadir image are considered as the reference points to show the distortions in the nadir image. Therefore, the back-projection residuals are defined as the differences between the coordinates of the back-projected image points and those of the reference points in the nadir image. Because of the influence of attitude jitter, these back-projection residuals show obvious periodic patterns.
2.1.3. Jitter Detection Based on Panchromatic Images
Similarly, the impact of satellite jitter is significant on panchromatic sensors. Most panchromatic sensors are installed on a satellite but their imaging occurs on different planes. Therefore, it is more difficult to achieve the parallax observation from panchromatic images than that from multispectral images. As a result, the detection method based on panchromatic images adopts the process of orthorectification.
The proposed method can be divided into three steps as follows:
- (1)
Orthorectification of panchromatic images. In order to achieve parallax observation of panchromatic images and to reflect satellite jitter information, the panchromatic images are first orthorectified through vendor-provided RPCs [27] using external DEM as elevation reference.
- (2)
Coarse-to-fine dense matching of orthoimages based on phase correlation. After the orthorectification, the orthoimages are co-registered and georeferenced in a common ground reference system. Furthermore, the orthoimages are resampled on equivalent ground sampling distance (GSD), and the process of dense matching is further implemented. For purpose of accurate parallax disparities, a coarse-to-fine matching strategy using Fourier-based phase correlation method is adopted to determine pixel-to-pixel subpixel shifts. In the matching strategy, pixel-level phase correlation algorithm [28] with a larger matching window is initially implemented to get integer pixel shift value as the coarse matching result. Because phase correlation can only measure the maximum displacement constrained to half of matching window, the coarse matching step with larger matching windows can enhance the robustness of the dense matching operation considering errors along with the orthorectification process. Moreover, the coarse matching step would not cost too much time due to computational efficiency of pixel-level phase correlation algorithm. A precise step using subpixel phase correlation algorithm [22] described in Section 2.1.1 is subsequently carried out on each pixel after image translation. Finally, two parallax maps are generated in East-West (E-W) and North-South (N-S) directions, with which jitter information can be detected.
- (3)
Outlier removal and Jitter analysis. The above-mentioned dense matching method generates parallax maps in ground E-W and N-S directions. However, satellite jitter information in cross-track and along-track directions are needed. There exists an angle between these two directions which can be computed according to the four corner projected coordinates of each panchromatic image. After rotating parallax maps using the computed angle, we can derive satellite jitter information in cross-track and along-track directions which keep pace with the detection method based on multispectral imagery. False matches and decorrelation areas need to be removed from the parallax maps before characteristic analysis. Two criterions, which include large unphysical measurements and large deviations from the averaged value at each scan line, are considered to eliminate unreliable disparity points. At last, the resulting parallax maps operated by the above processes are employed to compute the frequency and amplitude of jitter using Fourier spectral analysis.
2.2. Jitter Compensation
Jitter compensation is carried out following the process of jitter detection. In this section, jitter compensations on both image and attitude data are considered.
2.2.1. Jitter Compensation on Image
The influence of jitter reflected on the image plane can be divided into two directions. Therefore, the corresponding parallax observations in the along-track and cross-track directions, which are obtained using the above-discussed process of jitter detection, are used to correct parallax disparities caused by jitter to achieve the purpose of compensation on image. The compensation method on images contains the following two essential steps.
- (1)
Resampling. In this step, in order to eliminate the unexpected parallax disparities, the cubic convolution interpolation method, which approximates to ideal sinc interpolation, is adopted to resample the image that needs to be compensated, and then to derive the compensated image using parallax observations. The cubic convolution formula S(x) is expressed by:
where x represents the pixel coordinates.- (2)
Validation. The process of jitter detection is conducted again on the compensated image. The averaged parallax disparities at each scan line derived from redetection process are used to assess the performance of jitter compensation on image.
2.2.2. Jitter Compensation on Attitude Data
Similar to Schwind’s opinion [18], the jitter displacement is modeled by cumulative cosine functions as follows:
The influence of jitter on satellite attitude can be treated as corrections of CCD viewing angles, which is described as follows:
2.3. Accuracy Assessment
In order to assess the effect of jitter compensation, the jitter model presented in Equation (6) is introduced into the geometric sensor model. The performance of the combination model of the sensor model and jitter model is assessed in direct georeferencing. The purpose of direct georeferencing is to estimate the ground coordinates of the homologous points measured in the images through a forward intersection. Therefore, the computed coordinates on GCPs with and without the jitter model are compared with the measured ground coordinates to estimate the effect on geo-positioning accuracy of jitter compensation.
3. Results and Analysis
3.1. Results of Experiment on ASTER and LRO Data
Experiments using ASTER and LRO imageries were conducted to investigate jitter detection method based on multispectral images.
3.1.1. Results of Experiment on ASTER-L1A Data
ASTER instrument is an imaging camera mounted on the Terra satellite, which was launched on December 1999 as part of NASA’s Earth Observing System (EOS). The ASTER instrument has a wide spectral region of 14 bands, ranging from the visible spectrum to the thermal infrared spectrum with high spatial, spectral and radiometric resolution. The spatial resolution varies with wavelength: 15 m in the visible and near-infrared (VNIR), 30 m in the SWIR, and 90 m in the thermal infrared (TIR) [30].
The SWIR images are acquired by a push-broom sensor system that contains six adjacent linear array sensors. These adjacent linear array sensors are arranged in parallel on the focal plane. The time interval between the adjacent linear array sensors during push-brooming is 356.238 ms along the flight direction [31]. Parallax exists with images of the same ground object which is imaged by the neighboring band sensors. Therefore, the image parallax of the neighboring bands can be used to detect the attitude jitter. As shown in Figure 2, we chose band 5, band 6 and band 7 images as the test ones in this study. The linear array sensor of band 5 is arranged adjacent to those of band 6 and band 7. In addition, band 7 and band 6 are arranged at the two ends of the focal plane separately, thus the two pairs of images have different parallax intervals. Furthermore, the spectral wavelengths of those three bands are similar in that they are very conducive to correlation. The experimental dataset is provided by the online Data Pool at the NASA Land Processes Distributed Active Archive Center (LP DAAC), USGS/Earth Resources Observation and Science (EROS) Center, Sioux Falls, South Dakota [32]. The study area is in Songshan district of Henan province in China. The level of data used is ASTER-L1A, which is formally reconstructed and unprocessed [31]. Therefore, the images maintain their original geometric characteristics and are free from the influence of map project and geometric corrections. The parallax maps and averaged parallax disparities at each scan line are shown in Figures 3 and 4.
From the results in Figure 3, we can see that these parallax maps show apparent dark and light periodic stripes in both cross-track and along-track directions. Those periodic stripes demonstrate the jitter motion of sensor arrays [3,9]. Interestingly, although the periodic stripes can be seen in both cross-track and along-track directions, the values of parallax in the cross-track direction are more striking than those in the along-track. The reason for such a phenomenon can be explained by the fact that the jitter components in the along-track direction are so small that they can hardly be identified through the adopted matching method. In addition, the topographic information contributes to the error in the along-track direction [33,34], with a tiny parallax between CCD arrays forming a tiny stereo vision.
3.1.2. Results of Experiment on LROC-NAC Data
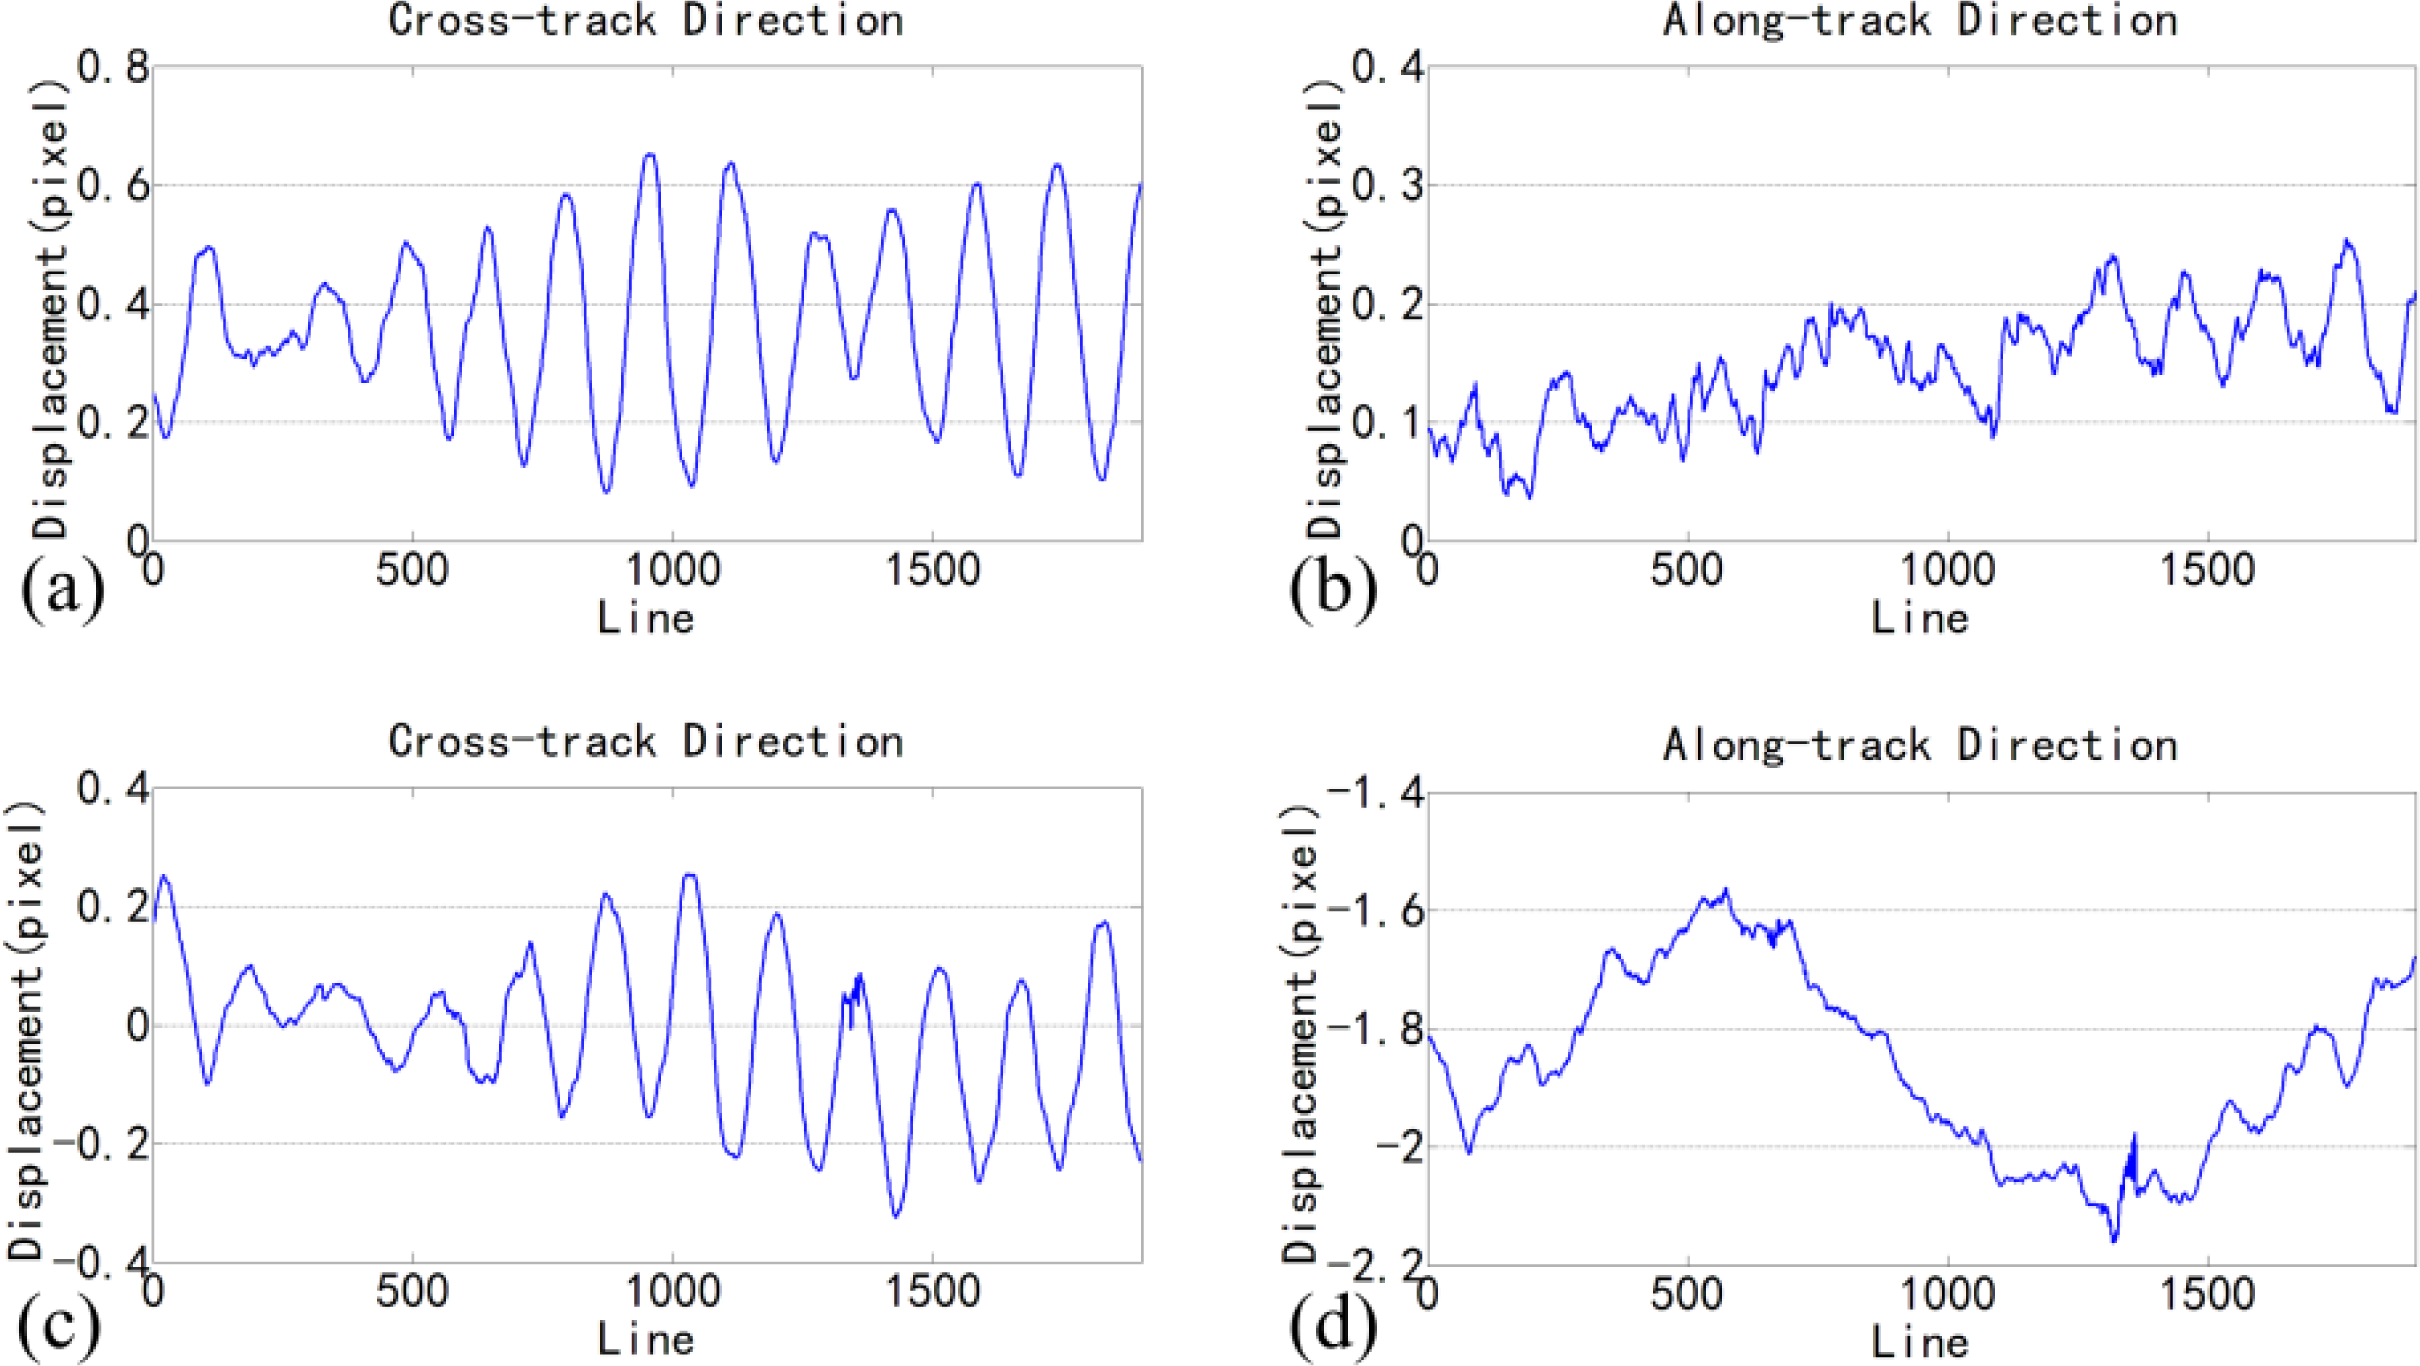
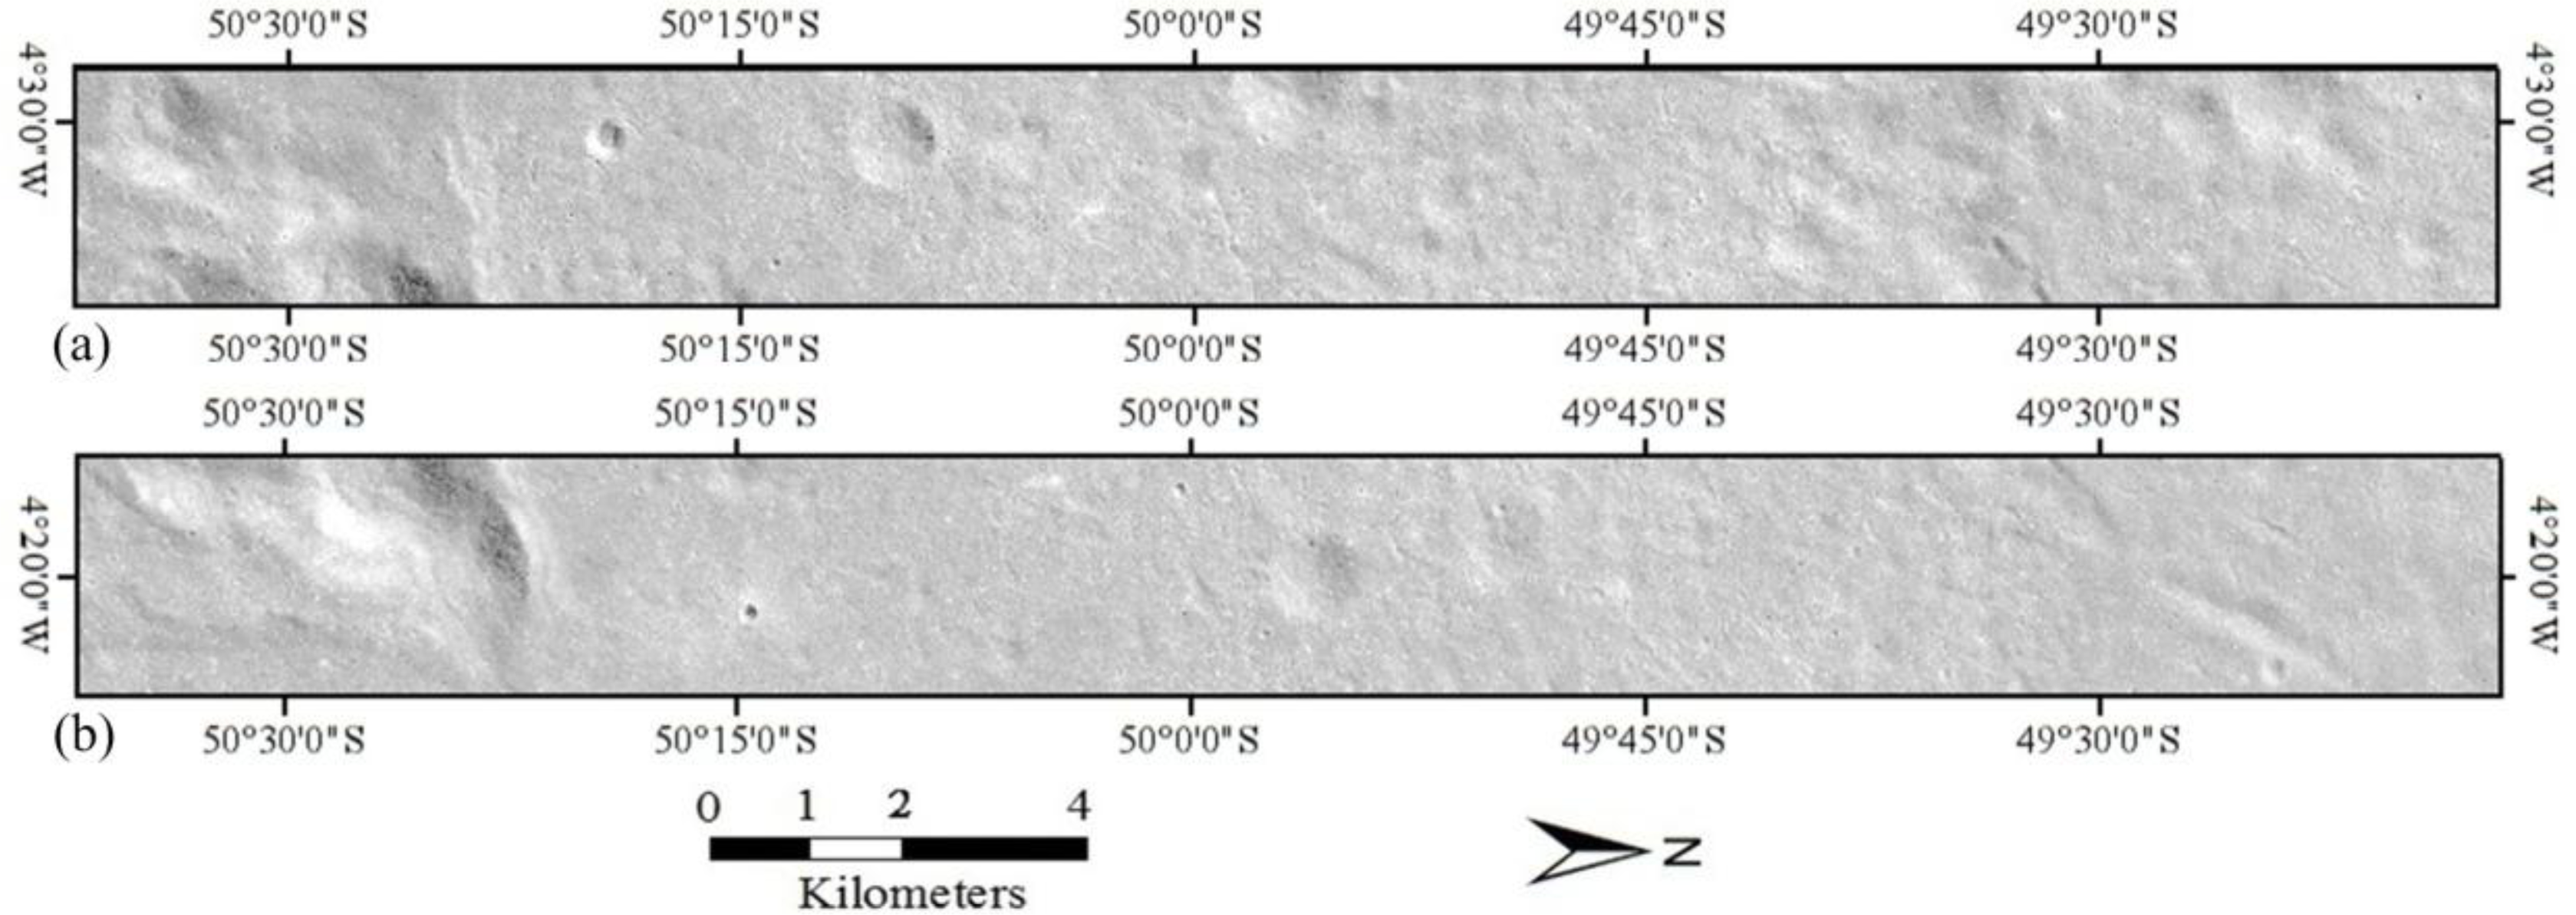
LRO was launched on 18 June 2009 from the Cape Canaveral. The Lunar Reconnaissance Orbiter Camera Narrow Angle Camera (LROC-NAC) is a pair of high resolution push-broom cameras on board the LRO. The two NAC cameras, named NAC-Left (NAC-L) and NAC-Right (NAC-R), are designed to provide 0.5 m scale panchromatic images over a combined 5-km swath. The LOS of NAC-L is arranged with an about 2.85° offset from the NAC-R in the cross-track direction. That means the angle from the LOS of NACs provides two images with an overlap of about 68–136 pixels width. Moreover, the NAC-R is mounted 0.106° forward of the NAC-L, which leads to a parallax interval of about 67–127 lines between NAC-R and NAC-L during the imaging process [35]. The experimental dataset is obtained from the online Data Access offered by NASA LROC team and Arizona State University [36]. Figure 5 shows the test NACs images of LRO used in the experiment. Slight parallax between NACs can be utilized to detect the attitude jitter of LRO. The results of the averaged parallax disparities in both directions at each scan line are shown in Figure 6.
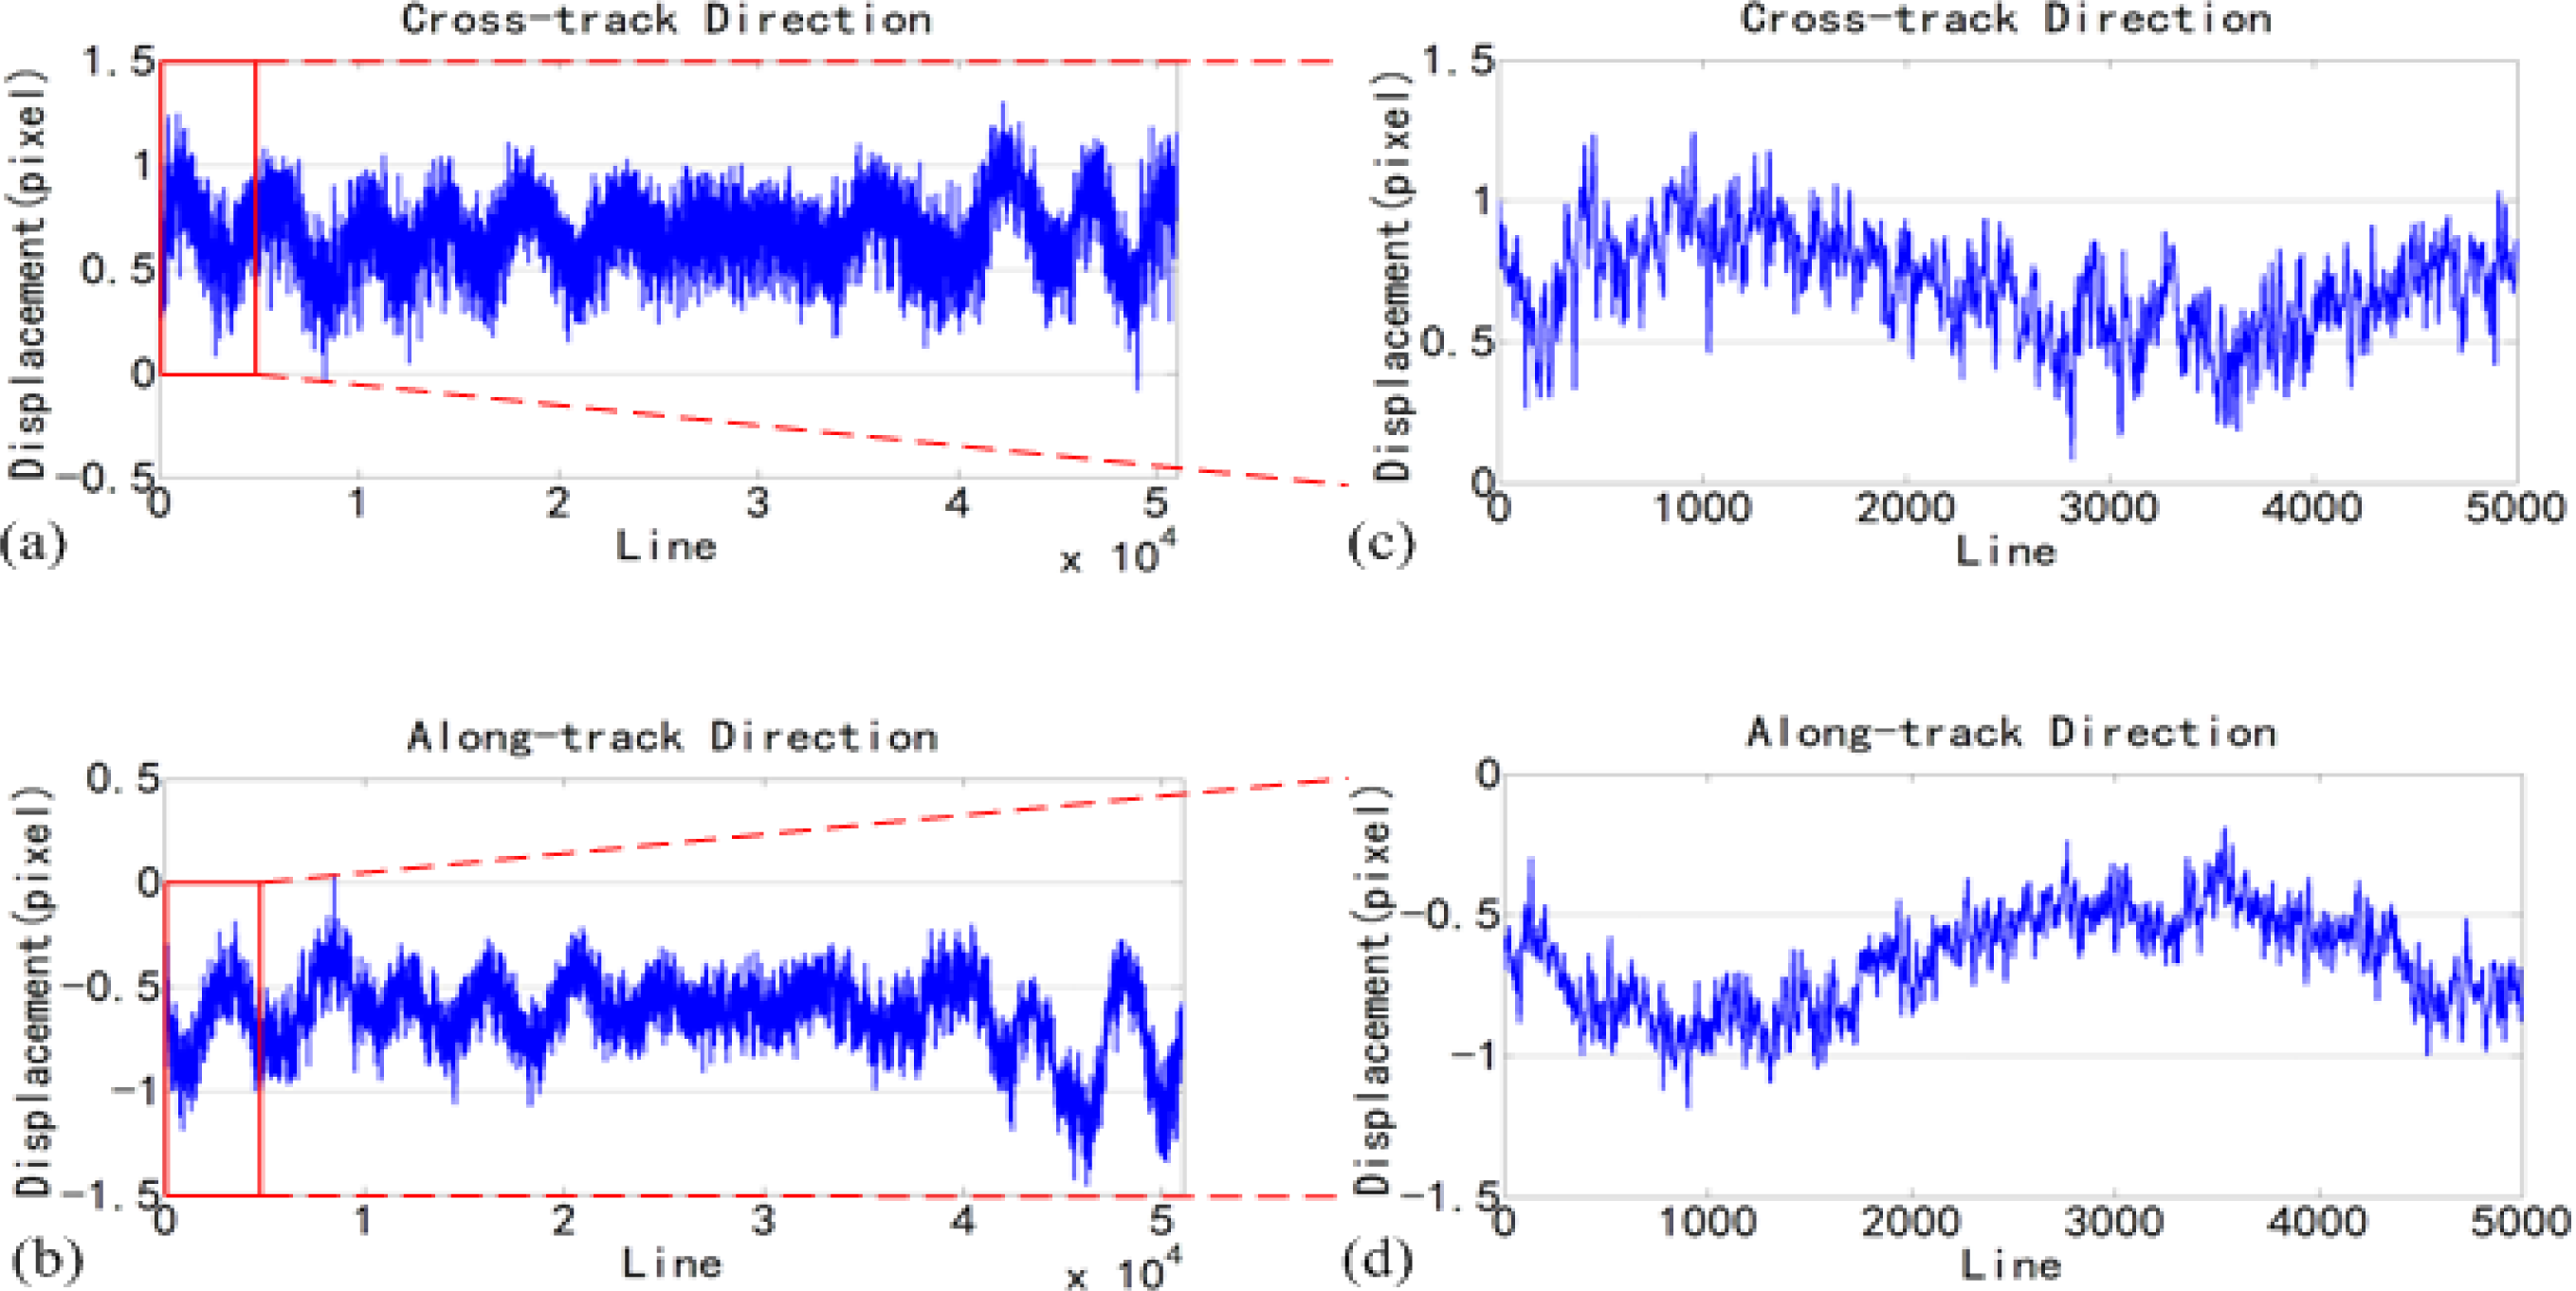
The detection results presented in Figure 6 show that the averaged parallax disparities demonstrate a significant periodic trend in both cross-track and along-track directions, which reflects the jitter motion of the satellite platform. Compared with that of ASTER satellite, the jitter motion of LRO is more likely to be the mixture of a variety of jitter components, which can be decomposed into some high frequency values and low ones through spectral analysis.
3.2. Result of Experiment on ZY-3 Data
The overall performance of our proposed framework of jitter detection and compensation, including three jitter detection methods and two jitter compensation methods, were demonstrated in experiments using ZY-3 data.
ZY-3 is the first civilian high resolution three-line-array stereo mapping satellite in China, which was launched on January 9, 2012. ZY-3 carries three high resolution panchromatic cameras which the GSD of the nadir image is about 2.1 m, and the forward and backward images are both about 3.5 m and a multispectral camera with a GSD of 5.8 m operated in four spectral bands. Each camera consists of a telescope and several CCD arrays. The forward and backward cameras are tilted 22° and −22° from the nadir camera, forming a large base-to-height (B/H) ratio of about 0.8 [37].
3.2.1. Results of Experiment on Three-line-array Stereo Images
The study area is located northwest of Shijiazhuang City in Hebei Province of China, and this area is characterized by mountains and hills with elevations ranging from 100–2000 m. The data set includes three images, as shown in Figure 7, acquired with ZY-3 forward, nadir and backward cameras almost simultaneously along-track in 16 September 2012. The purpose of this experiment is to detect image distortion in the cross-track direction and to compensate the distortion in the image space based on the method discussed in Section 2.1.2.
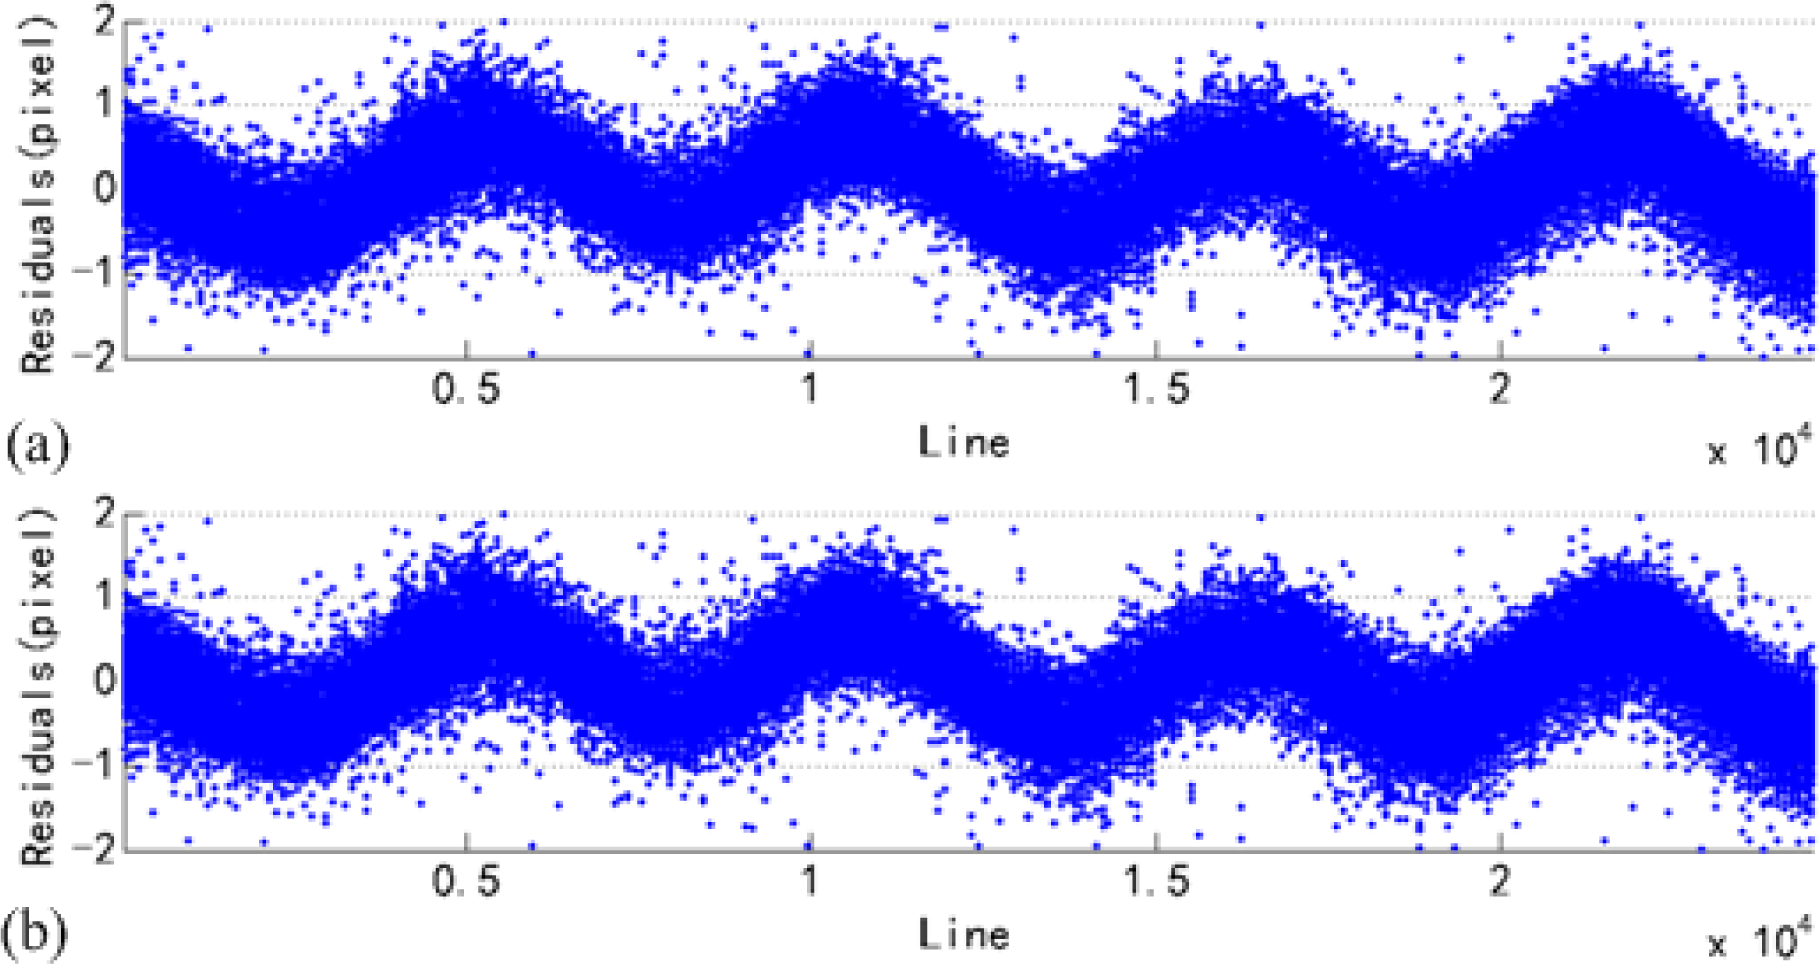
Consistent geometric restoration using the CPs of the line of sight (LOS) vectors of sensors is one of the cores in this study [9]. The corresponding ground position of CPs can be intersected using LOS vectors. However, the LOS vectors do not perfectly intersect in one ground point in practice due to the exterior orientation errors which include the satellite attitude jitter [9]. Based on this principle, the ground position can be computed with the least squares adjustment and back-projected to the nadir image using the proposed method introduced in Section 2.1.2 to obtain the back-projection residuals. Figure 8 shows the results of jitter detection based on the stereo images. In the figure, the horizontal axis presents the line number of the conjugate points and the vertical is the back-projection residuals. From the figure, we can see that (1) there are periodic back-projection residuals in the cross-track direction in the image. The back-projection residuals illustrate that images are periodically disturbed by the attitude jitter motion. Owing to the periodic property of the residuals, the traditional bias correction methods can not compensate this type of error [38]. Both frequencies of the back-projection residuals are about 0.62 Hz derived by spectral analysis.
3.2.2. Results of Experiment on Panchromatic Images and DEM
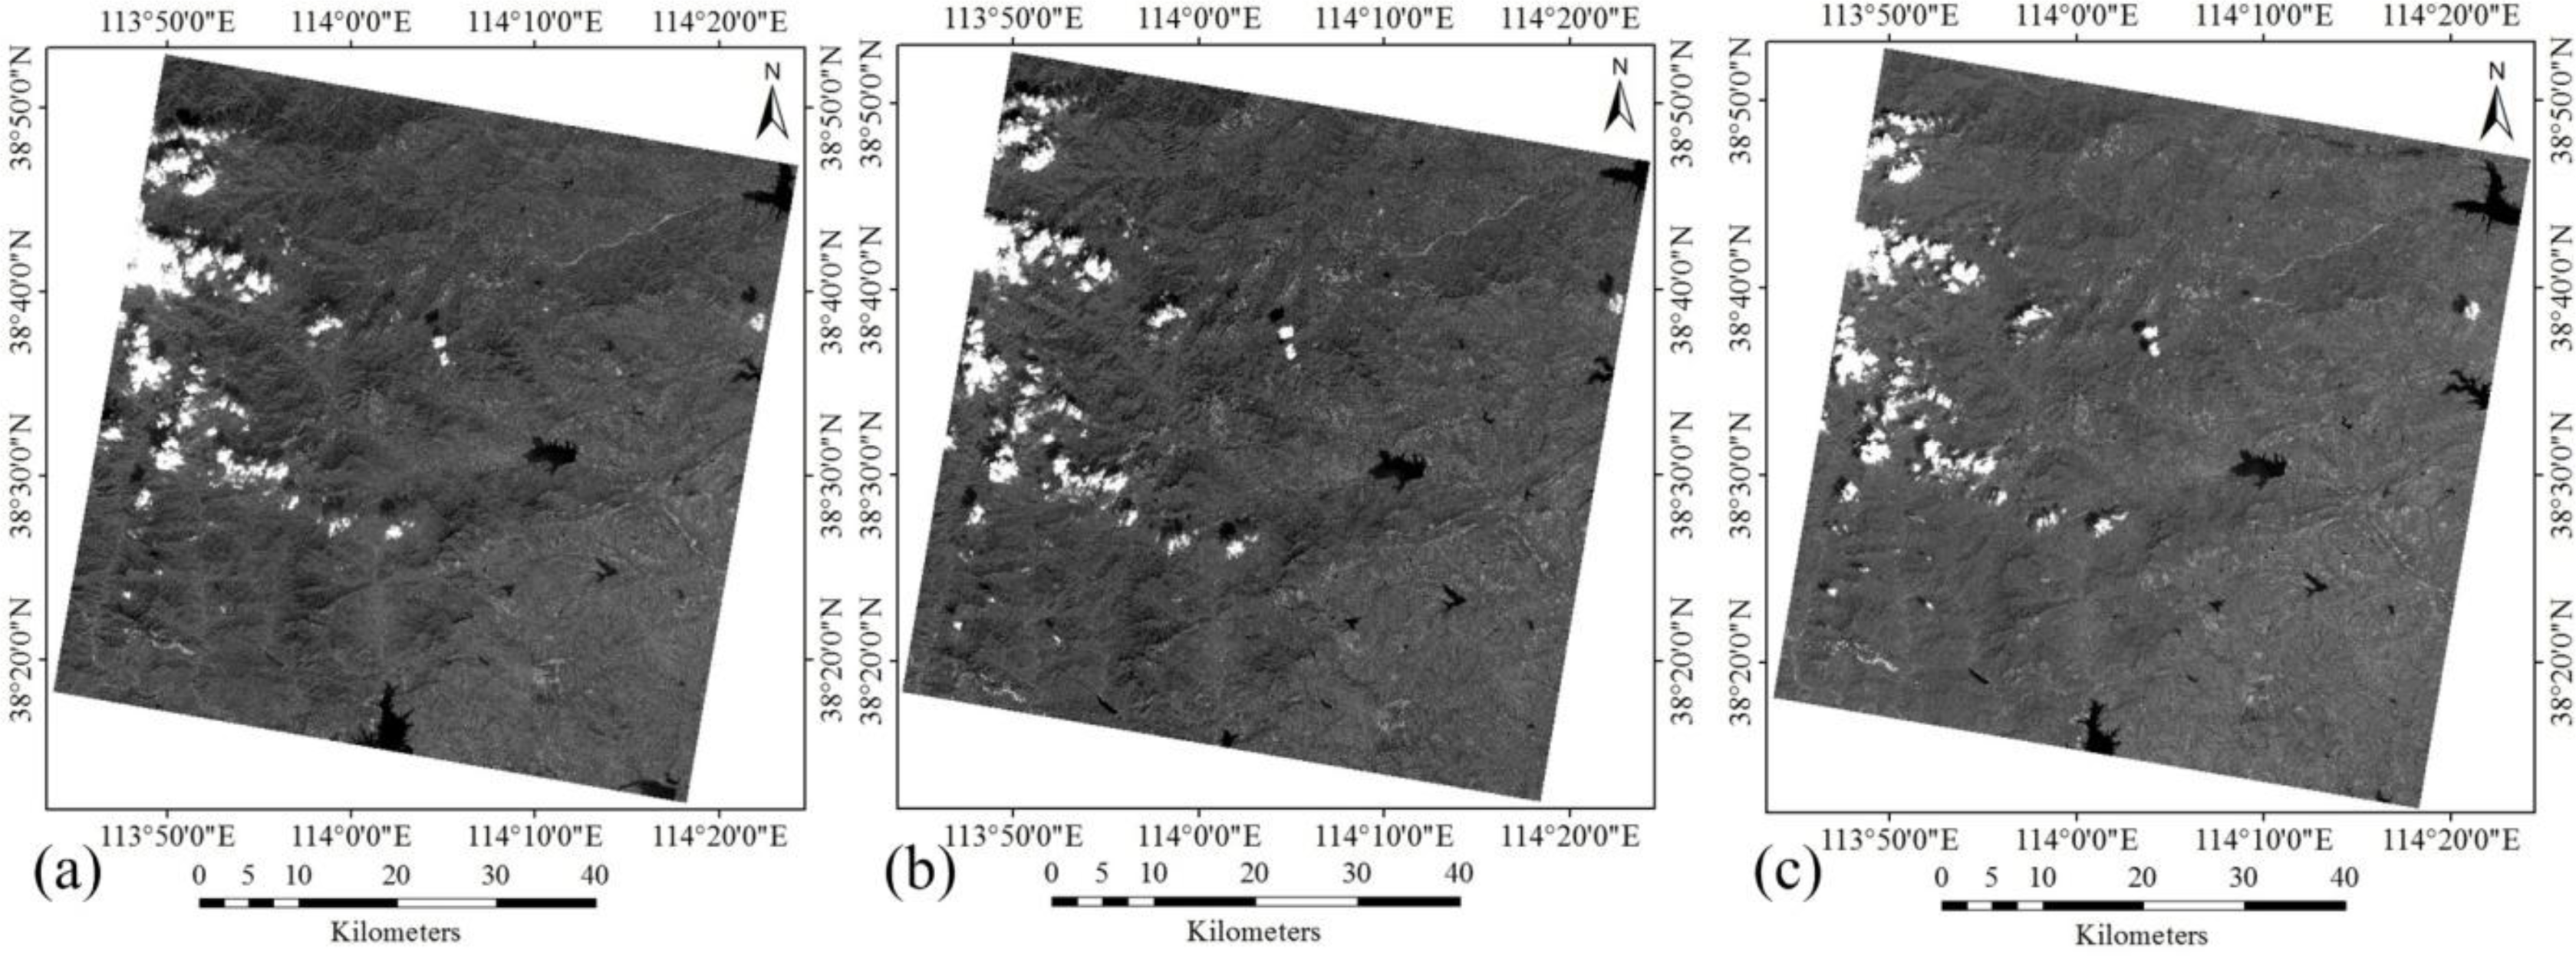
In the experiment, subsets of ZY-3 panchromatic images acquired on 3 February 2012 were used to validate our proposed jitter detection method based on panchromatic images. The test image covers Songshan district located in Dengfeng, Henan Province of China. The quality of external DEM affects the accuracy of image orthorectification and the result of subsequent jitter detection. For this reason, an accurate DEM with a GSD of 2 m, a height accuracy of about 2 m and ground size of 20 km × 20 km generated from aerial triangulation was used in the experiment. In the following, the forward and nadir panchromatic images are processed using the above-mentioned detection method, which is referred to as Forward-Nadir case.
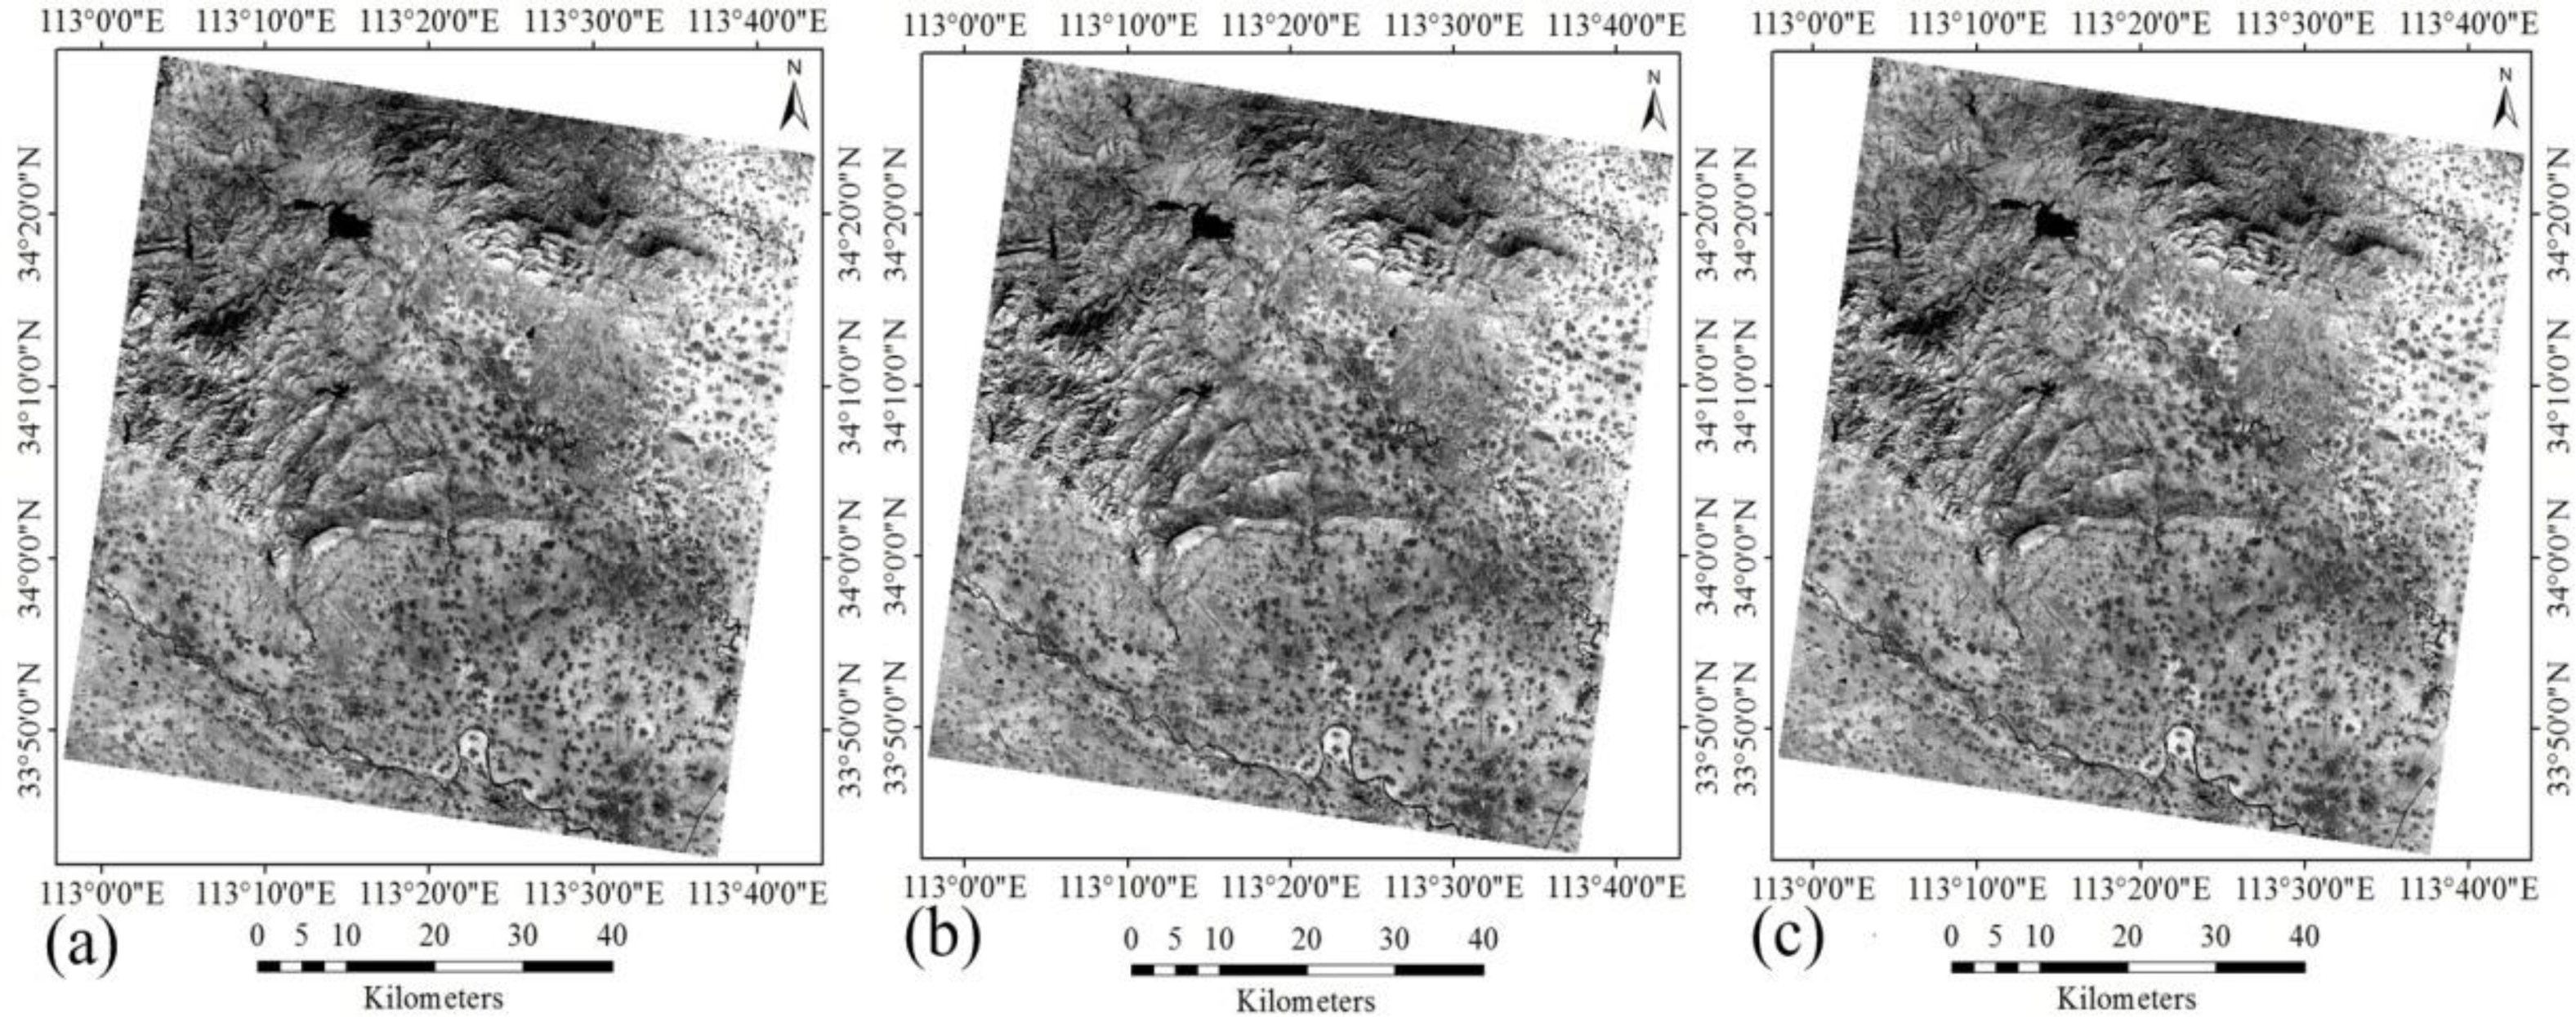
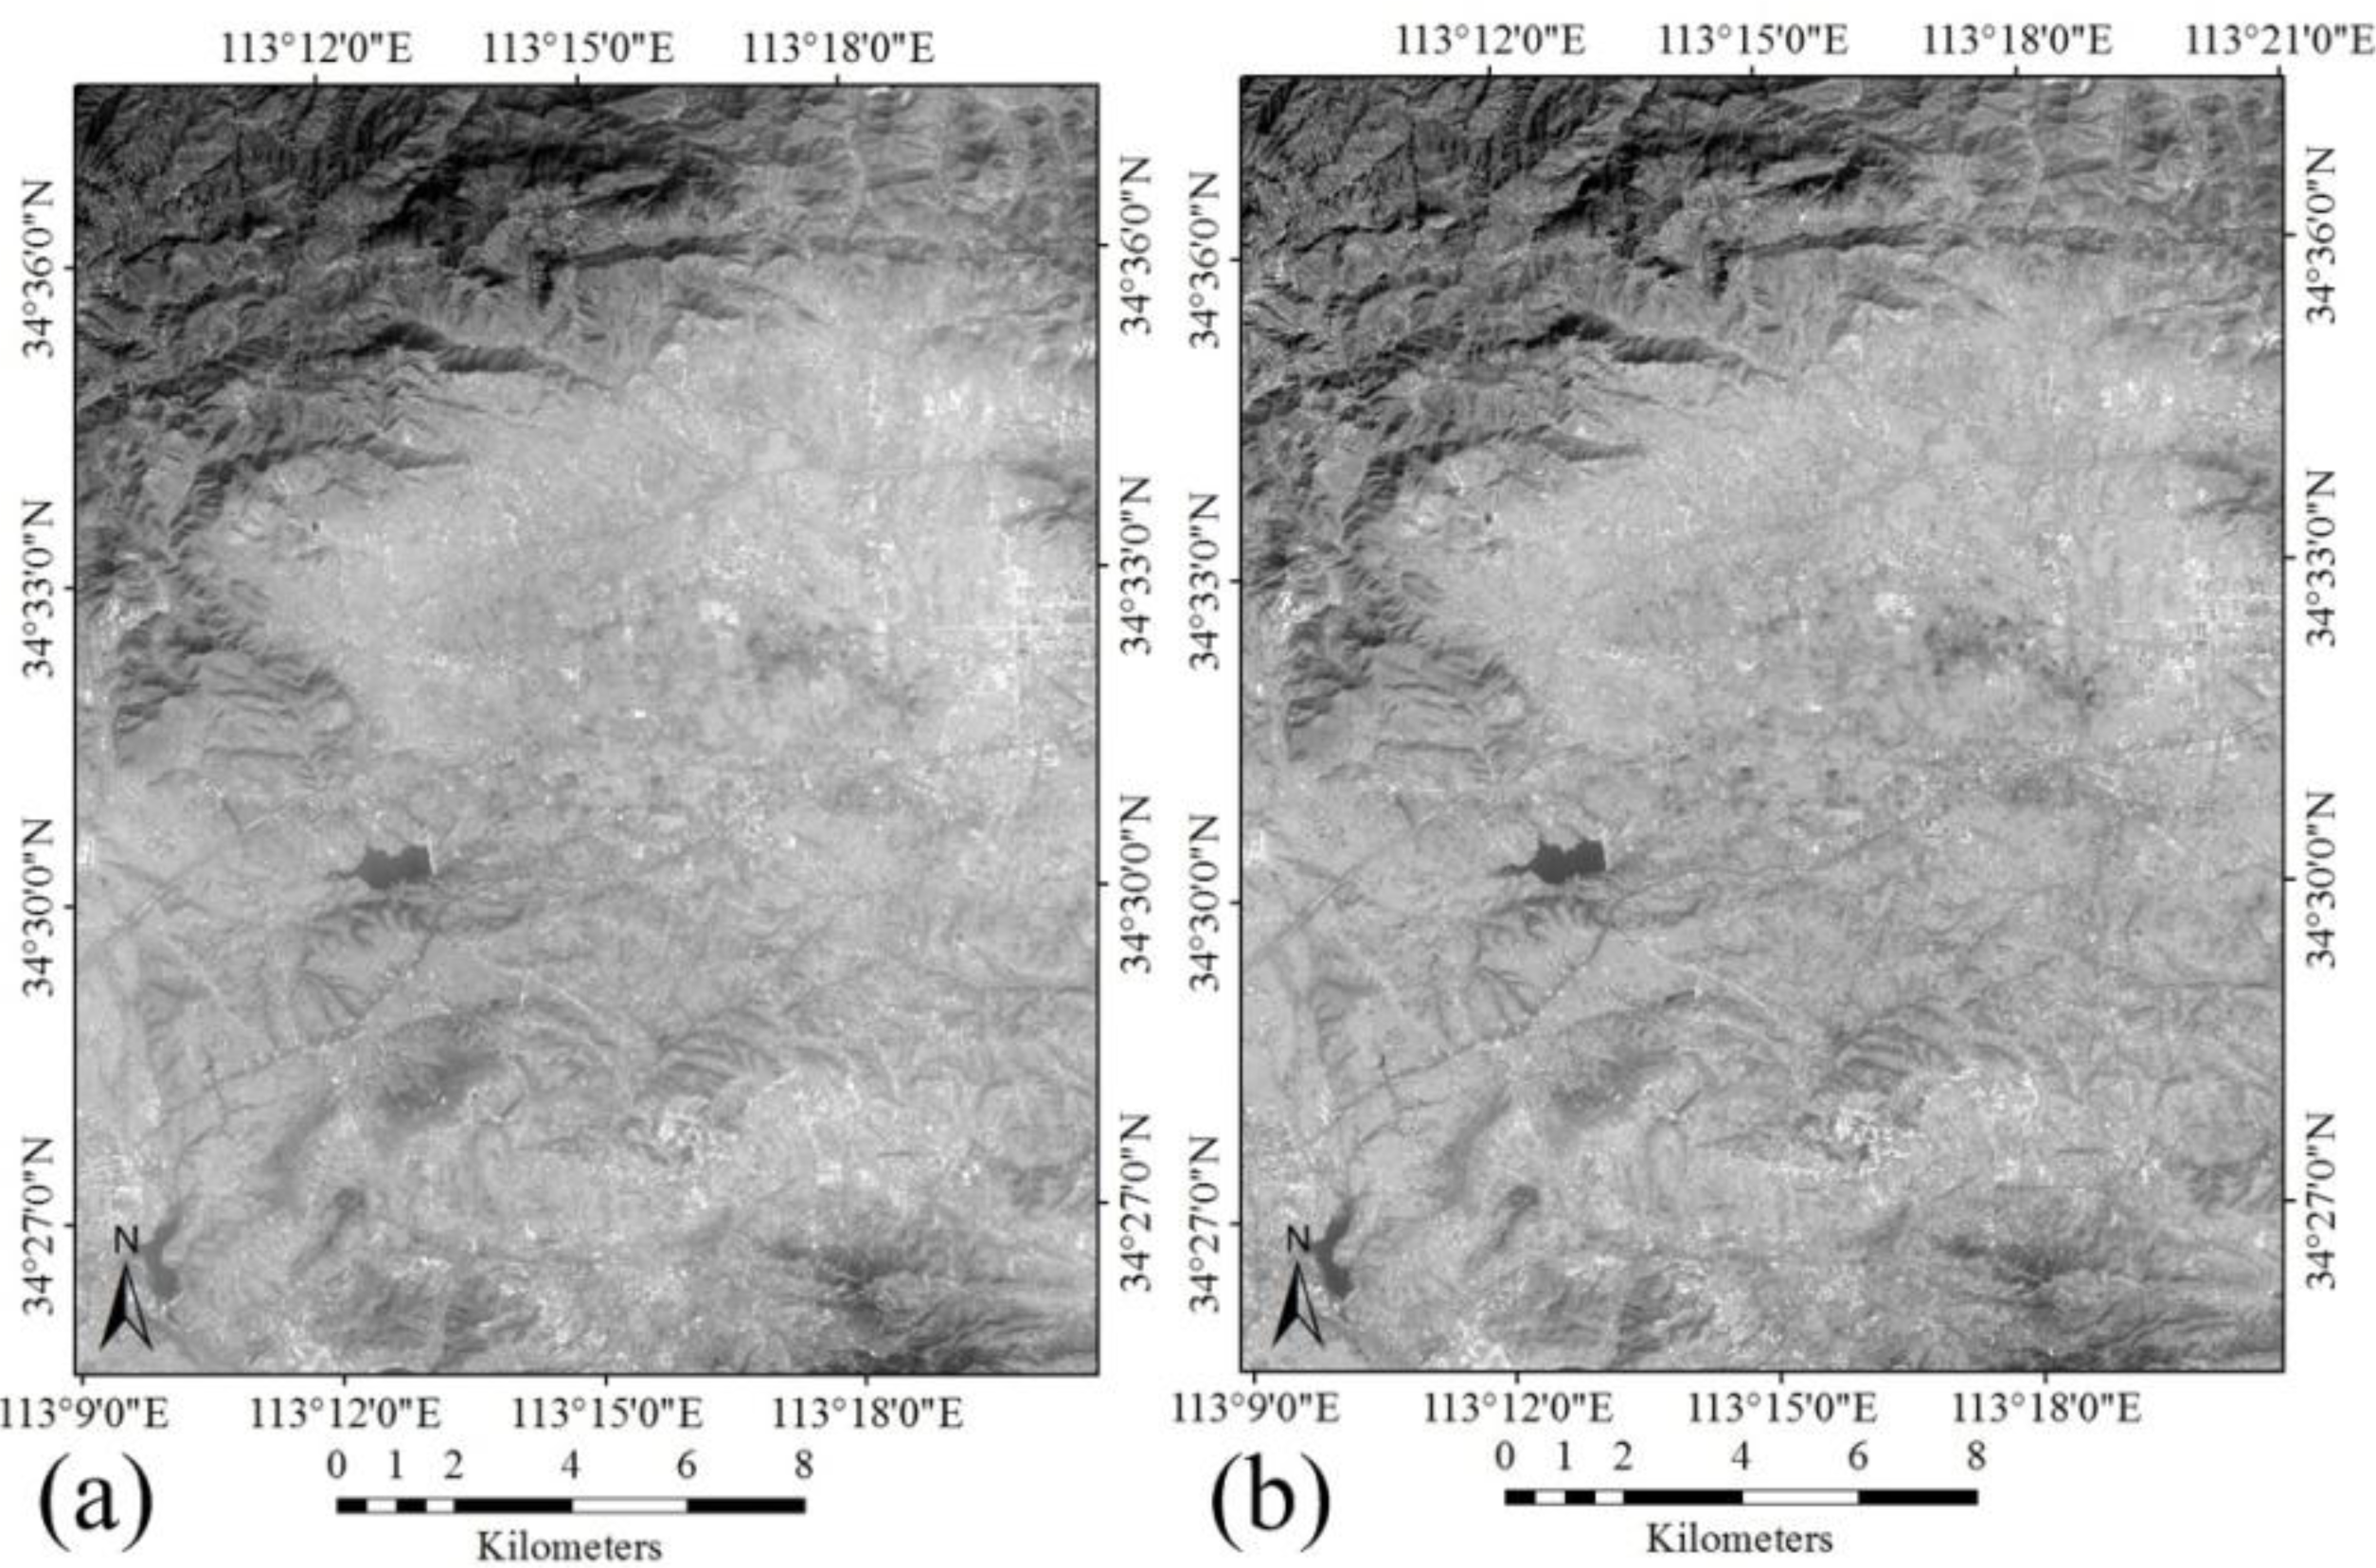
Figure 9 shows the orthoimages of the forward, nadir panchromatic images. These images are projected into Universal Transverse Mercator (UTM) coordinates and resampled on equivalent GSD of 3.5 m.
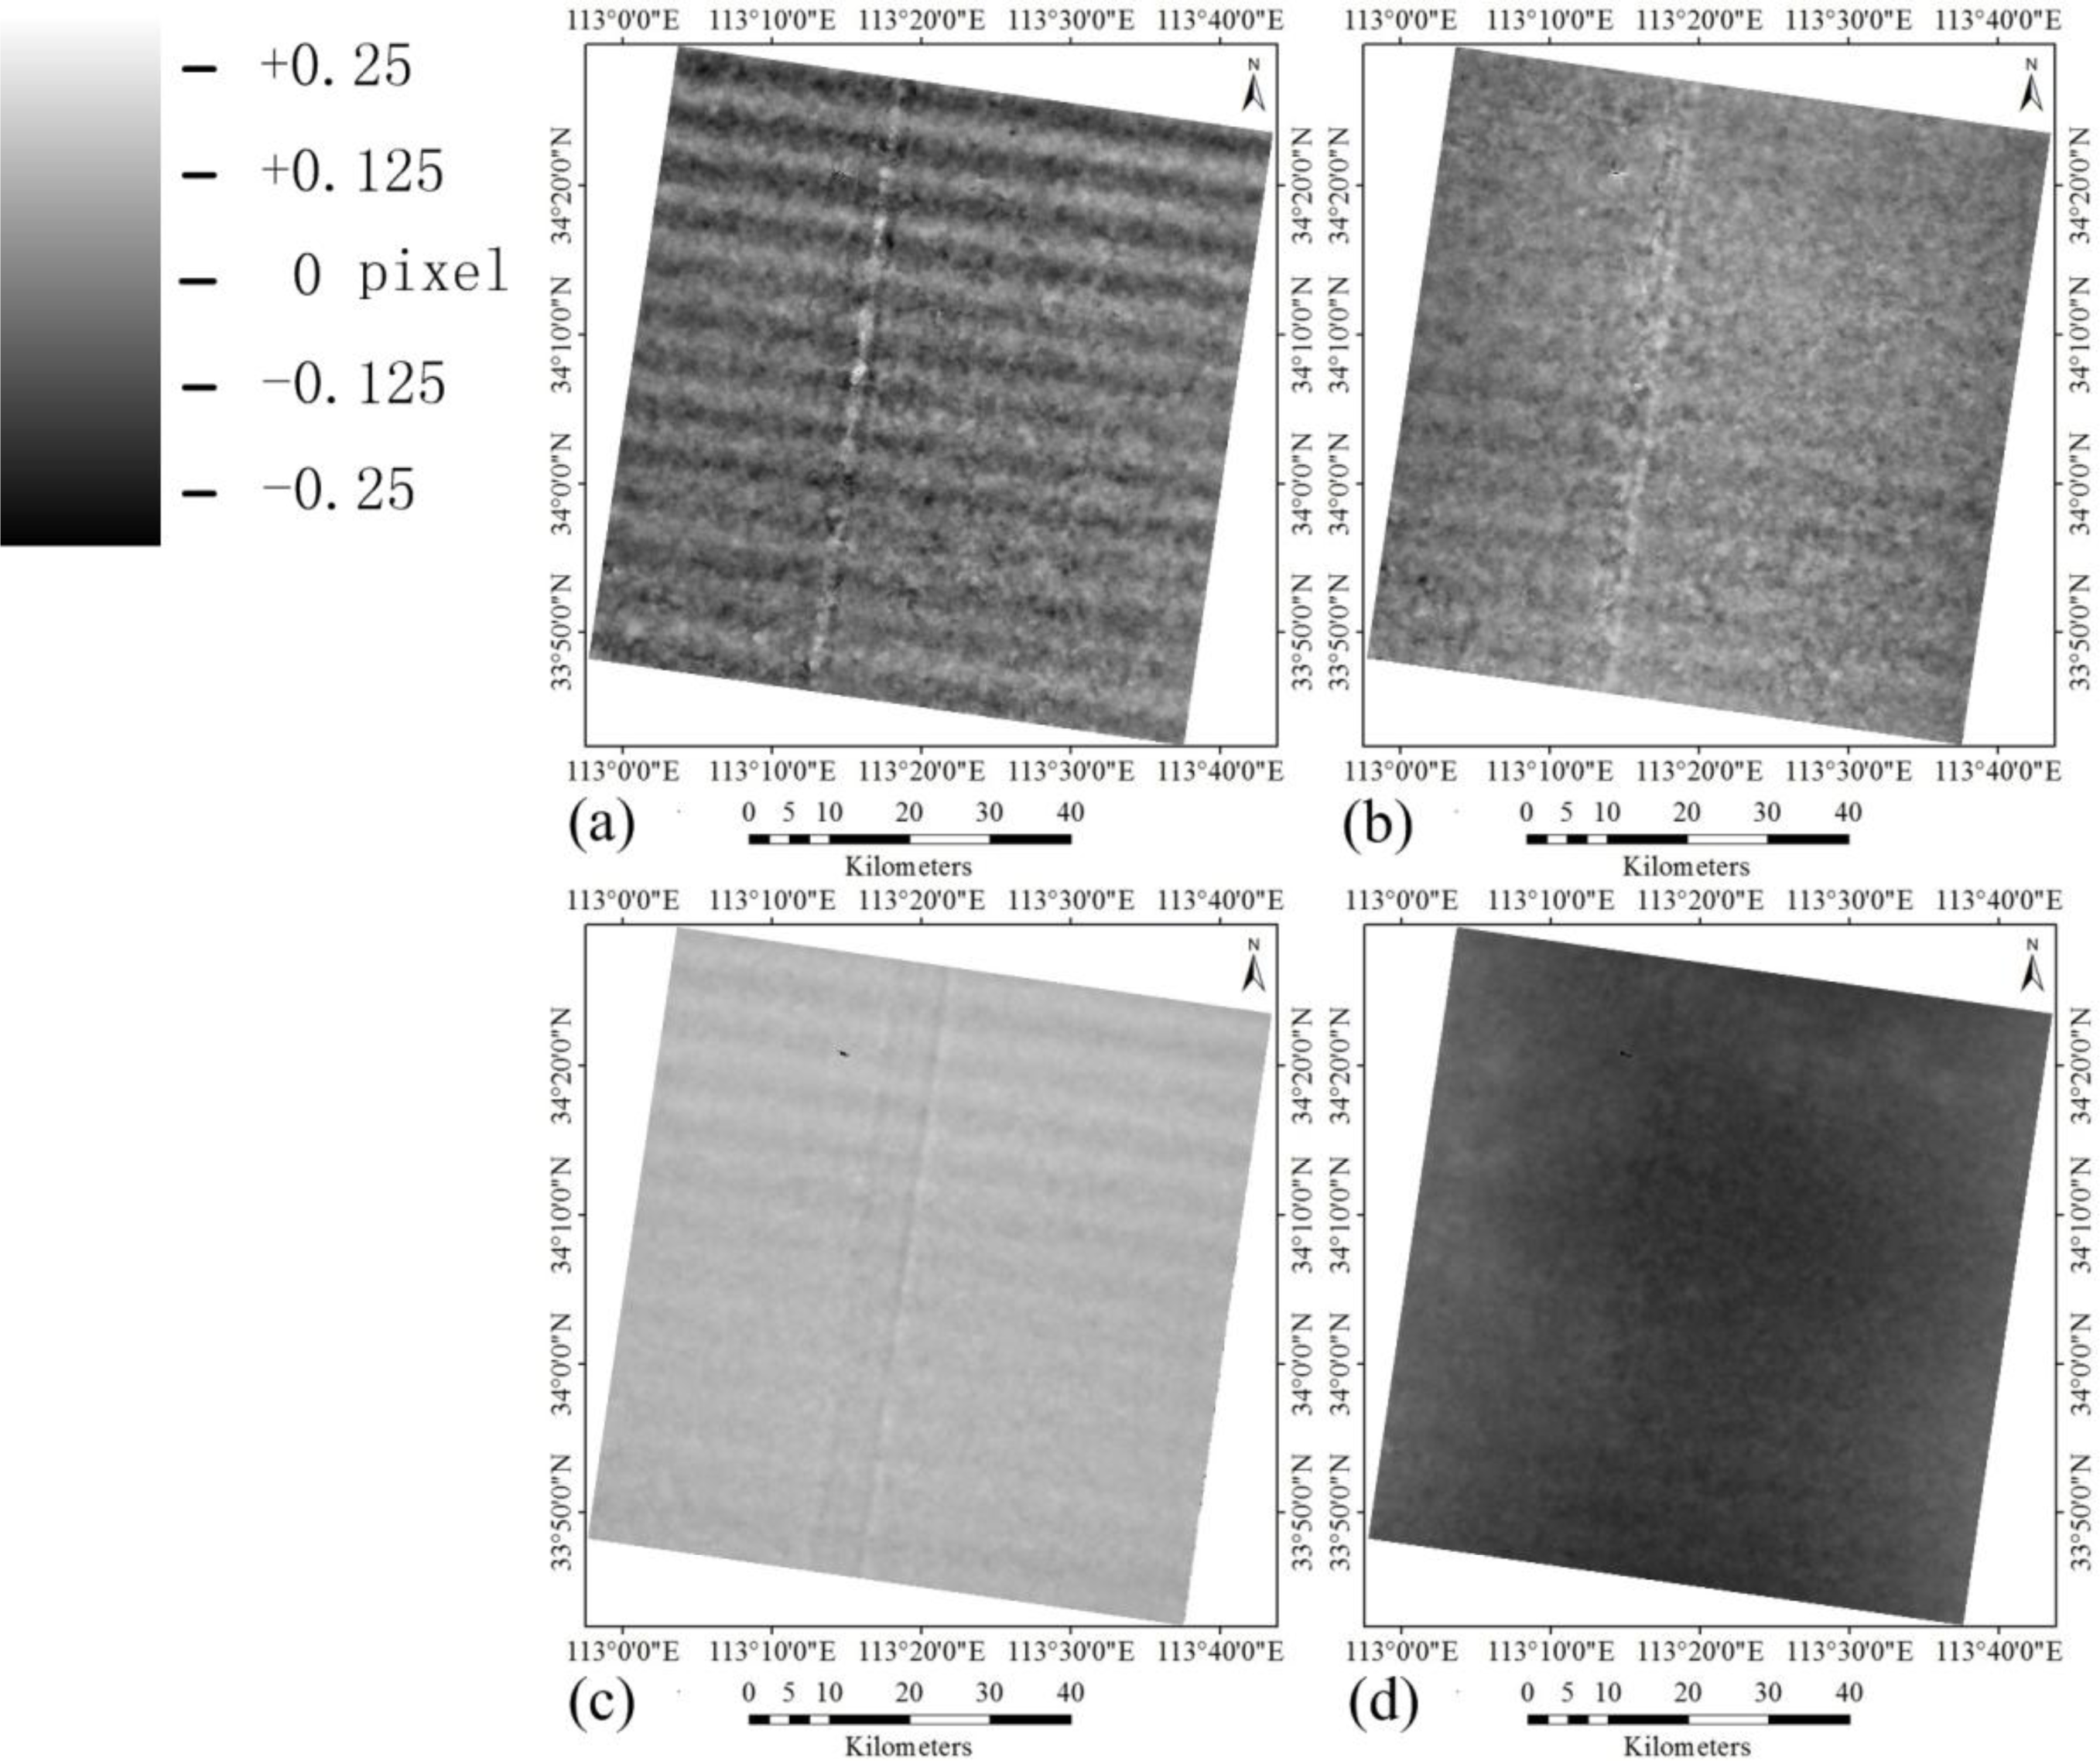
Figure 10 shows the results of dense matching and modified parallax maps of Forward-Nadir case in both directions. In the figure, the dark and light unexpected periodic stripes in the dense matching resulting image in E-W direction, as well as the regular vertical parallax variations in parallax map in the cross-track direction, are manifestation of satellite attitude jitter. Figure 11 shows the variation curve of the averaged parallax disparities at each scan line in the cross-track direction. In the figure, the variation curve is a quasi-sinusoidal trend. Through Fourier spectral analysis, the frequency of attitude jitter is calculated as 0.645 Hz.
3.2.3. Results of Jitter Compensation on Multispectral Images
In the experiment, Band 1 and Band 2 from CCD 1 of ZY-3 multispectral image, which is captured almost simultaneously with panchromatic images used in Section 3.2.2, were used. Following the detection method described in Section 2.1.1 and the compensation method described in Section 2.2.1, Figure 12 shows the results of the averaged parallax disparities at each scan line in the cross-track direction before and after compensation. From Figure 12, we can see that a quasi-sinusoidal periodic pattern with the frequency characteristic of 0.654 Hz is revealed before jitter compensation and the periodic distortions are significantly corrected after compensation. The amplitude of the averaged parallax disparities is reduced from 1 pixel to 0.3 pixel. However, there still exits some residuals after compensation, which would be caused by topographic effects. Therefore, it is worth further consideration of the influence of terrain on jitter compensation.
Following three detection methods for estimation of attitude jitter of ZY-3 satellite, the results are depicted in Figures 8, 11 and 12a. We can see that all of detection results present a quasi-sinusoidal periodic trend, which is caused by attitude jitter. The periodic patterns estimated by three different methods are consistent with the frequency characteristic of around 0.6 Hz. The periodic patterns can be significantly attenuated by jitter compensation. However, it is worth noting that further study on the periodic patterns requires temporal analysis with long-strip images.
3.2.4. Results of Jitter Compensation on Attitude Data and Accuracy Assessment
In the experiment, the same ZY-3 images used in Section 3.2.2 were implemented based on the compensation method described in Section 2.2.2. A total of 20 well-distributed GCPs were chosen for accuracy assessment. The image coordinates of these GCPs were manually measured in three-line-array images. To verify the validity of our proposed jitter model, forward intersection was applied to calculate the ground coordinates. Further, the results of direct georeferencing with or without consideration of the influence of jitter were compared with the measured ground coordinates of 20 GCPs. Table 1 shows the result of geometric accuracy before and after jitter compensation, which represents the performance of jitter compensation on attitude data. From the table, we can see that (1) in N-S and E-W directions, the root mean squared (RMS) errors after jitter compensation become smaller; and (2) a correction of about 0.6 m is achieved in height. The result shows that the positioning accuracy is indeed affected by jitter.
4. Conclusions
This paper presents a framework of jitter detection and compensation for high resolution satellites. In the framework, three methods for jitter detection based on parallax observation with different types of sensors are proposed. Parallax maps are acquired using the three methods, and the jitter characteristics including its frequency and amplitude are analyzed. This is followed by introducing two approaches for jitter compensation, which removes the influence of jitter on image and attitude data. The performance of jitter compensation is assessed by comparing the difference of GCPs with or without consideration of the influence of jitter. The proposed framework is demonstrated with experiments using images from ASTER, LRO and ZY-3 satellites. The experimental results show the feasibility of the proposed framework for jitter detection and compensation of high resolution satellites. Several conclusions were drawn as follows:
- (1)
The proposed detection method based on multispectral images can precisely estimate and retrieve attitude jitter in both cross-track and along-track directions. The proposed detection method based on stereo images can detect satellite jitter in the cross-track direction by discovering the periodic back-projection residuals. The proposed detection method based on panchromatic images, which includes orthorectification process, can successfully estimate attitude jitter in the cross-track direction. The proposed three detection methods achieve a similar quasi-sinusoidal periodic pattern with the frequency characteristic of around 0.6 Hz in the case of ZY-3 satellite.
- (2)
The proposed compensation method on image can significantly correct the jitter effect. The amplitude of the averaged parallax disparities is reduced from 1 pixel to 0.3 pixel after jitter compensation for ZY-3 image. In the case of experiment with ZY-3 stereo images, a better accuracy is acquired after jitter compensation on attitude data, particularly the accuracy in height is improved by about 0.6 m. The results show that the introduced jitter model can express well the jitter components of the attitude observations.
- (3)
Our proposed framework, including three jitter detection methods and two compensation methods, can detect attitude jitter with use of different types of data, and compensate effects of jitter by correcting image or sensor models for multipoint observation platforms which frequently cause attitude jitter. Our study provides a framework to improve imaging quality and geometric performance for multipoint observations. Therefore, to the best of our knowledge, our work would be considered as one of the most comprehensive investigations for multipoint observations on attitude jitter.
Acknowledgments
The author would like to express gratitude to the anonymous reviewers and editor whose valuable comments and suggestions have improved the quality of this paper. The work described in this paper was substantially supported by the National Natural Science Foundation of China (Project No. 41325005 and 41171352), the Fund of Shanghai Outstanding Academic Leaders Program (Project No. 12XD1404900). We also appreciate the help of Chinese Satellite Surveying and Mapping Application Center, NASA LP DAAC, NASA LROC team and Arizona State University and the State Key Laboratory of Information Engineering in Surveying, Mapping and Remote Sensing (LIESMARS), Wuhan University for providing experimental data.
Author Contributions
The concept and design of framework for jitter detection and compensation were proposed by Xiaohua Tong. The investigation on the methods for jitter detection was performed by Xiaohua Tong, Zhen Ye, Yusheng Xu, Lingyun Li, Huan Xie and Xingming Tang. The investigation on the methods for jitter compensation was performed by Xiaohua Tong, Lingyun Li, Yusheng Xu, Zhen Ye, Shijie Liu and Huan Xie. The experiments were performed by Zhen Ye, Yusheng Xu, Lingyun Li, Fengxiang Wang, Tianpeng Li and Zhonghua Hong. All authors have contributed significantly and have participated sufficiently to take the responsibility for this research. Moreover, all authors are in agreement with the submitted and accepted versions of the publication.
Conflicts of Interest
The authors declare no conflict of interest.
References
- Lee, D.S.; Storey, J.C.; Choate, M.J.; Hayes, R.W. Four years of Landsat-7 on-orbit geometric calibration and performance. IEEE Trans. Geosci. Remote Sens 2004, 42, 2786–2795. [Google Scholar]
- Storey, J.C.; Choate, M.J.; Meyer, D.J. A geometric performance assessment of the EO-1 advanced land imager. IEEE Trans. Geosci. Remote Sens 2004, 42, 602–607. [Google Scholar]
- Teshima, Y.; Iwasaki, A. Correction of attitude fluctuation of Terra spacecraft using ASTER/SWIR imagery with parallax observation. IEEE Trans. Geosci. Remote Sens 2008, 46, 222–227. [Google Scholar]
- Tong, X.; Hong, Z.; Liu, S.; Zhang, X.; Xie, H.; Li, Z.; Yang, S.; Wang, W.; Bao, F. Building-damage detection using pre-and post-seismic high-resolution satellite stereo imagery: A case study of the May 2008 Wenchuan earthquake. ISPRS J. Photogramm. Remote Sens 2012, 68, 13–27. [Google Scholar]
- Liu, C.C. Processing of FORMOSAT-2 daily revisit imagery for site surveillance. IEEE Trans. Geosci. Remote Sens 2006, 44, 3206–3214. [Google Scholar]
- Iwasaki, A.; Fujisada, H. ASTER geometric performance. IEEE Trans. Geosci. Remote Sens 2005, 43, 2700–2706. [Google Scholar]
- Takaku, J.; Tadono, T. PRISM on-orbit geometric calibration and DSM performance. IEEE Trans. Geosci. Remote Sens 2009, 47, 4060–4073. [Google Scholar]
- Pan, H.; Zhang, G.; Tang, X.; Li, D.; Zhu, X.; Zhou, P.; Jiang, Y. Basic products of the ZiYuan-3 satellite and accuracy evaluation. Photogramm. Eng. Remote Sens 2013, 79, 1131–1145. [Google Scholar]
- Iwasaki, A. Detection and Estimation Satellite Attitude Jitter Using Remote Sensing Imagery. In Advances in Spacecraft Technologies; Hall, J., Ed.; InTech: Rijeka, Croatia, 2011; Volume 13, pp. 257–272. [Google Scholar]
- Shin, D.; Pollard, J.K.; Muller, J.P. Accurate geometric correction of ATSR images. IEEE Trans. Geosci. Remote Sens 1997, 35, 997–1006. [Google Scholar]
- Delvit, J.M.; Greslou, D.; Amberg, V.; Dechoz, C.; de Lussy, F.; Lebegue, L.; Latry, C.; Artigues, S.; Bernard, L. Attitude Assessment Using Pleiades-HR Capabilities. Proceedings of the International Archives of the Photogrammetry, Remote Sensing and Spatial Information Sciences, Melbourne, VIC, Australia, 25 August–1 September 2012.
- Takaku, J.; Tadono, T. High Resolution DSM Generation from ALOS Prism—Processing Status and Influence of Attitude Fluctuation. Proceedings of the IEEE International Geoscience and Remote Sensing Symposium, Munich, Germany, 22–27 July 2012.
- Kirk, R.L.; Howington-Kraus, E.; Rosiek, M.R; Anderson, J.A.; Archinal, B.A.; Becker, K.J.; Cook, D.A.; Galuszka, D.M.; Geissler, P.E.; Hare, T.M.; et al. Ultrahigh resolution topographic mapping of Mars with MRO HiRISE stereo images: Meter-scale slopes of candidate Phoenix landing sites. J. Geophys. Res 2008, 113. [Google Scholar] [CrossRef]
- Mattson, S.; Robinson, M.; McEwen, A.; Bartels, A.; Bowman-Cisneros, E.; Li, R.; Lawver, J.; Tran, T.; Paris, K.; Lroc Team. Early Assessment of Spacecraft Jitter in LROC-NAC. Proceedings of the 41st Lunar and Planetary Institute Science Conference, The Woodlands, TX, USA, 1–5 March 2010.
- Amberg, V.; Dechoz, C.; Bernard, L.; Greslou, D.; de Lussy, F.; Lebegue, L. In-flight attitude perturbances estimation: Application to PLEIADES-HR satellites. Proc. SPIE 2013, 886612. [Google Scholar] [CrossRef]
- Li, R.; Hwangbo, J.; Chen, Y.; Hwangbo, J.; Chen, Y.; Di, K. Rigorous photogrammetric processing of HiRISE stereo imagery for Mars topographic mapping. IEEE Trans. Geosci. Remote Sens 2011, 49, 2558–2572. [Google Scholar]
- Schneider, M.; Lehr, M.; Müller, R.; Müller, R.; Reinartz, P. Stereo Evaluation of ALOS/PRISM Data on ESA-AO Test Sites: First DLR Results. Proceedings of the ALOS PI Symposium, Island of Rhodes, Greece, 3–7 November 2008.
- Schwind, P.; Müller, R.; Palubinskas, G.; Storch, T. An in-depth simulation of EnMAP acquisition geometry. ISPRS J. Photogramm. Remote Sens 2012, 70, 99–106. [Google Scholar]
- Ayoub, F.; Leprince, S.; Binet, R.; Lewis, K.W.; Aharonson, O. Influence of Camera Distortions on Satellite Image Registration and Change Detection Applications. Proceedings of the IEEE International Geoscience and Remote Sensing Symposium, Boston, MA, USA, 7–11 July 2008.
- Nuth, C.; Kääb, A. Co-registration and bias corrections of satellite elevation data sets for quantifying glacier thickness change. Cryosphere 2011, 5, 271–290. [Google Scholar]
- Poli, D.; Toutin, T. Review of developments in geometric modelling for high resolution satellite pushbroom sensors. Photogramm. Rec 2012, 27, 58–73. [Google Scholar]
- Nagashima, S.; Aoki, T.; Higuchi, T.; Kobayashi, K. A. Subpixel Image Matching Technique Using Phase-Only Correlation. Proceedings of the International Symposium on Intelligent Signal Processing and Communication Systems, Yonago, Japan, 12–15 December 2006.
- Heid, T.; Kääb, A. Evaluation of existing image matching methods for deriving glacier surface displacements globally from optical satellite imagery. Remote Sens. Environ 2012, 118, 339–355. [Google Scholar]
- Foroosh, H.; Zerubia, J.B.; Berthod, M. Extension of phase correlation to subpixel registration. IEEE Trans. Image Process 2002, 11, 188–200. [Google Scholar]
- Zhang, L.; Gruen, A. Multi-image matching for DSM generation from IKONOS imagery. ISPRS J. Photogramm. Remote Sens 2006, 60, 195–211. [Google Scholar]
- Förstner, W. On the Geometric Precision of Digital Correlation. Proceedings of the ISPRS Symposium Mathematical Models, Accuracy Aspects and Quality Control, Helsinki, Finland, 7–11 June 1982.
- Tong, X.; Liu, S.; Weng, Q. Geometric processing of QuickBird stereo imageries for urban land use mapping: A case study in Shanghai, China. IEEE J. Sel. Top. Appl. Earth Obs. Remote Sens 2009, 2, 61–66. [Google Scholar]
- Kuglin, C.D. The Phase Correlation Image Alignment Method. Proceedings of the Internation Conference on Cybernetics and Society, New York, NY, USA, 23–25 September 1975.
- Liu, S.; Fraser, C.S.; Zhang, C.; Ravanbakhsh, M.; Tong, X. Georeferencing performance of THEOS satellite imagery. Photogramm. Rec 2011, 26, 250–262. [Google Scholar]
- Earth Remote Sensing Data Analysis Center. ASTER User’s Guide Part-I Version 4.0 (General). Available online: http://www.science.aster.ersdac.jspacesystems.or.jp/en/documnts/users_guide/pdf.html (accessed on 10 January 2014).
- Fujisada, H.; Sakuma, F.; Ono, A.; Kudoh, M. Design and preflight performance of ASTER instrument protoflight model. IEEE Trans. Geosci. Remote Sens 1998, 36, 1152–1160. [Google Scholar]
- NASA Land Processes Distributed Active Archive Center (LP DAAC). Available online: https://lpdaac.usgs.gov/data_access (accessed on 5 January 2014).
- Delon, J.; Rougé, B. Small baseline stereovision. J. Math. Imaging Vis 2007, 28, 209–223. [Google Scholar]
- Arai, T.; Iwasaki, A. Fine Image Matching for Narrow Baseline Stereovision. Proceedings of the IEEE International Geoscience and Remote Sensing Symposium, Munich, Germany, 22–27 July 2012.
- Mattson, S.; Bartels, A.; Boyd, A.; Calhoun, P.; Hsu, O.; McEwen, A.; Robinson, M.; Siskind, J.; Tran, T. Continuing Analysis of Spacecraft Jitter in LROC-NAC. Proceedings of the 42nd Lunar and Planetary Institute Science Conference, The Woodlands, TX, USA, 7–11 March 2011.
- Lunar Reconnaissance Orbiter Camera. Available online: http://lroc.sese.asu.edu (accessed on 20 January 2014).
- Li, D.R. China’s first civilian three-line-array stereo mapping satellite: ZY-3. Acta Geod. Cartogr. Sin 2012, 41, 317–322. [Google Scholar]
- Tong, X.; Liu, S.; Weng, Q. Bias-corrected rational polynomial coefficients for high accuracy geo-positioning of QuickBird stereo imagery. ISPRS J. Photogramm. Remote Sens 2010, 65, 218–226. [Google Scholar]


| Accuracy | N-S Direction (m) | E-W Direction (m) | Height (m) | |||
|---|---|---|---|---|---|---|
| Before | After | Before | After | Before | After | |
| Maximum error | 28.8913 | 28.5682 | 19.8704 | 19.7708 | 7.8080 | 4.7206 |
| RMS error | 24.8034 | 24.7491 | 17.1251 | 17.1023 | 3.1250 | 2.5745 |
© 2014 by the authors; licensee MDPI, Basel, Switzerland This article is an open access article distributed under the terms and conditions of the Creative Commons Attribution license (http://creativecommons.org/licenses/by/3.0/).
Share and Cite
Tong, X.; Ye, Z.; Xu, Y.; Tang, X.; Liu, S.; Li, L.; Xie, H.; Wang, F.; Li, T.; Hong, Z. Framework of Jitter Detection and Compensation for High Resolution Satellites. Remote Sens. 2014, 6, 3944-3964. https://0-doi-org.brum.beds.ac.uk/10.3390/rs6053944
Tong X, Ye Z, Xu Y, Tang X, Liu S, Li L, Xie H, Wang F, Li T, Hong Z. Framework of Jitter Detection and Compensation for High Resolution Satellites. Remote Sensing. 2014; 6(5):3944-3964. https://0-doi-org.brum.beds.ac.uk/10.3390/rs6053944
Chicago/Turabian StyleTong, Xiaohua, Zhen Ye, Yusheng Xu, Xinming Tang, Shijie Liu, Lingyun Li, Huan Xie, Fengxiang Wang, Tianpeng Li, and Zhonghua Hong. 2014. "Framework of Jitter Detection and Compensation for High Resolution Satellites" Remote Sensing 6, no. 5: 3944-3964. https://0-doi-org.brum.beds.ac.uk/10.3390/rs6053944