Article

Assessment of MODIS, MERIS, GEOV1 FPAR Products over Northern China with Ground Measured Data and by Analyzing Residential Effect in Mixed Pixel

1
The State Key Laboratory of Resources and Environmental Information System, Institute of Geographic Sciences and Natural Resources, Chinese Academy of Sciences, Beijing 100101, China
2
Key Laboratory of Wetland Ecology and Environment, Northeast Institute of Geography and Agroecology, Chinese Academy of Science, 4888 Shengbei Street, Changchun 130102, China
*
Author to whom correspondence should be addressed.
Remote Sens. 2014, 6(6), 5428-5451; https://0-doi-org.brum.beds.ac.uk/10.3390/rs6065428
Submission received: 11 February 2014 / Revised: 22 May 2014 / Accepted: 23 May 2014 / Published: 12 June 2014

Abstract

:
Fraction of Photosynthetically Active Radiation (FPAR) is a critical parameter in land surface energy balance and climate modeling. Several global FPAR products are available, but these still require considerable assessment and validation due to low spatial resolution. Three major FPAR products that have covered China and provided continuous time series data—MODIS, MERIS and GEOV1—were assessed from 2006–2010. Based on the ground measurement data, the accuracies of these three FPAR products were directly validated for maize and winter wheat over northern China. This investigation also assessed the consistencies among the three FPAR products, and analyzed the residential area in mixed pixels effect on the FPAR products accuracy, at each of the main growth stages of maize and winter wheat. The GEOV1 FPAR product was found to be the most accurate with regression R2 values of 0.818 and 0.655 for ground measured maize and winter wheat FPAR. The maize FPAR data were generally more accurate than the winter wheat FPAR data. The MODIS, MERIS and GEOV1 products all indicated that FPAR variations among the growth stages differed from year to year. The scattered residential areas in mixed pixels were found to significantly affect the FPAR data uncertainties, and these were also analyzed in detail. The effect of residential area percentage in mixed pixels on FPAR values differed for different crops, and this was not necessarily in accordance with the FPAR product accuracy. For the mixed pixels, a quadratic polynomial was able to fit the residential area and FPAR data reasonably well with R2 values higher than 0.9 for most relationships. Quadratic polynomial fitting may provide a simple and convenient method to assess and reduce the residential area effect on FPAR in the mixed pixels.

1. Introduction

The Fraction of Photosynthetically Active Radiation (FPAR) is an important index for detecting the vegetation water, energy and carbon balance and is a key parameter in the ecosystem productivity model, crop yield model, and other models [15]. FPAR is most often defined as the proportion of available photosynthetically active radiation absorbed by the green vegetation canopy in the specific spectrum of 400–700 nm.
Several current operational sensors in remote sensing satellites can provide regional or global FPAR data in a time series, such as Moderate Resolution Imaging Spectroradiometer (MODIS), Medium Resolution Imaging Spectrometer (MERIS), Multi-angle Imaging Spectroradiometer (MISR), Global Land Products for Carbon Model Assimilation (GLOBCARBON), Land Surface Analysis Satellite Applications Facility (LANDSAF), Joint Research Centre FAPAR (JRC-FAPAR) and System Observation Probatoire beyond Tarre (SPOT) VEGETATION [6,7]. The global remote sensing FPAR product is an important data source because of the inherent technology advantage that can provide continuous temporal and spatial covering data. They have long been used for modeling ecosystem process or estimating agro-ecological parameters [8,9]. Connolly et al. [10] found MODIS FPAR is a useful data source for the characterization of light use efficiency parameter ɛ at flux tower sites. Nightingale et al. studied result [11] showed that MODIS FPAR product can also provide realistic time-series data with a gap-filled and smoothed method for carbon modeling in regions where persistent cloud cover is an issue. Seixas et al. [12] emphasized the importance of FPAR product in data-driven ecosystem productivity estimation methods, and found MERIS underestimated FPAR but displayed greater spatial homogeneity than MODIS, as well as compared the MODIS and MERIS FPAR products application in net primary production (NPP) estimates, identifying a seasonal discrepancy. Haverd et al. [13] used MODIS and AVHRR FPAR to estimate regional NPP—regional differences up to 15% were identified—and found that seasonal discrepancy in FPAR is a key contributor to seasonal discrepancy in NPP. The existing products distinguish in terms of the time compositing period, retrieval algorithm, spatial resolution or remapping technique. Data users and producers are needed and are eager to understand these FPAR products discrepancies and consistencies [6]. It is very necessary for validating and assessing the product accuracy to establish confidence in FPAR data sets and to provide a basis for their applications [14,15].
Overall, several methods have been used to validate and assess FPAR products accuracies and their consistencies, and these include direct comparisons with in situ measured data, comparisons with FPAR data estimated from high-resolution images and inter-comparisons among the global products. Weiss et al. [16] found that CYCLOPES FAPAR showed consistent seasonality with MODIS FPAR and performed better than MODIS FPAR. McCallum et al. [14] compared four global FPAR products and found that MODIS and CYCLOPES datasets record generally similar but substantially more than JRC and GLOBCARBON datasets. FAPAR products derived from the JRC-TIP (Two-stream Inversion Package) using MODIS and MISR surfaces as inputs exhibited much less variability [17]. Martinze et al. [18] inter-compared and assessed the quality of the MODIS, MERIS and SEVIRI (Spinning Enhanced Visible and InfraRed Imager) FPAR products over the Iberian Peninsula. Pickett-Heaps et al. [7] evaluated the consistency of six FPAR products (MODIS, MERIS, SeaWIFS (Sea-Viewing Wide Field-of-View Sensor), MODIS-TIP, SPOT-VEGETATION, and AVHRR (Advanced Very High Resolution Radiometer)) across the Australian continent using multi-year datasets and found that the consistency of FPAR products is sensitive to the biome classification but not the fractional vegetation cover. Serbin et al. [19] found MODIS collection 4 (C4) FPAR product overestimated and collection 5 (C5) data were more closely aligned with ground measured FPAR across a boreal forest wildfire chronosequence.
Using high-resolution images and ground-measured data, several investigations indicated MODIS collection 3 (C3) and C4 FPAR products tend to overestimate several land cover classes [20,21]. Hummrich et al. [20] found there was a significant bias between MODIS C3 FPAR products and ground measured FPAR for woodland in Africa, and land cover misclassification was a possible cause. Steinberg et al. [22] indicated that the MODIS C4 FPAR overestimated when compared to Landsat-7 ETM retrieval FPAR in the boreal forests of Alaska. Overall, the MODIS C5 FPAR product has undergone only minimal validation [15,19,23]. Steinberg and Geotz [15] found the majority of MODIS C4 FPAR was actually derived from empirically based algorithm and C5 showed better data quality but still had limitations in temperate forest areas in the eastern United States. Chen et al. [24] found that the difference between MODIS C5 FPAR and TM retrieved FPAR is smaller than the expected level. Fritsch et al. [23] validated the MODIS C5 FPAR product with multi-temporal RapidEye images obtained from arid agricultural landscape and found that MODIS C5 FPAR results in overestimation of approximately 6%–15%. The C5 products that are currently available show better data quality than C3 and C4 products, but it still persistent limitations in forest areas [15]. Gobron et al. [25] analyzed the uncertainty of MERIS FPAR products with FPAR field estimates derived from ground measured leaf area index (LAI) and found that the expected accuracy of the MERIS FPAR product was within ± 0.1. Weiss et al. [16] found that the CYCLOPES FAPAR product performed well (RMSE = 0.1) for a limited number of ground measurements in Europe and the Americas. The Geoland2 Core Mapping Service BioPAR provided newly the GEOV1 FPAR product [26], which is based on the CYCLOPES FPAR product and has been combined with the MODIS C5 FPAR product [26,27]. The spatial and temporal consistencies of GEOV1 product were preliminarily evaluated via an inter-comparison with other global products [27,28].
Until now, as the authors’ understanding, most of the FPAR validation works were carried out in America, Europe and Africa [14,20,21,29]. The quality of FPAR products in Asia, particularly in China, still requires validation. Moreover, FPAR product validations have focused primarily on grass and forest areas, but the FPAR data for cropland in Asia has scarcely been validated. The reliability of FPAR products for different biome classes and accuracy variations of FPAR products throughout the growing season in temperate zones also need to be urgently validated [15].
The spatial resolution of the moderate-resolution biophysical parameter product is low; there are many mixed pixels, which has much effect on the pixels’ value [30,31]. Quantitatively evaluating the mixed pixel effect on FPAR product is very important for global moderate resolution product assessment and algorithm development. Several studies have proposed that the mixed land cover may introduce errors to the global product estimation. Martinez et al. [18] found that the MODIS and SEVIRI values rarely exceed FPAR = 0.6, whereas the MERIS FPAR values are concentrated below 0.4. This phenomenon may be partially explained by the lower spatial resolution of these products, the mixed pixel often reduces the real FPAR. The specific biome class within a pixel may be a main source of estimation error because of the different fractional cover and canopy structure [31]. Nevertheless, MODIS land cover misclassifications cannot fully explain the overestimation or underestimation of MODIS FPAR [23,32]. Fang et al. [33] evaluated the biome mixture effect based on MODIS standard land cover. The mixture of biome classes in pixel should also impact FPAR accuracy differentially at different vegetation growth stages [34]. Therefore, the global FPAR product for mixed pixels, such as MODIS, MERIS and GEOV1, must be analyzed based on high resolution land cover or vegetation type data at different vegetation growth stages.
It is worth mentioning that the most notable feature of plains worldwide is the high populations and dense residential distribution. The land area in Chinese plains is also mainly covered by cultivated land and residential area, and the residential areas are sporadically scattered. For moderate-resolution global products in Chinese plains, most pixels are a mixture of cultivated land and residential areas. The sporadically scattered residential areas will likely significantly impact the accuracy of the MODIS, MERIS and GEOV1 FPAR products for their low spatial resolutions in Chinese plains.
Therefore, this investigation will assess and inter-compare the MODIS, MERIS and GEOV1 FPAR products with similar temporal and spatial resolutions over northern China based on the ground measured maize and winter wheat FPAR, considering that these global products cover a large geographical region of China, and will evaluate detailed the residential area in mixed pixel effect on global FPAR product. This study may provide a good foundation for the scientific use of these FPAR products over northern China.

2. Study Area and Methodology

2.1. Study Area

The study areas were located in Changchun city in the central Northeastern China Plain, in the cities of Dezhou and Liaocheng in the central North China Plain (Figure 1). The Northeast China Plain is the largest maize crop planted area. The North China Plain is the most important winter wheat planted area. Maize and winter wheat are the most important crops in northern China. The growth period extends from May to September for the maize in the Jilin province and from October to June of the next year for winter wheat in Shandong province. The key growth stages of maize and winter wheat are listed in Table 1.
The cultivated land area in Changchun is about 1.38 million ha, it accounts for 67% of the total land area, and pixels with a size of 1 km × 1 km containing the cultivated land area account for 90.84% of the total pixels. The cultivated land area in Dezhou and Liaocheng is about 1.07 million ha, it accounts for 57% of the total land area, and pixels with a size of 1 km × 1 km containing the cultivated land area account for 91.73% of the total pixels.

2.2. Data Collection

2.2.1. Field Measured Data

It is quite difficult to ensure that the ground measurements are of the same spatial resolution and the repeated samplings fit into a whole pixel [35]. In this study, the sampling sites were determined prior to the field measurements. The FPAR measurements were repeated three or nine times for each pixel, the spatial distribution of the repeated sampling strategy was also shown in Figure 1, and the averaged values were compared with the FPAR product data at the corresponding pixel. The pixels for ground measurements were chosen in advance, where the crop land area accounts for most of the pixel, so the averaged ground measured FPAR can represent an area of about 1 km2. The measured data are shown in Table 2 and Figure 1.
The maize and winter wheat FPAR were measured using a LI-191SA linear quantum sensor and a LI-250A light meter produced by LI-COR Inc. (Lincoln, NE, USA). The LI-191SA inductive area is 1 m × 12.7 mm, and the inductive wavelength ranges from 400–700 nm with a logging unit of μmol·m−2·s−1. The device calculates FPAR via the relationship between the readings of the above- and below-canopy photosynthetically active photon flux density (PPFD; in μmol·m−2·s−1). The logged data are the averaged PAR in the inductive area that can reduce the spatial heterogeneity effect. LI-250A logged the result, which was read and recorded manually. Four fractions of PAR were measured at each sampling site: (1) the incidence PAR above the canopy (PARci) was measured by placing LI-191SA above the canopy by about 50 cm and directing the inductive area upward, (2) the PAR transmitted through the canopy (PARgi) was measured by placing LI-191SA above the soil background by about 10 cm and directing the inductive area upward, (3) the PAR reflected by the soil background (PARgr) was measured by placing LI-191SA above the soil background by about 10 cm and directing the inductive area downward, (4) the PAR reflected by the canopy (PARcr) was measured by placing LI-191SA above the canopy by about 50 cm and directing the inductive area downward. The FPAR is calculated from these four fractions as follows [36]:
F P A R = ( P A R c i - P A R c r ) - ( P A R g i - P A R g r ) P A R c i

2.2.2. MODIS, MERIS and GEOV1 FPAR Products

Comparatively, the MODIS, MERIS and GEOV1 FPAR products are relatively continuous data sources for northern China, their spatial and temporal resolutions are relatively good and are similar (Table 3). Therefore, the MODIS, MERIS and GEOV1 FPAR products were selected in this study for assessment and inter-comparison analyses, they were downloaded from the online websites [3739]. The detailed introductions of these FPAR products have been described in a number of papers [7,14,28,4043], and the brief comparison among these FPAR products’ properties can be seen from Table 3.

2.2.3. Residential Area Percentage Data

The raster data of land use types’ area percentage with pixel size of 1 km × 1 km were aggregated from land use shape file, which has been interpreted manually from Landsat TM images [44]. The crop land and residential area percentage raster data in mixed pixels were also calculated. So, we can get the residential area in mixed pixels from this raster dataset.
To evaluate residential area effect on the accuracy of the MODIS, MERIS and GEOV1 FPAR products, three types of pixels were analyzed, which included the pure cultivated land pixels, pure residential pixels and the mixed pixels that only consisted of cultivated land and residential areas. In total, the mixed pixels containing maize and residential areas account for 55.75% of all the pixels in Changchun. The mixed pixels containing winter wheat land and residential areas account for 82.32% of all mixed pixels in Dezhou and Liaocheng regions.

2.3. Methodology

The MODIS, MERIS and GEOV1 FPAR data were validated by direct comparison against ground measured data and by inter-comparison among these FPAR products based on two different biomes at different growth stages. In this study, the valid FPAR values of the three global products were counted for analysis, the pixel values exceeding the valid range of FPAR values were excluded.
The repeated ground measured FPAR were averaged as the mean FPAR used for direct comparison with FPAR product. For the inter-comparisons among these FPAR products, all of the valid FPAR values were used for comparison. The frequencies of three FPAR products at each of the key growth stages for maize and winter wheat were also inter-compared, respectively. The least-squares linear regression (LSLR) method was used for validation analysis between ground measurement FPAR and global FPAR product, and was also used for comparison analysis among the three global FPAR products.
The residential areas’ percentages were statistically analyzed at the interval of 10%, and the FPAR data in mixed pixels corresponding to each interval were averaged and then regressed with residential area percentage intervals. The quadratic polynomial regression was used for fitting relationship between the residential area percentage in mixed pixel and the valid FPAR values of global products.
The regression determination coefficient (R2) and root mean square error (RMSE) were used to evaluate the relationships of the FPAR products with ground measured data and the inter-relationships of the FPAR products. The R2 and RMSE values were calculated using the following formulas:
R 2 = [ cov ( x , y ) s t d ( d ) * s t d ( y ) ] 2
R M S E = i = 1 n ( Y mod - Y m e a ) 2 n - 1
where Ymod is the estimated FPAR, Ymea is the ground measured FPAR and n is the sample number, cov and std represent the covariance and the standard deviation, respectively.

3. Results and Analysis

3.1. FPAR Validation of MODIS, MERIS and GEOV1 Products Based on Ground-Measured FPAR Data

Figure 2 shows that the maize MODIS, MERIS and GEOV1 FPAR products differed obviously with the ground-measured FPAR. The linear regression R2 values were 0.630, 0.744 and 0.818, respectively. The GEOV1 FPAR regression slope and intercept were separately very close to 1 and 0. For the later periods, such as the silking and milking stages when maize shows large FPAR values, the MODIS and MERIS FPAR products markedly underestimated the values compared with the ground-measured FPAR, but GEOV1 FPAR product showed great estimation results and were close to the ground measured FPAR.
Figure 3 shows that the linear regression R2 values for ground-measured winter wheat FPAR with MODIS, MERIS and GEOV1 FPAR products were 0.432, 0.488 and 0.655, respectively. The regression slopes were all significantly deviated from 1, and the intercepts all exceeded 0.1. Overall, the MODIS, MERIS and GEOV1 FPAR data all markedly underestimated the winter wheat FPAR compared with the ground-measured FPAR.
Based on the analysis described above, we determined that GEOV1 FPAR products correlated relatively well with the ground-measured FPAR, and showed better retrieved FPAR than MODIS and MERIS, especially for high FPAR values. It is necessary to understand the inter-relationships or consistencies among these global FPAR products, at different crop growth stages. The MODIS, MERIS and GEOV1 FPAR products for maize are slightly more reliable than winter wheat. It can be seen that the FPAR data of the same global products are obviously different for different biome types. So, the land cover mixture of different biomes may have a significant effect on the FPAR retrieval of global FPAR data. In addition, most pixels of the global FPAR products are mixed pixels being composed of several different land cover types; the FPAR values should be affected greatly by the land cover mixture, and were affected differently at different crop growth stages.

3.2. Inter-Comparison among MODIS, MERIS and GEOV1 FPAR Products

3.2.1. Comparison of FPAR Frequency Distributions of MODIS, MERIS and GEOV1 at Different Growth Stages

Figure 4 shows that the MODIS, MERIS and GEOV1 FPAR clearly indicated the variation of the maize FPAR at different growth stages. Furthermore, the FPAR interval frequency distributions of the maize MODIS product differed among different years. The maize FPAR values were often high in its growing period. During the silking and tasseling stages, most of the high maize FPAR values ranged from 0.7–0.85 for the MODIS products, from 0.75–0.85 for the MERIS FPAR products and were from 0.85–0.95 for the GEOV1 FPAR data. Moreover, the GEOV1 FPAR also showed very centralized distributions at high FPAR values. At the mature stage, the MODIS and MERIS FPAR values were often below 0.6, but the GEOV1 FPAR mostly ranged from 0.6–0.8. At the three-leaf stage, MODIS and MERIS FPAR were comparatively much more centralized in the interval of 0.15, but GEOV1 FPAR was relatively evenly distributed around 0.2.
Overall, the winter wheat FPAR showed low inter-annual differences compared to the maize FPAR; all three products also clearly presented the changing trends for different growth stages. For the three products, the winter wheat FPAR rarely exceeded FPAR = 0.85, which is markedly lower than the maize FPAR products (Figure 4).
At the seeding, tillering and reviving stages, most winter wheat FPAR values for the three products were very concentrated. However, the FPAR of these products were not as concentrated for other growth periods. During the heading and milking stages, the MODIS and GEOV1 FPAR frequencies showed similar distributions, whereas the MERIS FPAR products showed different FPAR values frequencies with MODIS and GEOV1 FPAR products.
FPAR product has been recognized as an important data source in data-driven ecosystem productivity estimation methods [12]; the users need to choose the most appropriate product as the simulation model’s input [16]. These studied results indicated that users should take into consideration FPAR product difference for different vegetation biomes and different growth stages when choosing the global FPAR products for simulation model input.

3.2.2. Inter-Relationships of MODIS, MERIS and GEOV1 FPAR Data

The inter-relationships of MODIS, MERIS and GEOV1 FPAR data were quantitatively fitted by linear regression (Figure 5 and Tables A1 and A2). Figure 5 shows the inter-relationships of the MODIS, MERIS and GEOV1 maize FPAR at the key growth stages. The regression R2 and RMSE values markedly differed between different years and by crop growth stage. The regression R2 values for a single growth stage rarely exceeded 0.5, but the R2 values of the entire growth periods ranged from 0.5–0.831. The RMSEs for the entire growth period in a year were close to 0.01 and were also somewhat higher than that for a single growth stage. For each stage and the whole growth period of both maize and winter wheat, the regression slopes and intercepts are all significantly different from y = x (slope = 1 and intercept = 0) at the 0.01 probability level, and the regressions R2 are also all significant at the 0.01 probability level, except that the regression intercepts are significantly different from y = x at the 0.05 probability level at maize silking stage in 2008 between MODIS and GEOV1 FPAR data and at the winter wheat seeding stage in 2009 between MODIS and MERIS FPAR data.
In general, for the comparisons of FPAR in the entire year, the inter-relationships regressions also differed from 2006–2010. For maize, the regression R2 in a whole growth period was much obviously larger than that in a single growth stage. However, for the winter wheat, the regression R2 in a whole growth period was similar to that in a single growth stage. The regression R2 values among three FPAR products for winter wheat were obviously higher than those for maize. The inter-relationship regression R2 values for winter wheat FPAR exceeded 0.65, and most regression R2 values for maize FPAR products ranged from 0.249–0.831. The regression RMSE for winter wheat ranged from 0.004–0.011, the slopes all exceeded 0.7, and the intercepts were below 0.114. However, the regression RMSE for maize ranged from 0.009–0.038, the slopes are above 0.504, and the intercepts were below 0.246.
Overall, the regressions between MERIS and GEOV1 FPAR showed good consistency or inter-relationship, which showed relatively large R2 and small RMSE values.

3.3. Effect of Residential Areas in Mixed Pixels on the Accuracy of the Crop FPAR Product

The spatial resolutions of global FPAR products are generally low. The pixels in crop land area in Chinese plains are mostly mixed with the scattered distributed residential area. The percentage of residential areas in the mixed pixels significantly impacts the FPAR product. As the percentage of residential areas in a mixed pixel increases, the FPAR fluctuates greatly and shows different variations for different crop growing stages (Figure A1). To clearly understand the variations obtained as a result of different percentages of residential areas, the FPAR product for different crop growing stages were analyzed in detail over several years.
The FPAR data were averaged from 2006–2010. In Figures 6 and 7, residential areas’ percentage is 0% which indicated the pure crop land area pixel with no residential area. The averaged FPAR (in y-axis) at 10% (in x-axis) indicated the averaged FPAR of the pixels including residential area ranging from 0–10%, and the other averaged FPAR values were homologously calculated.

3.3.1. Maize MODIS, MERIS, GEOV1 FPAR

Figure 6 shows that the FPAR data from the seeding stage to the seven-leaf stage were only slightly affected by the residential areas in a mixed pixel. However, the residential area in mixed pixel significantly affected the FPAR data from the jointing stage to mature stage; the FPAR products were most obviously affected by residential area at silking and tasseling stages, which are followed by the milking, jointing and mature stages. Generally, the residential area made little effect on FPAR value when it accounted for below 30% in a pixel, and then made a large, obvious effect on FPAR value in the mixed pixel where residential area percentage was above 30%.
The FPAR value in the mixed pixel negatively correlated with the percentage of residential area in a mixed pixel. This relationship was depicted well by a quadratic polynomial fitting; it can be used to simulate the effect of the residential area in a mixed pixel on the global FPAR product (Table 4).
From the jointing stage to the mature stage, almost all of the R2 values for the fitted relationships exceeded 0.98, and the percentage of residential area was found to significantly affect the FPAR data. Even at other stages, the R2 values of the fitting relationships still exceeded 0.74. For most maize growth stages, the fitted RMSE of GEOV1 values were smaller than those of MODIS and MERIS FPAR. By the way, for pure cultivated land, the largest MODIS and MERIS FPAR data reached nearly 0.8; they were slightly lower than the largest GEOV1 FPAR which is close to 0.9.

3.3.2. Winter Wheat MODIS, MERIS, GEOV1 FPAR

Overall, the MODIS and MERIS FPAR data at the seeding and reviving stage were only slightly affected by the residential area in a mixed pixel. For the other winter wheat growth stages, the residential area in a mixed pixel strongly affected the MODIS and MERIS FPAR. The residential area markedly affected the GEOV1 FPAR data for all stages (Figure 7). Additionally, the FPAR products were most obviously affected by residential area at milking and heading stages, which are followed by the mature and jointing stages. Generally, the residential area made little effect on FPAR value when it accounted for less than 50% in a pixel, and then made a somewhat obvious effect on FPAR value in the mixed pixel where residential area percentage was above 50%.
The FPAR values negatively correlated with large residential area percentages. The quadratic polynomial fitting relationships can be used to effectively estimate the effect of residential area on global winter wheat FPAR product (Table 5). The R2 values of the fitting relationship almost exceeded 0.9, except for the MODIS and MERIS FPAR data at the seeding stage.
By the way, the largest MODIS and MERIS FPAR data were each slightly higher or smaller than 0.5, and they were obviously smaller than the largest GEOV1 FPAR, which reached 0.6.
Although, maize FPAR products’ data were close to ground measured data and winter wheat FPAR products were markedly smaller than the ground-measured data (Figures 2 and 3). Furthermore, compared with winter wheat crop, the fitting R2 values between maize FPAR and residential area percentage were slightly larger and the RMSE values were smaller. However, the maize FPAR products were quite obviously affected by the residential area in mixed pixel, compared with winter wheat FPAR (Figures 6 and 7). Therefore, the effect of residential area percentage in mixed pixels on FPAR values differentiate for different crops, and this was not necessarily in accordance with the FPAR product accuracy.

4. Discussion

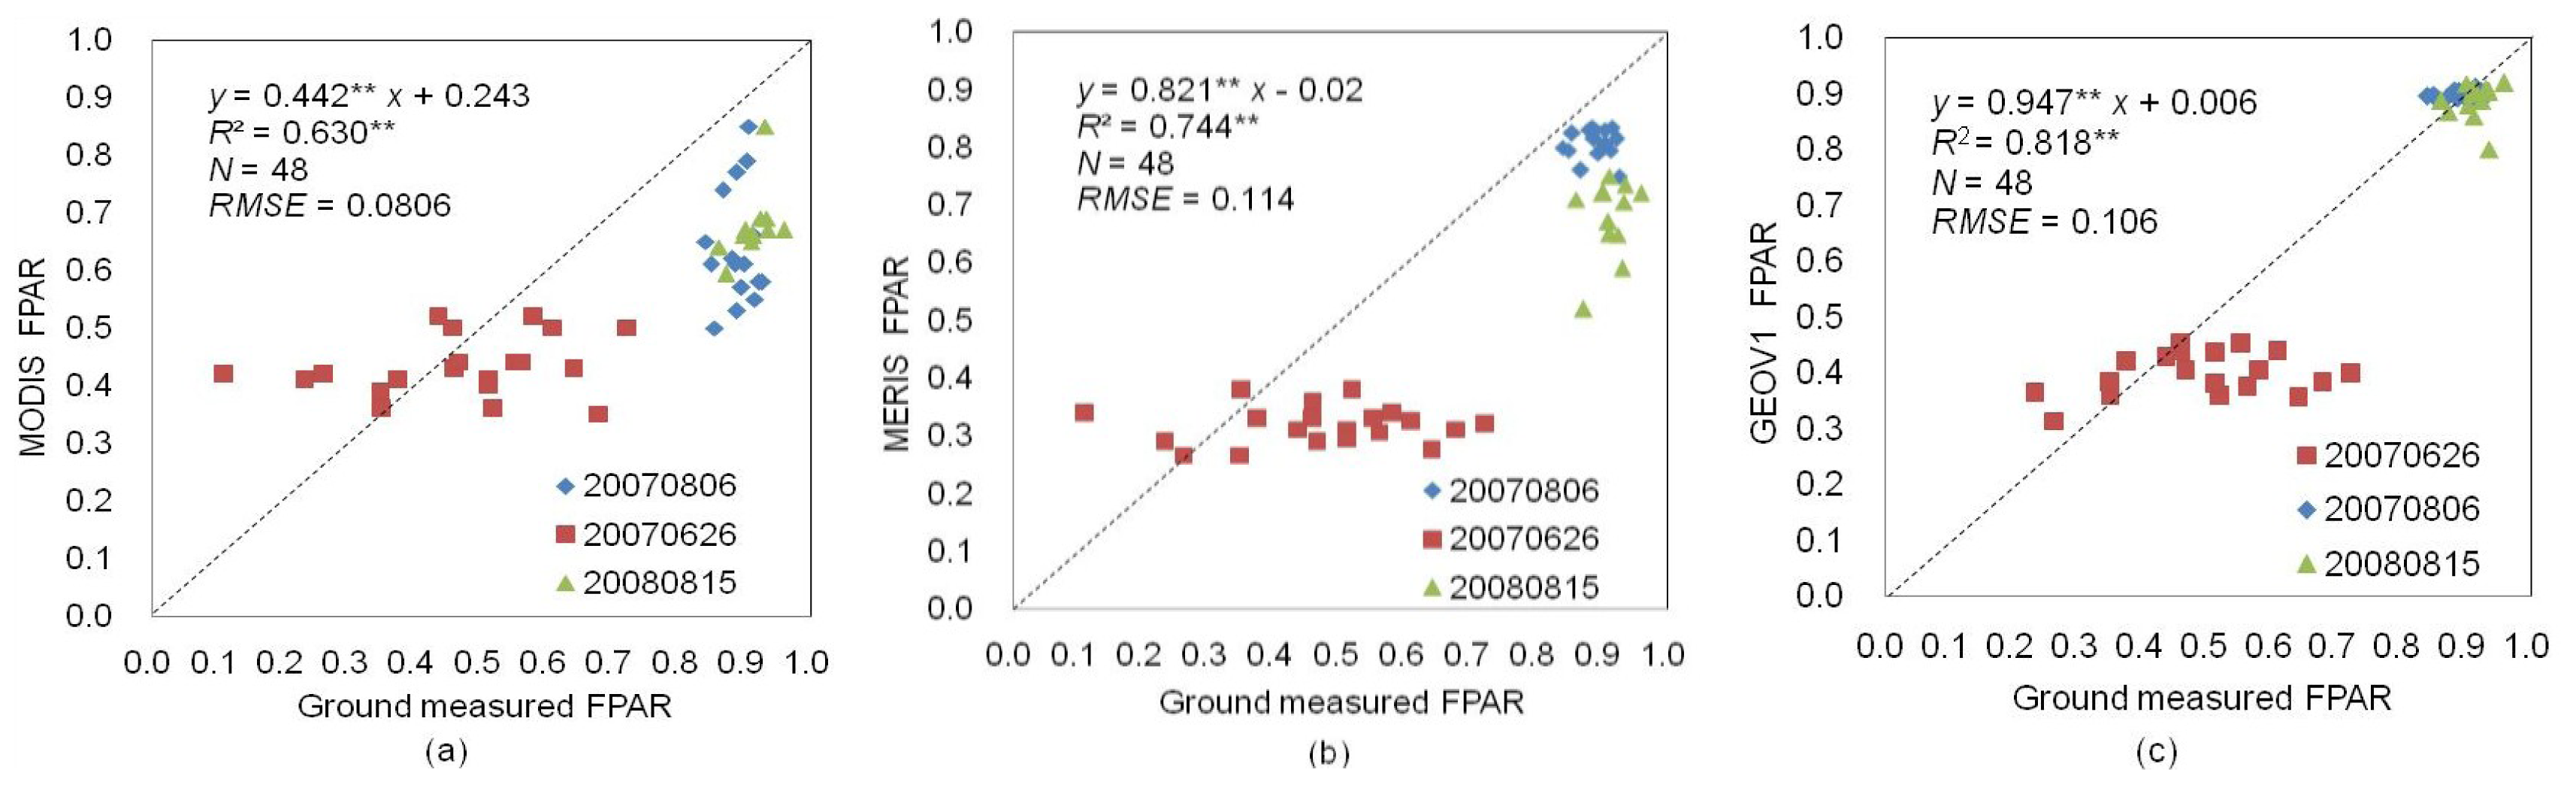
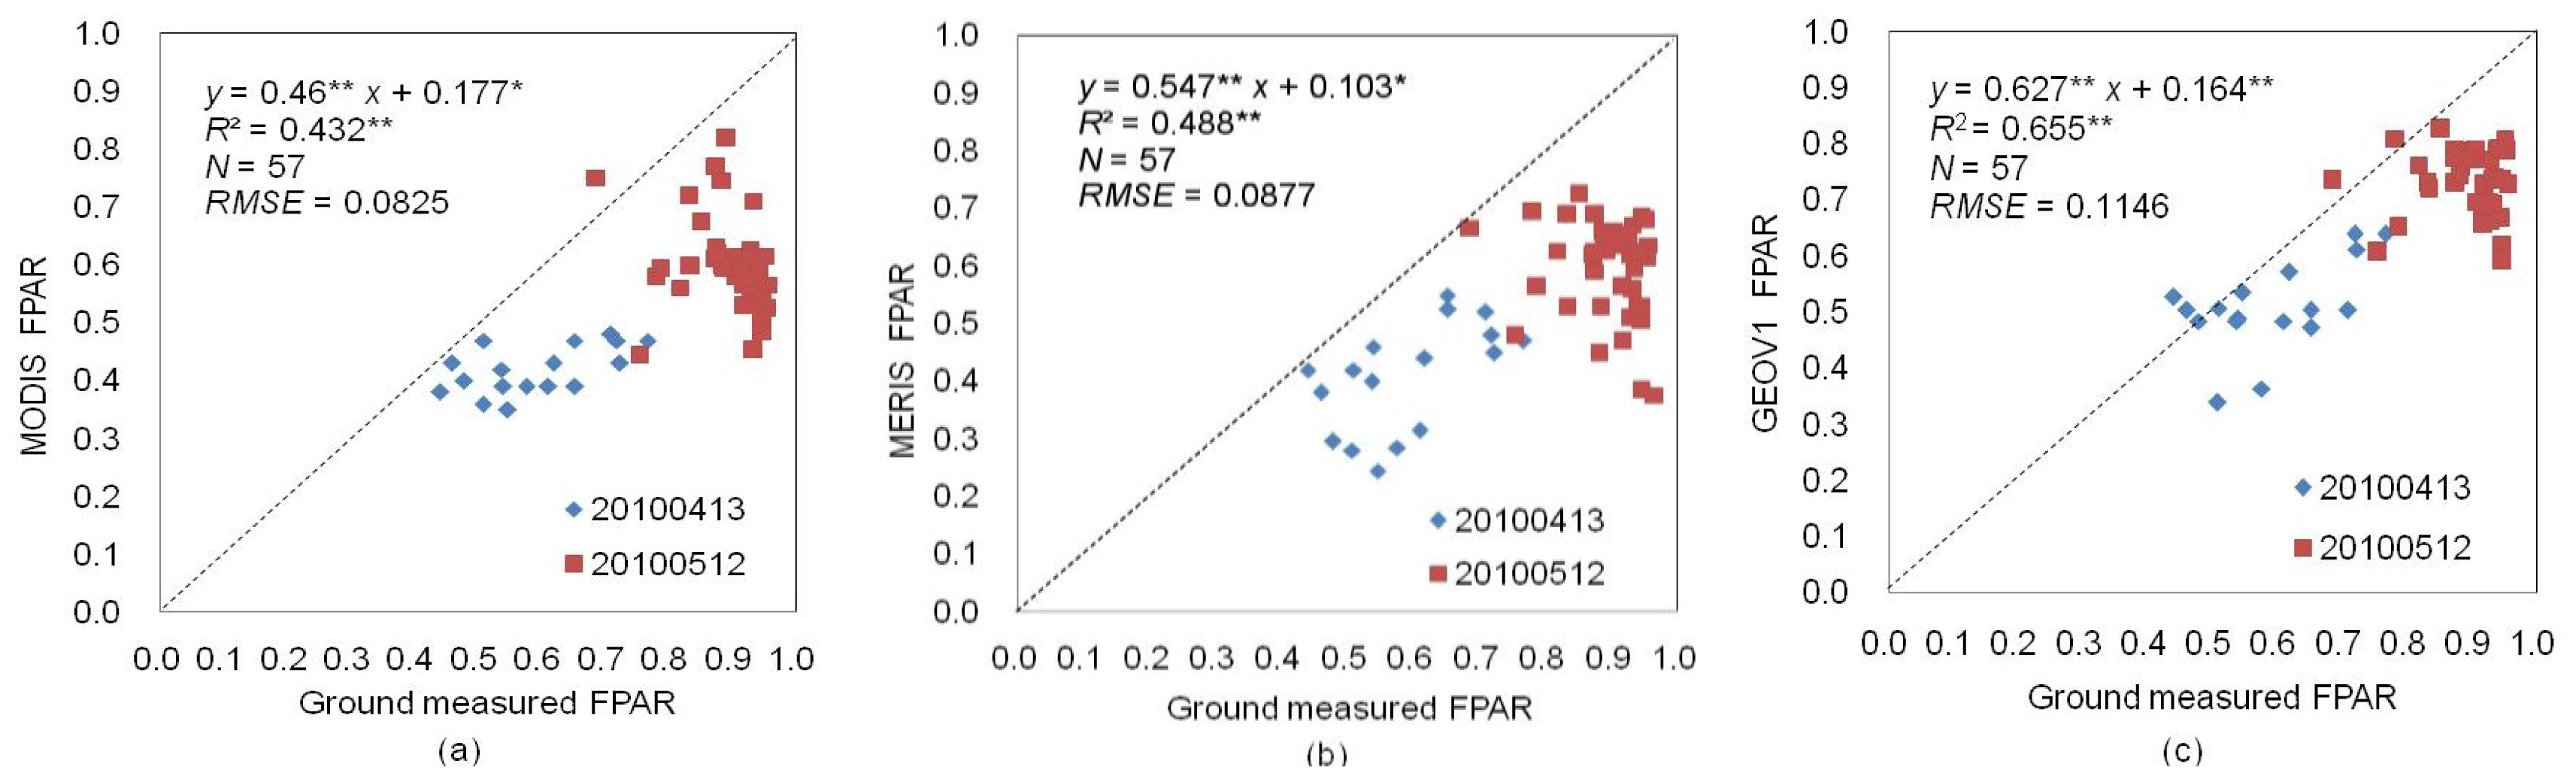
Compared with the ground-measured FPAR, the MODIS, MERIS and GEOV1 global FPAR products all yielded different estimation results for maize and winter wheat. The studied results showed that the MODIS FPAR data are relatively close to the ground-measured data for small FPAR values and obviously higher than the ground-measured data for large FPAR values, these results are similar to those obtained from other studies [19]. Comparatively, the GEOV1 product can estimate the FPAR relatively well and reliably, particularly for high FPAR values. Camacho et al. [28] also found that the regression R2 of GEOV1 FPAR products with ground measured data were larger than MODIS FPAR product. The overall uncertainties (RMSE) of the three products ranged from 0.0806–0.1146 which are close to the required target accuracy (0.05 for FPAR). The mixture of land covers or biomes have a significant effect on biophysical parameters product accuracy, such as on LAI [33,
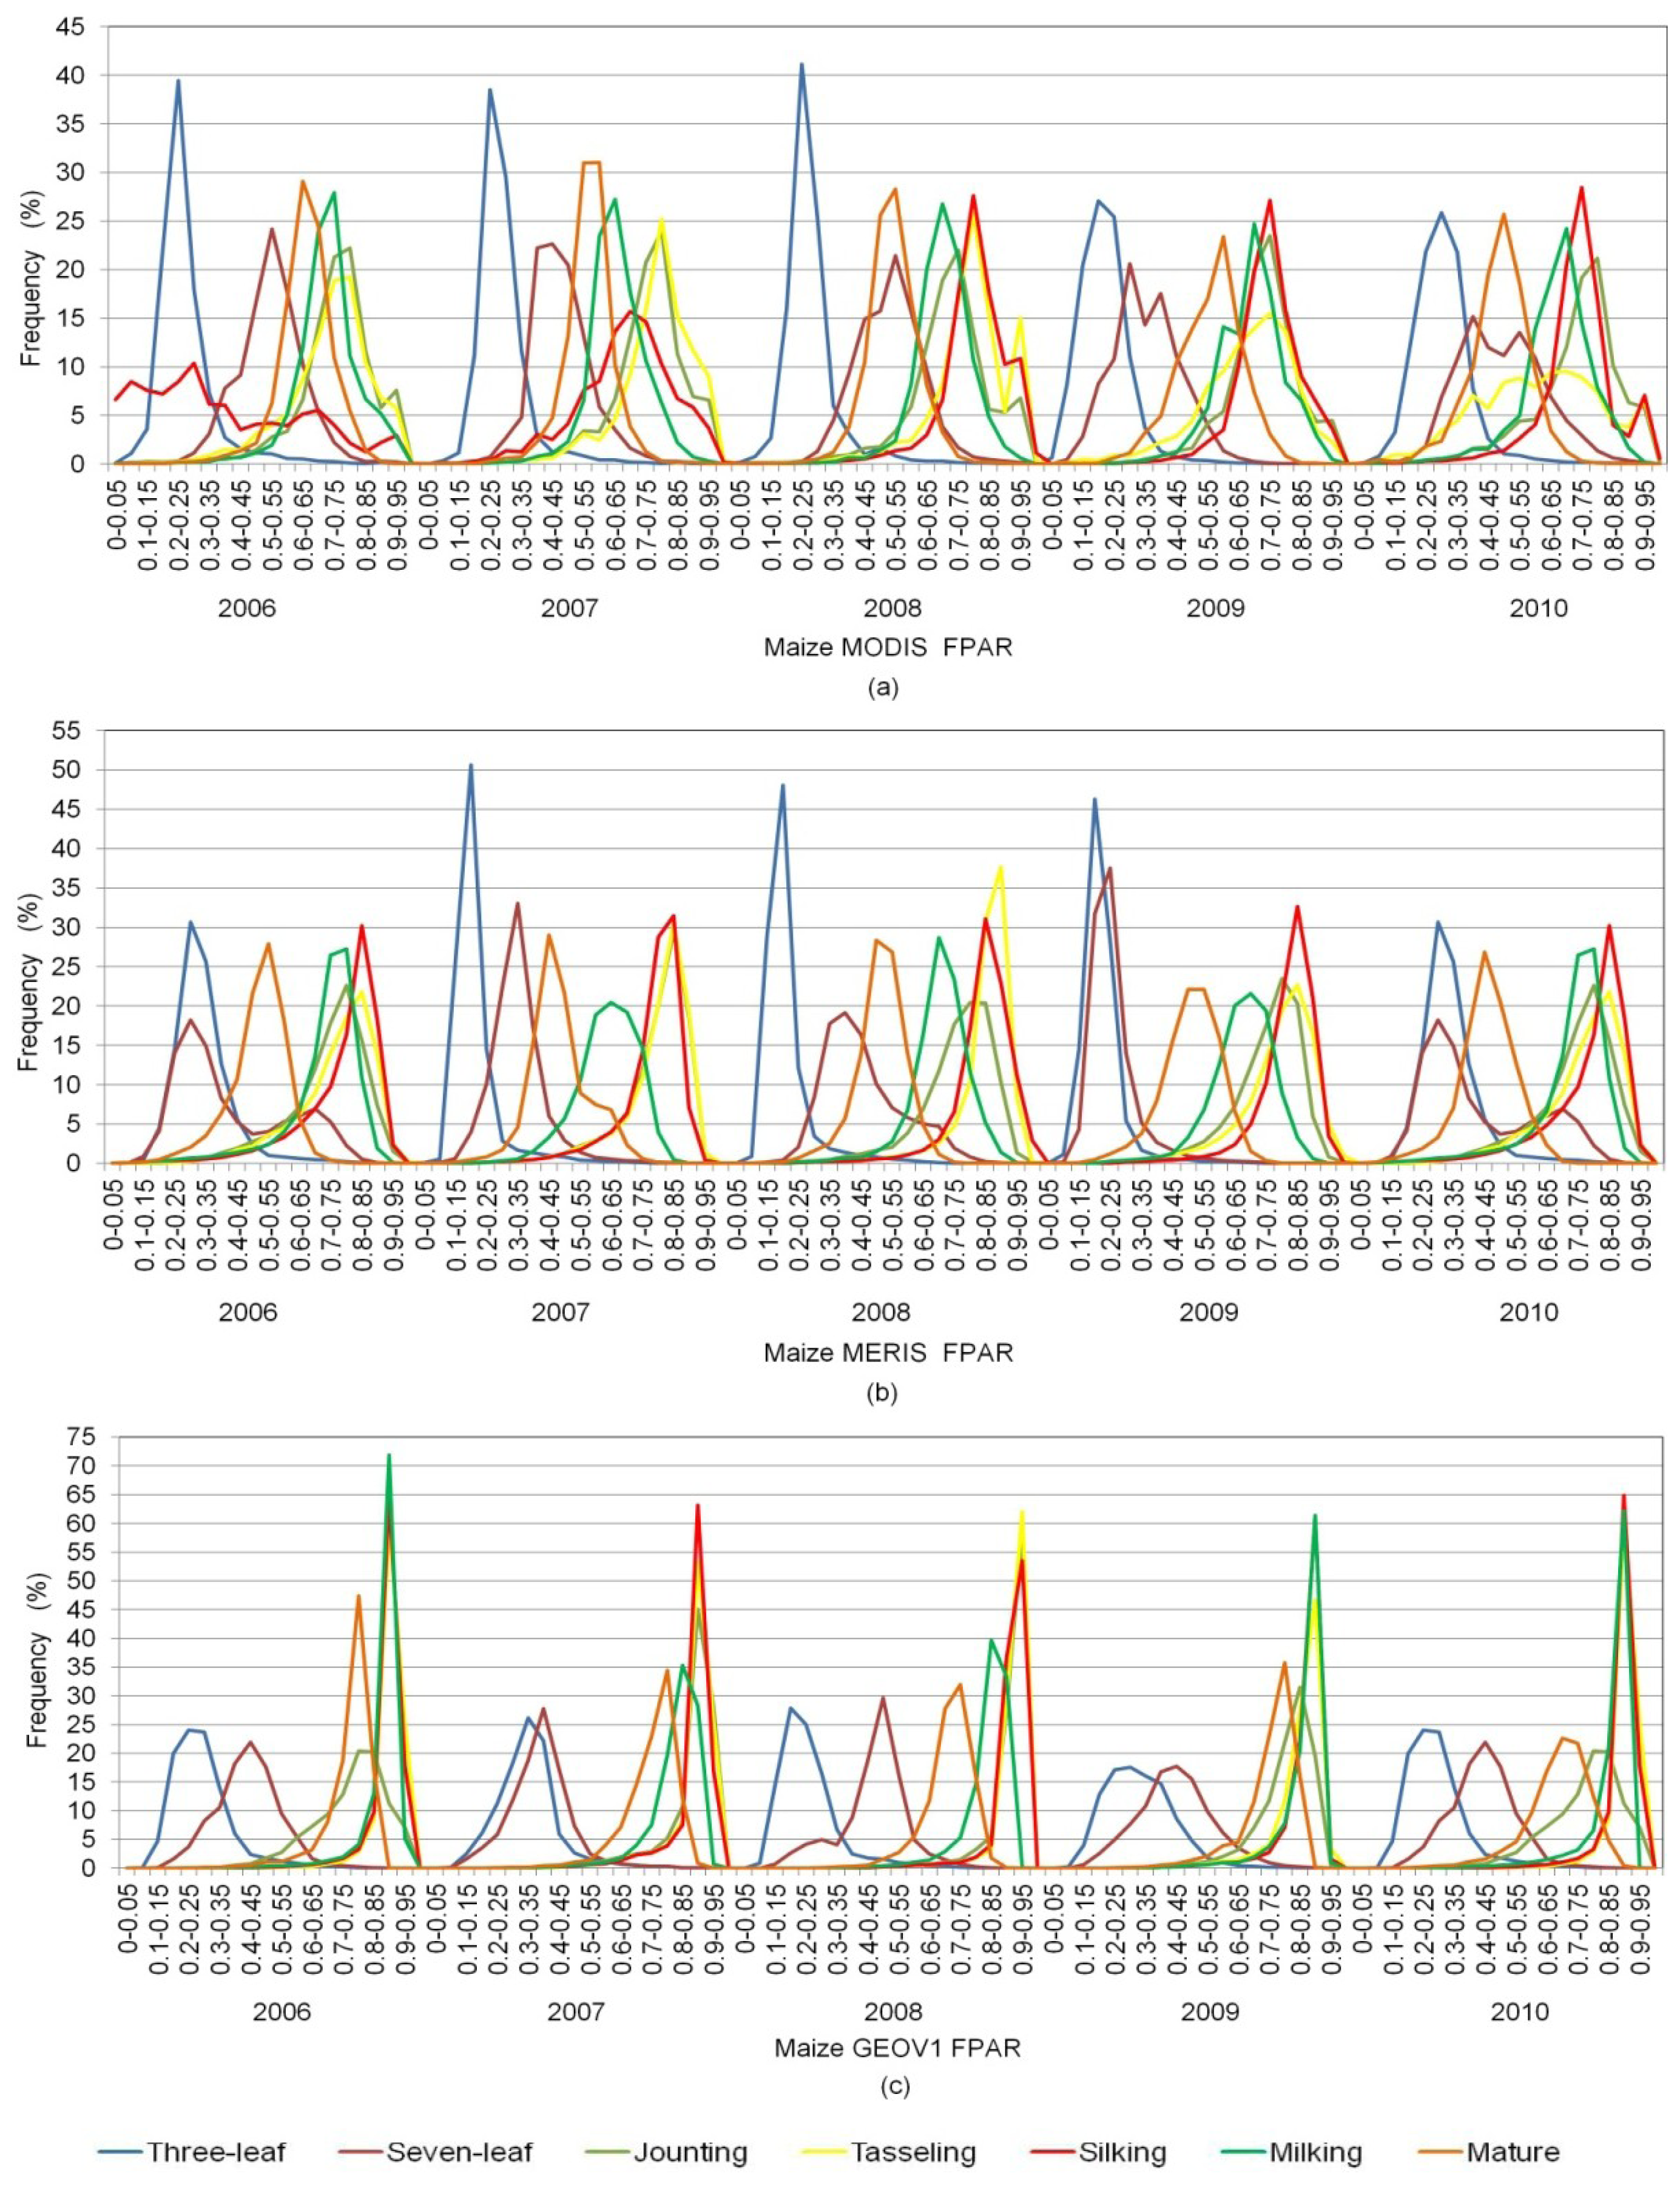
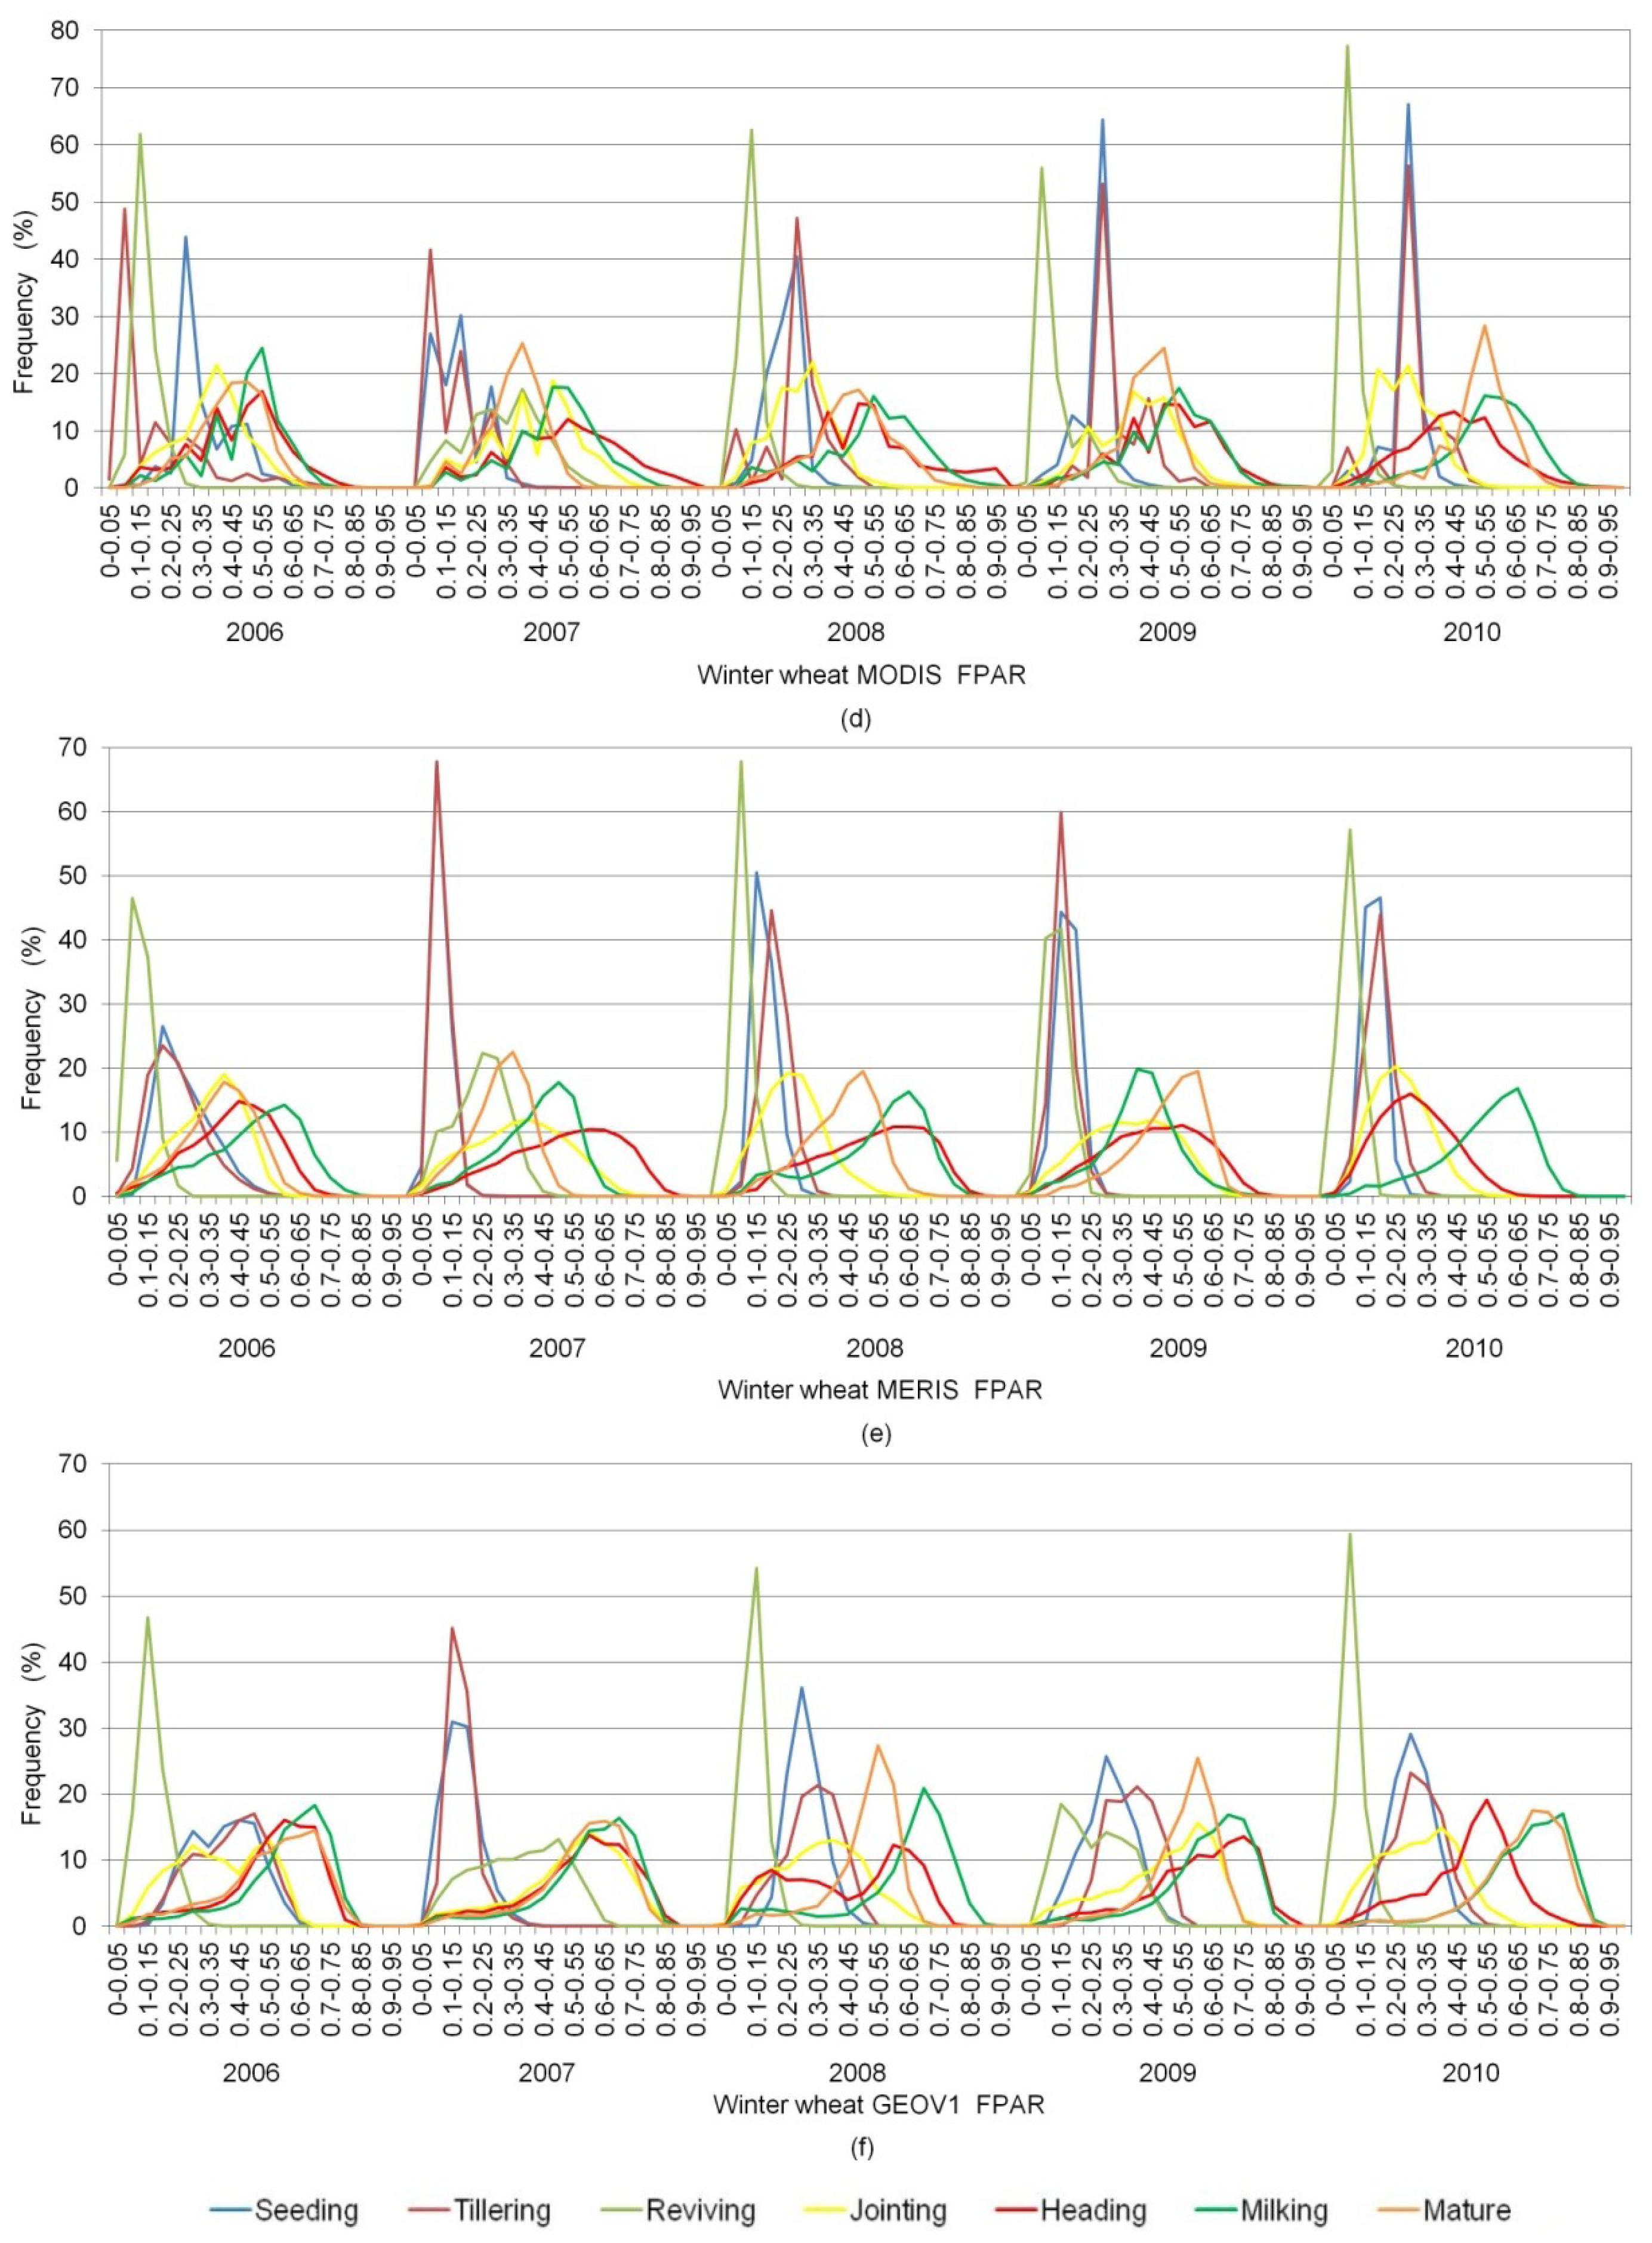
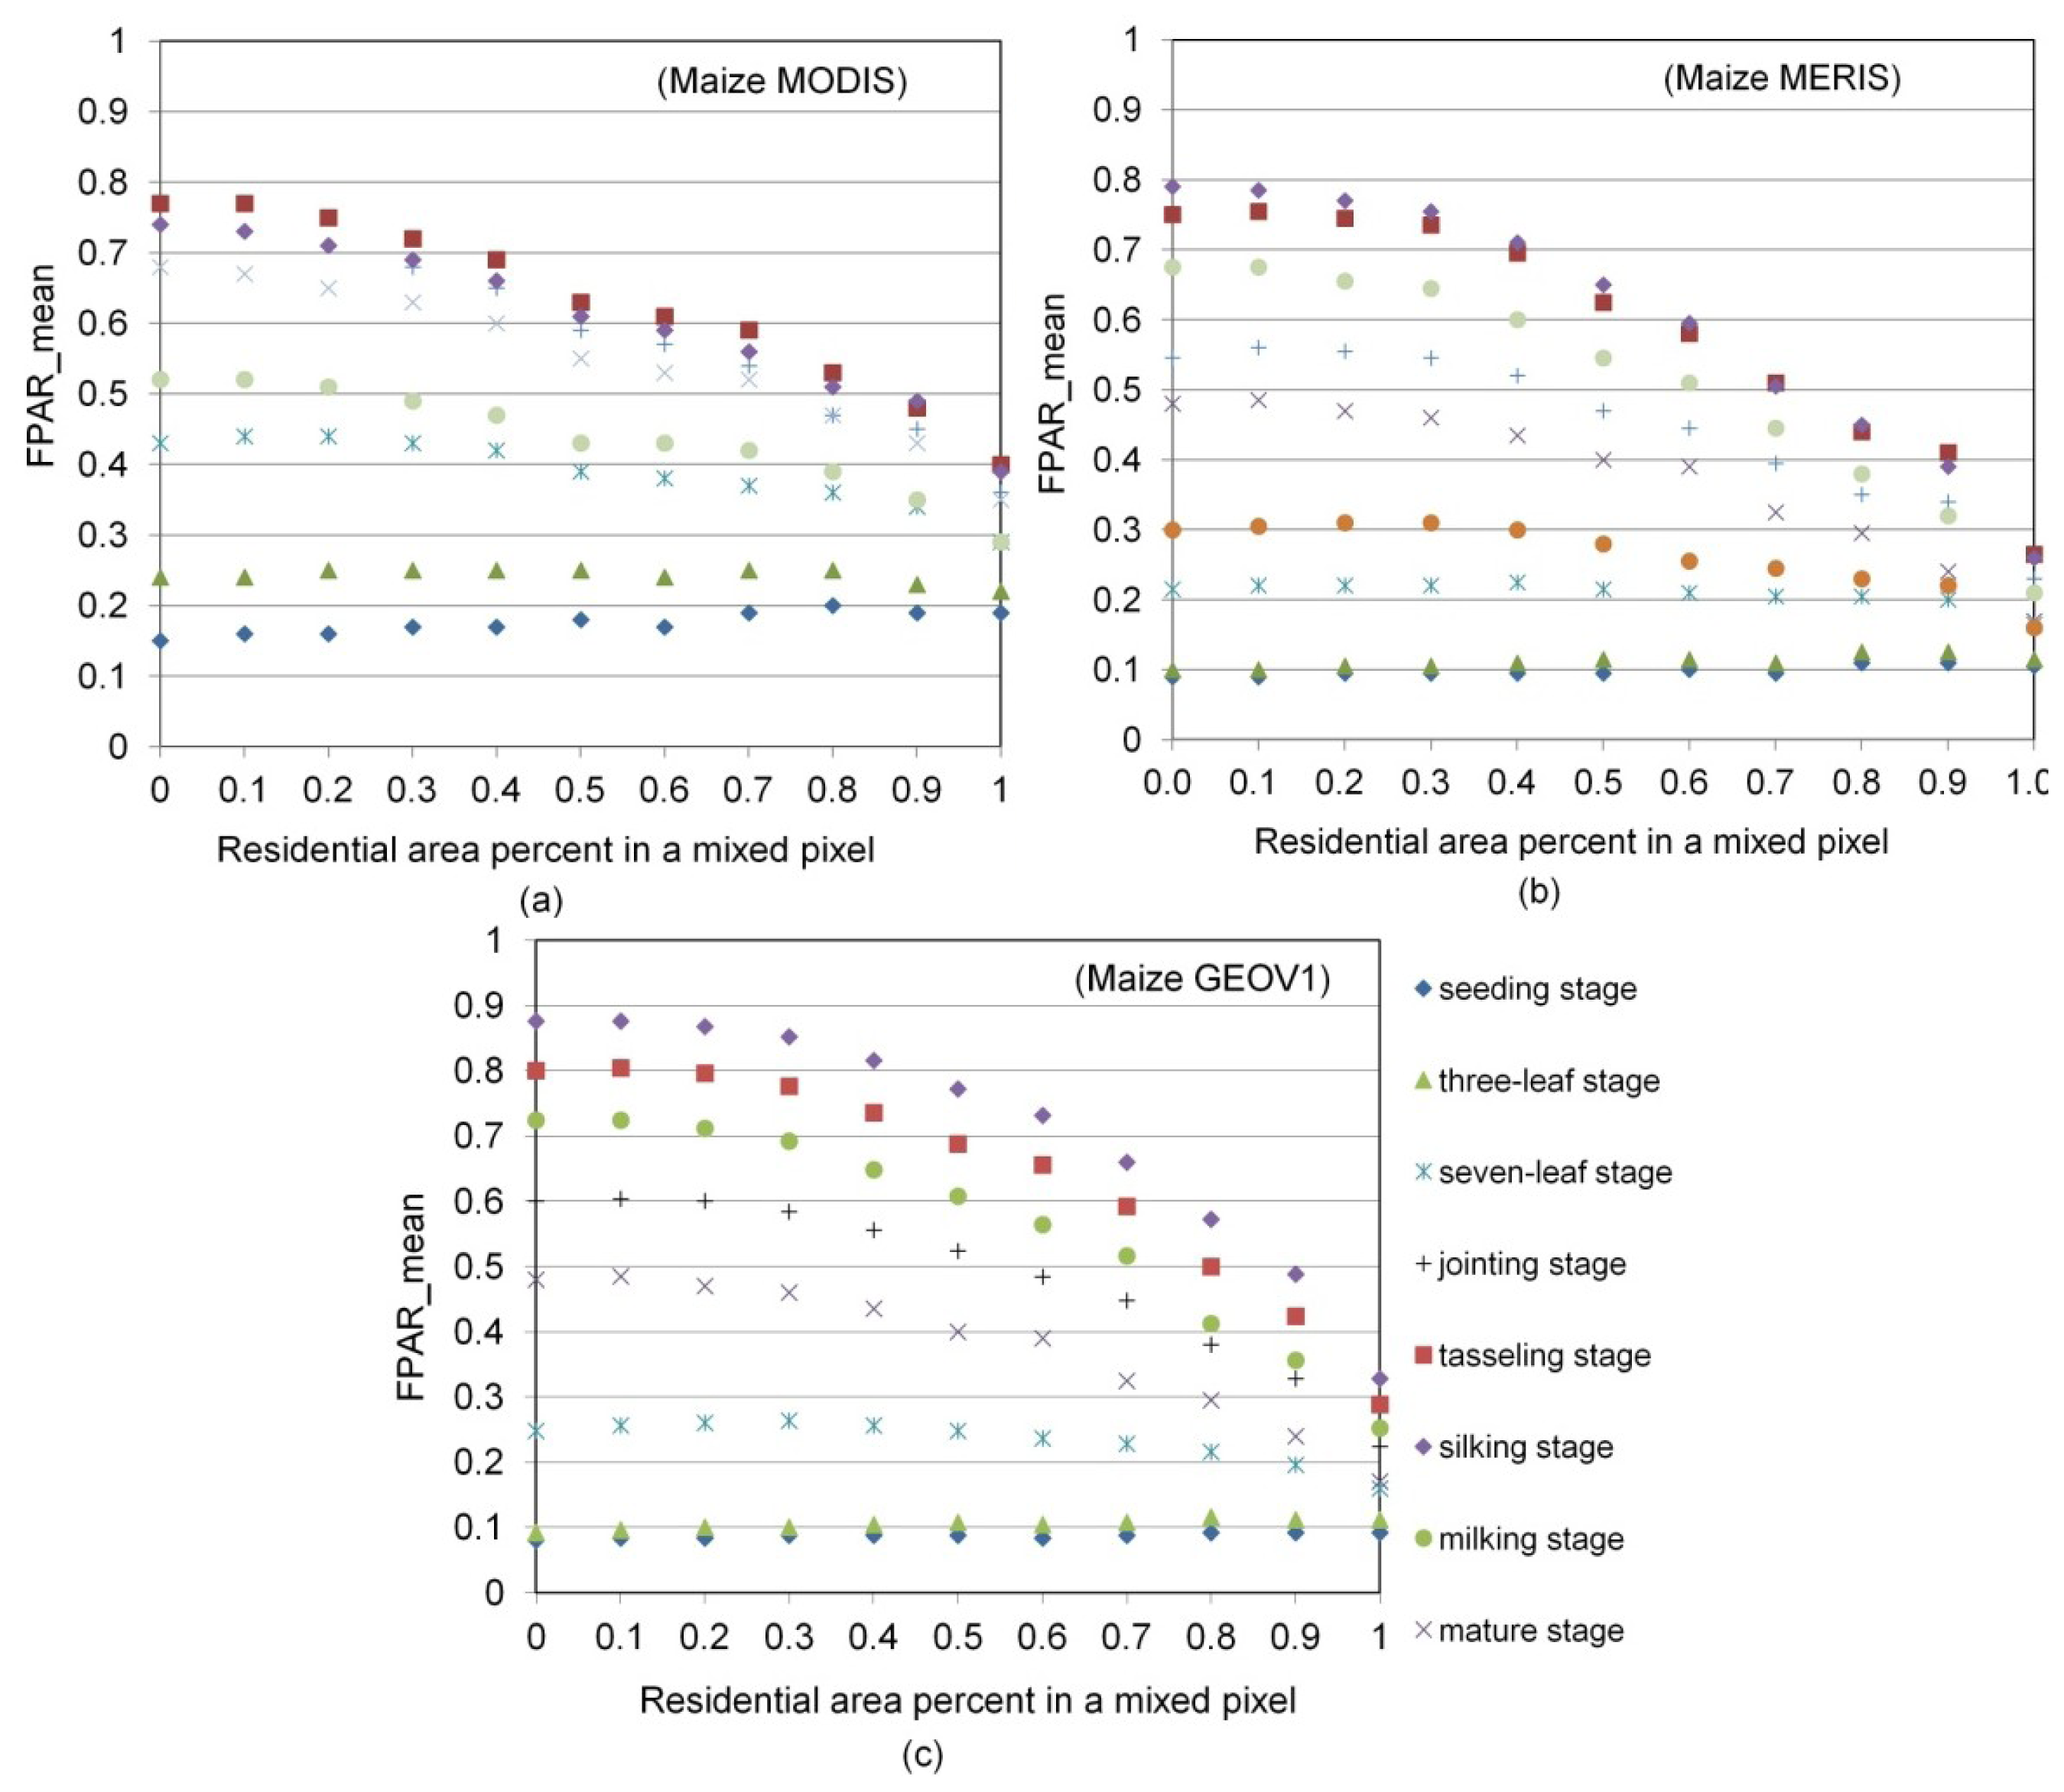
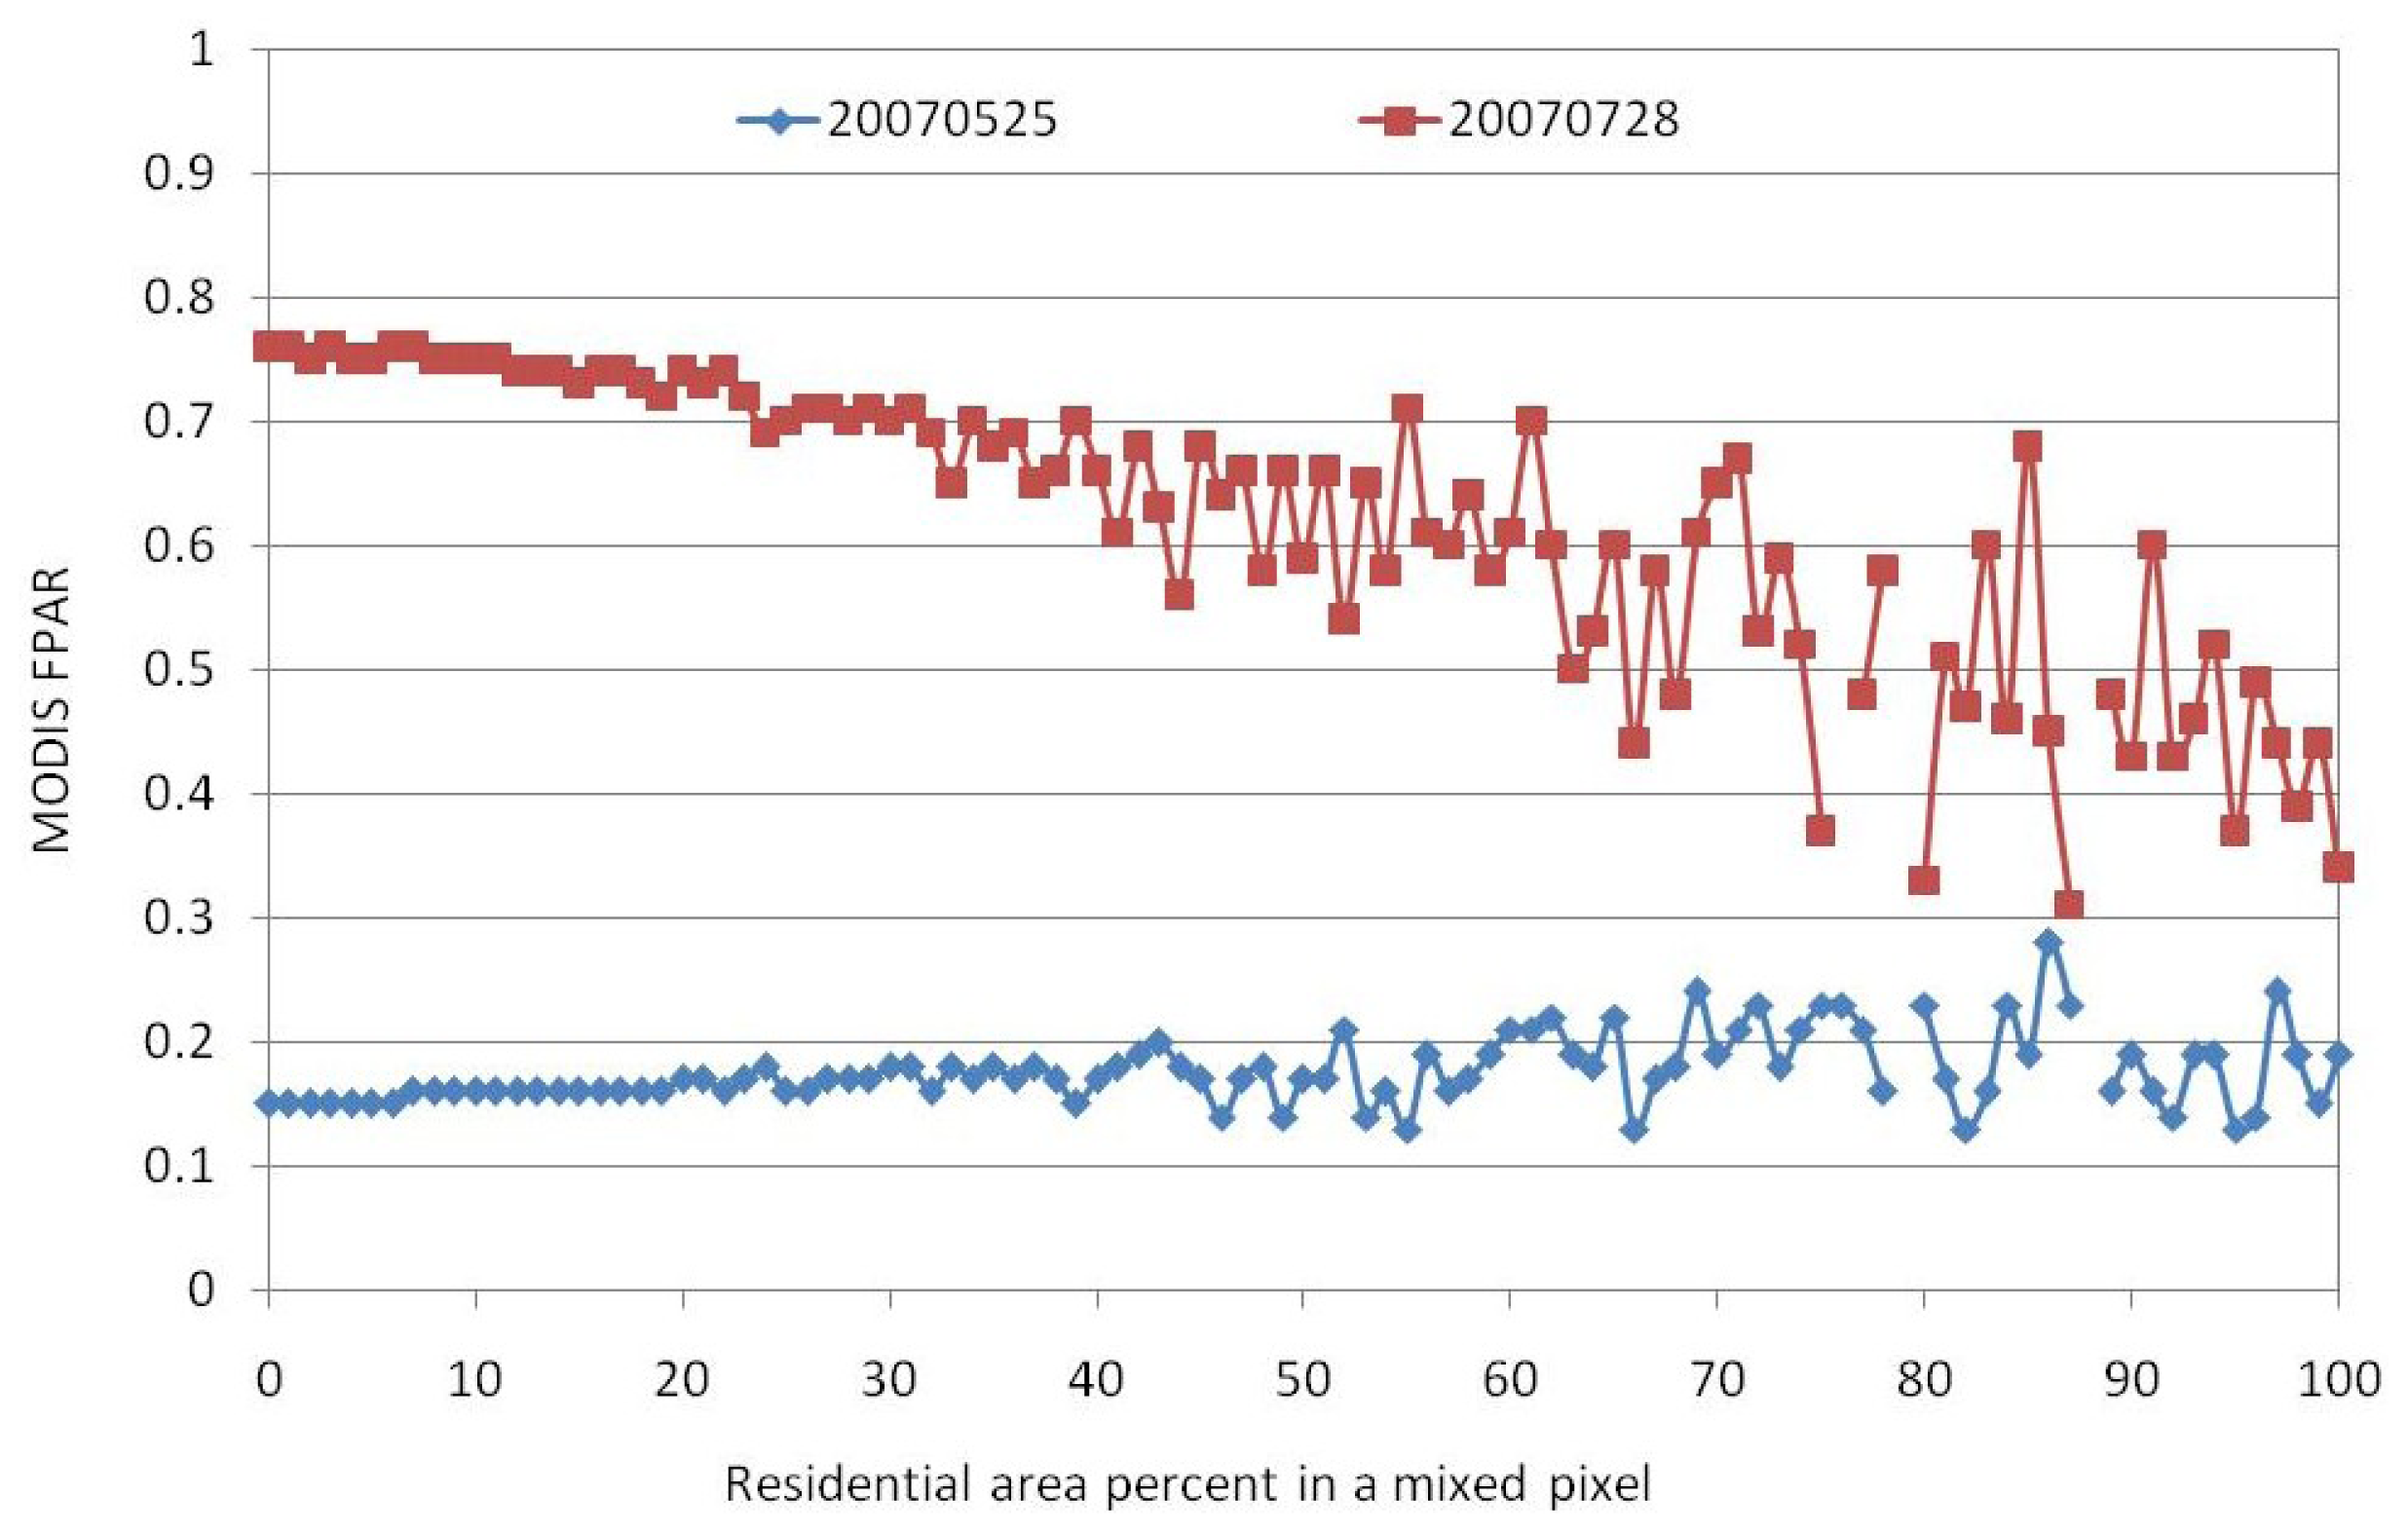
45]. This study investigated earlier the residential area in the mixed pixel effect on FPAR accuracy, and found they had a different effect on different crops and different growing stages. This study also showed that residential area in mixed pixels affect greatly the FPAR accuracy especially for residential area percentages above 50%.
It is very important to collect reliable ground measured FPAR data for product validation and even for its utilization in modeling communities [46]. At present, a few instruments have been widely used, such as the Decagon AccuPAR ceptometer [15,23], tracing architecture and radiation of canopies (TRAC) [20], LI-191SA line quantum sensors or LI-190SZ (LI-COR Inc., Lincoln, NE, USA) [47,48], TM Cava devices line quantum sensor [49] and SKYE PAR quantum sensors (SKP 215 and SKR 110) [21]. Serbin et al. [19] found MODIS C5 FPAR product follows well the temporal evolution of LAI-191SA FPAR data. In this study, the LI-191SA was used for the FPAR measurement.
Moreover, only two parts of the canopy photosynthetically active radiation—the above- and below-PAR—were usually recorded at each spot during the ground measurement, and their ratios were usually calculated as FPAR. However, the soil background or the understory vegetation also absorbed the photosynthetic active radiation, and they should be excluded in the FPAR measurement. Therefore, in this study, the line quantum sensor of LI-191SA was used to measure four fractions above and below the canopies: the incident and reflected PAR above the canopy as well as the incident and reflected PAR below the canopy, and to compute the FPAR data. Meanwhile, three or nine measurements were taken at each sampling site, to reduce the random measurement error of FPAR. They were then averaged to the final FPAR for comparison with global FPAR products. The sampling sites or pixels were determined before carrying out the field measurements, to ensure the ground measurements can represent effectively the actual FPAR value in the exact pixel for comparison. In addition, the study areas for maize and winter wheat are both located in the plains, the topography influence can be ignored. These measurement strategies and conditions can reduce the measurement errors as much as possible.
The studied results showed that residential area in mixed pixel markedly affects the global FPAR product accuracy, although the land cover misclassification introduces small errors to the FPAR products. Meanwhile, the effect of residential area percentage in mixed pixels on FPAR values differ for different crops, and this was not necessarily in accordance with the FPAR product accuracy. Wu et al. [50] found that the cultivated land area errors of MODIS land cover data in the Jilin and Shandong provinces are 34% and 15.7%. In Changchun city, Dezhou and Liaocheng city, 91% and 81% of all pixels are mixed pixels that contain cultivated land area. The mixed pixels that only contained cultivated land and residential areas accounted for approximately 71% and 56% of all pixels, respectively. This study revealed that the residential area in mixed pixel have an obvious effect on real crop FPAR estimation, and provided a quantitative function to transform the FPAR value in mixed pixel to pure crop FPAR value in the pixel at each key crop growth stages. It can help to effectively use the FPAR product to improve the light use efficiency estimation accuracy and also improve the simulation accuracy of the relationship between crop canopy and photosynthetically active radiation, and to further improve the accuracy of agronomic production (yield modeling and prediction) or the ecosystem model simulation.
The inter-comparison and quality assessment among these three FPAR products is essential to understand differences and ensure their reliability. Furthermore, they were studied separately based on different biome classes and at different growing stages, and residential area in mixed pixel was also detailed investigated. These can provide a good reference for using several products to avoid having missing FPAR pixel values because of cloudy conditions.
It should be noted that the ground measurements in this study were conducted mostly at the crop high growth stages, and this may limit the evaluations of FPAR products’ accuracy at other growing stages. Therefore, it is necessary to get complete ground measured FPAR data for all the growth stages in future study. Moreover, this study quantitatively investigated earlier the effect of mixed pixels only in plain areas on global FPAR product accuracy, where the pixel mixtures are simple. The land cover mixtures in other areas are more complex. Most pixels of global FPAR products consist of several land cover or biome classes due to the low spatial resolution, which will complicate the quantitative evaluation of mixed pixel effect on FPAR product. The global FPAR product assessment with complex land cover mixtures still needs further investigation.

5. Conclusions

This paper presented the assessments of MODIS, MERIS and GEOV1 FPAR products accuracies for maize and winter wheat grown over northern China, and analyzed the effect of residential areas in mixed pixels on the FPAR data. This study’s results indicated that the MODIS, MERIS and GEOV1 products all generally showed that the FPAR variations among the growth stages differed between different years, but the RMSEs of three global FPAR products compared with ground measured data were close to the required target accuracy of 0.05 for FPAR. The GEOV1 FPAR product was most accurate for maize and winter wheat with the largest regressions R2 of 0.818 and 0.655. The MERIS and GEOV1 FPAR presented the best inter-relationships for most of the crop growth stages. For the mixed pixels, the residential area and FPAR data could be fitted very well by the quadratic polynomial relationship (with most regressions R2 above 0.90), which can provide a simple and convenient method to assess and reduce the residential area effect on crops’ real FPAR values. This investigation may provide a basis for the use of the global FPAR product in northern China.

Acknowledgments

This work was supported by the National Natural Sciences Fund of China (Grant No. 41301607) and the Basic Works Project of Ministry of Science and Technology (Grant No. 2012FY111800-5). The authors would also thank MODIS, MERIS and GEOV1 producers and distributors for their generosity of providing FPAR products, and are appreciated for the colleagues and students help on measuring ground FPAR data. The authors are also like to thank Maurice Michael Sullivan help on English language editing.

Appendix

Table A1. Maize FPAR relationships among MODIS, MERIS and GEOV1 products.
YearSensorsR2RMSESlopeIntercept
2006MODIS-MERIS0.2490.0380.5140.246
MODIS-GEOV10.3380.0330.5050.212
MERIS-GEOV10.6560.0160.6820.128

2007MODIS-MERIS0.7670.0090.7100.186
MODIS-GEOV10.7240.0100.6930.109
MERIS-GEOV10.8310.0100.916−0.067

2008MODIS-MERIS0.7920.0090.7560.151
MODIS-GEOV10.7640.0100.7090.110
MERIS-GEOV10.8310.0100.871−0.007

2009MODIS-MERIS0.7410.0120.7440.140
MODIS-GEOV10.7540.0110.851−0.028
MERIS-GEOV10.7870.0131.005−0.131

2010MODIS-MERIS0.5420.0170.6590.168
MODIS-GEOV10.5720.0160.5940.154
MERIS-GEOV10.6420.0170.7040.104
Note: MODIS-MERIS indicates that MODIS FPAR is the independent variable and MERIS FPAR is the dependent variable in the regression, and the same as interpretation for other regressions in this table and in other tables.
Table A2. Winter wheat FPAR relationships among MODIS, MERIS and GEOV1 products.
YearSensorsR2RMSESlopeIntercept
2006MODIS-MERIS0.7750.0060.8260.096
MODIS-GEOV10.8320.0040.7020.072
MERIS-GEOV10.8490.0040.7550.014

2007MODIS-MERIS0.6500.0100.8730.101
MODIS-GEOV10.5920.0110.7530.022
MERIS-GEOV10.7400.0060.777−0.049

2008MODIS-MERIS0.8110.0070.8430.089
MODIS-GEOV10.7400.0100.8130.061
MERIS-GEOV10.8510.0070.932−0.023

2009MODIS-MERIS0.6910.0080.8080.111
MODIS-GEOV10.7920.0060.7880.014
MERIS-GEOV10.8220.0050.825−0.054

2010MODIS-MERIS0.7520.0080.8580.114
MODIS-GEOV10.7910.0060.7530.055
MERIS-GEOV10.8070.0060.769−0.025
Figure A1. The changing trend of FPAR in the mixed pixels affected by residential area percent.
Remotesensing 06 05428f8

Conflicts of Interest

The authors declare no conflict of interest.
  • Author ContributionsIn this manuscript, Fei Yang provided the main ideas and ground measured FPAR data and also wrote the whole manuscript, Xiaoyu Li provided the main ideas and made much revision on English editing, Hongyan Ren and Maogui Hu helped much on processing MODIS and GEOV1 FPAR and Land use data, Yaping Yang provided the MODIS and GEOV1 FPAR products.

References

  1. Churkina, G.; Running, S.W. Contrasting climatic controls on the estimated productivity of global terrestrial biomes. Ecosystems 1998, 1, 206–215. [Google Scholar]
  2. Sellers, P.; Dickinson, R.; Randall, D.; Betts, A.; Hall, F.; Berry, J.; Collatz, G.; Denning, A.; Mooney, H.; Nobre, C. Modeling the exchanges of energy, water, and carbon between continents and the atmosphere. Science 1997, 275, 502–509. [Google Scholar]
  3. Lobell, D.B.; Field, C.B. Global scale climate-crop yield relationships and the impacts of recent warming. Environ. Res. Lett 2007, 2, 014002. [Google Scholar]
  4. Gobron, N.; Belward, A.; Pinty, B.; Knorr, W. Monitoring biosphere vegetation 1998–2009. Geophys. Res. Lett 2010, 37. [Google Scholar] [CrossRef]
  5. Nunes, E.L.; Costa, M.H.; Malhado, A.C.M.; Dias, L.C.P.; Vieira, S.A.; Pinto, L.B. Monitoring carbon assimilation in South America’s tropical forests: Model specification and application to the Amazonian droughts of 2005 and 2010. Remote Sens. Environ 2012, 117, 449–463. [Google Scholar]
  6. FAPAR-Fraction of Absorbed Photosynthetically Active Radiation. Global Terrestrial Oberving System (GTOS), Assessment of the Status of the Development of the Standards for the Terrestrial Essential Climate Variables (Rome: FAO). Available online: http://www.fao.org/gtos/ECV-T10.html (accessed on 4 June 2014).
  7. Pickett-Heaps, C.A.; Canadell, J.G.; Briggs, P.R.; Gobron, N.; Haverd, V.; Paget, M.J.; Pinty, B.; Raupach, M.R. Evaluation of six satellite-derived Fraction of Absorbed Photosynthetic Active Radiation (FAPAR) products across the Australian continent. Remote Sens. Environ 2014, 140, 241–256. [Google Scholar]
  8. Veroustraete, F.; Patyn, J.; Myneni, R. Estimating net ecosystem exchange of carbon using the normalized difference vegetation index and an ecosystem model. Remote Sens. Environ 1996, 58, 115–130. [Google Scholar]
  9. Hall, F.; Masek, J.G.; Collatz, G.J. Evaluation of ISLSCP Initiative II FASIR and GIMMS NDVI products and implications for carbon cycle science. J. Geophys. Res. Atmos 2006, 111, D22S08. [Google Scholar]
  10. Connolly, J.; Roulet, N.T.; Seaquist, J.W.; Holden, N.M.; Lafleur, P.M.; Humphreys, E.R.; Heumann, B.W.; Ward, S.M. Using MODIS derived fPAR with ground based flux tower measurements to derive the light use efficiency for two Canadian peatlands. Biogeosciences 2009, 6, 225–234. [Google Scholar]
  11. Nightingale, J.; Morisette, J.; Wolfe, R.; Tan, B.; Gao, F.; Ederer, G.; Collatz, G.; Turner, D. Temporally smoothed and gap-filled MODIS land products for carbon modelling: Application of the fPAR product. Int. J. Remote Sens 2009, 30, 1083–1090. [Google Scholar]
  12. Seixas, J.; Carvalhais, N.; Nunes, C.; Benali, A. Comparative analysis of MODIS-FAPAR and MERIS-MGVI datasets: Potential impacts on ecosystem modeling. Remote Sens. Environ 2009, 113, 2547–2559. [Google Scholar]
  13. Haverd, V.; Raupach, M.R.; Briggs, P.R.; Canadell, J.G.; Isaac, P.; Pickett-Heaps, C.; Roxburgh, S.H.; van Gorsel, E.; Viscarra Rossel, R.A.; Wang, Z. Multiple observation types reduce uncertainty in Australia’s terrestrial carbon and water cycles. Biogeosciences 2013, 10, 2011–2040. [Google Scholar]
  14. McCallum, I.; Wagner, W.; Schmullius, C.; Shvidenko, A.; Obersteiner, M.; Fritz, S.; Nilsson, S. Comparison of four global FAPAR datasets over Northern Eurasia for the year 2000. Remote Sens. Environ 2010, 114, 941–949. [Google Scholar]
  15. Steinberg, D.C.; Goetz, S. Assessment and extension of the MODIS FPAR products in temperate forests of the eastern United States. Int. J. Remote Sens 2009, 30, 169–187. [Google Scholar]
  16. Weiss, M.; Baret, F.; Garrigues, S.; Lacaze, R. LAI and fAPAR CYCLOPES global products derived from VEGETATION. Part 2: Validation and comparison with MODIS collection 4 products. Remote Sens. Environ 2007, 110, 317–331. [Google Scholar]
  17. Pinty, B.; Lavergne, T.; Voßbeck, M.; Kaminski, T.; Aussedat, O.; Giering, R.; Gobron, N.; Taberner, M.; Verstraete, M.; Widlowski, J.L. Retrieving surface parameters for climate models from Moderate Resolution Imaging Spectroradiometer (MODIS)-Multiangle Imaging Spectroradiometer (MISR) albedo products. J. Geophys. Res 2007, 112. [Google Scholar] [CrossRef]
  18. Martínez, B.; Camacho, F.; Verger, A.; García-Haro, F.; Gilabert, M. Intercomparison and quality assessment of MERIS, MODIS and SEVIRI FAPAR products over the Iberian Peninsula. Int. J. Appl. Earth Obs 2013, 21, 463–476. [Google Scholar]
  19. Serbin, S.P.; Ahl, D.E.; Gower, S.T. Spatial and temporal validation of the MODIS LAI and FPAR products across a boreal forest wildfire chronosequence. Remote Sens. Environ 2013, 133, 71–84. [Google Scholar]
  20. Huemmrich, K.; Privette, J.; Mukelabai, M.; Myneni, R.; Knyazikhin, Y. Time-series validation of MODIS land biophysical products in a Kalahari woodland, Africa. Int. J. Remote Sens 2005, 26, 4381–4398. [Google Scholar]
  21. Fensholt, R.; Sandholt, I.; Rasmussen, M.S. Evaluation of MODIS LAI, fAPAR and the relation between fAPAR and NDVI in a semi-arid environment using in situ measurements. Remote Sens. Environ 2004, 91, 490–507. [Google Scholar]
  22. Steinberg, D.C.; Goetz, S.J.; Hyer, E.J. Validation of MODIS F/sub PAR/products in boreal forests of Alaska. IEEE Trans. Geosci. Remote Sens. Lett 2006, 44, 1818–1828. [Google Scholar]
  23. Fritsch, S.; Machwitz, M.; Ehammer, A.; Conrad, C.; Dech, S. Validation of the collection 5 MODIS FPAR product in a heterogeneous agricultural landscape in arid Uzbekistan using multitemporal RapidEye imagery. Int. J. Remote Sens 2012, 33, 6818–6837. [Google Scholar]
  24. Chen, F.; Weber, K.T.; Anderson, J.; Gokhale, B. Comparison of MODIS fPAR products with Landsat-5 TM-Derived fPAR over semiarid rangelands of Idaho. GISci. Remote Sens 2010, 47, 360–378. [Google Scholar]
  25. Gobron, N.; Pinty, B.; Aussedat, O.; Taberner, M.; Faber, O.; Mélin, F.; Lavergne, T.; Robustelli, M.; Snoeij, P. Uncertainty estimates for the FAPAR operational products derived from MERIS—Impact of top-of-atmosphere radiance uncertainties and validation with field data. Remote Sens. Environ 2008, 112, 1871–1883. [Google Scholar]
  26. Baret, F.; Weiss, M.; Lacaze, R.; Camacho, F.; Makhmara, H.; Pacholcyzk, P.; Smets, B. GEOV1: LAI and FAPAR essential climate variables and FCOVER global time series capitalizing over existing products. Part 1: Principles of development and production. Remote Sens. Environ 2013, 137, 299–309. [Google Scholar]
  27. Meroni, M.; Atzberger, C.; Vancutsem, C.; Gobron, N.; Baret, F.; Lacaze, R.; Eerens, H.; Leo, O. Evaluation of agreement between space remote sensing SPOT-VEGETATION fAPAR time series. IEEE Int. Geosci. Remote Sens 2012, 51, 1951–1962. [Google Scholar]
  28. Camacho, F.; Cernicharo, J.; Lacaze, R.; Baret, F.; Weiss, M. GEOV1: LAI, FAPAR essential climate variables and FCOVER global time series capitalizing over existing products. Part 2: Validation and intercomparison with reference product. Remote Sens. Environ 2013, 137, 310–329. [Google Scholar]
  29. D’Odorico, P.; Gonsamo, A.; Pinty, B.; Gobron, N.; Coops, N.; Mendez, E.; Schaepman, M.E. Intercomparison of fraction of absorbed photosynthetically active radiation products derived from satellite data over Europe. Remote Sens. Environ 2014, 142, 141–154. [Google Scholar]
  30. Chen, J.; Pavlic, G.; Brown, L.; Cihlar, J.; Leblanc, S.; White, H.; Hall, R.; Peddle, D. Derivation and validation of Canada-wide coarse-resolution leaf area index maps using high-resolution satellite imagery and ground measurements. Remote Sens. Environ 2002, 80, 165–184. [Google Scholar]
  31. Tian, Y.; Zhang, Y.; Knyazikhin, Y.; Myneni, R.B.; Glassy, J.M.; Dedieu, G.; Running, S.W. Prototyping of MODIS LAI and FPAR algorithm with LASUR and LANDSAT data. IEEE Trans. Geosci. Remote Sens 2000, 38, 2387–2401. [Google Scholar]
  32. Yang, P.; Shibasaki, R.; Wu, W.B.; Zhou, Q.B.; Chen, Z.X.; Zha, Y.; Shi, Y.; Tang, H.J. Evaluation of MODIS land cover and LAI products in cropland of North China plain using in situ measurements and landsat TM images. IEEE Trans. Geosci. Remote Sens 2007, 45, 3087–3097. [Google Scholar]
  33. Fang, H.; Li, W.; Myneni, R.B. The impact of potential land cover misclassification on MODIS leaf area index (LAI) estimation: A statistical perspective. Remote Sens 2013, 5, 830–844. [Google Scholar]
  34. Di Bella, C.M.; Paruelo, J.M.; Becerra, J.; Bacour, C.; Baret, F. Effect of senescent leaves on NDVI-based estimates of fAPAR: Experimental and modeling evidences. Int. J. Remote Sens 2004, 25, 5415–5427. [Google Scholar]
  35. Turner, D.P.; Ritts, W.D.; Cohen, W.B.; Maeirsperger, T.K.; Gower, S.T.; Kirschbaum, A.A.; Running, S.W.; Zhao, M.; Wofsy, S.C.; Dunn, A.L. Site-level evaluation of satellite-based global terrestrial gross primary production and net primary production monitoring. Glob. Chang. Biol 2005, 11, 666–684. [Google Scholar]
  36. Gallo, K.; Daughtry, C. Techniques for measuring intercepted and absorbed photosynthetically active radiation in corn canopies. Agron. J. (USA) 1986, 78, 752–756. [Google Scholar]
  37. NASA’s Earth Observing System Data and Information System. Available online: http://reverb.echo.nasa.gov/reverb (assessed on 18 September 2013).
  38. Meris ENVISAT 1km-10 Daily Synthesis. Available online: http://meriss10.vgt.vito.be/ (assessed on 29 September 2013).
  39. Geoland2. Available online: http://www.geoland2.eu/index.jsp/ (assessed on 14 October 2013).
  40. Knyazikhin, Y.; Martonchik, J.; Myneni, R.; Diner, D.; Running, S. Synergistic algorithm for estimating vegetation canopy leaf area index and fraction of absorbed photosynthetically active radiation from MODIS and MISR data. J. Geophys. Res 1998, 103, 32257–32276. [Google Scholar]
  41. Myneni, R.; Hoffman, S.; Knyazikhin, Y.; Privette, J.; Glassy, J.; Tian, Y.; Wang, Y.; Song, X.; Zhang, Y.; Smith, G. Global products of vegetation leaf area and fraction absorbed PAR from year one of MODIS data. Remote Sens. Environ 2002, 83, 214–231. [Google Scholar]
  42. Baret, F.; Pavageau, K.; Béal, D.; Weiss, M.; Berthelot, B.; Regner, P. Algorithm Theoretical Basis Document for MERIS Top of Atmosphere Land Products (TOA_VEG); INRA-CSE: Avignon, France, 2006. [Google Scholar]
  43. Gobron, N. Envisat’s Medium Resolution Imaging Spectrometer (MERIS)-ESA, Algorithm Theoretical Basis Document: FAPAR and Rectified Channels over Terrestrial Surfaces; European Commission Joint Research Center: Ispra, Italy, 2011. [Google Scholar]
  44. Tang, X. Research on the Geo-Spatial Data Fusion; Chinese Academy of Sciences: Beijing, China, 2000. (In Chinese) [Google Scholar]
  45. De Kauwe, M.G.; Disney, M.I.; Quaife, T.; Lewis, P.; Williams, M. An assessment of the MODIS collection 5 leaf area index product for a region of mixed coniferous forest. Remote Sens. Environ 2011, 115, 767–780. [Google Scholar]
  46. Wang, K.; Mao, J.; Dickinson, R.E.; Shi, X.; Post, W.M.; Zhu, Z.; Myneni, R.B. Evaluation of CLM4 solar radiation partitioning scheme using remote sensing and site level FPAR datasets. Remote Sens 2013, 5, 2857–2882. [Google Scholar]
  47. Hwang, T.; Song, C.; Bolstad, P.V.; Band, L.E. Downscaling real-time vegetation dynamics by fusing multi-temporal MODIS and Landsat NDVI in topographically complex terrain. Remote Sens. Environ 2011, 115, 2499–2512. [Google Scholar]
  48. Yang, F.; Zhu, Y.; Zhang, J.; Yao, Z. Estimating fraction of photosynthetically active radiation of corn with vegetation indices and neural network from hyperspectral data. Chin. Geogr. Sci 2012, 22, 63–74. [Google Scholar]
  49. Cristiano, P.M.; Posse, G.; Di Bella, C.M.; Jaimes, F.R. Uncertainties in fPAR estimation of grass canopies under different stress situations and differences in architecture. Int. J. Remote Sens 2010, 31, 4095–4109. [Google Scholar]
  50. Wu, W.B.; Yang, P.; Zhang, L.; Tang, H.J.; Zhou, Q.B.; Shibasaki, R. Accuracy assessment of four global land cover datasets in China. Trans. Chin. Soc. Agric. Eng 2009, 25, 167–173. [Google Scholar]
Figure 1. The cultivated land area in study area and fraction of photosynthetically active radiation (FPAR) ground measurements.
Remotesensing 06 05428f1
Figure 2. Validation of maize FPAR products based on ground measured (a) MODIS FPAR; (b) MERIS FPAR; (c) GEOV1 FPAR.Notes: ** indicate the predicted parameter values (slope and intercept) are significantly different from y = x (slope = 1 and intercept = 0) separately at the 0.01 probability level, ** also indicates the regressions R2 are significant at the 0.01 probability level.
Remotesensing 06 05428f2
Figure 3. Validation of winter wheat FPAR products based on ground-measured (a) MODIS FPAR; (b) MERIS FPAR; (c) GEOV1 FPAR.Notes: ** and * indicate the predicted parameter values (slope and intercept) are significantly different from y = x (slope = 1 and intercept = 0) separately at the 0.01 and 0.05 probability level, ** also indicates the regressions R2 are significant at the 0.01 probability level.
Remotesensing 06 05428f3
Figure 4. Maize and winter wheat FPAR frequencies of MODIS, MERIS and GEOV1 in different growth stages. (a) Maize MODIS FPAR; (b) Maize MERIS FPAR; (c) Maize GEOV1 FPAR; (d) Winter wheat MODIS FPAR; (e) Winter wheat MERIS FPAR; (f) Winter wheat GEOV1 FPAR.Note: x-axis is the FPAR interval for statistical analysis, y-axis is the FPAR value frequency.
Remotesensing 06 05428f4aRemotesensing 06 05428f4b
Figure 5. The regression R2 and RMSE among three FPAR products for maize (a) Regression R2; (b) RMSE and winter wheat (c) Regression R2; (d) RMSE.Note: MODIS-MERIS indicates that MODIS FPAR is the independent variable and meris FPAR is the dependent variable in the regression. The similar indications for MODIS-GEOV1 and MERIS-GEOV1.
Remotesensing 06 05428f5aRemotesensing 06 05428f5b
Figure 6. The changes of maize (a) MODIS; (b) MERIS; (c) GEOV1 FPAR in mixed pixel with residential area at different growth stages.
Remotesensing 06 05428f6
Figure 7. The changes of winter wheat (a) MODIS; (b) MERIS; (c) GEOV1 FPAR in mixed pixel with residential area at different growth stages.
Remotesensing 06 05428f7
Table 1. Maize and winter wheat growth stages in a year.
CropsGrowth Stages
MaizeSeedingThree-leafSeven-leafJountingTasselingSilkingMilkingMature
Last dekad in Mayfirst dekad in Junelast dekad in Junemiddle dekad in Julylast dekad in Julyfirst dekad in Augustlast dekad in Augustmiddle dekad in September
Winter wheatSeedingTilleringRevivingJointingHeadingMilkingMature
First dekad in Novembermiddle dekad in Novemberfirst dekad in Marchfirst dekad in Aprilmiddle dekad in Aprilmiddle dekad in Maylast dekad in May
Table 2. Ground-measured FPAR data of maize and winter wheat.
BiomeStudy AreaDateSamples NumberRepeat Times
MaizeChangchun, Jilin province26 June 2007203
6 August 2007213
15 August 2008129

Winter wheatDezhou and Liaocheng, Shandong province13 April 2010173
12 May 2010403
Table 3. Introduction of MODIS, MERIS and GEOV1 FPAR products.
FPAR ProductMODISMERISGEOV1
InitiativeNASAESAGeoland2
SensorMODIS/TERRA, MODIS/AUQAMERIS/ENVISATMODIS/TERRA, MODIS/AUQA, VEGETATION/SPOT
Spatial and temporal resolution1 km 8 days1 km 10 days1/112° 10 days
Retrieval Model3-Dimension Radiative Transfer Model (Look up table), VI-FPARsemi-discrete model of biodirectional reflectance factor model with atmospheric model 6S3-Dimension Radiative Transfer Model, Scattering by Arbitrarily Inclined Leaves radiative transfer model, Neural Networks
Valid range, scale0–100, 0.010–250, 0.0050–235, 0.004
Period2000 until now2002 to 20121999 until now
Product distribution website[37][38][39]
Reference[40,41][42,43][28]
Table 4. The fitting relationships between residential area percentage and maize FPAR at different stages.
Maize Growth StageSensorsFunctionR2RMSESig.F
Seeding stageMODISy = −0.021 x2 + 0.065 x + 0.1500.8620.0070.00025.055
MERISy = 0.009 x2 + 0.010 x + 0.0900.7570.0040.00412.432
GEOV1y = −0.003 x2 + 0.013 x + 0.0820.7440.0020.00411.624

Three-leaf stageMODISy = −0.080 x2 + 0.067 x + 0.2370.7460.0060.00411.741
MERISy = −0.014 x2 + 0.037 x + 0.0980.7750.0050.00313.798
GEOV1y = −0.013 x2 + 0.033 x + 0.0920.9030.0030.00037.394

Seven-leaf stageMODISy = −0.142 x2 + 0.006 x + 0.4370.9650.0100.000109.479
MERISy = −0.096 x2 + 0.057 x + 0.2140.8710.0070.00027.007
GEOV1y = −0.175 x2 + 0.093 x + 0.2480.9850.0040.000266.447

Jointing stageMODISy = −0.210 x2 − 0.163 x + 0.7450.9910.0130.000445.632
MERISy = −0.339 x2 + 0.025 x + 0.5560.9810.0170.000205.108
GEOV1y = −0.445 x2 + 0.083 x + 0.5990.9970.0080.0001180.000

Tasseling stageMODISy = −0.244 x2 − 0.121 x + 0.7770.9910.0130.000426.978
MERISy = −0.485 x2 + 0.005 x + 0.7590.9890.0190.000368.565
GEOV1y = −0.609 x2 + 0.116 x + 0.7970.9960.0120.0001125.000

Silking stageMODISy = −0.210 x2 − 0.121 x + 0.7410.9870.0140.000312.315
MERISy = −0.492 x2 − 0.035 x + 0.7950.9950.0140.000806.723
GEOV1y = −0.690 x2 + 0.177 x + 0.8660.9950.0140.000812.672

Milking stageMODISy = −0.191 x2 − 0.122 x + 0.6800.9870.0140.000294.201
MERISy = −0.439 x2 − 0.021 x + 0.6790.9970.0090.0001430
GEOV1y = −0.587 x2 + 0.058 x + 0.8440.9970.0110.0001512.000

Mature stageMODISy = −0.162 x2 − 0.053 x + 0.5220.9740.0130.000147.172
MERISy = −0.326 x2 + 0.020 x + 0.4820.9950.0080.000838.504
GEOV1y = −0.494 x2 + 0.024 x + 0.7250.9970.0100.0001426.000
Table 5. The regression between residential area percent and winter wheat FPAR at different stages.
Winter Wheat Growth StageSensorsFunctionR2RMSESig.F
Seeding stageMODISy = −0.070 x2 + 0.061 x + 0.2210.5010.0080.0624.022
MERISy = −0.055 x2 + 0.032 x + 0.1640.6930.0070.0099.041
GEOV1y = −0.290 x2 + 0.159 x + 0.2190.9040.0190.00037.569

Tillering stageMODISy = −0.225 x2 + 0.100 x + 0.2740.9280.0140.00051.31
MERISy = −0.115 x2 + 0.066 x + 0.1580.9750.0030.000155.313
GEOV1y = −0.441 x2 + 0.241 x + 0.2790.9670.0160.000118.046

Reviving stageMODISy = −0.114 x2 + 0.067 x + 0.1550.9030.0070.00037.063
MERISy = −0.075 x2 + 0.048 x + 0.1150.9450.0030.00069.283
GEOV1y = −0.267 x2 + 0.138 x + 0.1630.9880.0060.000332.654

Jointing stageMODISy = −0.340 x2 + 0.151 x + 0.4100.9360.0210.00058.201
MERISy = −0.274 x2 + 0.131 x + 0.3030.9810.0080.000209.818
GEOV1y = −0.600 x2 + 0.293 x + 0.3690.9890.0140.000347.61

Heading stageMODISy = −0.416 x2 + 0.197 x + 0.5020.9360.0240.00058.606
MERISy = −0.417 x2 + 0.217 x + 0.4180.9620.0170.000100.91
GEOV1y = −0.785 x2 + 0.404 x + 0.4770.9820.0220.000212.955

Milking stageMODISy = −0.350 x2 + 0.184 x + 0.4770.9340.0190.00056.939
MERISy = −0.438 x2 + 0.247 x + 0.4450.9560.0180.00087.81
GEOV1y = −0.904 x2 + 0.488 x + 0.5610.9710.0310.000132.687

Mature stageMODISy = −0.303 x2 + 0.158 x + 0.4290.9230.0180.00047.703
MERISy = −0.215 x2 + 0.127 x + 0.3090.9160.0120.00043.813
GEOV1y = −0.672 x2 + 0.357 x + 0.4450.9640.0260.000107.842

