Article

Monitoring Trends in Light Pollution in China Based on Nighttime Satellite Imagery

1
Key Laboratory of Environment and Disaster Monitoring and Evaluation Institute of Geodesy and Geophysics, Chinese Academy of Sciences, Wuhan 430077, China
2
University of Chinese Academy of Sciences, Beijing 100049, China
*
Author to whom correspondence should be addressed.
Remote Sens. 2014, 6(6), 5541-5558; https://0-doi-org.brum.beds.ac.uk/10.3390/rs6065541
Submission received: 4 March 2014 / Revised: 19 May 2014 / Accepted: 20 May 2014 / Published: 16 June 2014
(This article belongs to the Special Issue Remote Sensing with Nighttime Lights)

Abstract

:
China is the largest developing country worldwide, with rapid economic growth and the highest population. Light pollution is an environmental factor that significantly influences the quality and health of wildlife, as well as the people of any country. The objective of this study is to model the light pollution spatial pattern, and monitor changes in trends of spatial distribution from 1992 to 2012 in China using nighttime light imagery from the Defense Meteorological Satellite Program Operational Linescan System. Based on the intercalibration of nighttime light imageries of the study area from 1992 to 2012, this study obtained the change trends map. This result shows an increase in light pollution of the study area; light pollution in the spatial scale increased from 2.08% in the period from 1992–1996 to 2000–2004, to 5.64% in the period from 2000–2004 to 2008–2012. However, light pollution change trends presented varying styles in different regions and times. In the 1990s, the increasing trend in light pollution regions mostly occurred in larger urban cities, which are mainly located in eastern and coastal areas, whereas the decreasing trend areas were chiefly industrial and mining cities rich in mineral resources, in addition to the central parts of large cities. Similarly, the increasing trend regions dominated urban cities of the study area, and the expanded direction changed from larger cities to small and middle-sized cities and towns in the 2000s. The percentages of regions where light pollution transformed to severe and slight were 5.64% and 0.39%, respectively. The results can inform and help identify how local economic and environmental decisions influence our global nighttime environment, and assist government agencies in creating environmental protection measures.

1. Introduction

The 20th century witnessed the great development of electric lighting and the rapid growth of human settlement, transport, infrastructure, and economic activity. As a result, large areas of the globe have been affected by artificial light at night. One study [1] in 2001 indicated that 19% of the global land surface was above the threshold of light-polluted status, and 21% of the world’s people live in areas where light pollution obscures views of the Milky Way. In recent years, research on light pollution [25] has elicited scientific investigation because of the potential effects of light on human health, ecological processes, and ecosystem services [617]. Nightlight emission has become one of the main elements of environmental pollution because of increased use of lights and lamps [18].
Compared with developed countries, China, as the biggest developing country in the world has very few studies on light pollution, which has become a serious environmental problem in urban cities. Owing to the lack of related laws, China [19,20] is not fully aware of the environmental effect of their nighttime lighting. Light pollution has threatened normal life in many cities, especially those in eastern and coastal areas. For example, more than half of the citizens in Shenzhen have felt uncomfortable due to light pollution, based on a survey in 2010 [21]. Another report in 2010 indicated that light intensity at night is more than 30 to 60 times that of the standard value in Guangzhou [22].
Remote sensing (RS) technique provides an efficient approach to survey and monitor light pollution. Among various sources of RS data, nighttime imagery has been particularly effective in monitoring light pollution because nighttime light can reflect the use of lighting, which is strongly associated with population density, energy consumption, and urban scale [2333]. The Defense Meteorological Satellite Program’s Operational Linescan System (DMSP/OLS), as the sensor, can compound nighttime light images to provide remotely sensed data to analyze light pollution in different spatial scales: urban, national and global [34,35]. Long-term archives of DMSP/OLS nighttime imagery provide accessible and valuable data sources for investigating light pollution.
With increasing populations, urban expansion, economic development and more efficient lighting technologies, light pollution continues to affect urban cities. Meanwhile, because of concerns over greenhouse gas emissions and energy security, energy-saving technologies and economic structure adjustment provide strong incentives to reduce the intensity and duration of public and private lighting. As a result, the patterns of change in nighttime lighting are becoming increasingly complex, and the majority of research on light pollution has been concentrated in developed countries. However, as the largest developing country in the world, China is experiencing unprecedented urbanization, industrialization and economic growth which began with the economic reform and opening-up policy [36,37]. Therefore, monitoring and assessing changes in light pollution trends is sorely needed from different spatial scales and a wide-ranging temporal view.
Based on RS and Geographic Information System (GIS), the qualitative analysis of the change trends of light pollution from the national scale to regional and localized ones can provide an important basis for light pollution assessment, control and prediction. This analysis is significant to reasonable urbanization development and human health in normal life. It also provides derivations of the scientific basis for ecosystem protection and sustainable development of social economy.
The objective of this study is to propose the monitor method of light pollution and assess changing trends in the spatial distribution of light pollution from 1992 to 2012 in China using a multi-year mean value method, which synthesizes the values in five consequent years. The study results will assist government agencies in understanding light pollution trend changes, determining control areas and developing conservation measures and economic policy.

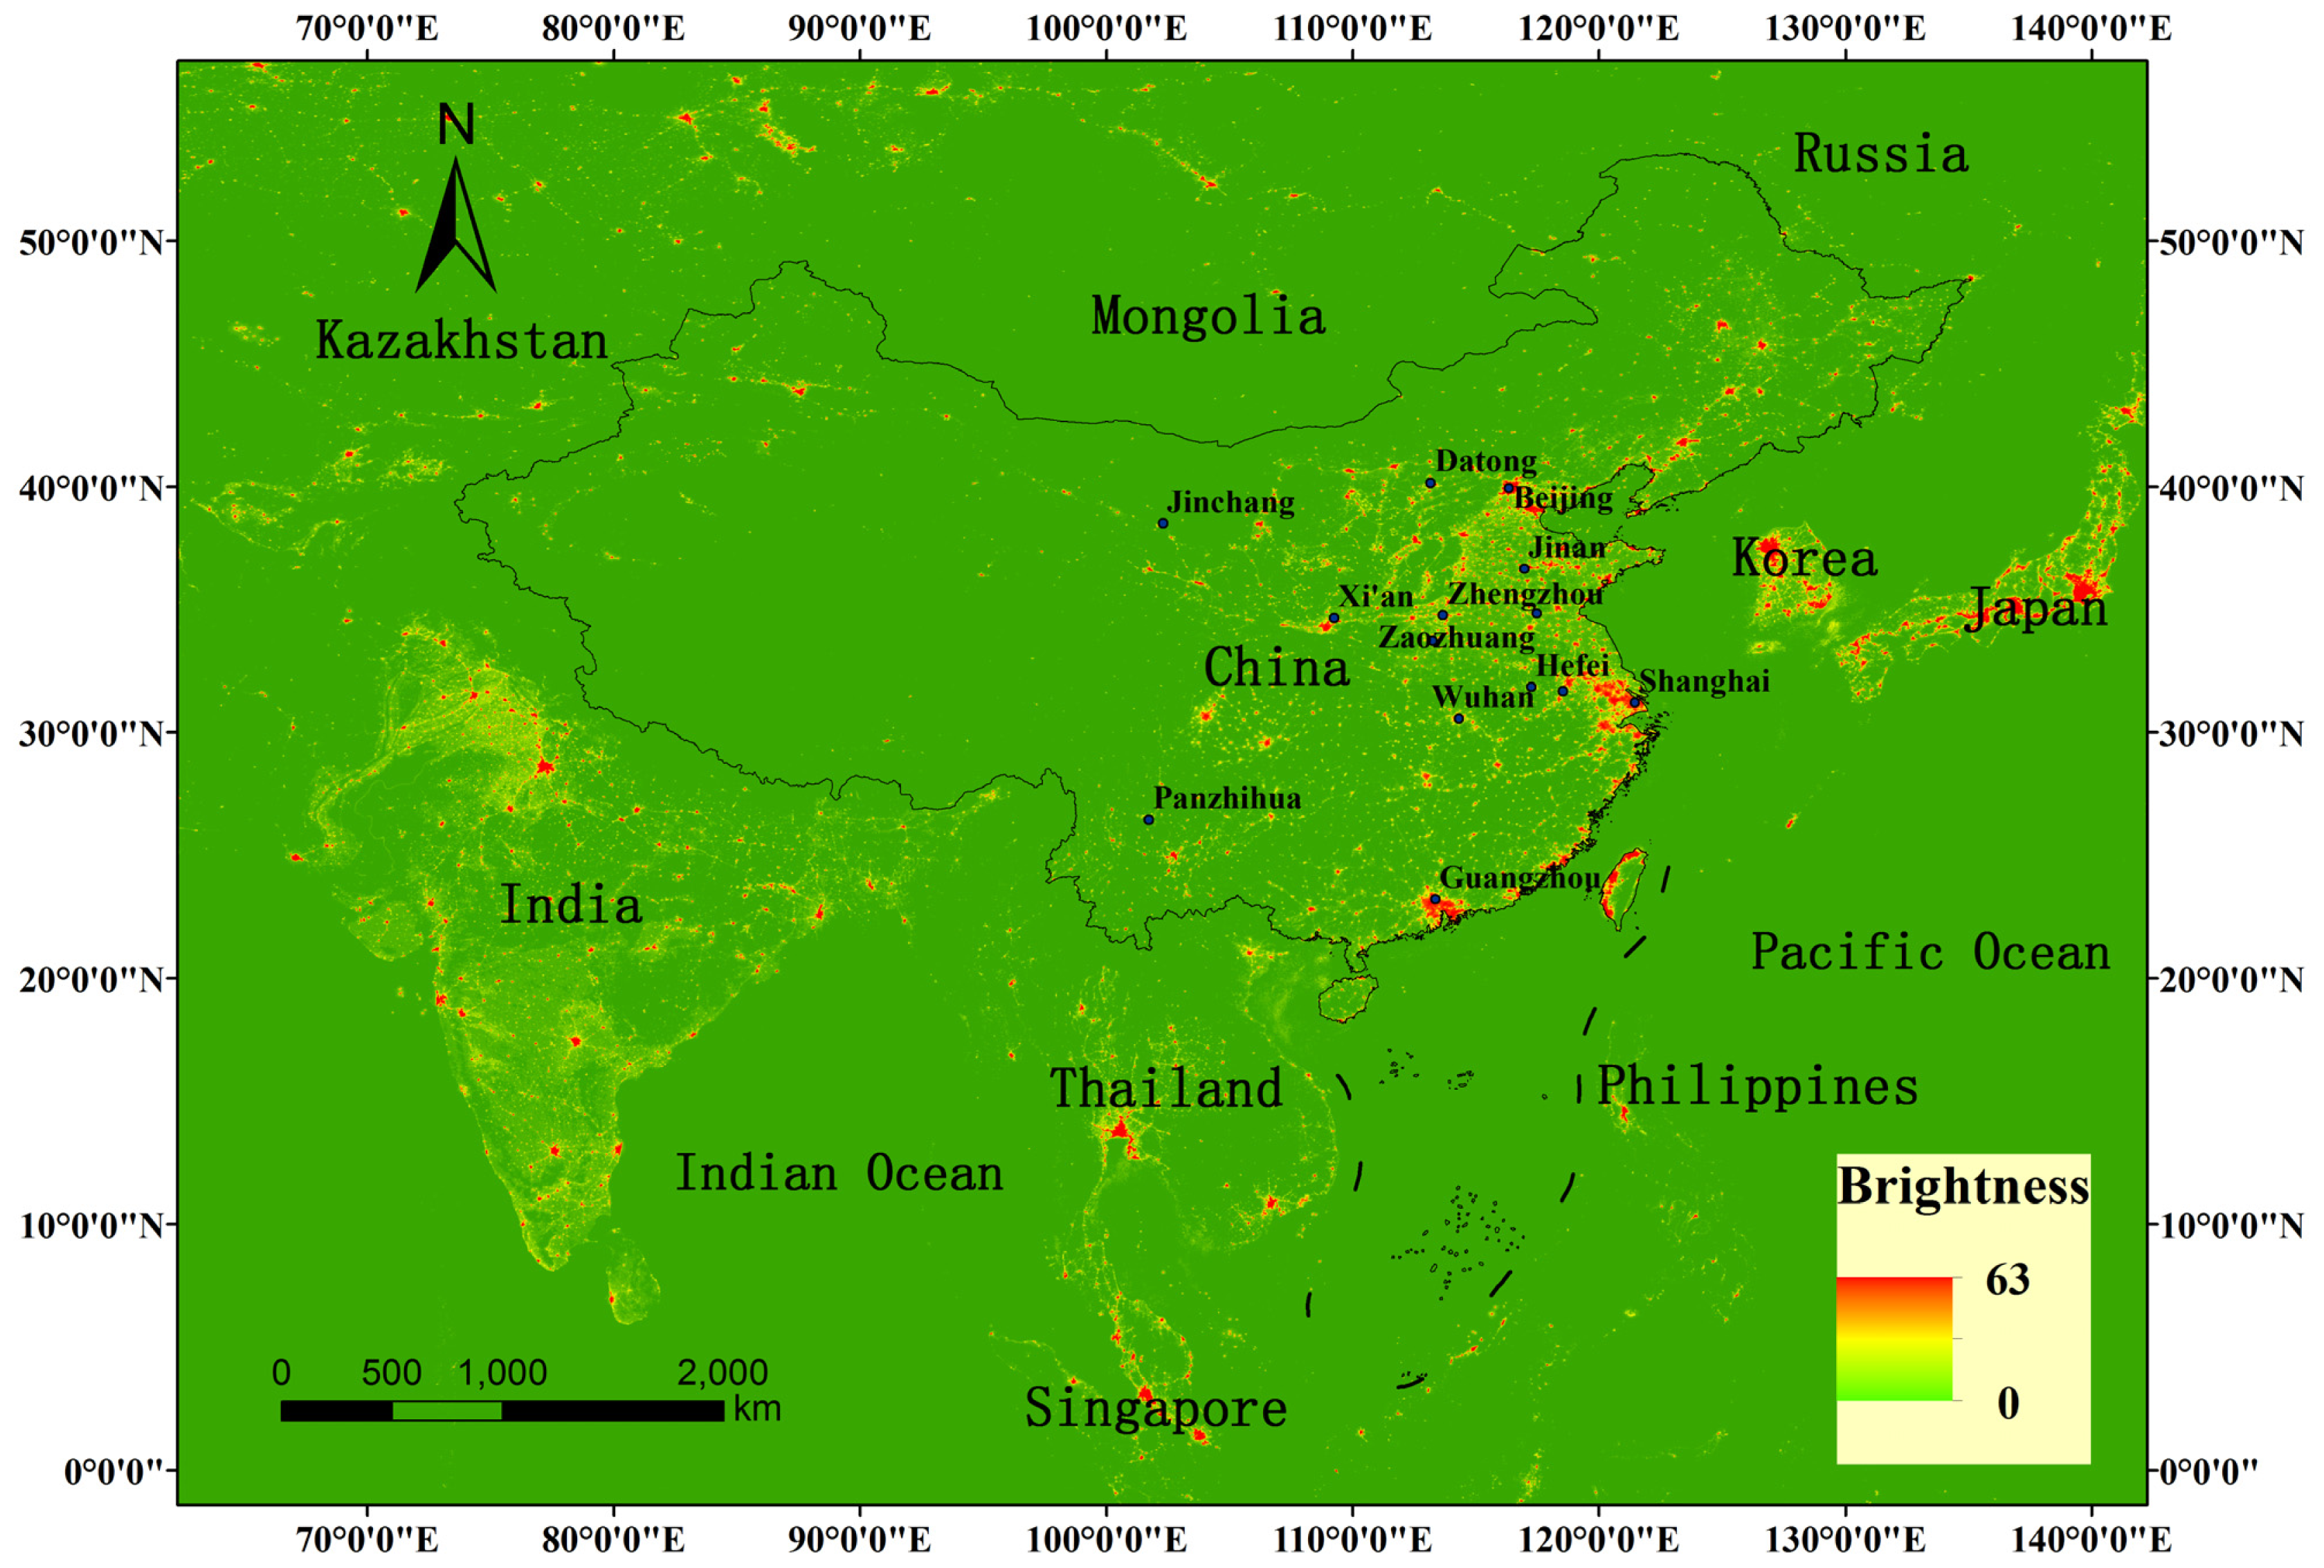
2. Study Area and Data

In order to monitor and map light pollution using long-time series DMSP/OLS nighttime satellite images, we used China as the study area for analysis. China (Figure 1) is situated in the eastern part of Asia and west of the Pacific Ocean with a land area of more than 9.6 million square kilometers. China is the most populous country in the world with a population of more than 1.3 billion in 2011, comprising approximately 19% of the world population, with more than half of the people living in cities and towns. The urbanization rate increased from 36% in the year 2000 to 51.3% in 2011, and China has entered the key stage of urbanization [38,39]. China at present is considered widely as the fastest growing economy worldwide because its economic growth rate has remained at more than 7% annually since 2000, rising to become the world’s secondary economic power in 2010. However, the increasing population, economic development, urban expansion, expanding energy demand, and industrial restructuring, has resulted in the increasing seriousness of environmental issues such as atmospheric pollution, deterioration of water quality, urban heat island effect, and light pollution.
DMSP uses satellites of the National Oceanic and Atmospheric Administration (NOAA) in low altitude, sun-synchronous polar orbit, with an orbital period of 101 min. The Operational Linescan System (OLS) radiometer, which is sensitive to radiation from 0.4 μm to 1.1 μm is the primary scanner installed on the DMSP. It has the capability to detect faint sources of visible near-infrared (VNIR) emissions on the Earth’s surface. A time-series of DMSP nighttime satellite images of the study area for the period from 1992 to 2012 was obtained from the National Geophysical Data Center ( http://ngdc.noaa.gov/eog/download.html). Each DMSP/OLS image represents a composite of cloud-free images taken throughout the year during the hours of darkness. The data are nominally at 1 km resolution, resampled from data at 2.7 km resolution, and each pixel is represented by a digital number (DN) between 0 and 63. A value of 0 represents relative darkness, whereas very brightly lit urban areas typically saturate at a value of 63. No onboard calibration of the sensor is present, and the time series includes data from six different satellites with different sensors. Therefore, the brightness of images must be cross-calibrated carefully to assess any change in brightness [40].

3. Method

3.1. Intercalibration of Nighttime Light Imagery

Considering that DMSP/OLS has no on-board calibration, annual composites in different years or those taken by different satellites could not be compared directly with each other. For this reason, recent approaches have used principal component analysis [41] and robust regression techniques [42] to overcome the problem and map changes in nighttime lighting. Elvidge [43,44] developed the second-order regression model to intercalibrate individual composites via an empirical procedure, in which Sicily was chosen as the reference area, with F121999 used as the reference composite. Data from other satellite years were adjusted to match the F121999 data range, assuming that night lights in the reference area have been largely stable over time. Based on Elvidge’s research, Liu [45] proposed the intercalibration method in line with China’s actual urban development condition, which selected the calibration region after analyzing the relationship between GDP (gross domestic product) data and built-up-area data and used F162007 as the reference, intercalibrating nighttime light data in other years through a regression model. In this study, we selected Jixi city in Heilongjiang province as the calibration area based on analyzed socio-economic characteristics between GDP and built-up-area data for major cities in China from 1992 to 2012. The calibration area performed relatively stable socio-economic development [46] and high conformity of DN values over different years (Figure 2). A second order regression model (Table 1) was used to intercalibrate DMSP/OLS time-series imageries.
D N a d j u s t e d = a × D N 2 + b × D N + c
where DNadjusted is the adjusted value created by regression formula. DN is the digital value of nighttime light imagery. a, b, c are coefficients of the regression model.
We created intercalibrated images of nighttime lights in China using the second order regression model to intercalibrate DMSP/OLS satellite images. Subsequently, we assessed changes in artificial lighting in terms of regions of both increasing and decreasing brightness over the region.

3.2. Assessment of Observed Direction and Timing of Change

In order to assess the ability of the methodology correctly in identifying regions undergoing changes in brightness, features on the ground were judged depending on an increase or decrease in brightness using visual inspection of maps and aerial images from Google Earth, and probable causes of change were attributed. A change threshold of ±3 DN units was selected to identify discrete patches of contiguous pixels with significant change in brightness over the period. Certain researchers [34] mapped light pollution using natural breaks method, which is a commonly used classification scheme in ArcGIS software. ArcMap software identifies breakpoints by picking the class breaks that best sort similar values and maximize the differences between classes. In this study, we used the method proposed by Bennie [35], which selected a threshold of ±3 DN units as the significant segmentation value to separate increasing, unchanged, and decreasing trends based on mean value in several consequent years after calibration by regression. Figure 3 shows nighttime light pixel brightness mean value of different time series in China.

4. Results and Discussions

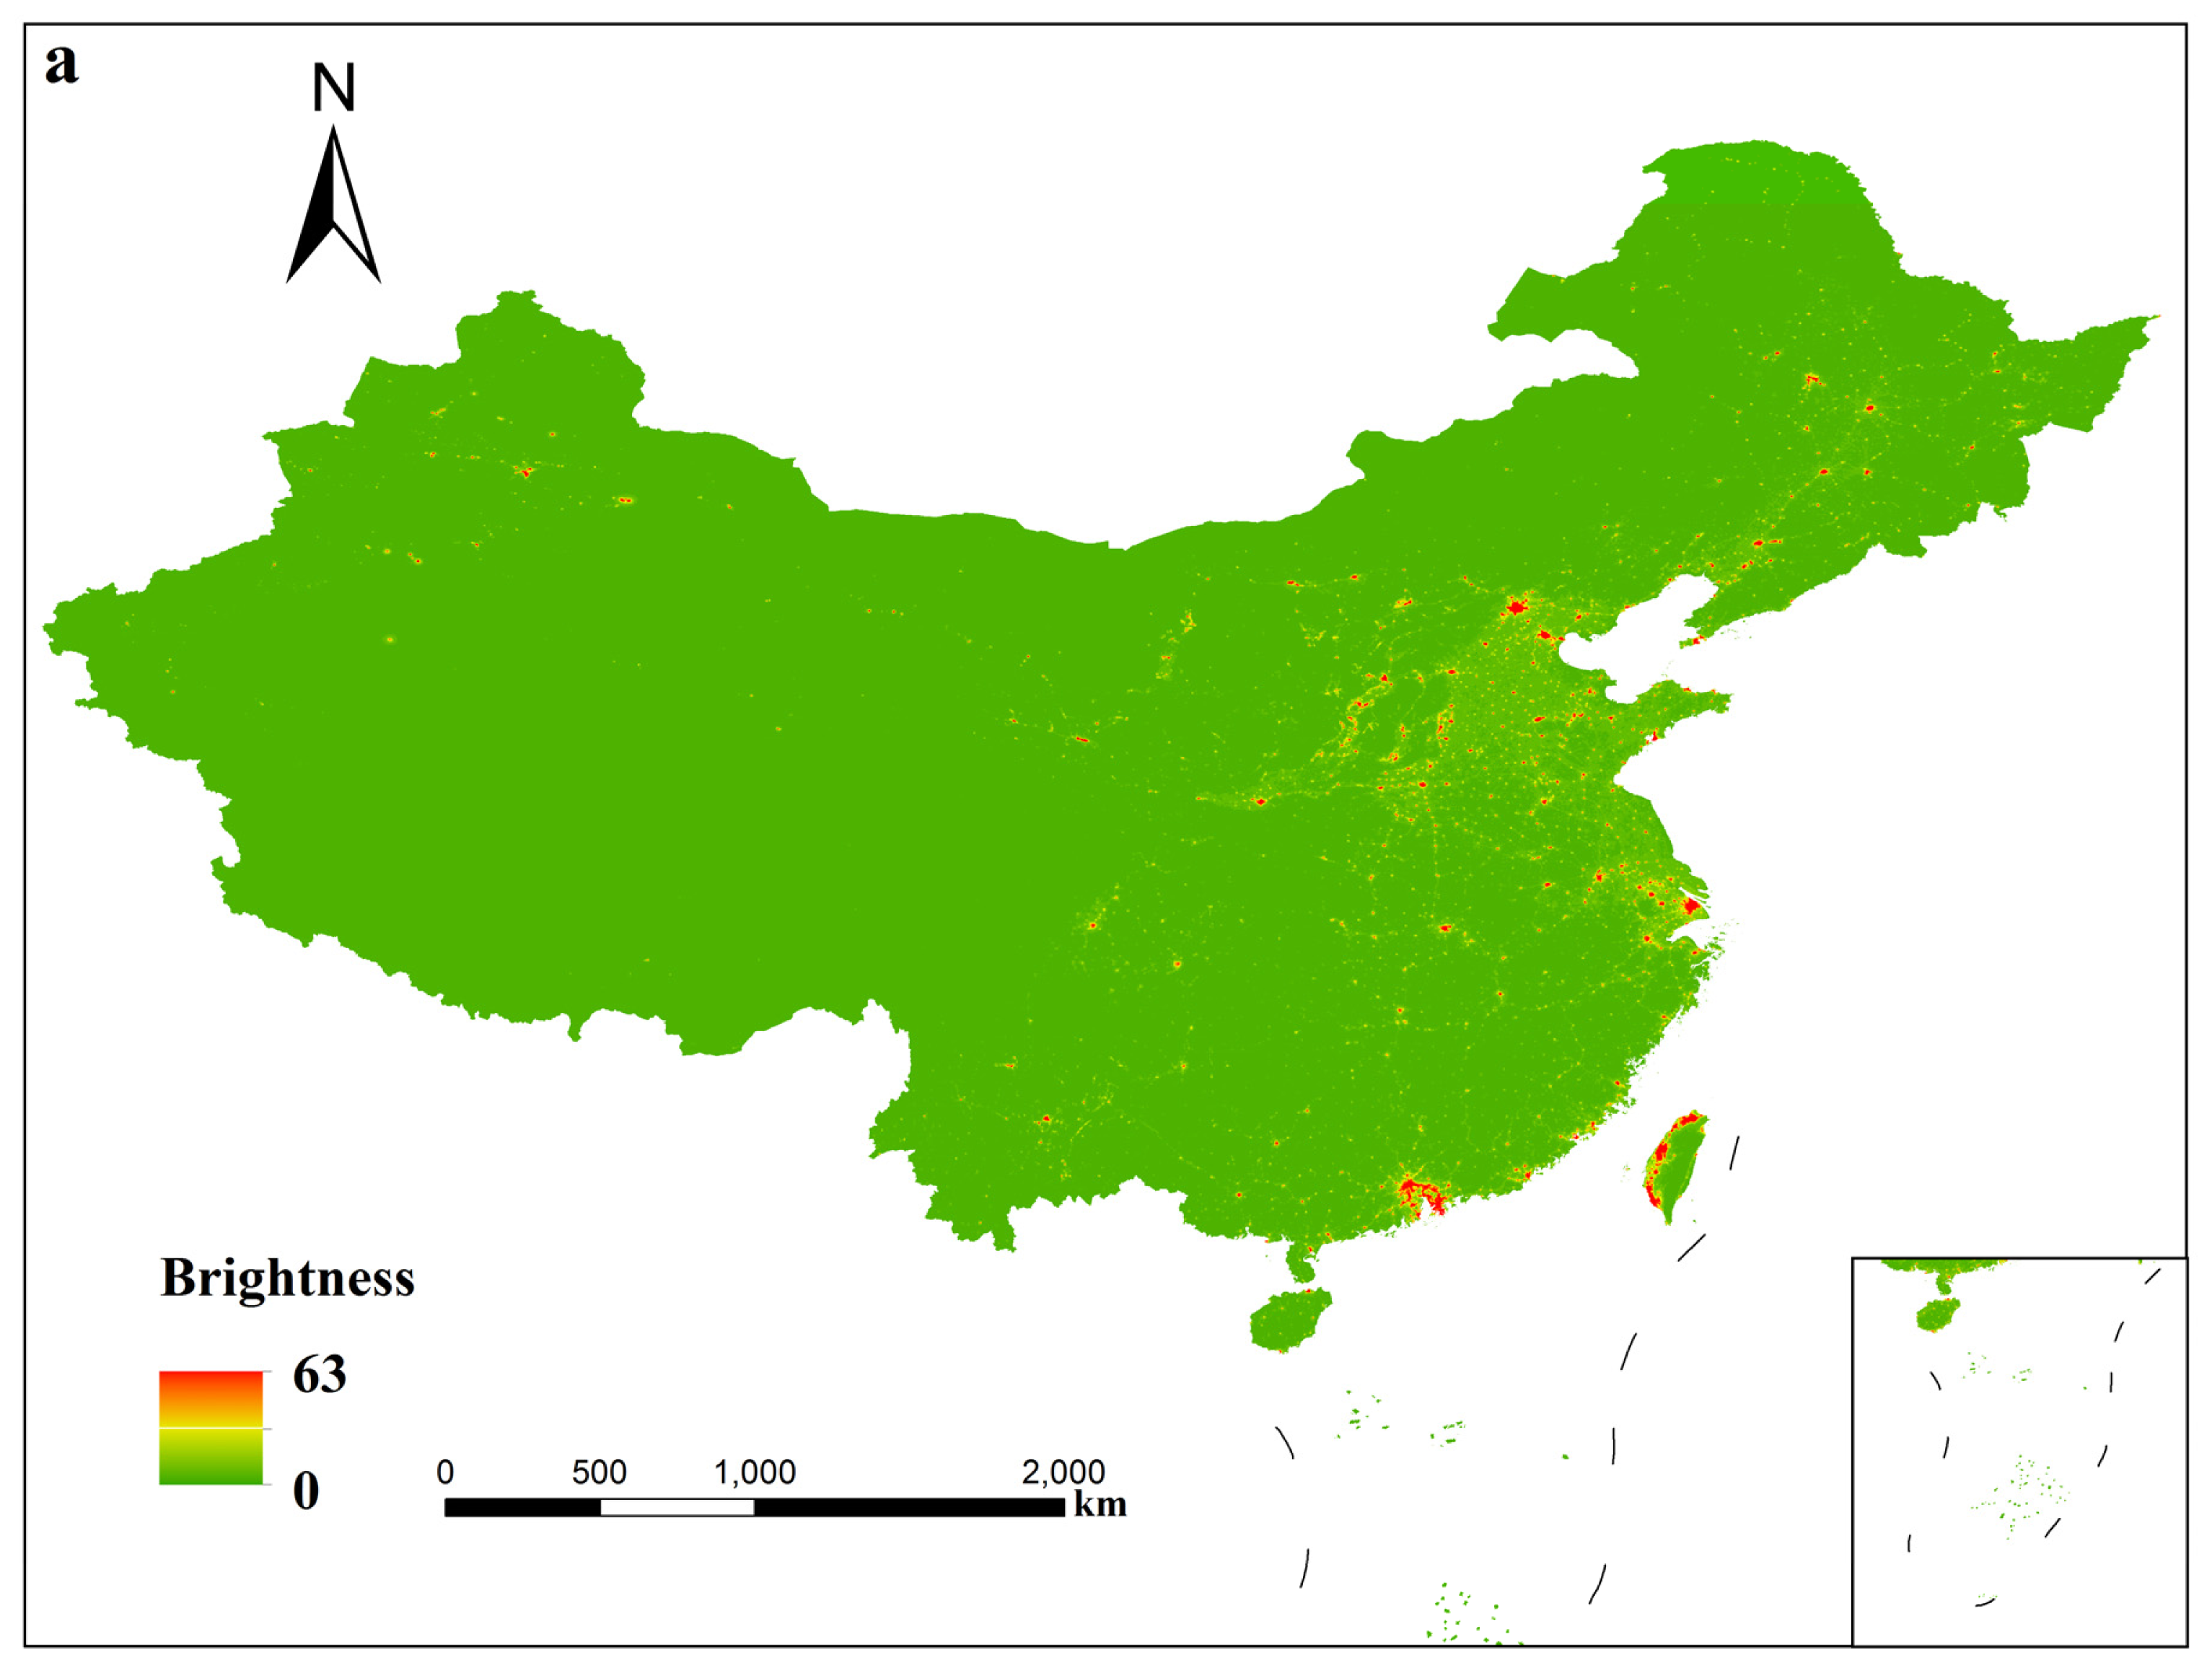
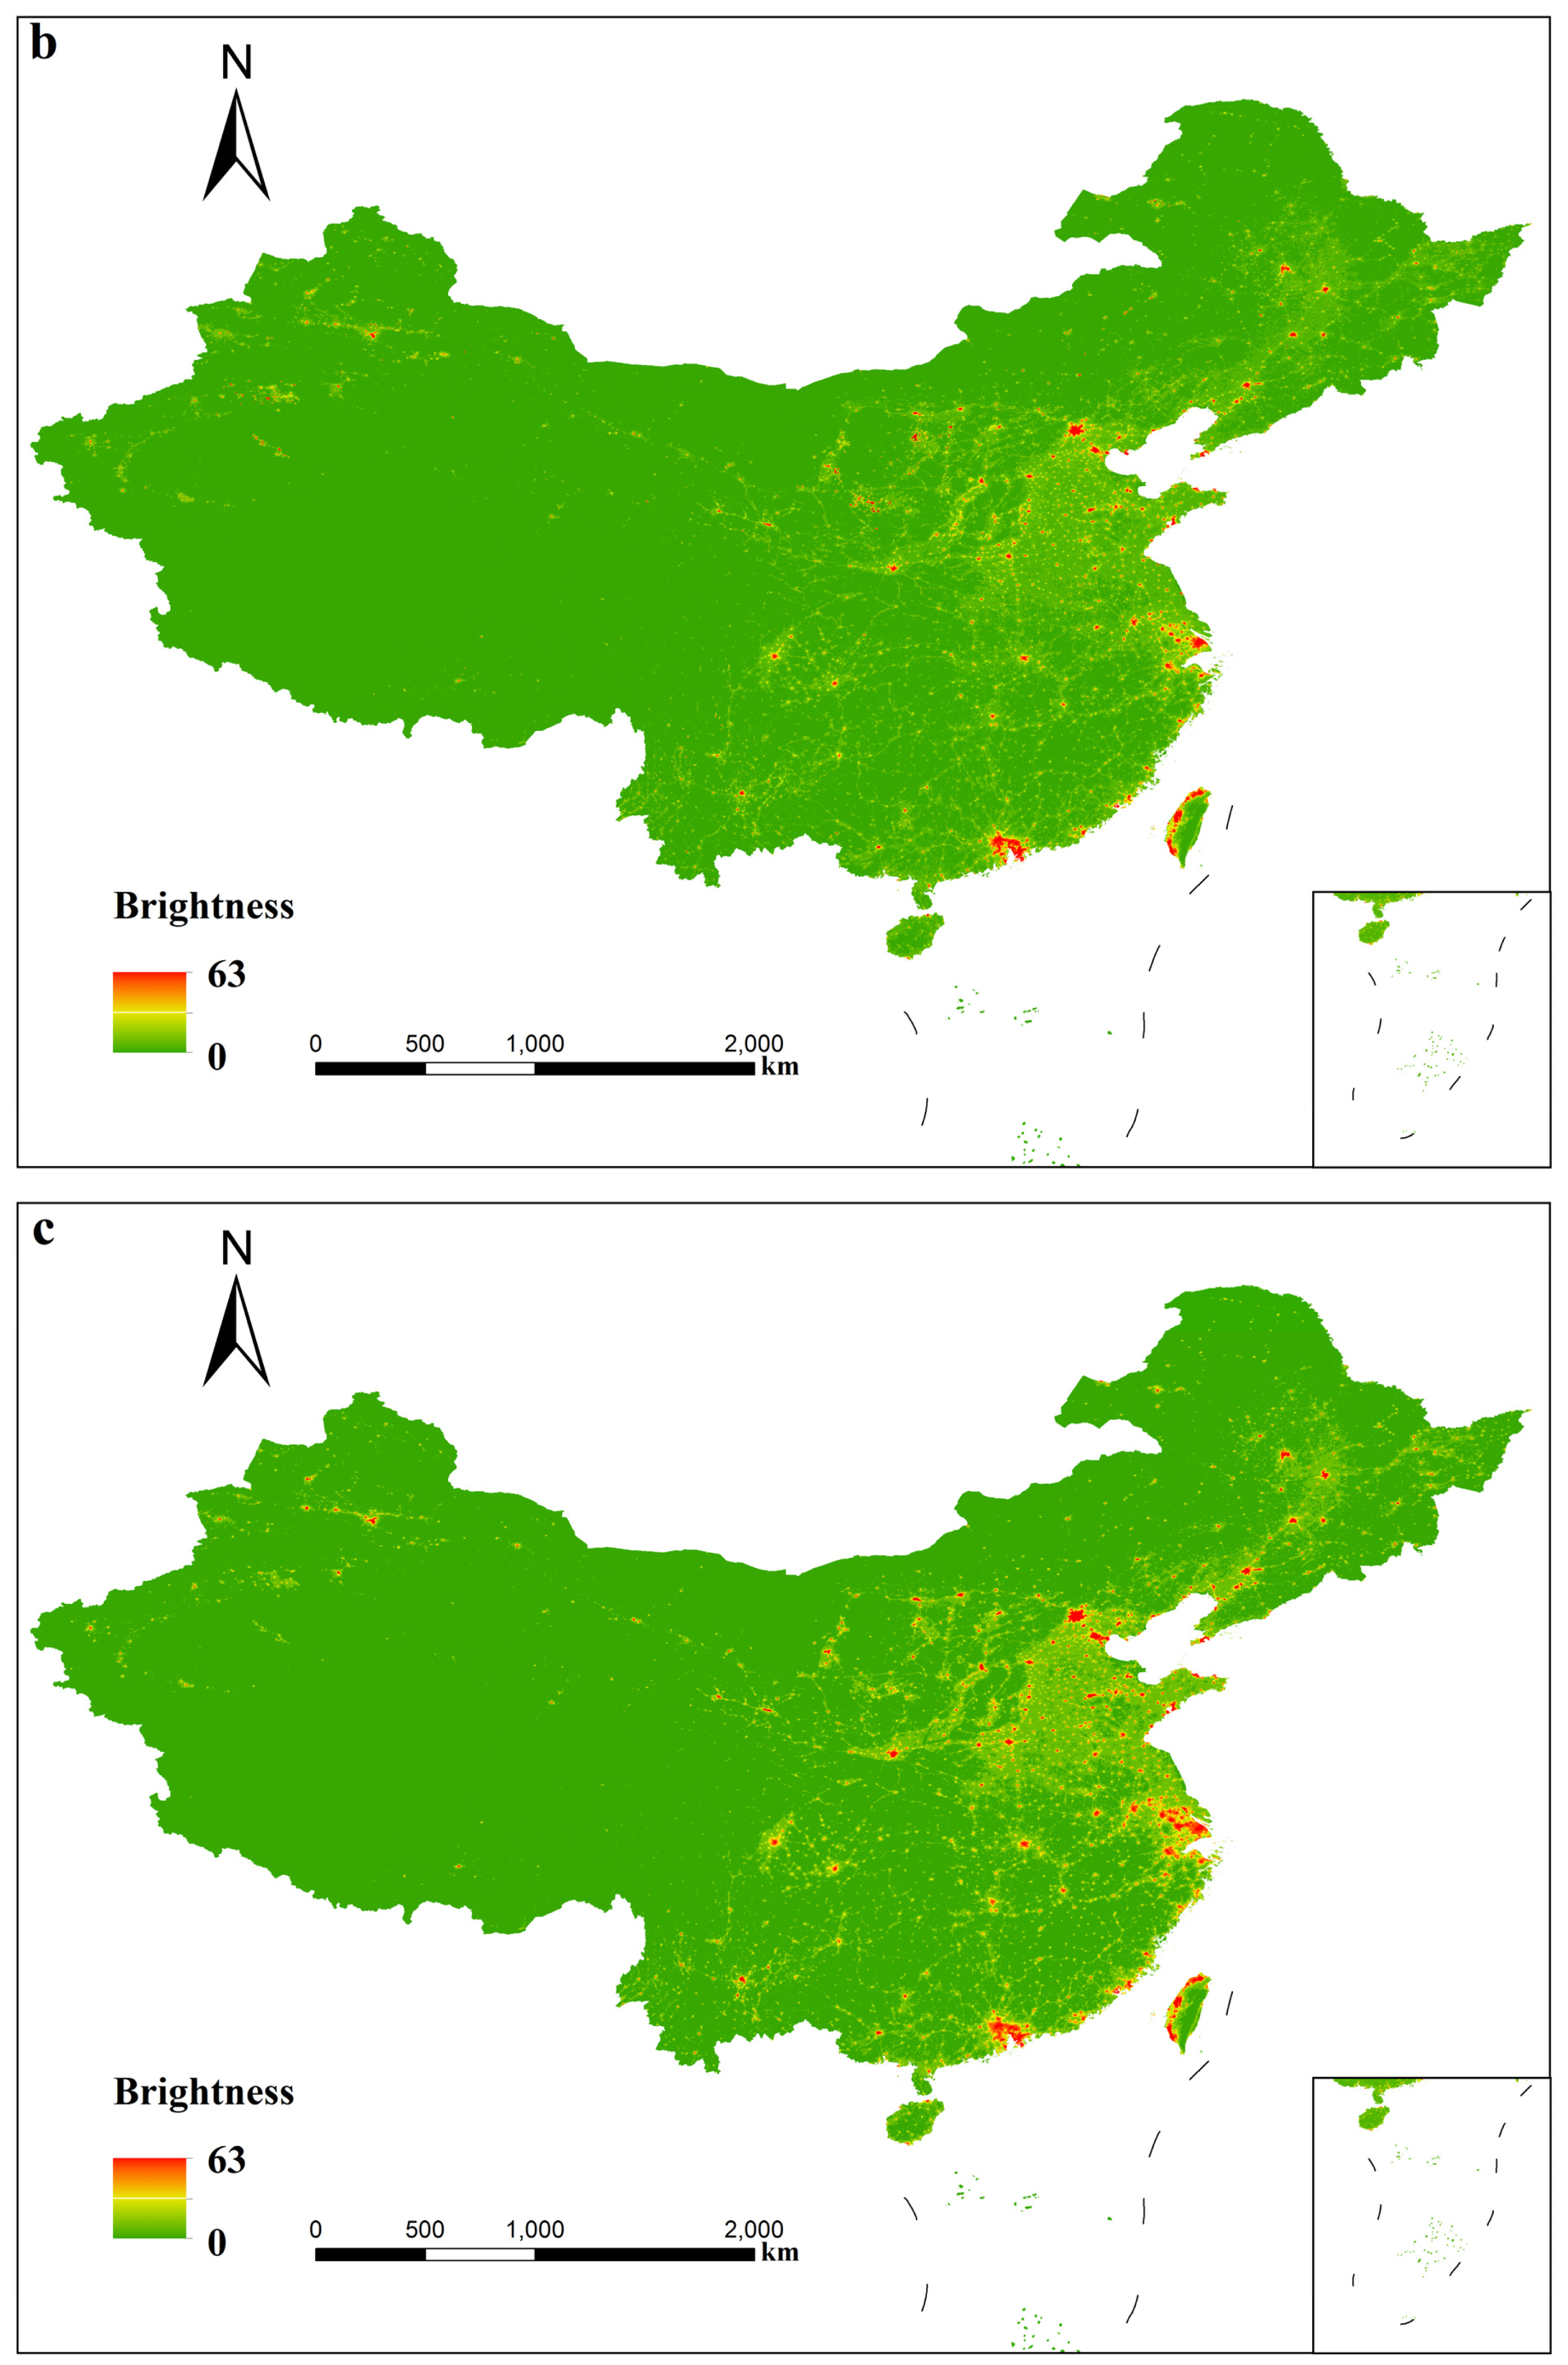
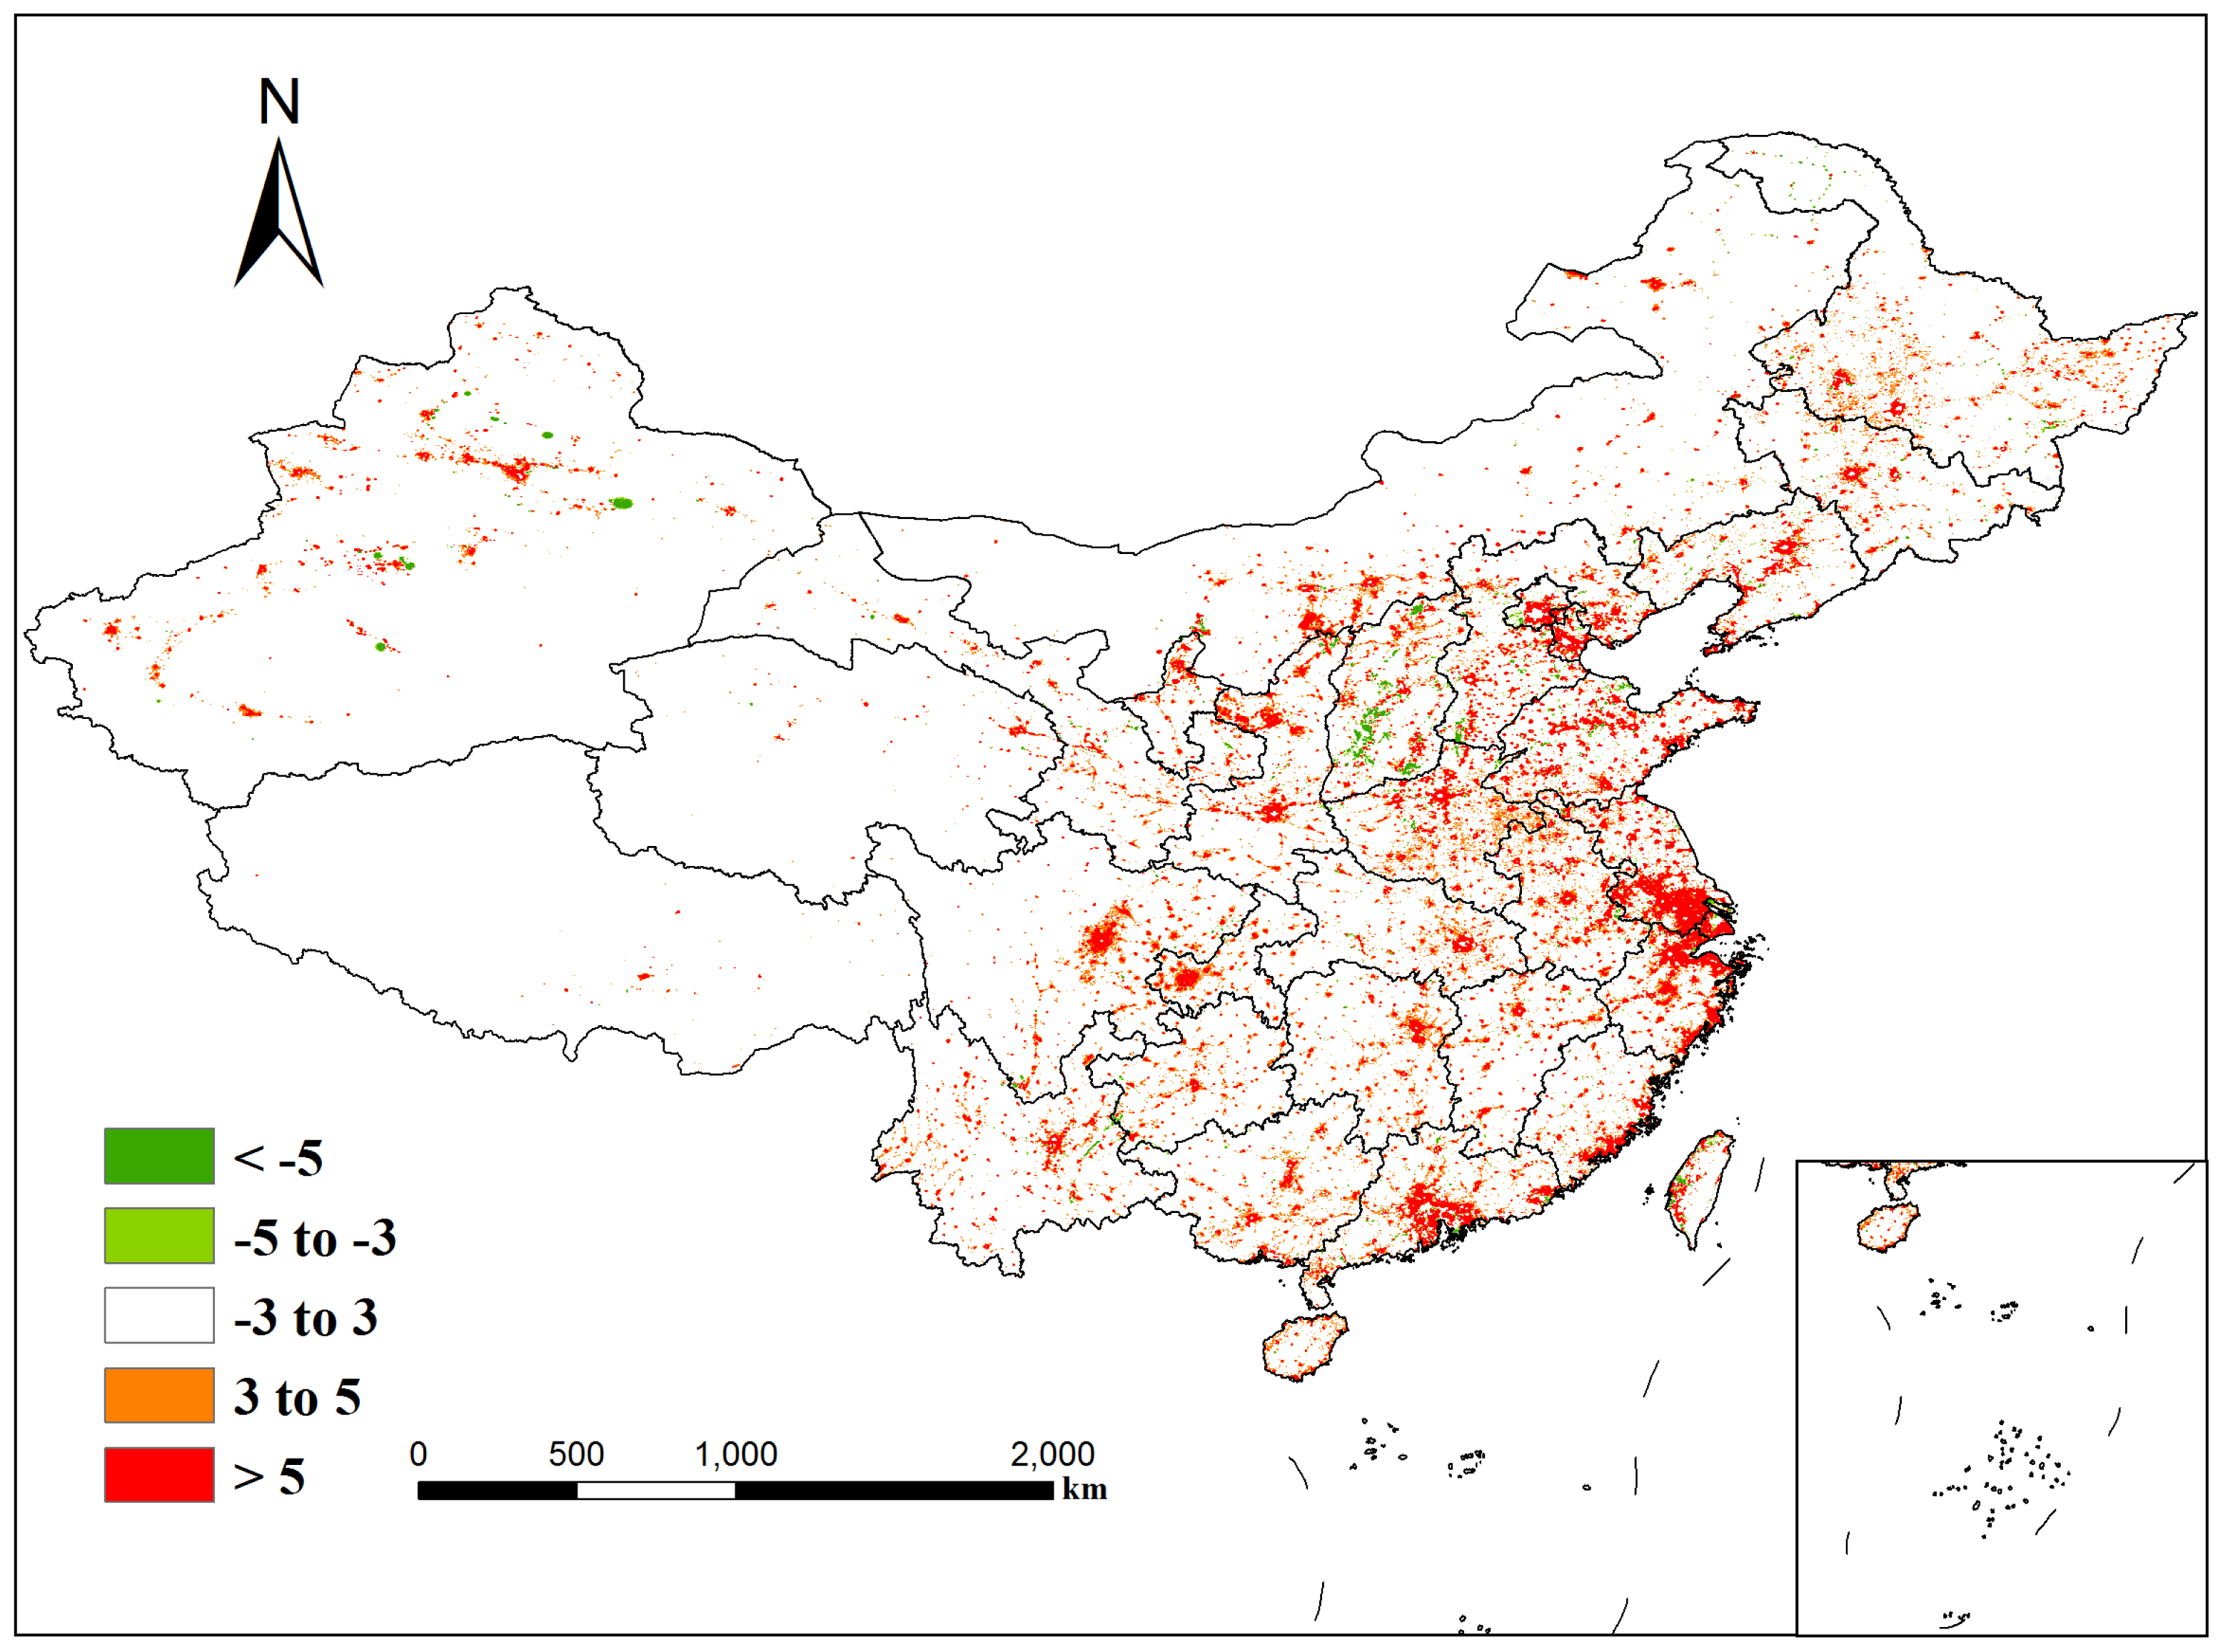
4.1. Temporal Analysis from 1992 to 2012

Classified maps of light pollution trends in China between the years of 1992–1996 and 2008–2012 are shown in Figure 4. The white portion represents minimum or no light pollution change captured by the satellite sensor, whereas the red part shows maximum light pollution increase trends, and the green section shows maximum light pollution decrease trends. Figure 4 indicates Yangtze River Delta and Tibetan Plateau are the areas that have the highest and lowest light pollution increase trend, respectively. This is because many urban and developed cities of the country are situated in the Yangtze River Delta region, whereas only a few developed cities are located in the Tibetan Plateau. The figure also shows that the eastern coastal areas, the Chengdu Plain, and the southern parts of Shanxi Province have the fastest light pollution increase trend in the country. This is understandable because the major urban cities (Shenyang, Beijing, Tianjin, Jinan, Qingdao, Nanjing, Shanghai, Hangzhou, Ningbo, Fuzhou, Xiamen, Guangzhou, Shenzhen, Chengdu, Chongqing and Xi’an) are located in these areas. According to census data, these cities are the highest-populated areas in the country, thus contributing the most to light pollution.
Figure 5, in which the green portion represents decrease trends, and the red part shows increase trends, maps the light pollution trends in China between 1992–1996 and 2000–2004 with several spatial characters. First, spatial distribution of light pollution change areas is consistent with spatial location of urban cities, especially in the Beijing-Tianjin-Tangshan region, Yangtze River Delta, Pearl River Delta, and Shandong Province (Figure 6). Numerous urban cities with rapid urbanization are located in these areas such as Beijing, Tianjin, Shanghai, Nanjing, Guangzhou, Shenzhen, Jinan, Qingdao and Suzhou. Second, the majority of eastern coastal areas indicated significant increase trends in the 1990s, whereas only provincial capitals such as Wuhan, Xi’an, Chengdu, Chongqing, Guiyang, and Xining showed increasing trends in the central and western regions. In addition, certain regions that are usually rich in mineral resources showed decreasing light pollution trends. This is understandable because the major urban cities (Datong, Handan, Pingdingshan, Maanshan, Panzhihua, and Dongying) reduced the production of mineral resources and adjusted industry structure in these areas. There was also a slight decrease in the small cities and towns, and in the central part of larger cities.
Likewise, trend detection between 2000–2004 and 2008–2012 using DMSP time-series data was investigated. Trend detection in China’s light pollution is shown in Figures 6 and 7. The results indicate that light pollution has increased in major urban areas of the country because of rapid urbanization and infrastructure development in the vicinity of the cities. In the spatial scale, the increasing light pollution trend expanded from 2.08% in the period from 1992–1996 to 2000–2004, to 5.64% in the period from 2000–2004 to 2008–2012 and the direction of expansion changed from the largest cities to the middle-sized and smaller cities, and from the eastern coastal areas to the central and western regions. Furthermore, light pollution in the eastern and central regions is becoming more serious. The Yangtze River Delta and North China Plain are the most light-polluted areas with dense increasing trend areas, and expansion direction area pattern. Since the start of the century, China has accelerated the pace of urbanization, vigorously developing small and medium-sized cities; implementing state development policies such as Western Development Program, Rise of Central China Plan, and Northeast China Revitalization Strategy; rebalancing the economy away from exports and investment, and towards the consumer; promoting regional cooperation and construction of urban agglomerations such as the Wuhan city circle, Chang-Zhu-Tan city cluster, and the Chengdu–Chongqing economic zone. Certain decreasing light pollution areas are only located in Fen River valley and parts of the Xinjiang region.

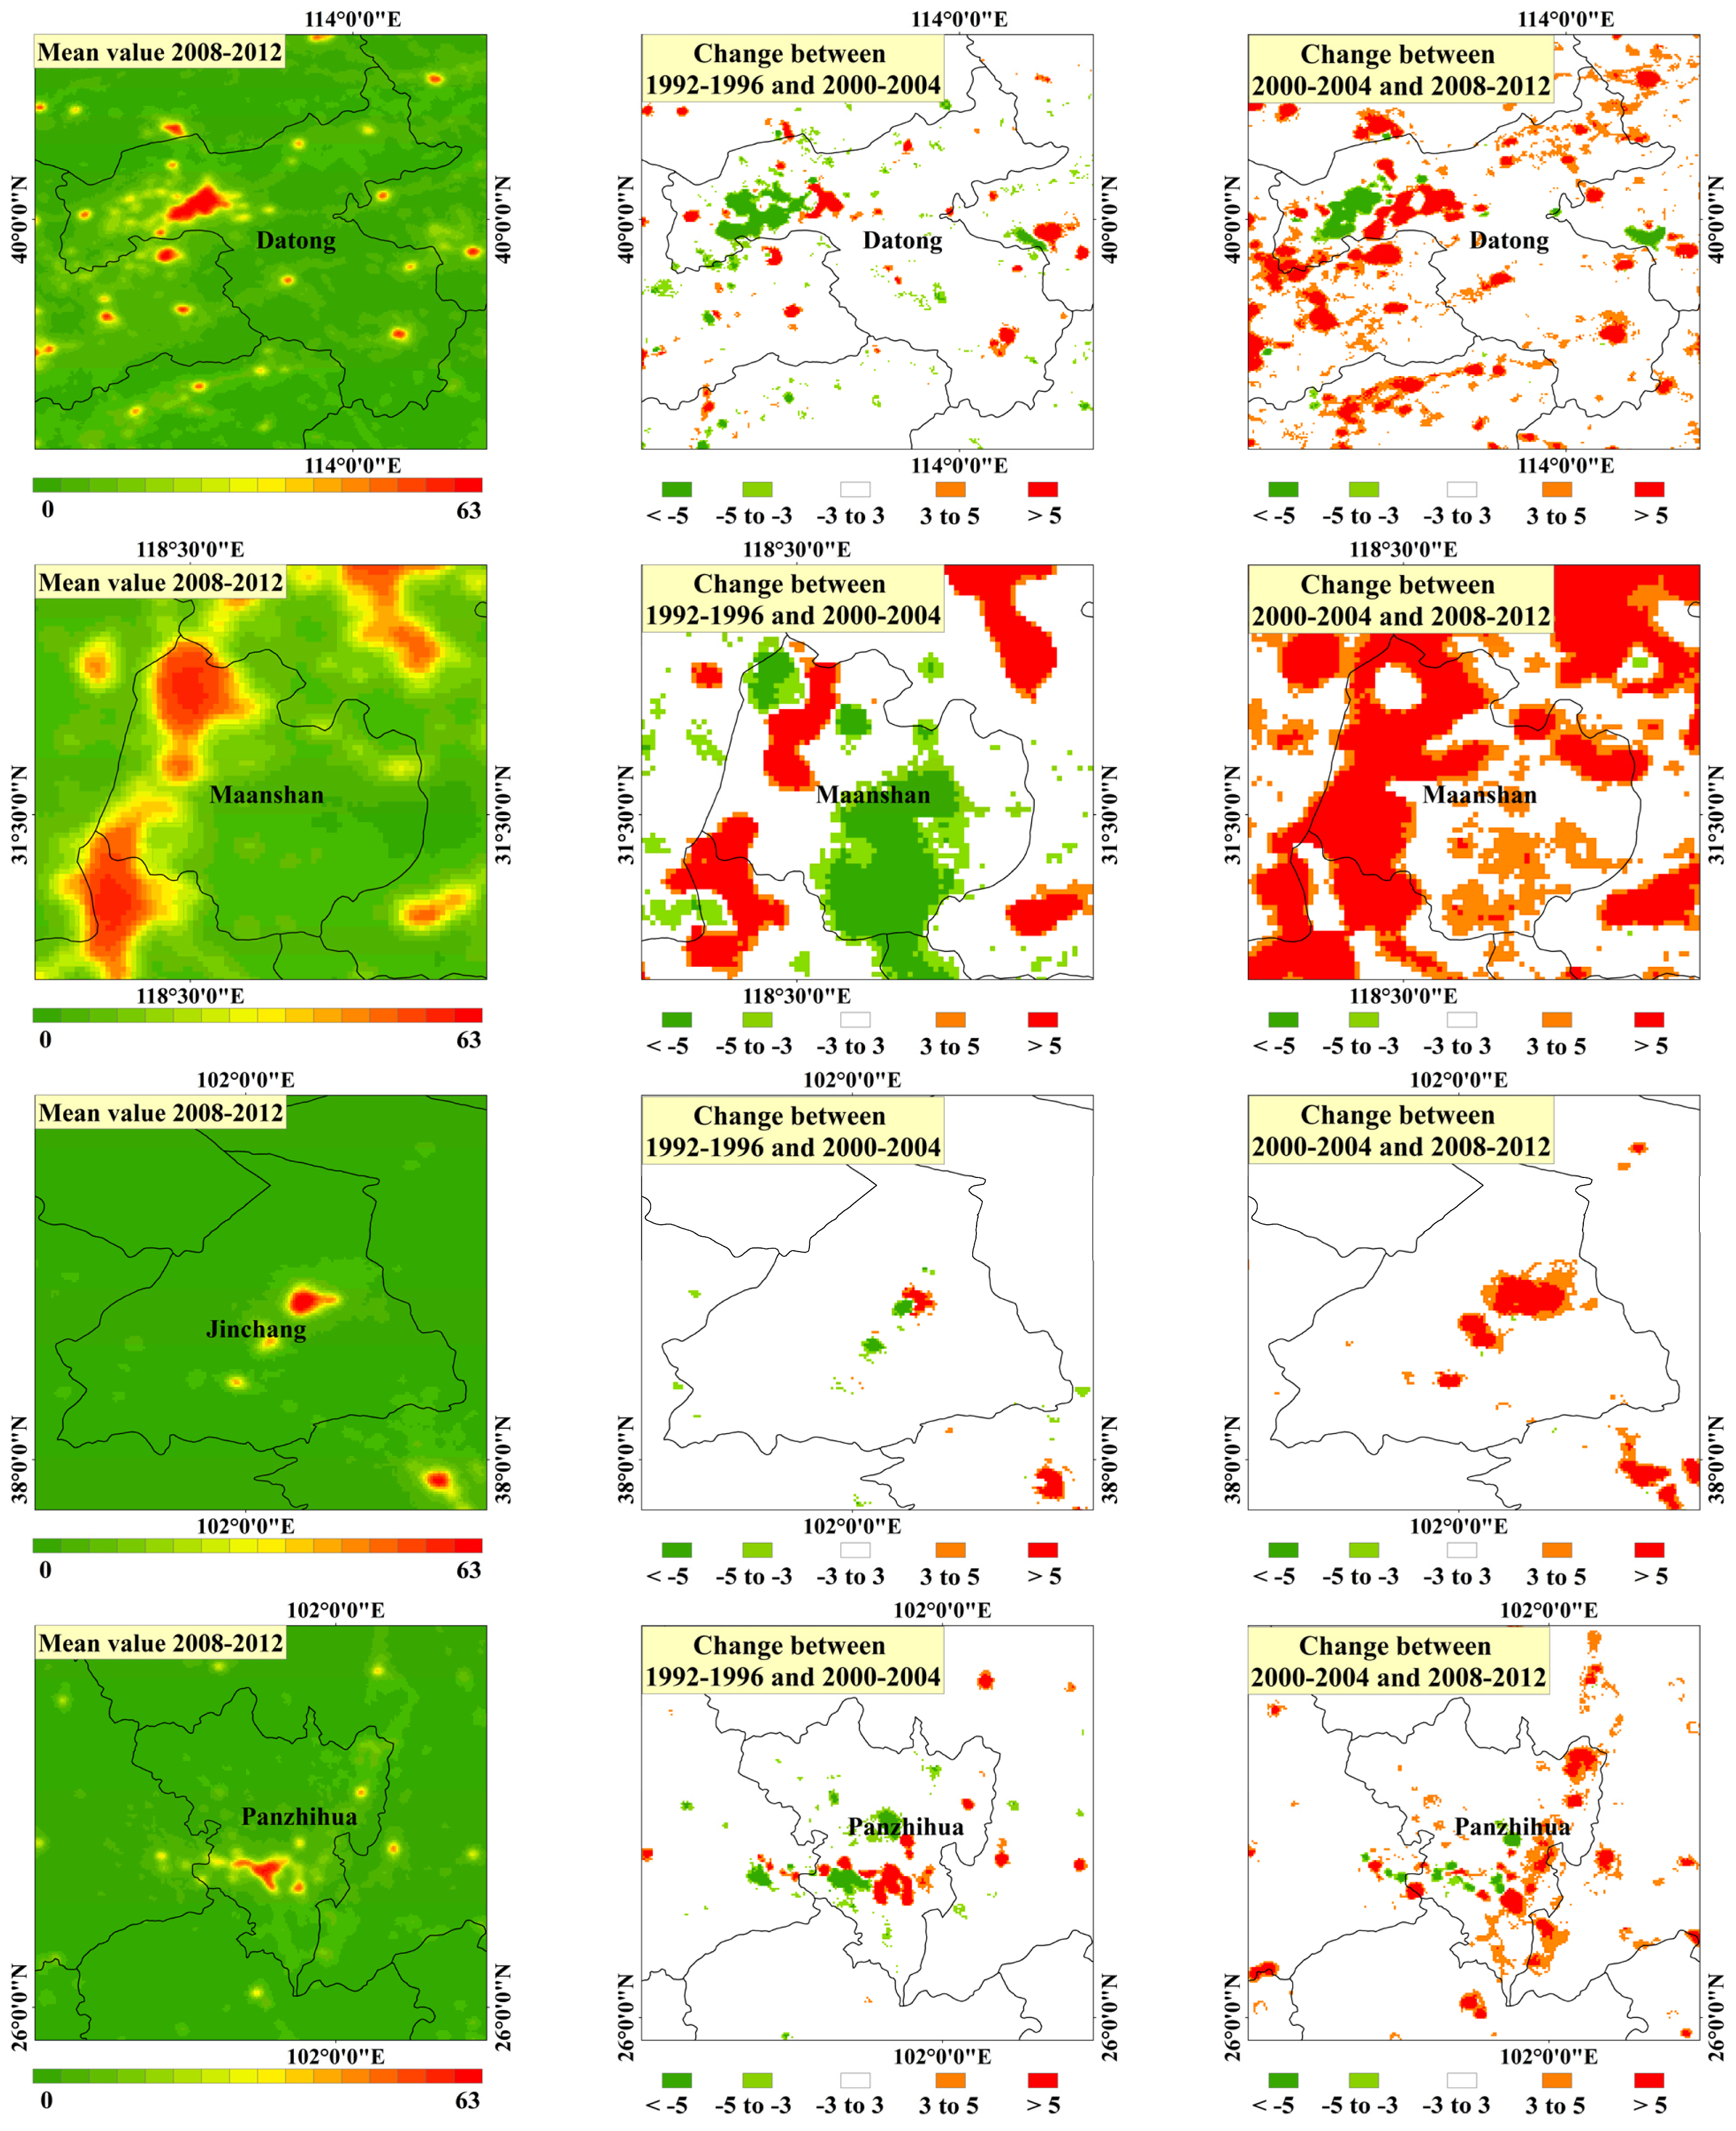
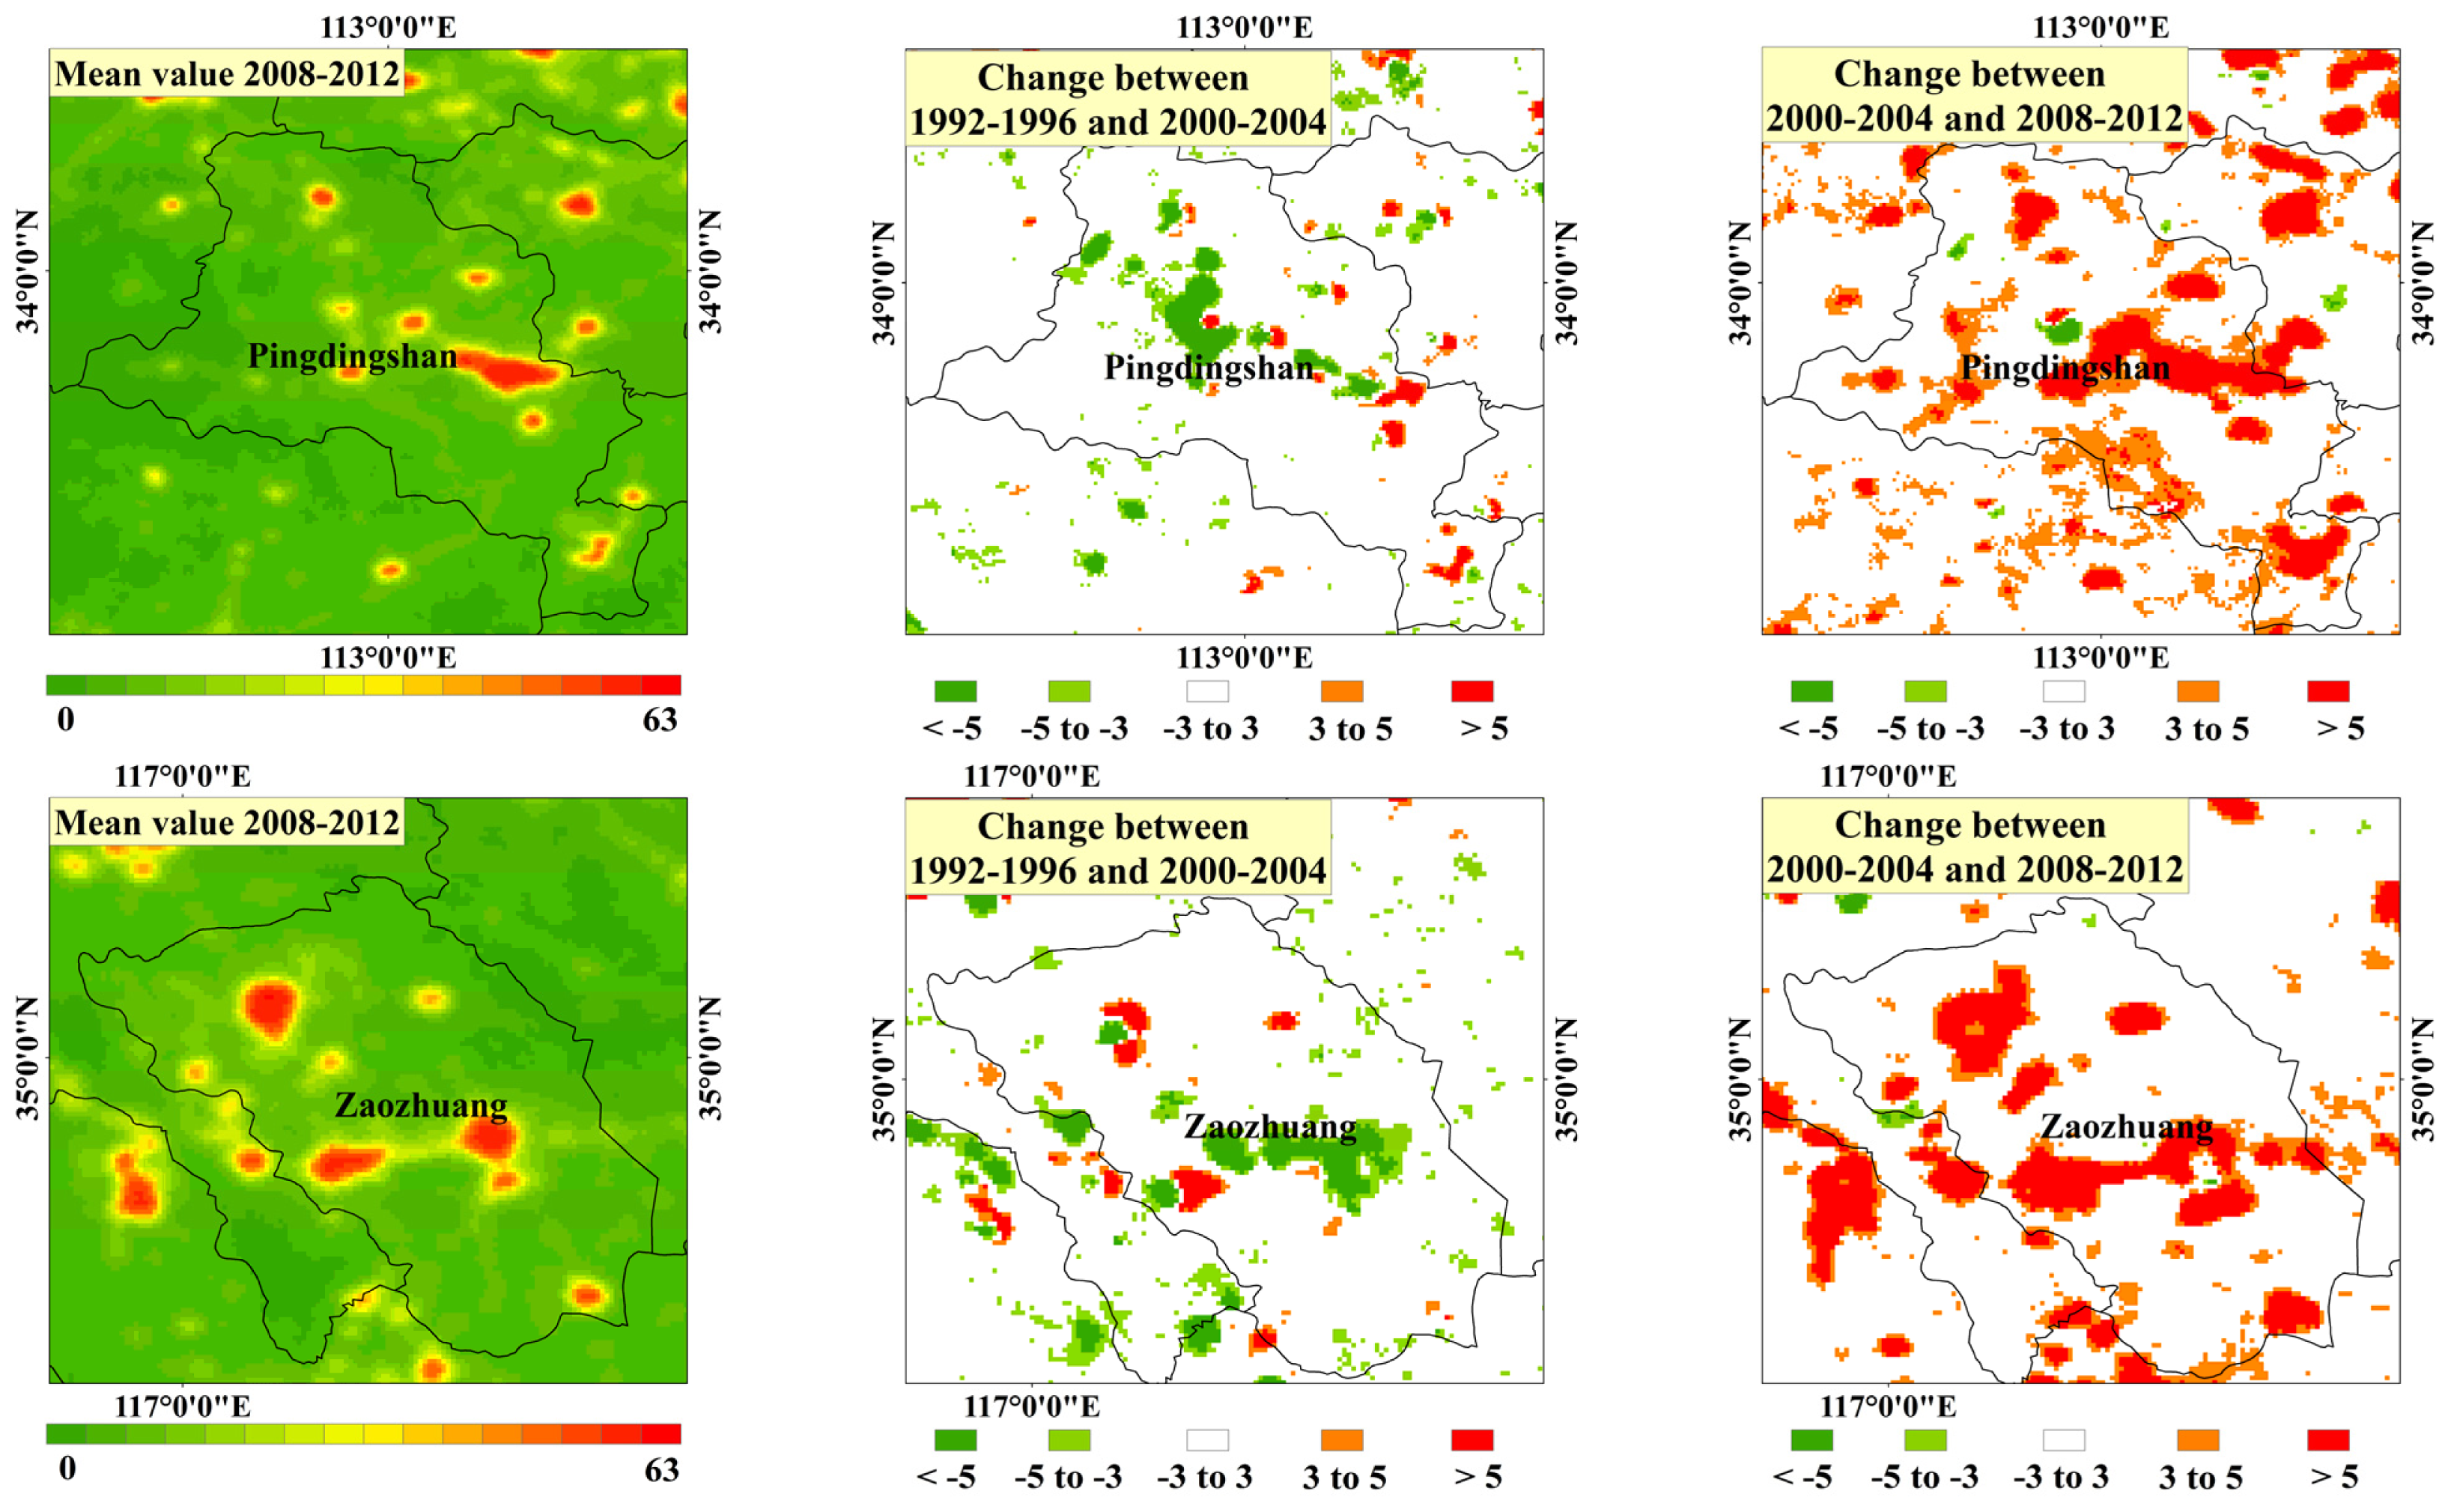
4.2. Special Analysis in Urban Scale

The six energy cities (Datong, Maanshan, Pingdingshan, Panzhihua, Jinchang and Zaozhuang), as presented in Figure 8, show that the light pollution trend significantly decreased and then increased from 1992 to 2012. In the late 1990s, light pollution showed its downside as a result of industry adjustment. Coal enterprises shut down the mines and compressed output, whereas petroleum chemical industries closed down small factories, which usually suffered from outdated equipment, gap in technology, low product quality, serious pollution, and high energy consumption. For example, the number of industrial enterprises in Datong reduced from 1337 in 1997 to 418 in 1998 [47], which decreased light pollution to some extent. Light pollution exhibited a significant increase after 2000 because of persistent economic development and rapid urbanization. In addition, Figure 6 clearly indicates that light pollution in eastern cities increases faster than that in the central and western regions.
Light pollution in some large urban central regions, as presented in Figure 9, showed a decreasing trend in the 1990s and rapid expansion in the 2000s, which led to net pollution, thereby causing serious pollution in large cities and secondary pollution in adjacent small cities. In the 1990s, because expansion of large urban cities received stricter regulations, measures to improve pollution were taken: street lamp renovation and removal of heavily polluted and high energy consumption factories located in central urban regions were conducted. With the development of market-oriented economy in the 2000s, urbanization accelerated gradually and urban population rapidly expanded. In the same period, the policy focused on developing small cities and towns, and urban agglomeration construction contributed to increasing light pollution in urban areas.
A certain amount of caution must be taken when interpreting apparent increases and decreases in brightness from these data as changes in absolute irradiance for several reasons. First, although imagery based on the emission of light upwards is the best available data on the global or large regional scales, it may not always correlate well with illumination of environmental or horizontal emissions emitted at low angles above the horizon that are the main cause of skyglow that is far from the original source. The complex links between artificial light observed from space and the environmental, health, scientific, and aesthetic effects of light pollution are not fully understood. Secondly, the capture method of spectral values between the DMSP/OLS instrument and other satellite sensors are different. Changes to lighting types may misleadingly appear as decreases in brightness because the OLS instrument has a peak response at wavelengths between 500 nm and 800 nm. The DMSP data that saturates in high spectral value region to some extent also needs to be considered carefully. Finally, because of lack of efficient cross-sensor calibration, atmospheric and surface conditions and “on-the fly” adjustment of instrument gain, the variation of acquired values between and within measurements taken by different sensors may not truly reflect surface conditions.
Evaluating the effects of light pollution on the natural and human environment is needed, as are technological developments, increasing pressure for energy efficiency and economic cost savings, and providing opportunities to introduce measures to reduce the effect of nighttime light. As higher quality NPP-VIIRS [20,4853] nighttime light imagery has been produced by the National Oceanic and Atmospheric Administration (NOAA), future studies can cover multi-temporal analysis of light pollution in higher spatial resolution.

5. Conclusion

By selecting China, the largest and fastest developing country in the world, as the study area, this research synthesizes RS and GIS techniques and monitoring light pollution change trends. The study proposed a simple monitoring method of light pollution change trend and analyzed change trends of light pollution from national and urban scales, particularly in industrial cities. This could potentially assist decision makers and environmental policies.
The present study is an application of RS and GIS technologies in the assessment of light pollution. DMSP imagery that provides information on nightlight pollution is the main data set used in the study. The analysis of nightlight data in China indicates a significant increase in light pollution in the last 20 years. Small and middle-sized cities are experiencing more serious light pollution. Light pollution in the spatial scale increased from 2.08% in the period from 1992–1996 to 2000–2004, to 5.64% in the period from 2000–2004 to 2008–2012. However, the light pollution change trends indicated different styles in different regions and times. In the 1990s, the main increasing trend regions were concentrated in larger urban cities that are mostly located in eastern and coastal areas, whereas mining cities and small cities as well as towns showed a decreasing trend. Meanwhile, certain large urban centers also indicated a slight reduction in light pollution. In the 2000s, an increasing trend in light pollution dominated nearly all urban cities in China except for several cities and regions in Shanxi and Xinjiang. The Yangtze River Delta and North China Plain are severely polluted areas in which the trend is becoming net pollution. In the urbanization area, future studies should focus on the quantitative relationship between light pollution and urban land use, urban sprawl and thermal pollution.
In this study, we detected light pollution trends in China using multi-temporal nighttime light imagery from 1992 to 2012, and mapped spatial light pollution in different times. This can provide guidance in developing and implementing environmental conservation planning. Furthermore, it can assist government agencies in determining the light pollution control area, initiating regulation projects, and taking nighttime environment measures.

Acknowledgment

We acknowledge the financial support from the “Strategic Priority Research Program—Climate Change: Carbon Budget and Related Issues” of the Chinese Academy of Sciences (XDA05050107), Ministry of Environment Protection—Chinese Academy of Sciences Cooperation Program (STSN-01-06). We greatly appreciate the useful suggestions and comments for the completion of this manuscript from the editor of the journal.

Conflict of Interest

The authors declare no conflict of interest.
  • Author ContributionsPengpeng Han, Jinliang Huang and Rendong Li conceived and designed the study. Pengpeng Han, Lihui Wang and Yanxia Hu made substantial contributions to acquisition, analysis and interpretation of the data. All authors discussed the basic structure of the manuscript, and Pengpeng Han finished the first draft. Yanxia Hu, Jiuling Wang and Wei Huang reviewed and edited the draft. All authors read and approved the submitted manuscript, agreed to be listed and accepted the version for publication.

References

  1. Cinzano, P.; Falchi, F.; Elvidge, C.D. The first World Atlas of the artificial sky brightness. Mon. Not. R. Astron. Soc 2001, 328, 689–707. [Google Scholar]
  2. Kuechly, H.U.; Kyba, C.C.M.; Ruhtz, T.; Lindemann, C.; Wolter, C.; Fischer, J.; Holker, F. Aerial survey and spatial analysis of sources of light pollution in Berlin, Germany. Remote Sens. Environ 2012, 126, 39–50. [Google Scholar]
  3. Pun, C.S.J.; So, C.W. Night-sky brightness monitoring in Hong Kong—A city-wide light pollution assessment. Environ. Monit. Assess 2012, 184, 2537–2557. [Google Scholar]
  4. Rodrigues, P.; Aubrecht, C.; Gil, A.; Longcore, T.; Elvidge, C. Remote sensing to map influence of light pollution on Cory’s shearwater in Sao Miguel Island, Azores Archipelago. European J. Wildl. Res 2012, 58, 147–155. [Google Scholar]
  5. Riegel, K.W. Light pollution. Science 1973, 179, 1285–1291. [Google Scholar]
  6. Longcore, T.; Rich, C. Ecological light pollution. Front. Ecol. Env 2004, 2, 191–198. [Google Scholar]
  7. Poulin, C.; Bruyant, F.; Laprise, M.H.; Cockshutt, A.M.; Vandenhecke, J.M.R.; Huot, Y. The impact of light pollution on diel changes in the photophysiology of Microcystis aeruginosa. J. Plan. Res 2014, 36, 286–291. [Google Scholar]
  8. Dominoni, D.M.; Quetting, M.; Partecke, J. Long-term effect of chronic light pollution on seasonal functions of European blackbirds (Turdus merula). PLOS One 2013. [Google Scholar] [CrossRef]
  9. Le Tallec, T.; Perret, M.; Thery, M. Light pollution modifies the expression of daily rhythms and behavior patterns in a Nocturnal primate. PLOS One 2013. [Google Scholar] [CrossRef]
  10. Gaston, K.J.; Bennie, J.; Davies, T.W.; Hopkins, J. The ecological impacts of nighttime light pollution: A mechanistic appraisal. Biol. Rev 2013, 88, 912–927. [Google Scholar]
  11. Gaston, K.J.; Davies, T.W.; Bennie, J.; Hopkins, J. REVIEW: Reducing the ecological consequences of night-time light pollution: Options and development. J. Appl. Ecol 2012, 49, 1256–1266. [Google Scholar]
  12. Gallaway, T.; Olsen, R.N.; Mitchell, D.M. The economics of global light pollution. Ecol. Econ 2010, 69, 658–665. [Google Scholar]
  13. Kyba, C.C.M.; Ruhtz, T.; Fischer, J.; Hölker, F. Cloud coverage acts as an amplifier for ecological light pollution in urban ecosystems. PLOS One 2011. [Google Scholar] [CrossRef]
  14. Falchi, F.; Cinzano, P.; Elvidge, C.D.; Keith, D.M.; Haim, A. Limiting the impact of light pollution on human health, environment and stellar visibility. J. Environ. Manag 2011, 92, 2714–2722. [Google Scholar]
  15. Navara, K.J.; Nelson, R.J. The dark side of light at night: physiological, epidemiological, and ecological consequences. J. Pineal Res 2007, 43, 215–224. [Google Scholar]
  16. Kloog, I.; Haim, A.; Stevens, R.G.; Barchana, M.; Portnov, B.A. Light at night co-distributes with incident breast but not lung cancer in the Female population of Israel. Chronobiol. Int 2008, 25, 65–81. [Google Scholar]
  17. Kloog, I.; Haim, A.; Stevens, R.G.; Portnov, B.A. Global co-distribution of light at night (LAN) and cancers of prostate, colon, and lung in men. Chronobiol. Int 2009, 26, 108–125. [Google Scholar]
  18. Lilensten, J.; Moedn, J.; Barthélemy, M.; Thissen, R.; Simon, C.; Lorentzen, D.A.; Dutuit, O.; Amblard, P.O.; Sigernes, F. Polarization in Aurorae: A new dimension for space environments studies. Geophys Res. Lett 2008. [Google Scholar] [CrossRef]
  19. Shi, K.F.; Yu, B.L.; Huang, Y.X..; Hu, Y.J.; Yin, B.; Chen, Z.Q.; Chen, L.J.; Wu, J.P. Evaluating the ability of NPP-VIIRS nighttime light data to estimate the gross domestic product and the electric power consumption of China at multiple scales: a comparison with DMSP-OLS data. Remote Sens 2014, 6, 1705–1724. [Google Scholar]
  20. Li, X.; Xu, H.M.; Chen, X.L.; Li, C. Potential of NPP-VIIRS nighttime light imagery for modeling the regional economy of China. Remote Sens 2013, 5, 3057–3081. [Google Scholar]
  21. Wen, T.; Wu, Y. Hard Light Pollution Complaints. Available online: http://epaper.oeeee.com/H/html/2010-06/30/content_1115916.htm (accessed on 9 April 2014). (In Chinese)
  22. Ye, P.S. Neon Billboards Too Dizzy To Pay Sewage Charges. Available online: http://gzdaily.dayoo.com/html/2010-04/21/content_937627.htm (accessed on 9 April 2014) . (In Chinese)
  23. Yang, X.C.; Yue, W.Z.; Gao, D.W. Spatial improvement of human population distribution based on multi-sensor remote-sensing data: an input for exposure assessment. Int. J. Remote Sens 2013, 34, 5569–5583. [Google Scholar]
  24. Ma, T.; Zhou, C.H.; Pei, T.; Haynie, S.; Fan, J.F. Quantitative estimation of urbanization dynamics using time series of DMSP/OLS nighttime light data: A comparative case study from China’s cities. Remote Sens. Environ 2012, 124, 99–107. [Google Scholar]
  25. Zhao, N.; Ghosh, T.; Samson, E.L. Mapping spatio-temporal changes of Chinese electric power consumption using night-time imagery. Int. J. Remote Sens 2012, 33, 6304–6320. [Google Scholar]
  26. Townsend, A.C.; Bruce, D.A. The use of night-time lights satellite imagery as a measure of Australia’s regional electricity consumption and population distribution. Int. J. Remote Sens 2010, 31, 4459–4480. [Google Scholar]
  27. He, C.Y.; Ma, Q.; Li, T.; Yang, Y.; Liu, Z.F. Spatiotemporal dynamics of electric power consumption in Chinese Mainland from 1995 to 2008 modeled using DMSP/OLS stable nighttime lights data. J. Geogr. Sci 2012, 22, 125–136. [Google Scholar]
  28. Levin, N.; Duke, Y. High spatial resolution night-time light images for demographic and socio-economic studies. Remote Sens. Environ 2012, 119, 1–10. [Google Scholar]
  29. Wu, J.; Wang, Z.; Li, W.; Peng, J. Exploring factors affecting the relationship between light consumption and GDP based on DMSP/OLS nighttime satellite imagery. Remote Sens. Environ 2013, 134, 111–119. [Google Scholar]
  30. He, C.; Shi, P.; Li, J.; Chen, J.; Pan, Y.; Li, J.; Zhuo, L.; Ichinose, T. Restoring urbanization process in China in the 1990s by using non-radiance-calibrated DMSP/OLS nighttime light imagery and statistical data. Chin. Sci. Bull 2006, 51, 1614–1620. [Google Scholar]
  31. He, C.; Ma, Q.; Liu, Z.; Zhang, Q. Modeling the spatiotemporal dynamics of electric power consumption in Mainland China using saturation-corrected DMSP/OLS nighttime stable light data. Int. J. Digit. Earth 2013. [Google Scholar] [CrossRef]
  32. Letu, H.; Hara, M.; Yagi, H.; Naoki, K.; Tana, G.; Nishio, F.; Shuhei, O. Estimating energy consumption from night-time DMPS/OLS imagery after correcting for saturation effects. Int. J. Remote Sens 2010, 31, 4443–4458. [Google Scholar]
  33. Yang, Y.; He, C.; Zhang, Q.; Han, L.; Du, S. Timely and accurate national-scale mapping of urban land in China using Defense Meteorological Satellite Program’s Operational Linescan System nighttime stable light data. J. Appl. Remote Sens 2013. [Google Scholar] [CrossRef]
  34. Butt, M.J. Estimation of light pollution using satellite remote sensing and geographic information system techniques. GISci. Remote Sens 2012, 49, 609–621. [Google Scholar]
  35. Bennie, J.; Davies, T.W.; Duffy, J.P.; Inger, R.; Gaston, K.J. Contrasting trends in light pollution across Europe based on satellite observed night time lights. Sci. Rep 2014. [Google Scholar] [CrossRef] [Green Version]
  36. Deng, X.; Huang, J.; Rozelle, S.; Uchida, E. Growth population and industrialization and land expansion of China. J. Urban Econ 2008, 63, 96–115. [Google Scholar]
  37. Zhang, K.H.; Song, S. Rural-urban migration and urbanization in China: Evidence from time-series and cross-section analyses. China Econ. Rev 2003, 14, 386–400. [Google Scholar]
  38. National Bureau of Statistics of China, China City Statistical Yearbook 2012; China Statistical Press: Beijing, China, 2013. (In Chinese)
  39. National Bureau of Statistics of China, China Statistical Yearbook for Regional Economy 2012; China Statistical Press: Beijing, China, 2012. (In Chinese)
  40. Baugh, K.; Elvidge, C.D.; Ghosh, T.; Ziskin, D. Development of a 2009 stable lights product using DMSP-OLS data. Proc. Asia-Pacific Adv. Net 2010, 30, 114–130. [Google Scholar]
  41. Small, C.; Elvidge, C.D. Night on Earth: mapping decadal changes of anthropogenic night light in Asia. Int. J. Appl. Earth. Obs 2013, 22, 40–52. [Google Scholar]
  42. Li, X.; Chen, X.L.; Zhao, Y.S.; Xu, J.; Chen, F.R.; Li, H. Automatic intercalibration of night-time light imagery using robust regress. Remote. Sens. Lett 2012, 4, 46–55. [Google Scholar]
  43. Elvidge, C.D.; Sutton, P.C.; Ghosh, T. A global poverty map derived from satellite data. Comp. Geosci 2009, 35, 1652–1660. [Google Scholar]
  44. Elvidge, C.D.; Ziskin, D.; Baugh, K.E.; Tuttle, B.T.; Ghosh, T.; Pack, D.W. A fifteen year record of global natural gas flaring derived from satellite data. Energies 2009, 2, 595–622. [Google Scholar]
  45. Liu, Z.F.; He, C.Y.; Zhang, Q.F.; Huang, Q.X.; Yang, Y. Extracting the dynamics of urban expansion in China using DMSP-OLS nighttime light data from 1992 to 2008. Landsc. Urban Plan 2012, 106, 62–72. [Google Scholar]
  46. National Bureau of Statistics in China, China City Statistical Yearbook 2013; China Statistics Press: Beijing, China, 2014. (In Chinese)
  47. Statistical Information of ShanXi, Shanxi Statistical Yearbook 1999; China Statistical Press: Beijing, China, 1997. (In Chinese)
  48. Miller, S.D.; Straka, W., III; Mills, S.P.; Elvidge, C.D.; Lee, T.F.; Solbrig, J.; Walther, A.; Heidinger, A.K.; Weiss, S.C. Illuminating the capabilities of the Suomi National Polar-Orbiting Partnership (NPP) Visible Infrared Imaging Radiometer Suite (VIIRS) day/night band. Remote Sens 2013, 5, 6717–6766. [Google Scholar]
  49. Elvidge, C.D.; Zhizhin, M.; Hsu, F.C.; Baugh, K.E. VIIRS nightfire: satellite pyrometry at night. Remote Sens 2013, 5, 4423–4449. [Google Scholar]
  50. Cao, C.; Xiong, J.; Blonski, S.; Liu, Q.; Uprety, S.; Shao, X.; Bai, Y.; Weng, F. Suomi NPP VIIRS sensor data record verification, validation, and long-term performance monitoring. J. Geophys. Res.: Atmos 2013, 118, 664–678. [Google Scholar]
  51. Cao, C.Y.; Shao, X.; Uprety, S. Detecting light outages after severe storms using the S-NPP/VIIRS day/night band radiances. IEEE Geosci. Remote Sens. Lett 2013, 10, 1582–1586. [Google Scholar]
  52. Le Borgne, P.; Pere, S.; Roquet, H. Night time detection of Saharan dust using infrared window channels: Application to NPP/VIIRS. Remote Sens. Environ 2013, 137, 264–273. [Google Scholar]
  53. Shi, K.F.; Huang, C.; Yu, B.L.; Yin, B.; Huang, Y.X.; Wu, J.P. Evaluation of NPP-VIIRS nighttime light composite data for extracting built-up urban areas. Remote Sens. Lett 2014, 5, 358–366. [Google Scholar]
Figure 1. Location of China and DMSP/OLS (F18 satellite) nighttime light imagery in 2012.
Remotesensing 06 05541f1
Figure 2. Correlation of DN values between 1992 and 2012 in the city of Jixi, Heilongjiang Province.
Remotesensing 06 05541f2
Figure 3. Pixel brightness (calibrated digital number) mean value 1992–1996 (a), 2000–2004 (b) and 2008–2012 (c).
Remotesensing 06 05541f3aRemotesensing 06 05541f3b
Figure 4. Change in brightness (calibrated digital number) between 1992–1996 and 2008–2012.
Remotesensing 06 05541f4
Figure 5. Change in brightness (calibrated digital number) between 1992–1996 and 2000–2004.
Remotesensing 06 05541f5
Figure 6. Percentage of land surface area increasing (red) or decreasing (green) in brightness (1992–1996 to 2000–2004 on the left, 2000–2004 to 2008–2012 on the right; provincial regions except Hong Kong, Macau and Taiwan).
Remotesensing 06 05541f6
Figure 7. Change in brightness (calibrated digital number) between 2000–2004 and 2008–2012.
Remotesensing 06 05541f7
Figure 8. Change trends in detected nighttime light among industrial cities.
Remotesensing 06 05541f8aRemotesensing 06 05541f8b
Figure 9. Change trends in detected nighttime light among large cities.
Remotesensing 06 05541f9aRemotesensing 06 05541f9b
Table 1. Coefficients of the second order regression models.
SatelliteYearabcR2
F1019920.00211.0297−1.12420.8977
19930.00251.1260−0.95440.9022
F1219940.00161.1312−1.13910.8902
19950.00820.63701.20330.8592
19960.00970.57781.49180.8272
F1419970.00091.07220.40250.8233
19980.00500.87290.52100.8538
19990.00071.09100.54100.9143
F1520000.00860.49862.17410.8809
20010.00121.0292−0.86520.9126
20020.00080.9713−0.67400.9629
2003−0.01261.7774−0.93330.9166
F162004−0.00101.1041−0.04500.9266
2005−0.00361.3178−0.74410.9646
2006−0.00561.3436−0.35140.9707
20070.00001.00000.00001.0000
20080.00120.92580.61220.9855
20090.00700.43602.35400.9030
F1820100.00350.74030.19450.9511
2011−0.00251.10730.10520.9584
20120.00850.22913.89710.9252

