Article

Assessment of Surface Urban Heat Islands over Three Megacities in East Asia Using Land Surface Temperature Data Retrieved from COMS

1
Department of Atmospheric Science, Kongju National University, 56, Gongjudaehak-ro, Gongju-si, Chungcheongnam-do 314-701, Korea
2
Global Environment System Research Division, National Institute of Meteorological Research, 33, Seohobuk-ro, Seogwipo-si, Jeju-do 697-845, Korea
*
Author to whom correspondence should be addressed.
Remote Sens. 2014, 6(6), 5852-5867; https://0-doi-org.brum.beds.ac.uk/10.3390/rs6065852
Submission received: 10 March 2014 / Revised: 3 June 2014 / Accepted: 3 June 2014 / Published: 20 June 2014

Abstract

:
Surface urban heat island (SUHI) impacts control the exchange of sensible heat and latent heat between land and atmosphere and can worsen extreme climate events, such as heat waves. This study assessed SUHIs over three megacities (Seoul, Tokyo, Beijing) in East Asia using one-year (April 2011–March 2012) land surface temperature (LST) data retrieved from the Communication, Ocean and Meteorological Satellite (COMS). The spatio-temporal variations of SUHI and the relationship between SUHI and vegetation activity were analyzed using hourly cloud-free LST data. In general, the LST was higher in low latitudes, low altitudes, urban areas and dry regions compared to high latitudes, high altitudes, rural areas and vegetated areas. In particular, the LST over the three megacities was always higher than that in the surrounding rural areas. The SUHI showed a maximum intensity (10–13 °C) at noon during the summer, irrespective of the geographic location of the city, but weak intensities (4–7 °C) were observed during other times and seasons. In general, the SUHI intensity over the three megacities showed strong seasonal (diurnal) variations during the daytime (summer) and weak seasonal (diurnal) variations during the nighttime (other seasons). As a result, the temporal variation pattern of SUHIs was quite different from that of urban heat islands, and the SUHIs showed a distinct maximum at noon of the summer months and weak intensities during the nighttime of all seasons. The patterns of seasonal and diurnal variations of the SUHIs were clearly dependent on the geographic environment of cities. In addition, the intensity of SUHIs showed a strong negative relationship with vegetation activity during the daytime, but no such relationship was observed during the nighttime. This suggests that the SUHI intensity is mainly controlled by differences in evapotranspiration (or the Bowen ratio) between urban and rural areas during the daytime.

1. Introduction

An urban heat island (UHI) is a phenomenon in which urban air temperatures are higher than rural air temperatures. Urban heat islands are largely caused by the widespread use of heat-trapping land surfaces, such as pavement, in urban areas and represent a growing concern because of rapid industrialization and urbanization since the mid-20th century [1,2]. As a result of industrialization and urbanization, populations have become concentrated in urban areas, and buildings or roads have been constructed on land that was previously vegetated. Hence, the increased thermal capacity and decreased evapotranspiration of land surfaces in urban areas and the release of artificial heat generated by various human activities have exacerbated the development of UHIs [3].
Urban heat islands have increased the number of heat wave days and tropical-like night conditions in several major cities, including Paris, Baltimore, Washington, D.C. and Shanghai, during the summer; this has led to a number of adverse disruptions in, for example, the electric power supply and has contributed to excesses in mortality [46]. The intensity of an UHI is mainly affected by two types of factors: (1) artificial factors, such as the urban area, population size and emissions of artificial heat from human activities; and (2) environmental factors, such as the geographic location (e.g., latitude, distance from a water body), topography and climate of the urban areas [7]. Because urban areas in East Asia, especially those in Korea and China, are rapidly expanding because of economic growth, UHI studies in these regions are urgently needed. Such studies would be beneficial for a variety of areas, including energy policy, urban planning and quality of life protections.
Urban heat island studies have generally been conducted using air temperatures, and these have focused mostly on the features and causes of UHIs and the relation between weather conditions and UHI intensity. Oke [1] showed that there is a positive correlation between the size of the urban area and the UHI intensity, and Roth et al. [7] showed that the UHI intensity is affected by artificial and environmental factors. Kim et al. [8] assessed the UHI of Seoul using air temperatures observed by automatic weather systems (AWS) from 1973 to 1996 and showed that the intensity of the UHI is lowest during noon in the summer and highest during winter nights; the data also showed that the UHI has a negative correlation with the wind speed, cloud cover and relative humidity. Moreover, Kim et al. [9] showed that coastal cities tend to have lower UHI intensities than inland cities, and this work was based on an analysis of the UHI intensities in six major cities in Korea (Seoul, Incheon, Daejeon, Daegu, Gwangju and Busan). Kim et al. [10] also showed that there are strong seasonal, weekly and diurnal variations in Seoul’s UHI intensity; these variations were lowest during the summer, higher on weekdays than on weekends and had a maximum of 3.4 °C at 03:00 local standard time and a minimum of 0.6 °C at 15:00 local standard time. While ground observed air temperature data by AWS has a high temporal frequency and accuracy, it often has limitations in regards to the spatial resolution that can be derived from the observing stations, which can impair quantitative assessments of the spatio-temporal variability in UHIs.
Alternatively, remote sensing data from satellites can be used to study UHIs. As the quality of background data, such as the surface spectral emissivity, has increased and the retrieval algorithms for land surface temperature (LST) have become more sophisticated, the quality of LST data retrieved from satellites has greatly improved in recent years (e.g., [1115]). As a result, a number of studies on UHIs using LST remote sensing data from satellites, which are referred to hereafter as SUHIs (surface urban heat islands), have been performed (e.g., [2,3,16]). The intensity of an SUHI is typically defined as the LST difference between the urban and the rural pixels. Previous studies on SUHIs have shown that the LST differences between urban and rural areas can amount to more than 5 °C, and these differences are largely the result of changes in the biophysical properties of the urban land surfaces [17]. In recent years, the spatial resolution and accuracy of geostationary satellite data (e.g., Meteosat Second Generation (MSG), Multi-Functional Transport Satellite (MTSAT) and Communication, Ocean and Meteorological Satellite (COMS)) have improved remarkably; hence, quantitative assessments of SUHIs have also shown similar improvements (e.g., [15,16,18]).
Surface urban heat islands occur by mechanisms that are different from those that contribute to the formation of a UHI [2,3,16,18]. In general, a UHI is mainly caused by the differences in radiative cooling between urban and rural areas during nighttime, whereas an SUHI is mainly caused by the differences in radiative surface heating between urban and rural areas during the daytime; hence, the spatio-temporal variations of UHIs and SUHIs can be different [13,16,18]. Consequently, additional assessments of the spatio-temporal variations of SUHIs using hourly LST data retrieved from geostationary satellites are needed. Additionally, as LSTs have an indirect, but significant, influence on air temperatures, comparisons of SUHI and UHI data can provide some insight into the relation between SUHIs and UHIs.
Until recently, most SUHI studies focused on the megacities of North America or Europe and used polar-orbiting satellite data [1922]. While there are about 60 megacities that have a population of more than one million in East Asia alone, SUHI studies in East Asia have been conducted relatively less frequently than in North America or Europe [16,18,2326]. Furthermore, SUHI analyses using the LST data retrieved from geostationary satellites, which have a better temporal frequency than analyses using data from polar orbiting satellites, are advantageous when attempting to study the diurnal variation of an SUHI.
In this study, the spatio-temporal variations of SUHIs over three megacities (Seoul, Tokyo, Beijing) in East Asia were analyzed using hourly LST data retrieved from COMS (Communication, Ocean and Meteorological Satellite), Korea’s first geostationary multi-purpose satellite. Additionally, diurnal variations of SUHIs were compared to the diurnal variations of UHIs, and the impacts of vegetation activity on the intensity of SUHIs were also investigated.

2. Data and Methods

2.1. Data

This study used hourly LST data from the National Meteorological Satellite Center of Korea. The data were retrieved from the COMS dataset by using the split-window method developed by Cho and Suh [15]. The spatial resolution and temporal frequency of the LST data were 4 km and 1 h, respectively, and 1-year data from April 2011 to March 2012, were used. Seoul, Tokyo and Beijing were selected as representative megacities of East Asia, because they have a population of more than ten million (Figure 1) and different geographic and climatic environments. To select rural pixels of similar latitudes and altitudes for estimating the intensities of SUHIs in the three selected megacities, land cover data with a spatial resolution of 1 km (KLC_EA_v2.0) [27] and altitude data with a spatial resolution of 4 km were used.
In addition, ground observed cloud amount data provided by the Korea Meteorological Administration (KMA) and Japan Meteorological Agency [28,29] were used in the selection of cloud-free LST data for Seoul and Tokyo, respectively. Additionally, ground observed air temperature data provided by the KMA [28] were used for the comparative analysis of diurnal variations of UHIs and SUHIs. For the analysis of the relationship between SUHIs and vegetation activity, normalized difference vegetation index (NDVI) data (MYD13A2, MOD13A2) were retrieved from the MODIS (Moderate Resolution Imaging Spectroradiometer) dataset and used in this study; these data were downloaded from the United States Geological Survey’s (USGS) website [30]. The temporal frequency and spatial resolution of MODIS NDVI data were 8 d and 1 km, respectively.

2.2. Methods

Table 1 shows geographic information for the three megacities in East Asia that were selected for the analysis of SUHIs. The corresponding rural geographic information that was used to evaluate each of the three megacities is also shown in Table 1. The selected pixels representing the urban areas in the three megacities were the pixels that had a high density of high-rise buildings or downtown areas, and these pixels did not include rivers or low mountains in the land cover data (KLC_EA_v2.0). The spatial resolution and the number of land cover types of KLC_EA_v2.0 were 1 km and 17, respectively [27]. The initial input data for KLC_EA_v2.0 were derived from the 3-year (2006–2008) MODIS NDVI data. The selected rural pixels included those with relatively more vegetated areas, such as forests or farmlands, among the regions located within about 50 km of the corresponding urban pixels at the same latitude. To minimize the effects of environmental factors, such as differences in altitude, latitude and geographic environments, in the analysis of the spatio-temporal variations of the SUHIs, differences in latitude, altitude and distance between two points were considered when selecting the rural points. There were some differences in altitude between the rural pixels and the corresponding urban pixels used. For example, as Seoul and Tokyo are surrounded by ocean and located in mountainous areas, differences in altitude between the selected urban and rural pixels were around 250 m. Hence, the intensity of SUHIs in these two cities may have been exaggerated by the lapse rate effect of LST with altitude.
To analyze seasonal and diurnal variations of SUHIs, temporally continuous LST data over the analysis regions are required. However, sampling of hourly LST data was very limited in the analysis region, in particular during the summer, because of persistent clouds or problems with the satellite observation data. To increase the reliability of the research results, the LST data that had the least contamination from noise, such as that from clouds and/or fog, were selected for further use. The threshold cloud amount for the selection of cloud-free days was set to 2/10 for Seoul and Tokyo. However, for Beijing, most cloud-free days were selected by visually analyzing the satellite images, because cloud amount data from the China Meteorological Administration were not available. In addition, to minimize the effects of weather conditions on the spatio-temporal variations of SUHIs, only days that were moderately windy (less than 5 m/s) and had no precipitation on the reference day and on the previous day were selected for analyses.
To analyze the seasonal and diurnal variations of SUHIs, the seasonal or diurnal averages of the selected urban and rural areas were used. However, because the weather conditions (mainly cloud amounts) of the three megacities were different, the numbers of selected LST data points were also significantly different for the different cities and seasons. This means that the results of this study should be interpreted with caution.

3. Results

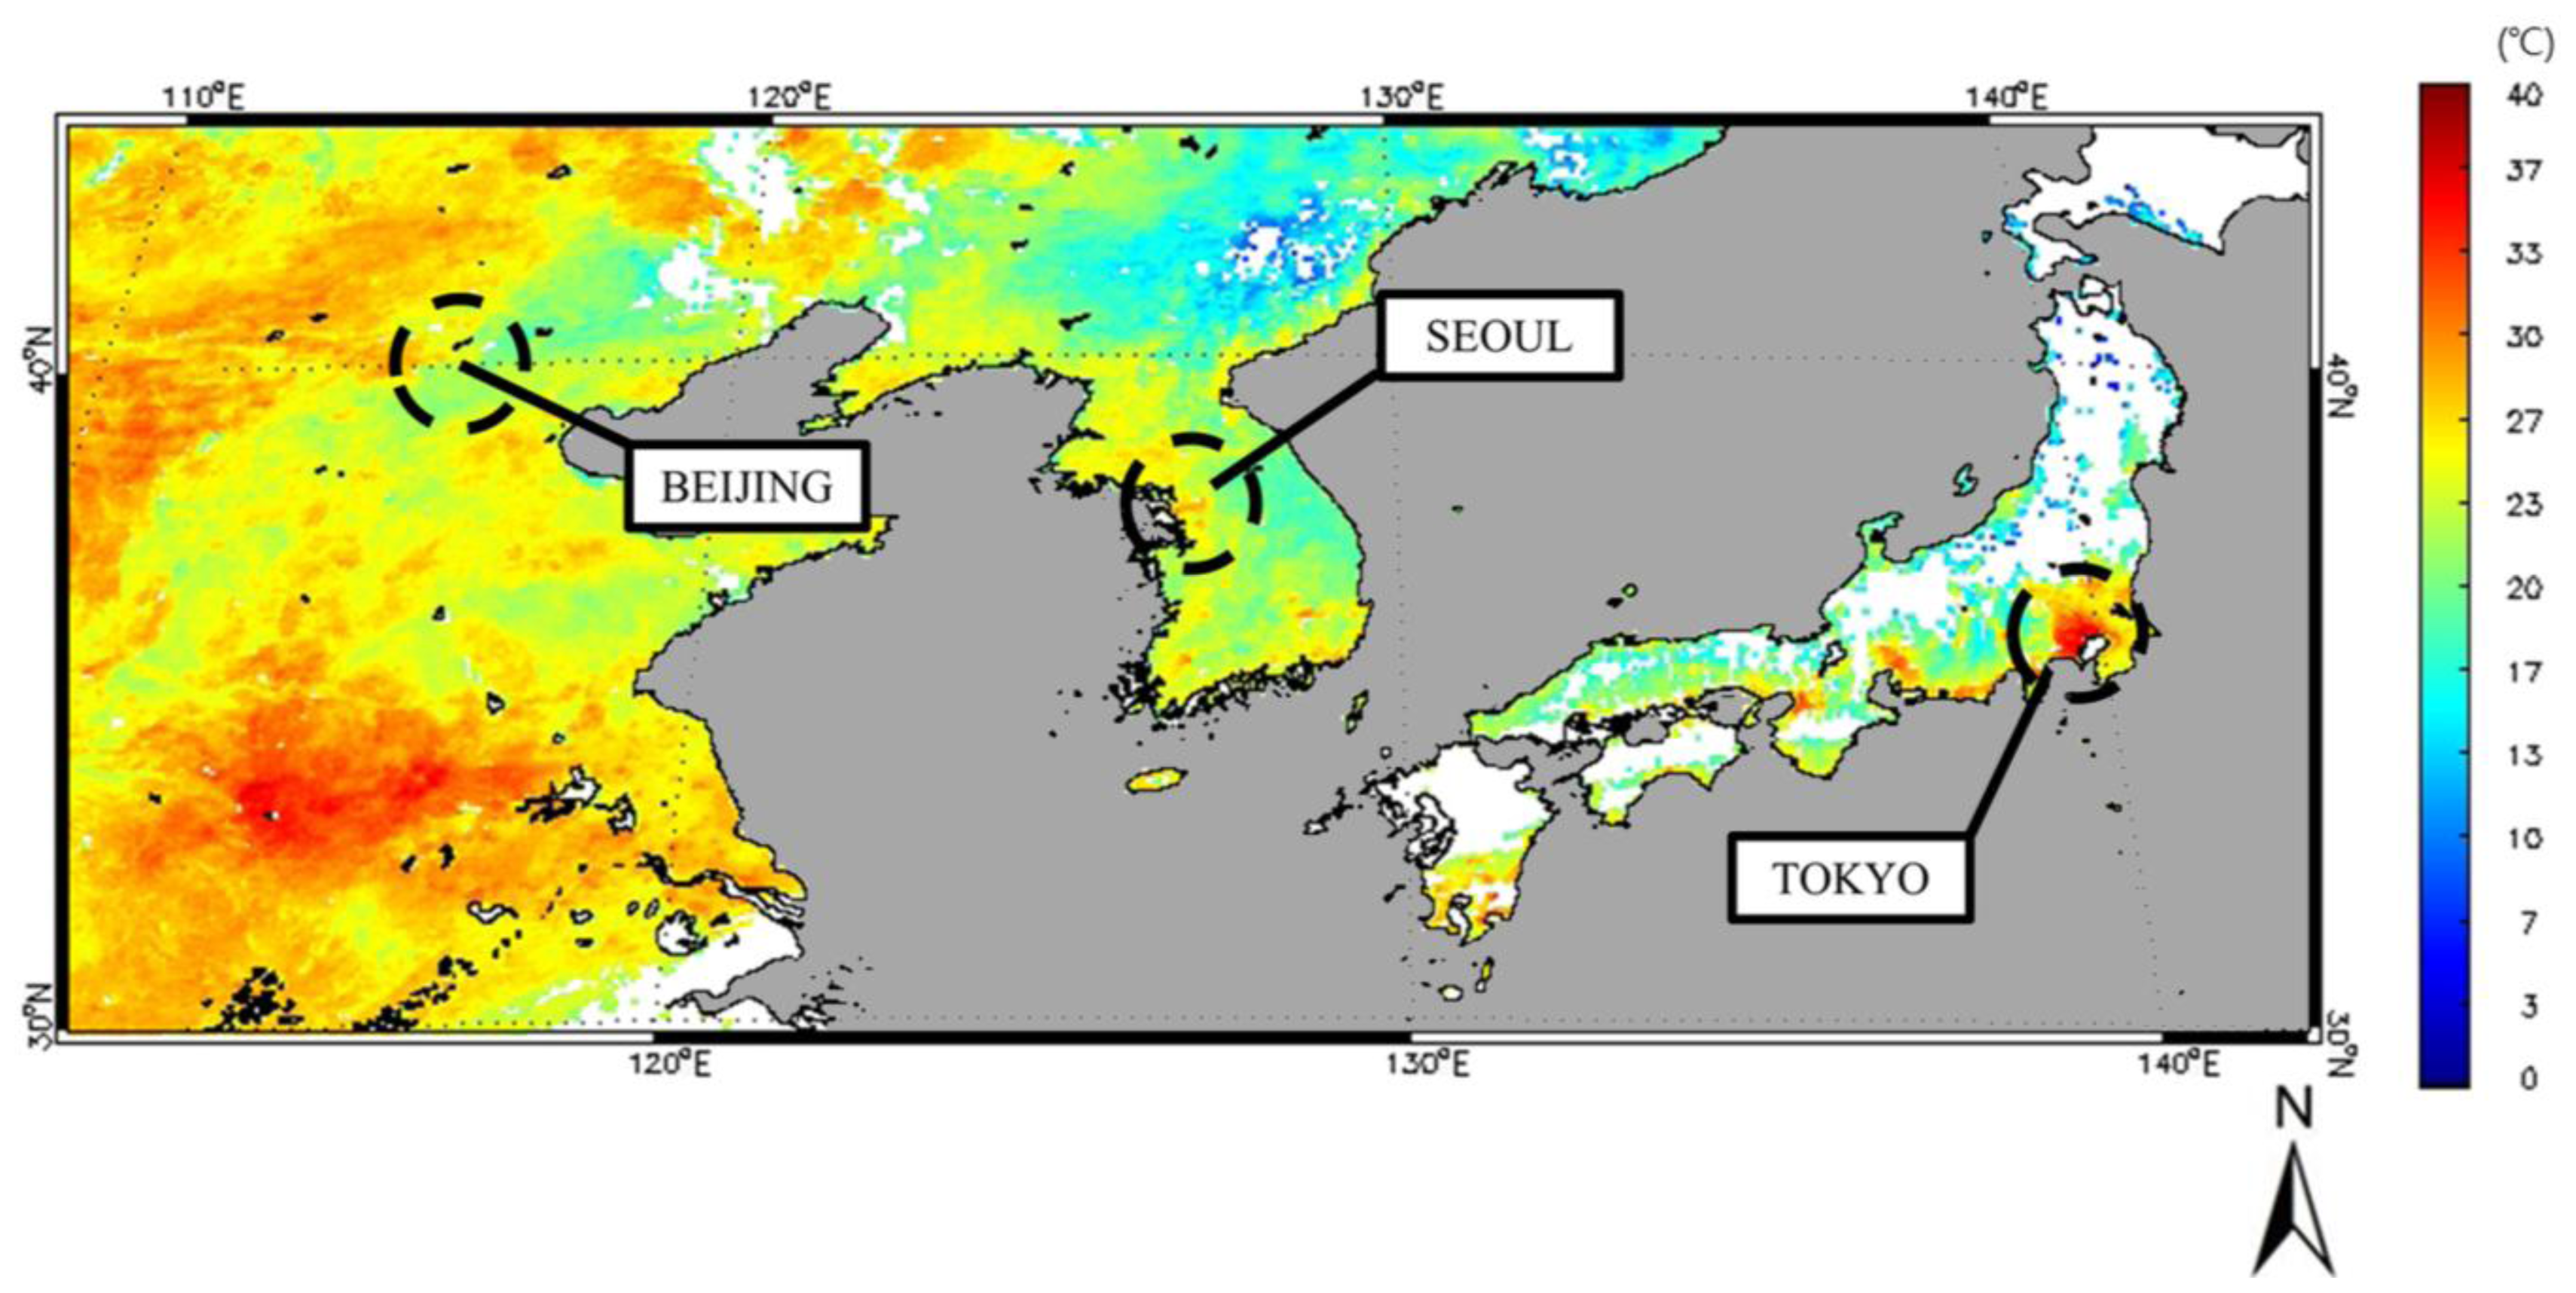
3.1. Spatial Distribution

Figure 2 shows the spatial distribution of LST on the Korean Peninsula, which was retrieved from the COMS data. In the two images, we can see that the LSTs in the major cities, such as Seoul and its metropolitan areas, Daejeon, Daegu, Gwangju and Busan, were distinctly higher than those over the surrounding rural or mountainous areas. Additionally, the high LST areas, in particular, at the western and southern coastal regions of the Korean Peninsula, were markedly larger in September than in October. This seems to be related to the fact that as the season progresses from early October to mid-October, crops in the farmland reach the harvesting season, and the deciduous vegetation in the mountainous areas begins to shed leaves. The northwestern regions in the images (Manchuria), while not being urban areas, showed very high LSTs in both September and October. This was probably due to the fact that most of these regions are farmlands, and in October, some of the farmland is bare after harvest; thereby, these regions are drier than the surrounding regions, which can have an effect on LST. When we take into consideration the decreases in solar energy that occur during the seasonal progression, this figure confirms that vegetation activity, e.g., evapotranspiration and shadowing, can be a major factor that influences the spatio-temporal variations of LST; this has been observed in other work, as well (e.g., [3,18]).

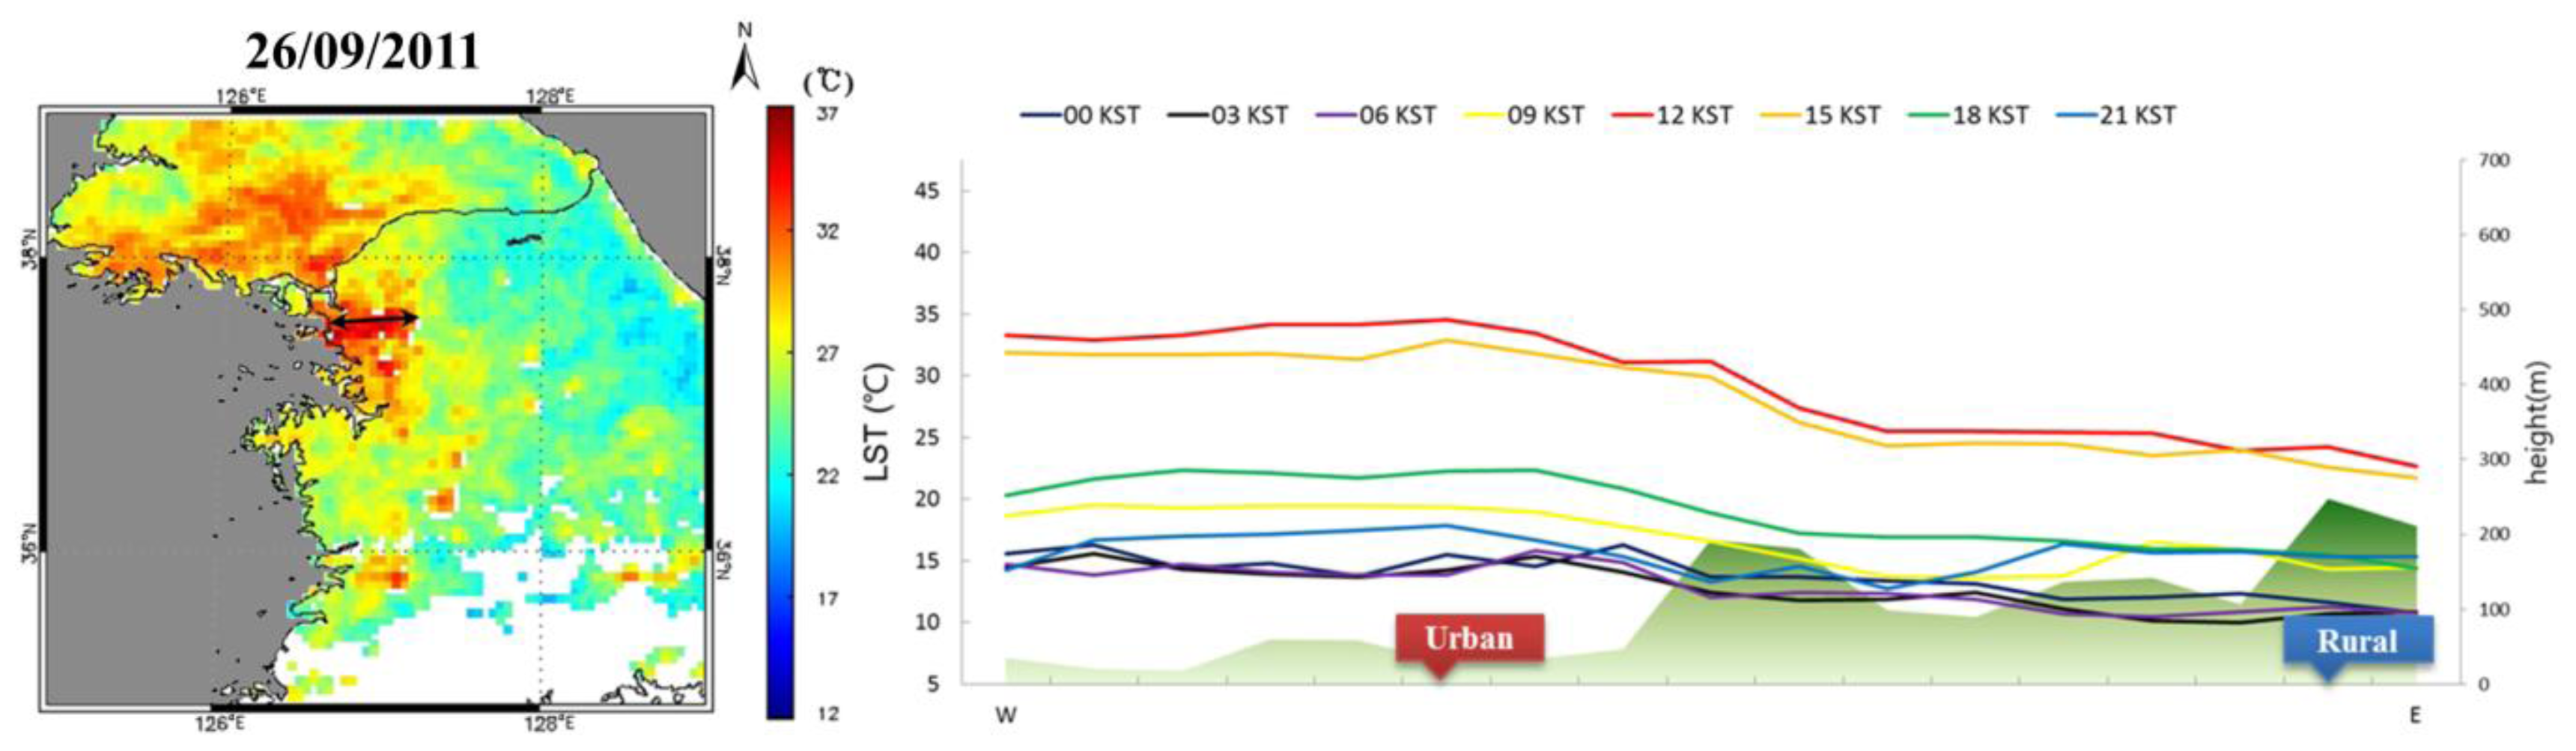
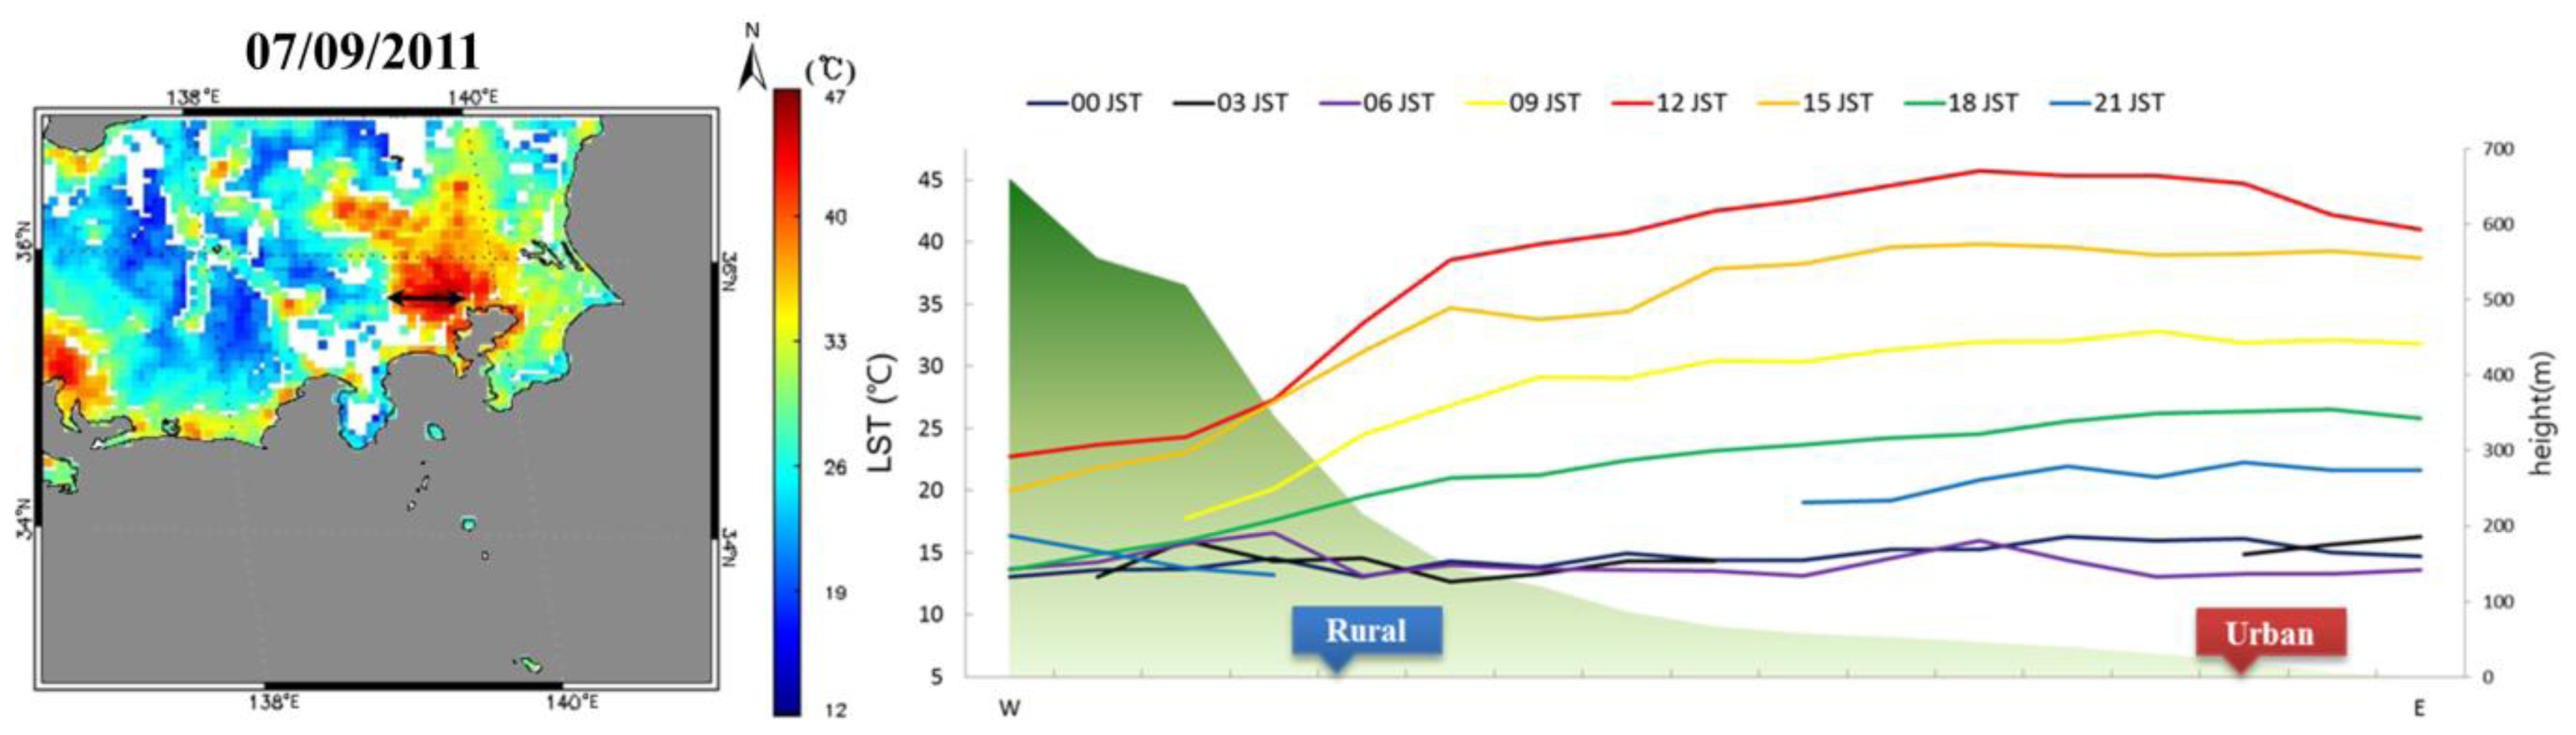
3.2. Spatial and Temporal Variations

To qualitatively analyze the spatio-temporal variations of LST, the hourly east–west cross-sectional distribution of LST on cloud-free days in the selected three megacities was used (Figures 35). We tried to use the LST data from the summer when the intensities of SUHIs were highest, but the number of cloud-free days during the summer was very limited, largely because of the East Asian summer monsoon; hence, days when their cloud amounts were smallest and close to summer were selected for further analysis. In all of the three cities, the LST was highest at 12:00 local standard time, and it showed slight spatial variations during nighttime. Moreover, the LST was higher in downtown areas than in rural areas. Although the geographic environments and climatic conditions of the three megacities are different, the diurnal variations of the LST were consistently larger (7–15 °C) in the urban areas than in the rural areas. As a result, the intensity of SUHIs was higher during the daytime than during nighttime, irrespective of the cities. However, as shown in Table 1 and Figures 35, height differences between urban and rural points were relatively large (around 250 m) in Seoul and Tokyo, but very small in Beijing. Therefore, the larger LST differences between urban and rural areas in Seoul and Tokyo are partly due to the influence of topography differences. In addition, while the spatio-temporal variations of LST and differences between the urban and rural areas are large during the daytime, these are very small during nighttime, irrespective of the geographic locations. This indicates that the land surface conditions (for example, whether being vegetated or not), as well as the diurnal variations of solar radiation energy are important factors that affect the spatio-temporal variations of LST.

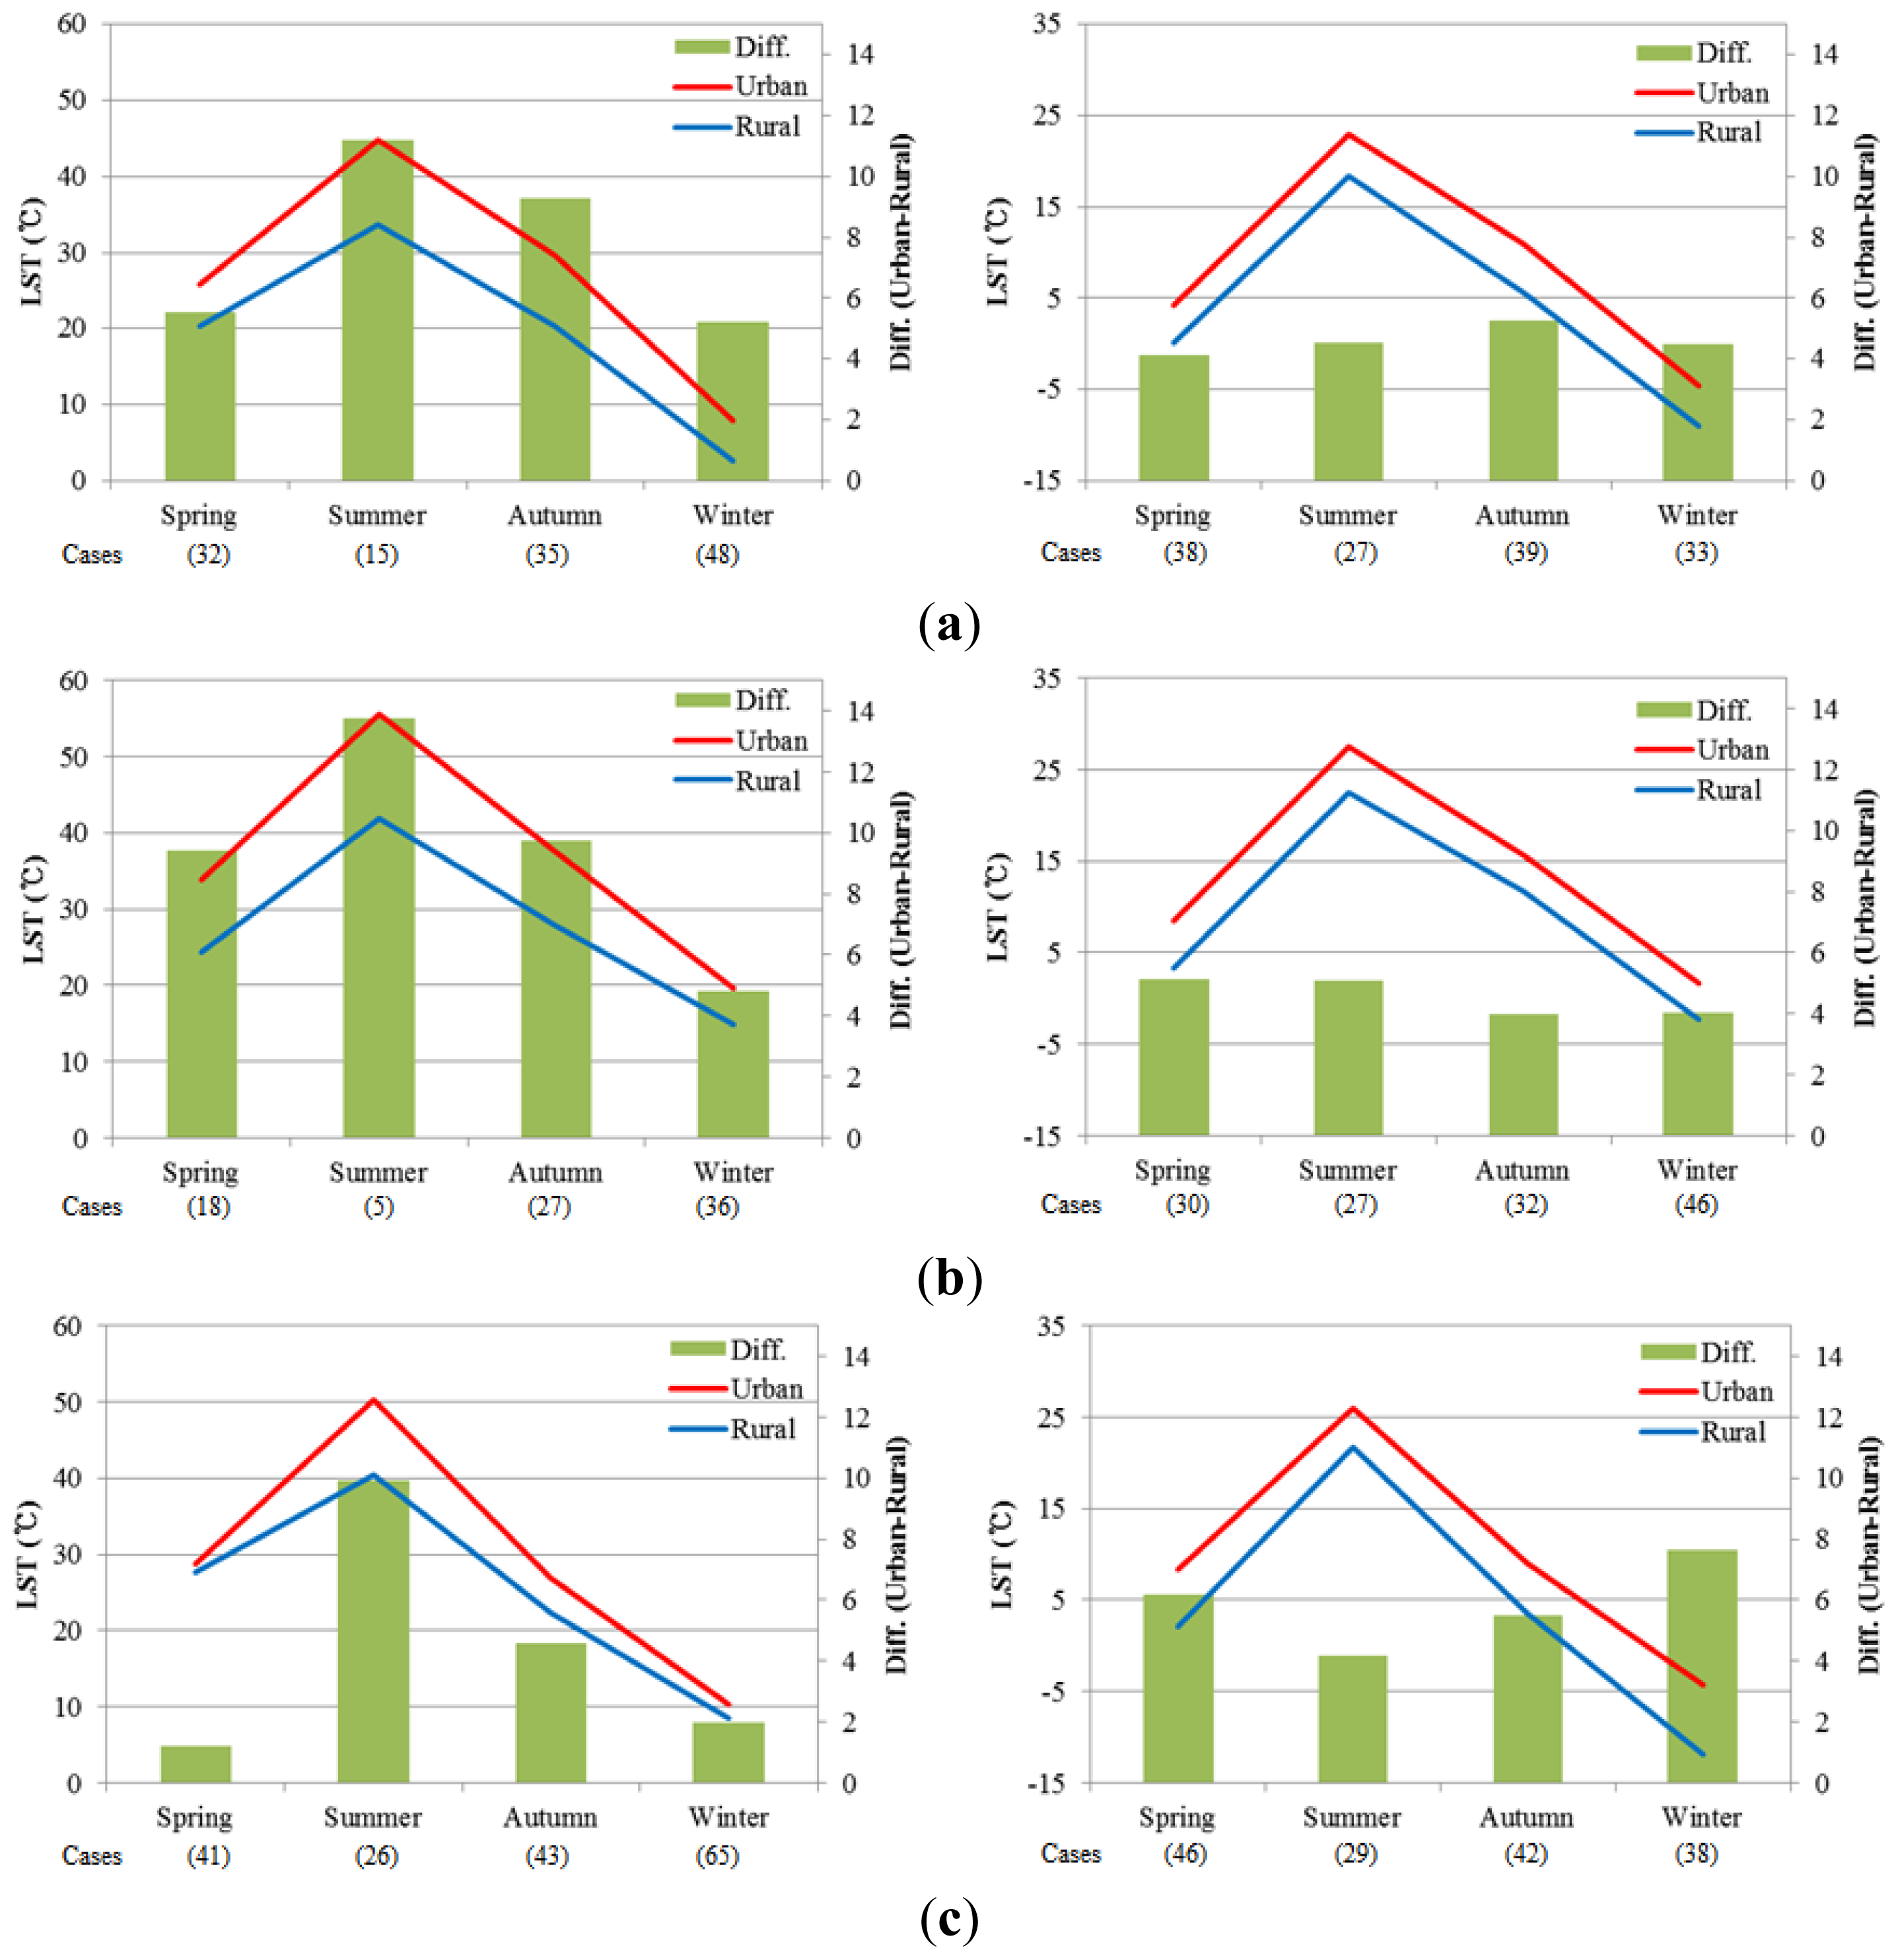
3.3. Seasonal Variation

To analyze the seasonal variations of SUHIs according to the time of day, the daytime (12:00 local standard time) and nighttime (05:00 local standard time) seasonal averages of the three megacities were plotted in Figure 6. The numbers in brackets in the figures represent the number of data samples that were used to obtain the seasonal averages in the three megacities. Because of the different cloud occurrence frequencies according to the seasons and geographic locations, as was previously explained, the numbers of data samples for the three megacities and seasons were different. In all of the three megacities, the seasonal variations of SUHIs were distinct during the daytime. The strongest SUHI (10–13 °C) occurred during the daytime in the summer, and relatively weak SUHIs (less than 5 °C) were common occurrences in the winter or spring. The strongest intensity SUHI (~13 °C) during summer, which was observed in Tokyo, may have been influenced by the small sample size (five) and topography differences between urban and rural points. Interestingly, during nighttime, the intensities of SUHIs were constantly at 4–5 °C in Seoul and Tokyo, irrespective of the seasons. However, in Beijing, the intensity of the SUHI during nighttime in the summer and winter was about 4 °C and 7 °C, respectively. As a result, Beijing showed different seasonal variations from those of the other cities during both the daytime and nighttime; for example, the weakest and strongest SUHIs occurred during the daytime in the spring and during nighttime in the winter, respectively. This may be related to the fact that the rural pixels for Seoul and Tokyo were forest, but rural pixels for Beijing were mostly fields that were composed of farmland. The small differences in vegetation conditions between the urban and rural areas in Beijing, except during summer and early fall, resulted in the weak SUHIs during the daytime in spring and winter. Additionally, the relatively strong SUHIs during nighttime in spring and winter are assumed to be related to differences in freezing or snow cover and possibly the artificial heat supply between urban areas and rural areas; but, any definitive attribution will require further investigation.

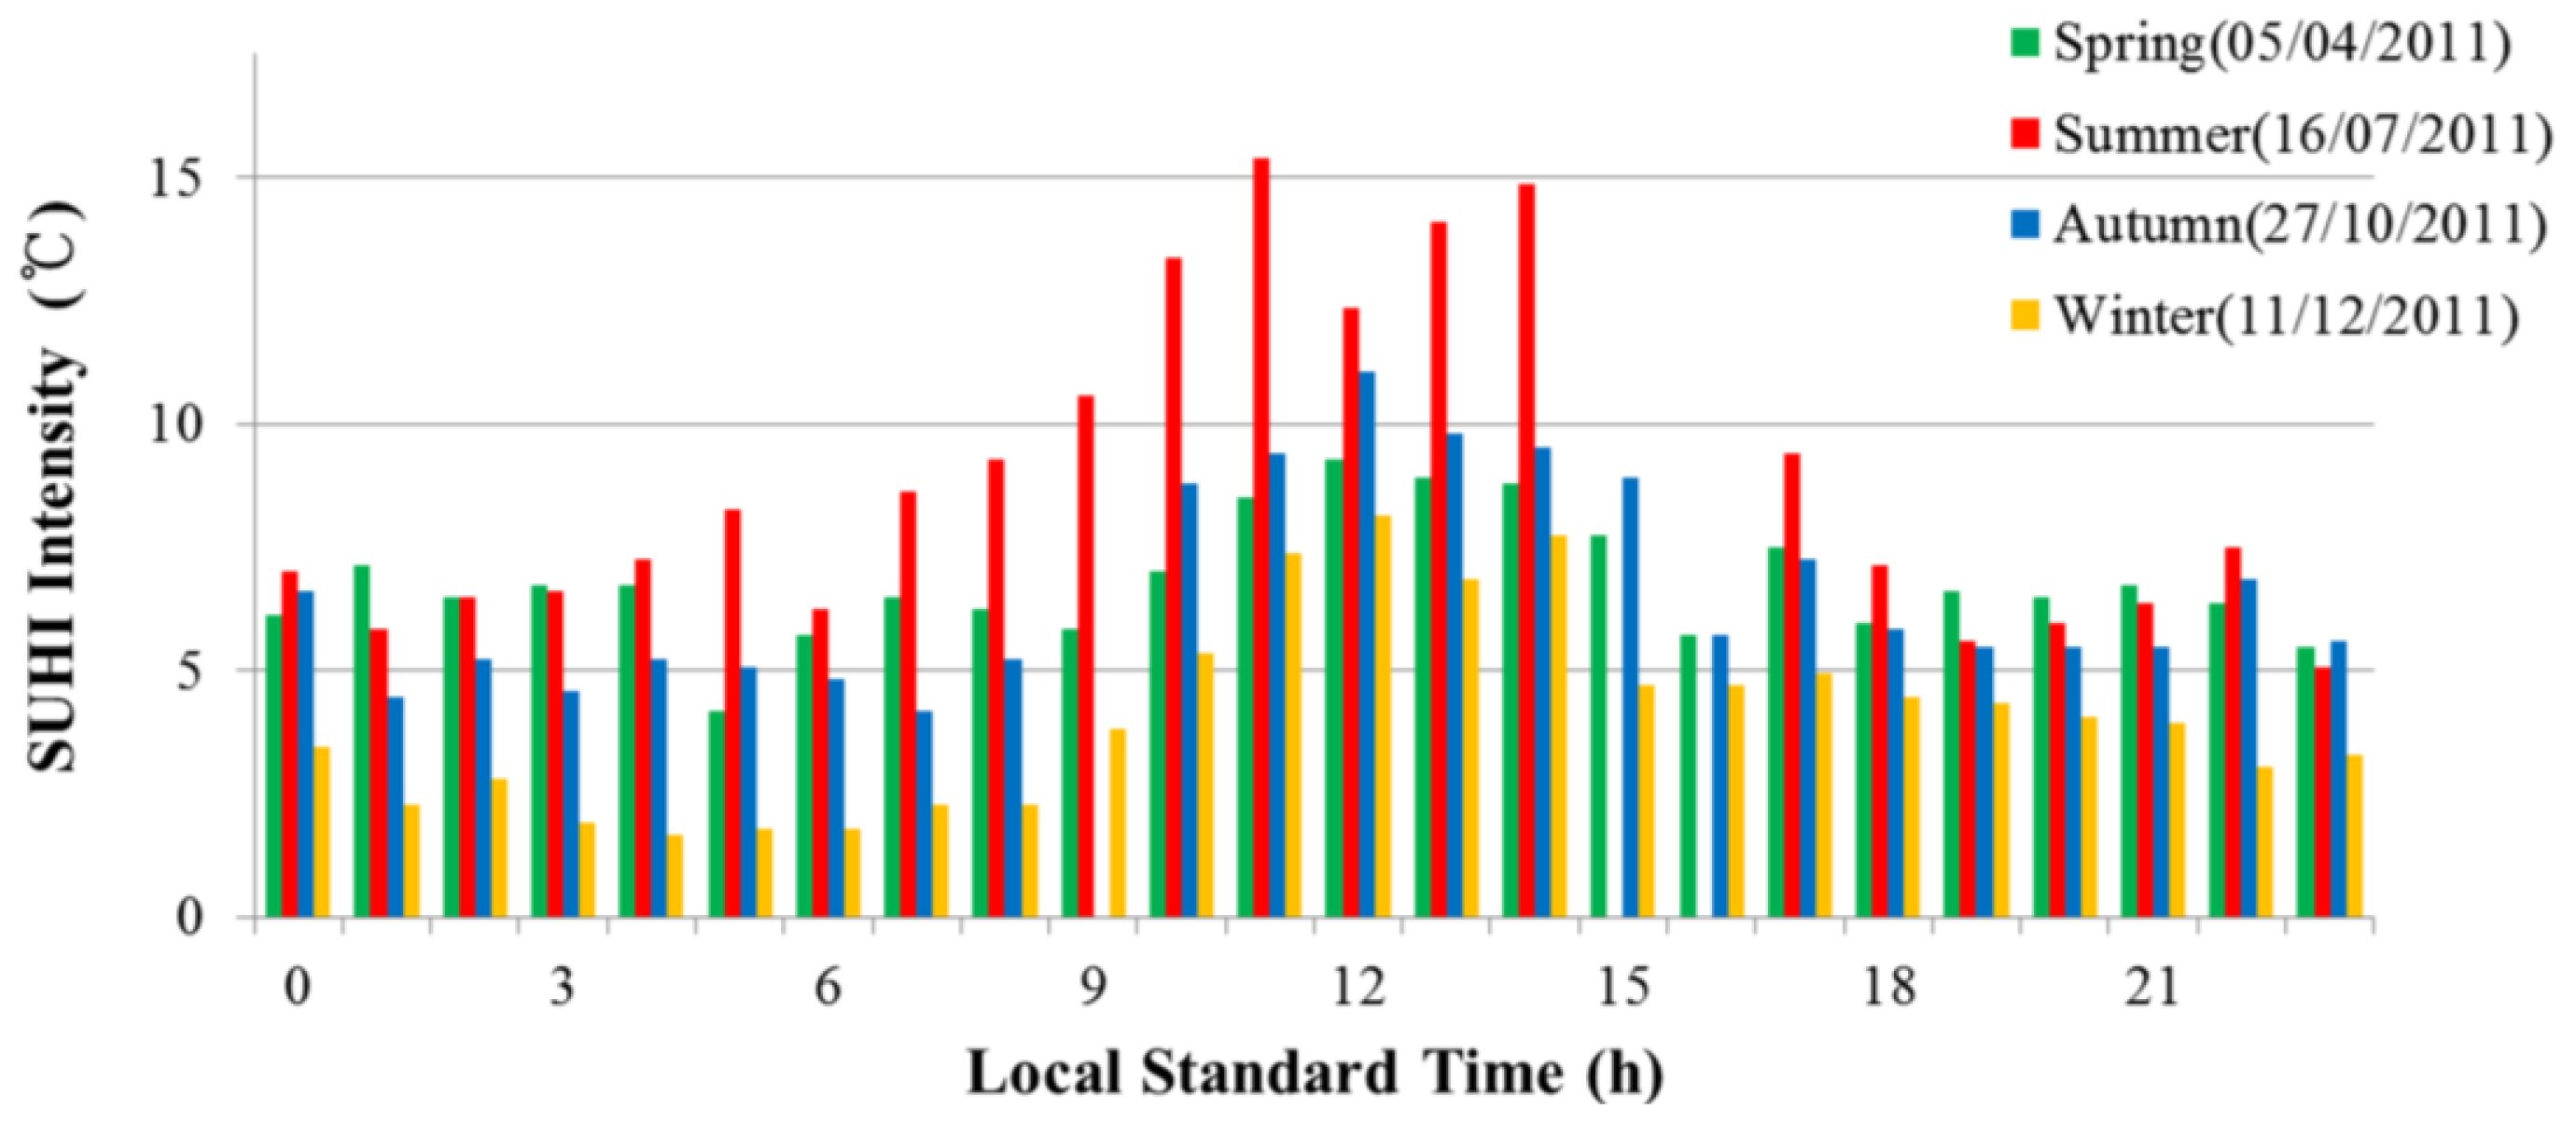
3.4. Diurnal Variation

To investigate diurnal variations of SUHIs, the 24-hour LST for the urban and rural pixels in each of the three megacities was plotted in Figures 79. The discontinued lines in the figures represent the time during which the LST was not retrieved because of clouds. In all three cities, the LST was always higher in the urban areas than in the rural areas, irrespective of the season and time. The intensities of SUHIs differed in accordance with the different urban areas and seasons; however, all three cities showed maximum intensities of more than 10 °C at noon during the summer. All three cities also showed the most distinctive diurnal patterns of the SUHI during the summer as compared to other seasons. In Seoul, while diurnal variations of SUHIs were quite strong with a maximum of 15 °C at noon during summer and fall, they significantly decreased to about 5 °C during spring and winter. In Tokyo, the SUHIs showed relatively large diurnal variations during all of the seasons. The spatio-temporal variations of SUHIs in Seoul and Tokyo were more or less similar; this is likely because the surrounding environments (i.e., distance from a water body) were similar. On the contrary, in Beijing, diurnal variations of SUHIs were strong only during summer, and these greatly weakened and sometimes even displayed an inverse pattern during other seasons, in which the weakest SUHI occurred at noon. The large SUHIs during nighttime in Beijing were mainly caused by the steeper decreases of LST in rural areas than urban areas. This distinct diurnal variation of SUHI can be caused by the combined effects of low solar elevation, less or no vegetation and emissions of artificial heat for heating buildings, but in this regard, further investigations using more observational data will be required before we can make any definitive attribution statements.
The diurnal variation patterns of the UHI and SUHI of Seoul were compared using the AWS air temperature data, which is maintained by the KMA located in Seoul (Figure 10). To minimize the effects resulting from differences in geographic location and the surrounding environment, the AWS site located nearest to the pixel selected as the urban and rural area was selected for analysis (Table 2). In general, the LST and air temperature represent the area mean surface temperature and point temperature at 2 m, respectively. It is well known that the spatio-temporal variations of LST are greater than that of air temperature, in particular, for dry and paved surfaces. As a result, the LST on a hot and sunny summer day can be hotter than the air temperature by as much as a few tens of degrees Celsius, as is shown in Figure 10. Hence, the differences in the diurnal variations of the SUHI and UHI were mainly caused by the large spatio-temporal variability of LST.
While the intensity of the SUHI was strongest at noon during the summer and fall, the strongest intensity of the UHI occurred mostly at nighttime, and its maximum intensity was 6–7 °C, which was smaller than that of the SUHI during the daytime. As in other cities, the intensity of the UHI during the daytime was very weak (~1 °C), whereas the intensity of the UHI was similar to that of the SUHI during nighttime, irrespective of the seasons [9,10,18]. The larger intensity of the UHI compared to that of the SUHI during nighttime in spring can be caused by calm and clear weather conditions; this is because the UHI is generally intensified when the sky is clear and winds are calm. It is interesting to note that the intensities of the UHI and SUHI during nighttime in the summer were consistently weaker than those of other seasons. The weak intensity of the UHI during the daytime, irrespective of seasons, may be related to decreased atmospheric vertical stability during radiative heating of the land surface, which activates vertical and horizontal mixing [31,32].
The LST was higher than the air temperature during the daytime, irrespective of the geographic locations and seasons, and vice versa during nighttime. As a result, the LST at times was identical to the AWS temperature, mostly at sunset (18:00 local standard time) and at dawn (06:00 local standard time), in both the urban and rural areas, even though the times were seasonally different. Even though this trend is not shown in the figures, similar diurnal variation patterns between LST and air temperature were observed for rainy or very windy days, and these data showed that the SUHI was also greatly affected by weather conditions.

3.5. Relationship between SUHI and NDVI

To analyze the effects of vegetation on the SUHI, the NDVI data, which represent the amount and conditions of vegetation, provided by the MODIS land surface group (MYD13A2, MOD13A2) were downloaded from USGS [30]. These NDVI data have an eight-day cycle and a spatial resolution of 1 km, and data quality information showing the data conditions (for example: normal or cloud contamination) is also provided. Because the spatial resolution of the COMS LST data is 4 km, only the LST data with more than five normal NDVI pixels among the corresponding MODIS 3 × 3 pixels were selected for analysis. The effects of vegetation on the SUHI intensity between daytime and nighttime are shown in Figure 11. Here, the daytime and nighttime represent the 12:00 and 5:00 data, respectively. The negative differences of NDVI between urban and rural points indicate that the fractional coverage and conditions of vegetation at the rural points were greater than those at the urban points. This means that more cooling is likely occurring at the rural points via active evapotranspiration and the shadowing effect of vegetation during the daytime. As a result, while the intensity of the SUHI was proportional to the vegetation differences between the urban and rural areas during the daytime, it did not show any particular relationship during nighttime. This different relationship between day and night may have occurred because cooling by vegetation activity does not occur during nighttime, and thus, it does not affect the nighttime LST in both the urban and rural areas. As shown in Peng et al. [18], these data also indicate that the SUHI during nighttime can be controlled by differences in surface heat storage between urban and rural areas. In Beijing, the intensity of the SUHI significantly decreased for small differences in the NDVI between urban and rural pixels; this was because the pixels selected as the rural areas are farmland that was bare after harvest.

4. Conclusions

In this study, the spatio-temporal variations of SUHIs (surface urban heat island) over three megacities (Seoul, Tokyo and Beijing) in East Asia were analyzed using hourly LST (land surface temperature) data for the period from April 2011 to March 2012. The data were derived from the COMS (Communication, Ocean and Meteorological Satellite), which is Korea’s first geostationary multi-purpose satellite. Additionally, diurnal variations of SUHIs were compared to the diurnal variations of UHIs, and the impacts of vegetation activity on the intensity of SUHIs were also investigated.
In general, the spatial variation of LST was greater during the daytime than nighttime, and the temporal variation of LST was greater in urban areas than in rural areas. As a result, the intensities of SUHIs were stronger during the daytime than during nighttime, irrespective of the cities. Although the magnitude of the amplitude differed slightly for the different megacities, the intensities of SUHIs showed significant seasonal variation during the daytime, and the maximum (10–13 °C) and minimum (~2 °C) were observed during the summer and during winter, respectively. However, the intensity of the SUHI during nighttime was relatively constant (4–5 °C) in Seoul and Tokyo, irrespective of the seasons. The intensity of the SUHI in Beijing showed a different pattern of seasonal variation from those of the other cities, and in this region, there was stronger seasonal variation during the daytime and inversed seasonal variation during nighttime. The LST was always higher in the urban areas than in the rural areas, irrespective of the cities, seasons and time. However, the intensities of SUHIs showed distinct diurnal variation according to the seasons and megacities, and the strongest (~15 °C) and weakest (~5 °C) diurnal variations occurred during the summer and winter, respectively. Similar to the seasonal variation of the SUHI, the diurnal variation of the SUHI in Beijing was different from the variation in other cities, except for during the summer. In Beijing, the diurnal variation was greatly weakened and also displayed inverse patterns during non-summer seasons; the weakest (~3 °C) SUHI occurred at noon. The distinct seasonal and diurnal variations of the SUHI in Beijing may be related to the fact that the rural pixel for Beijing was fields that were mostly composed of farmland. Hence, the small differences in vegetation conditions between the urban and rural areas, except for during the relatively short growing season, resulted in a weak SUHI during the daytime in the spring and winter.
The intensities of SUHIs and UHIs showed quite different diurnal variation patterns without regard to the seasons, and the strongest intensities occurred during noon in the summer and during nighttime in the winter, respectively. As a result, the differences between the intensities of SUHIs and UHIs were most prominent during the daytime in all seasons. In general, the intensity of SUHI was proportional to the vegetation differences between the urban and rural areas during the daytime, but it did not show any particular relationship during nighttime. This indicates that the SUHI during the growing seasons was intensified by the cooling effect of vegetation (e.g., through shadowing and evapotranspiration) in rural areas.
Unequal sample sizes were used for the LST data in different megacities and seasons, because of the variable effects of weather conditions, such as from clouds, precipitation and fog (i.e., data contaminated with noise from cloudy weather were excluded from analyses). Hence, the results of this study should be interpreted with caution. To produce statistically more meaningful results, analyses using data from longer time periods will be required. In addition, analyses of the effects of weather conditions on the spatio-temporal variations of the SUHI in East Asia using high-resolution data, such as the MODIS (Moderate Resolution Imaging Spectroradiometer) LST, would be valuable.

Acknowledgments

We are thankful to the National Meteorological Satellite Center of the Korea Meteorological Administration (KMA) for providing the COMS LST data. This work was funded by the KMA Research and Development program under Grant Center for Atmospheric and Earthquake Research (CATER) 2012–2067 and a Kongju National University research year grant.

Conflicts of Interest

The authors declare no conflict of interest.
  • Author ContributionsAll authors contributed extensively to the work presented in this paper. Myoung-Seok Suh proposed the research idea. Youn-Young Choi and Ki-Hong Park designed the algorithm and analyzed the data. All authors interpreted the results and wrote the paper.

References

  1. Oke, T.R. City size and the urban heat island. Atmos. Environ 1973, 7, 769–779. [Google Scholar]
  2. Voogt, J.A.; Oke, T.R. Thermal remote sensing of urban climates. Remote Sens. Environ 2003, 86, 370–384. [Google Scholar]
  3. Roth, M.; Oke, T.R.; Emery, W.J. Satellite derived urban heat islands from three coastal cities and the utilization of such data in urban climatology. Int. J. Remote Sens 1989, 10, 1699–1720. [Google Scholar]
  4. Dousset, B.; Gourmelon, F.; Laaidi, K.; Zeghnoun, A.; Giraudet, E.; Bretin, P.; Mauri, E.; Vandentorren, S. Satellite monitoring of summer heat waves in the Paris metropolitan area. Int. J. Climatol 2011, 31, 313–323. [Google Scholar]
  5. Li, D.; Bou-Zeid, E. Synergistic interactions between urban heat islands and heat waves: The impact in cities is larger than the sum of its parts. J. Appl. Meteorol. Climatol 2013, 52, 2051–2064. [Google Scholar]
  6. Tan, J.; Zheng, Y.; Tang, X.; Guo, C.; Li, L.; Song, G.; Zhen, X.; Yuan, D.; Kalkstein, A.J.; Li, F.; et al. The urban heat island and its impact on heat waves and human health in Shanghai. Int. J. Biometeorol 2010, 54, 75–84. [Google Scholar]
  7. Roth, M. Effect of Cities on Local Climates. Proceedings of the Workshop of IGES/APN Mega-City Project, Kitakyushu, Japan, 23–25 January 2002; pp. 1–13.
  8. Kim, Y.H.; Baik, J.J. Maximum urban heat island intensity in Seoul. J. Appl. Meteorol 2002, 41, 651–659. [Google Scholar]
  9. Kim, Y.H.; Baik, J.J. Daily maximum urban heat island intensity in large cities of Korea. Theor. Appl. Climatol 2004, 79, 151–164. [Google Scholar]
  10. Kim, Y.H.; Baik, J.J. Spatial and temporal structure of the urban heat island in Seoul. J. Appl. Meteorol 2005, 44, 591–605. [Google Scholar]
  11. Sobrino, J.A.; Romaguera, M. Land surface temperature retrieval from MSG1–SEVIRI data. Remote Sens. Environ 2004, 92, 247–254. [Google Scholar]
  12. Peres, L.; DaCamara, C.C. Land surface temperature and emissivity estimation based on the two-temperature method: Sensitivity analysis using simulated MSG/SEVIRI data. Remote Sens. Environ 2004, 91, 377–389. [Google Scholar]
  13. Wan, Z. New refinements and validation of the MODIS land-surface temperature/emissivity products. Remote Sens. Environ 2008, 112, 59–74. [Google Scholar]
  14. Neteler, M. Estimating daily land surface temperature in mountainous environments by reconstructed MODIS LST data. Remote Sens 2010, 2, 333–351. [Google Scholar]
  15. Cho, A.R.; Suh, M.S. Evaluation of land surface temperature operationally retrieved from Korean geostationary satellite (COMS) data. Remote Sens 2013, 5, 3951–3970. [Google Scholar]
  16. Tran, H.; Uchihama, D.; Ochi, S.; Yasuoka, Y. Assessment with satellite data of the urban heat island effects in Asian mega cities. Int. J. Appl. Earth Obs. Geoinf 2006, 8, 34–48. [Google Scholar]
  17. Ben-Dor, E.; Saaroni, H. Airborne video thermal radiometry as a tool for monitoring microscale structures of the urban heat island. Int. J. Remote Sens 1997, 18, 3039–3053. [Google Scholar]
  18. Peng, S.; Piao, S.; Ciais, P.; Friedlingstein, P.; Ottle, C.; Bréon, F.M.; Nan, H.; Zhou, L.; Myneni, R.B. Surface urban heat island across 419 global big cities. Environ. Sci. Technol 2011, 46, 696–703. [Google Scholar]
  19. Dousset, B.; Gourmelon, F. Satellite multi-sensor data analysis of urban surface temperatures and landcover. ISPRS J. Photogramm 2003, 58, 43–54. [Google Scholar]
  20. Weng, Q. Fractal analysis of satellite-detected urban heat island effect. Photogramm. Eng. Remote Sens 2003, 69, 555–566. [Google Scholar]
  21. Fabrizi, R.; Bonafoni, S.; Biondi, R. Satellite and ground-based sensors for the urban heat island analysis in the city of Rome. Remote Sens 2010, 2, 1400–1415. [Google Scholar]
  22. Hu, L.; Brunsell, N.A. The impact of temporal aggregation of land surface temperature data for surface urban heat island (SUHI) monitoring. Remote Sens. Environ 2013, 134, 162–174. [Google Scholar]
  23. Yang, P.; Ren, G.; Liu, W. Spatial and temporal characteristics of Beijing urban heat island intensity. J. Appl. Meteorol. Climatol 2013, 52, 1803–1816. [Google Scholar]
  24. Bohnenstengel, S.I.; Evans, S.; Clark, P.A.; Belcher, S.E. Simulations of the London urban heat island. Q. J. Roy. Meteor. Soc 2011, 137, 1625–1640. [Google Scholar]
  25. Pal, S.; Xueref-Remy, I.; Ammoura, L.; Chazette, P.; Gibert, F.; Royer, P.; Dieudonne, E.; Dupont, J.C.; Haeffelin, M.; Lac, C.; et al. Spatio-temporal variability of the atmospheric boundary layer depth over the Paris agglomeration: An assessment of the impact of the urban heat island intensity. Atmos. Environ 2012, 63, 261–275. [Google Scholar]
  26. Lac, C.; Donnelly, R.P.; Masson, V.; Pal, S.; Donier, S.; Queguiner, S.; Tanguy, G.; Ammoura, L.; Xueref-Remy, I. CO2 dispersion modelling over Paris region within the CO2-MEGAPARIS project. Atmos. Chem. Phys 2013, 13, 4941–4961. [Google Scholar]
  27. Kang, J.H.; Suh, M.S.; Kwak, C.H. Land cover classification over East Asian region using recent MODIS NDVI data (2006–2008). Atmos. Korean Meteorol. Soc 2010, 20, 415–426. [Google Scholar]
  28. Korea Meteorological Administration (KMA). Available online: http://www.kma.go.kr/weather/climate/past_table.jsp?stn=108&yy=2012&obs=59&x=31&y=17 (accessed on 3 February 2014).
  29. Japan Meteorological Administration(JMA). Available online: http://www.data.jma.go.jp/obd/stats/etrn/view/daily_s1.php?prec_no=44&block_no=47662&year=2012&month=04&day=1&view=a3 (accessed on 3 February 2014).
  30. MODIS NDVI Library. Available online: https://lpdaac.usgs.gov/products/modis_products_table (accessed on 3 February 2014).
  31. Baik, J.J.; Kim, Y.H.; Kim, J.J.; Han, J.Y. Effects of boundary-layer stability on urban heat island-induced circulation. Theor. Appl. Climatol 2007, 89, 73–81. [Google Scholar]
  32. Hidalgo, J.; Masson, V.; Gimeno, L. Scaling the daytime urban heat island and urban-breeze circulation. J. Appl. Meteorol. Climatol 2010, 49, 889–901. [Google Scholar]
Figure 1. Location of the three megacities selected for this study.
Remotesensing 06 05852f1
Figure 2. Spatial distribution of land surface temperature (LST) on the Korean Peninsula. The white colors indicate that the pixels are contaminated by clouds.
Remotesensing 06 05852f2
Figure 3. Temporal variations of LST along the W–E cross line over Seoul. The shading in the right panel represents the topography.
Remotesensing 06 05852f3
Figure 4. The same as Figure 3, except for Tokyo.
Remotesensing 06 05852f4
Figure 5. The same as Figure 3, except for Beijing.
Remotesensing 06 05852f5
Figure 6. Seasonal variation of LST (red and blue lines) and SUHI (surface urban heat island) (green bars) for (left pannel) daytime and (right pannel) nighttime: (a) Seoul; (b) Tokyo and (c) Beijing.
Remotesensing 06 05852f6
Figure 7. Diurnal variation of the SUHI in Seoul according to the season.
Remotesensing 06 05852f7
Figure 8. The same as Figure 7, except for Tokyo.
Remotesensing 06 05852f8
Figure 9. The same as Figure 8, except for Beijing.
Remotesensing 06 05852f9
Figure 10. Diurnal variations of LST (red and blue solid lines), SUHI (red bars), automatic weather system (AWS) air temperature (red and blue dashed lines) and UHI (urban heat island) (blue bars) in Seoul according to the season. (a) Srping 13 April 2011, (b) Summer 21 June 2011, (c) Autumn 03 October 2011, (d) Winter 07 January 2011.
Remotesensing 06 05852f10
Figure 11. The relationship between the differences in the Normalized Difference Vegetation Index (NDVI) and the intensity of SUHI for the (a) daytime and (b) nighttime.
Remotesensing 06 05852f11
Table 1. Geographic information for the selected urban and rural areas.
CityTypeLocationLat. (°N), Lon. (°E)Elevation (m)Distance (km)
SeoulUrbanDongdaemun37.57, 127.0421.4641.84
RuralGapyeong37.62, 127.51294.60
TokyoUrbanUeno35.73, 139.7325.7743.12
RuralAkiruno35.72, 139.26244.11
BeijingUrbanWangfujing39.91, 116.4347.3142.72
RuralDachang39.85, 116.969.11
Table 2. Geographic information for the selected automatic weather system (AWS) site.
CityTypeStationLat. (°N), Lon. (°E)HeightDistance
SeoulUrban408/Dongdaemun37.58, 127.0549 m46.80 km
Rural326/Mt. Yongmun37.60, 127.58197 m

