Article

Toward a Satellite-Based System of Sugarcane Yield Estimation and Forecasting in Smallholder Farming Conditions: A Case Study on Reunion Island

1
CIRAD-UPR AIDA, Station de Ligne-Paradis, 7 chemin de l'IRAT, FR-97410 Saint-Pierre, La Réunion, France
2
CIRAD-UMR TETIS, 500 rue Jean-François Breton, FR-34093 Montpellier, France
3
Syndicat du Sucre de la Réunion, 40, route Gabriel Macé, FR-97492 Sainte-Clotilde Cedex, La Réunion, France
4
CIRAD-UPR AIDA, Station de la Bretagne, 40 chemin de Grand Canal, FR-97743 Saint-Denis, La Réunion, France
5
Institut de Recherche pour le Développement (IRD), 911 avenue Agropolis, FR-34394 Montpellier Cedex 05, France
*
Author to whom correspondence should be addressed.
Remote Sens. 2014, 6(7), 6620-6635; https://0-doi-org.brum.beds.ac.uk/10.3390/rs6076620
Submission received: 5 May 2014 / Revised: 4 July 2014 / Accepted: 9 July 2014 / Published: 18 July 2014

Abstract

:
Estimating sugarcane biomass is difficult to achieve when working with highly variable spatial distributions of growing conditions, like on Reunion Island. We used a dataset of in-farm fields with contrasted climatic conditions and farming practices to compare three methods of yield estimation based on remote sensing: (1) an empirical relationship method with a growing season-integrated Normalized Difference Vegetation Index NDVI, (2) the Kumar-Monteith efficiency model, and (3) a forced-coupling method with a sugarcane crop model (MOSICAS) and satellite-derived fraction of absorbed photosynthetically active radiation. These models were compared with the crop model alone and discussed to provide recommendations for a satellite-based system for the estimation of yield at the field scale. Results showed that the linear empirical model produced the best results (RMSE = 10.4 t·ha−1). Because this method is also the simplest to set up and requires less input data, it appears that it is the most suitable for performing operational estimations and forecasts of sugarcane yield at the field scale. The main limitation is the acquisition of a minimum of five satellite images. The upcoming open-access Sentinel-2 Earth observation system should overcome this limitation because it will provide 10-m resolution satellite images with a 5-day frequency.

1. Introduction

Remote sensing is widely used to estimate the production of biomass of crops and natural vegetation systems in various climatic conditions [13], and it provides spatially exhaustive, objective and dynamic information on the vegetative development of a canopy. In addition to biomass estimation, remote sensing indices are used to estimate ecophysiological variables, such as the leaf area index [4] or fraction of intercepted photosynthetically active radiation (PAR) [5,6].
Remote sensing data may be related to the vegetation biomass in several ways: (1) empirical relationships between spectral vegetation indices (VI) and yield or biomass production, (2) radiation use efficiency [7] derived from the seasonal integration of intercepted PAR from spectral vegetation indices, and (3) spectral data coupled with dynamic crop growth models.
On Reunion Island (Indian Ocean), sugarcane (Saccharum officinarum) is the primary crop in terms of cultivated area (25,000 ha) and agricultural income. To sustain profitability in this sector, the harvesting and processing of sugarcane must be optimally managed, and accurate estimations of the final biomass are required to reach this objective. The logistics of sugarcane mills (opening dates, inputs, distribution of harvesting machines, etc.) and farmers (daily delivery quotas, labor, etc.) depend on such estimations.
The sugarcane fields on Reunion Island mainly belong to small growers and are characterized by their small size (approximately 0.9 ha) and highly variable climatic conditions, soil types and farming practices. Several methods are currently used to estimate the sugarcane biomass production across the island based on the farmers’ reports, ground sampling, and crop model simulations. Forecast results are consolidated 2 weeks prior to the beginning of the harvest campaign and determine the logistics to be implemented. Each method has advantages and drawbacks. The reporting method by farmers is simple to set up, but it provides subjective values of production. The ground sampling method performed in May and June by field officers on 62 reference fields all over the island is time consuming and can be biased by a poor representativeness of the reference fields. Simulations with the MOSICAS model [8] require delicate parameterization, and such methods generally lack an accounting of the diversity of the crop and climatic conditions over the island. This limitation can be overcome by using remote sensing data at high spatial resolution to provide information on the state of development of crops at any location within the territory.
Over the last thirty years, numerous studies have presented examples of empirical relationships between vegetation index (VI) values and aboveground total dry biomass. These relationships were developed either with point-in-time VI values (generally measured at the green vegetation peak) and vegetation canopy biomass [9] or between VI values integrated over the growing cycle and aboveground biomass at the end of the growing season [10]. For sugarcane, Duveiller et al [11] compared the use of several metrics (e.g., integral, maximum, and slope) of the fraction of absorbed PAR derived from the VEGETATION sensor of SPOT-4 to estimate yield at the regional scale in Brazil. Mulianga et al [12] proposed temporally weighing the NDVI integration in consideration of the sugarcane cropping calendar in western Kenya. In [13], the authors compared the use of maximum NDVI values and integrated NDVI values to estimate yield at the field scale on Reunion and Guadeloupe islands. These authors also reported that the relationship between yield and the maximum NDVI is exponential, which is a major limitation for future extrapolation or geographic-scale changes, whereas the relationship with the time integral of NDVI is linear.
The Monteith efficiency model [14] simulates the dry matter production of a homogeneous sugarcane crop from daily intercepted PAR and radiation use efficiency of the crop [7]. The Kumar-Monteith model is a simplification of the Monteith model [14] that can be used with remote sensing data, and it is based on the relationship between the PAR intercept efficiency and VIs [15]. For example, Asrar et al [16] and Liu et al [17] used this model to predict the aboveground biomass of wheat and the yield of corn, respectively. To our knowledge, this method has not yet been applied to the estimation of sugarcane yield.
Crop models are dynamic models that simulate the growth of a crop at regular time steps (generally daily); such models rely on mechanistic and empirical equations that describe the various ecophysiological processes of the plant’s growth and compute the development of the crop based on several input variables, such as climatic data and parameters that include crop and soil characteristics and field management practices. However, crop models have limitations that are primarily caused by the simplification of complex natural phenomena. Moreover, the parameter values used in the model may not be representative of the actual values, and the lack of high spatial resolution input variables (such as climatic variables) may limit the accuracy of the model. Coupling methods that consist of data from remote sensing integrated into crop models provide a solution for crop development monitoring and biomass estimation. They combine actual and exhaustive observations with the mathematical conceptualization of the model. Different coupling methods have been reported [15,18,19] and can be summarized into recalibration methods and forcing methods. To our knowledge, few attempts have been made to use coupling methods with a sugarcane dedicated model. In [20], researchers used a forcing method with the MOSICAS sugarcane model to improve the accuracy of yield estimation.
Although numerous studies have described how remote sensing data can be used to estimate a crop’s ecophysiological variables, including biomass production, to our knowledge, no attempt has been made to directly compare the remote sensing methods on a unique dataset. Therefore, the objective of this work is to compare remote sensing-based methods in the estimation of sugarcane biomass to provide a set of recommendations for a future sugarcane yield monitoring system for the sugarcane industry. We implemented and tested three methods based on the Normalized Difference Vegetation Index that was computed from SPOT-4 and SPOT-5 time series images and compared the methods to a direct estimation method of crop modeling. The ground data set was composed of 63 in-farm fields located in two contrasted sites on the island and spread over three growing seasons (2010, 2011 and 2012).
The models were then compared for their accuracy of estimation and simplicity of implementation (number of required satellite images and amount of required additional input information). Because the optimization of harvest logistics depends on the early assessment of biomass production, we also tested methods for yield forecasting for different dates ranging from mid-May to early July, which corresponds to the beginning of the harvest period.
The results were then discussed to produce recommendations for the construction of an operational method to estimate the biomass production of sugarcane on Reunion Island and other countries whose sugar industry is based on smallholder farms.

2. Materials and Methods

2.1. Coupling a Crop Model with Remote Sensing

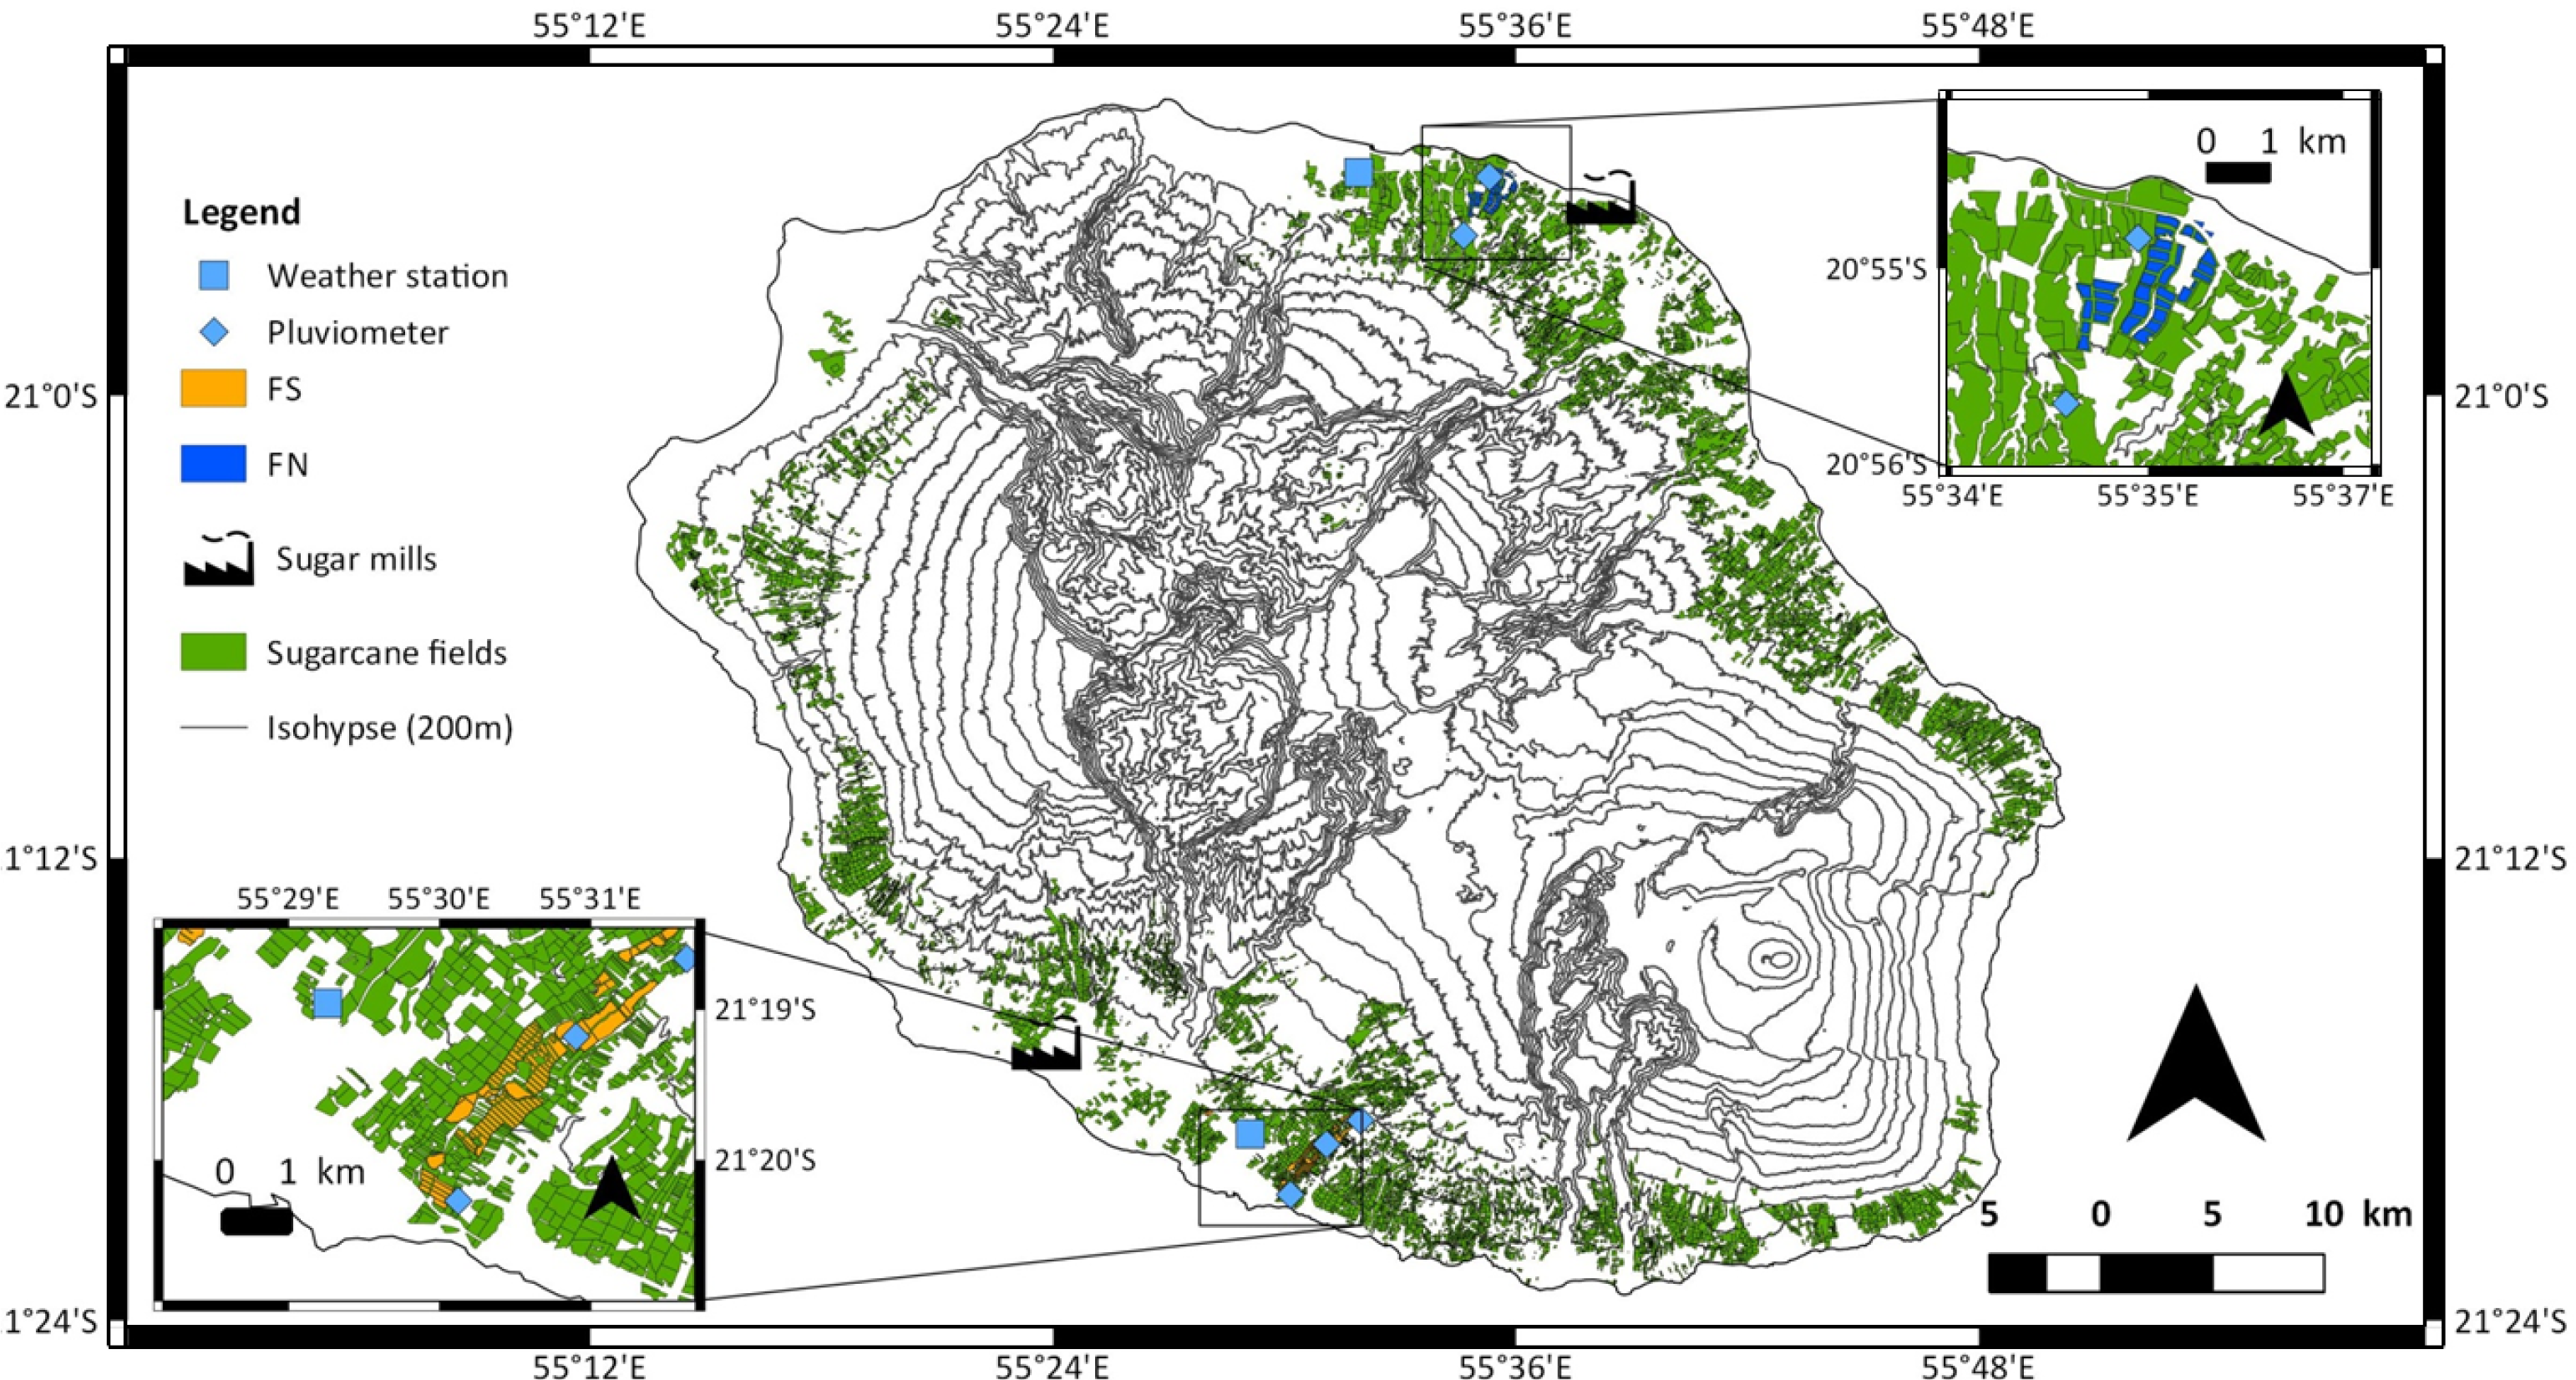
2.1.1. The Study Sites

The ground data set was composed of 63 field observations collected over two study sites and three cropping seasons (2009–2010, 2010–2011, and 2011–2012). The study fields were situated in two farms located in the northern and southern parts of the island (Figure 1) with contrasting climatic conditions and agricultural practices.
The farm located in the northern part of the island (hereafter referred to as FN) had a mean annual rainfall of 2420 mm. The 38 fields used in this study were located at altitudes between 60 m and 200 m, and all were rainfed. With the exception of three fields cultivated with the R582 cultivar, all of the fields were planted with the R579 sugarcane cultivar because this cultivar was specifically adapted to the climatic conditions of the area. The mean area of the studied fields was 6.2 ha, and their mean yield was 118 t·ha−1.
The farm located in the southern part of the island (hereafter referred to as FS) had a mean annual rainfall of 940 mm. The 25 fields used in this study were located at altitudes between 170 m and 480 m, and 15 fields were located lower than 300 m and irrigated. Five different sugarcane cultivars were used: R570, R577, R579, R582 and R584. The mean area of the studied fields was 13.1 ha, and the mean yield was 94 t·ha−1.
Although the yields observed in these well-managed farms were higher than the 76 t·ha−1 island average, the farms were selected because (i) the farmers were able to provide agronomic data (cultivar, yield and harvest date) for each field and (ii) both farmers used unique agricultural practices for all of their respective fields, which simplified the error analysis of the methods.

2.1.2. Climatic and Agronomic Data

The climatic and agronomic data were collected over three growing cycles (2010, 2011 and 2012).
The climatic data were acquired at daily a time step, and the rainfall, potential evapotranspiration, global radiation and mean temperature data were collected at two climatic and five rainfall stations located close to the studied fields (Figure 1).
The soil characteristics were extracted from the Reunion soil map [21].
The cropping practices data were obtained from the farmers’ databases and included observed yield and harvest dates for each studied field and irrigation schedules. The observed yield was computed from the weighing of the harvested stalk fresh biomass of each field for the three study years.

2.1.3. Remote Sensing Data

A total of 56 SPOT images (14 SPOT-5 images and 42 SPOT-4 images) covering the entire island were acquired for dates between July 2009 and December 2012 through the KALIDEOS program conducted by the Centre National d’Études Spatiales (CNES).
The number of available images for each field and for each season ranged between 5 and 20, the median number was 14 images per field and per growing cycle.
The NDVI was computed for each available satellite image, and a cloud-free median value of the NDVI was calculated for each studied field (see Figure 2).
The images had a 10 m spatial resolution, included TOC (Top Of Canopy) reflectance and were orthorectified to ensure cross-comparison in time and space [22].

2.2. The Remote Sensing-Crop Yield Models

A limited number of the well-known remote sensing-based techniques used to estimate crop biomass have been applied to sugarcane. We tested three of these methods in increasing complexity.

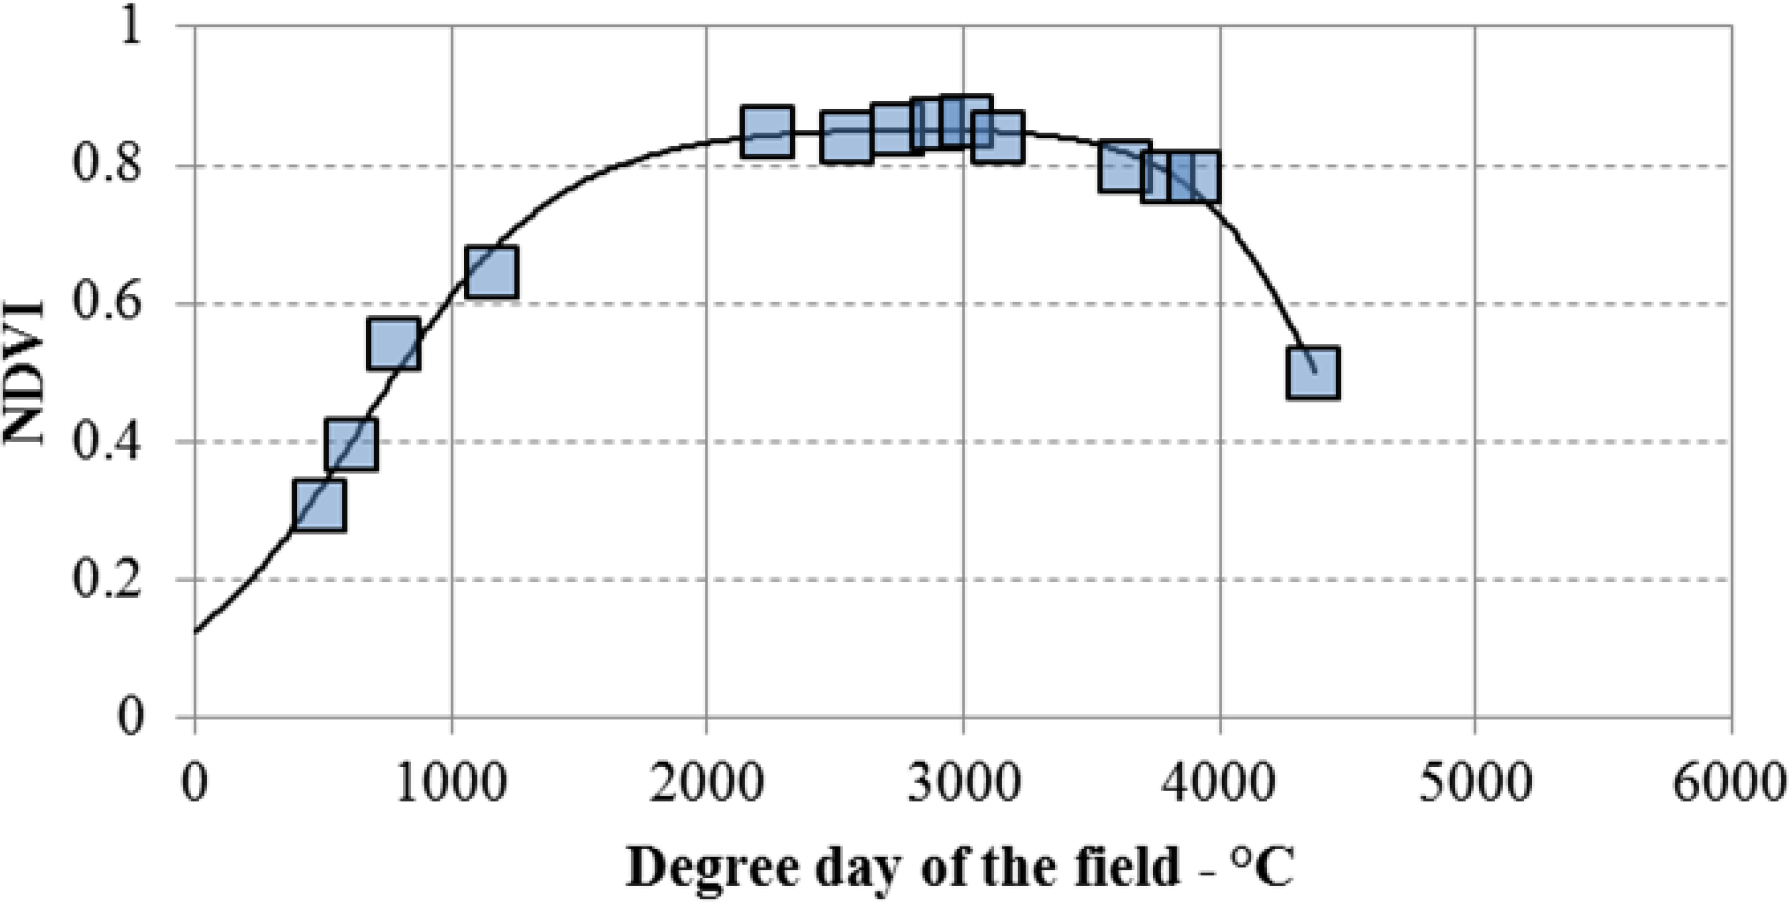
2.2.1. A Prerequisite: The NDVI Interpolation Model

The remote sensing methods for yield estimation presented in this paper are based on the NDVI temporal profile of each of the 63 studied sugarcane fields.
To compute the NDVI temporal profile, we used an interpolation model based on two continuous logistic functions [23]. The first function (F1) was used to describe the field’s growth phase, whereas the second function (F2) was used to describe its senescent phase. NDVI dynamic is this computed as follows:
NDVI ( t ) = F 1 ( t ) F 2 ( t )
F 1 ( t ) = m / ( 1 + e ( a ( t t i ) ) )
F 2 ( t ) = m / ( 1 + e ( b ( t t f ) ) )
where t is the thermal age (in degree days) of the crop since the previous harvest, m is the maximum value of the logistic curve, a and b are the slope at the inflexion points of the F1 and F2 functions, respectively, and ti and tf are the degree day values at those inflexion points. The parameters were determined using an “nls” non-linear regression [24] that minimized the relative standard error. Similar to [25], we used the thermal age of our plots instead of the calendar age to improve the relationship between the NDVI and yield. The thermal age was calculated considering the daily mean temperature and a base temperature of 12 °C [26].

2.2.2. Empirical NDVI Model

We computed the cumulated NDVI values by integrals between two successive harvests for each field. A linear regression was then established between the integrated values and observed yield at the latter harvest.

2.2.3. Kumar-Monteith Model

The Kumar-Monteith efficiency model [7] is based on the relationship between the dry matter production and the sum of the incident global radiation as follows:
D M = R U E ɛ b i = date of harvest n i = date of harvest ( n + 1 ) f A P A R G R i
where DM is the dry matter production (g·m−2), RUE is the radiation use efficiency (g·MJ−1), εb is the climatic efficiency, fAPAR is the fraction of absorbed photosynthetically active radiation and GR is the global radiation (MJ·m−2).
The radiation use efficiency represents the capacity of the plant to convert radiation into dry biomass. We used a radiation use efficiency value of 3.22 g·MJ−1 as estimated by [26], and this value was comparable to the value measured by [27]. εb corresponds to the ratio of photosynthetically active radiation and global radiation, and we used the generally accepted value of 0.5 for this parameter [26,28,29].
fAPAR represents the ability of a vegetation cover to intercept and absorb incident radiation and can be derived from satellite data [5,6,30]. Using field measured values of fAPAR and the NDVI interpolation model [31], we computed the following relationship:
f APAR = 1.383 NDVI 0.333
For mature sugarcane, the water content of the stalks is assumed to vary slightly [32]. Therefore, the cane yield (t·ha−1) can be directly computed from the aboveground dry biomass (g·m−2) by a linear regression. Based on the MOSICAS [26] outputs for dry matter production and final yield, we computed the following relationship:
Yield = 0.018 D M + 3.64
Using the previously established NDVI values (see Equations (1)(3)), the yield can be modeled as follows:
Yield = [ 0.0279 i = harvest date n i = harvest date ( n + 1 ) ( 1.383 NDV I i 0.333 ) G R i ] + 3.64

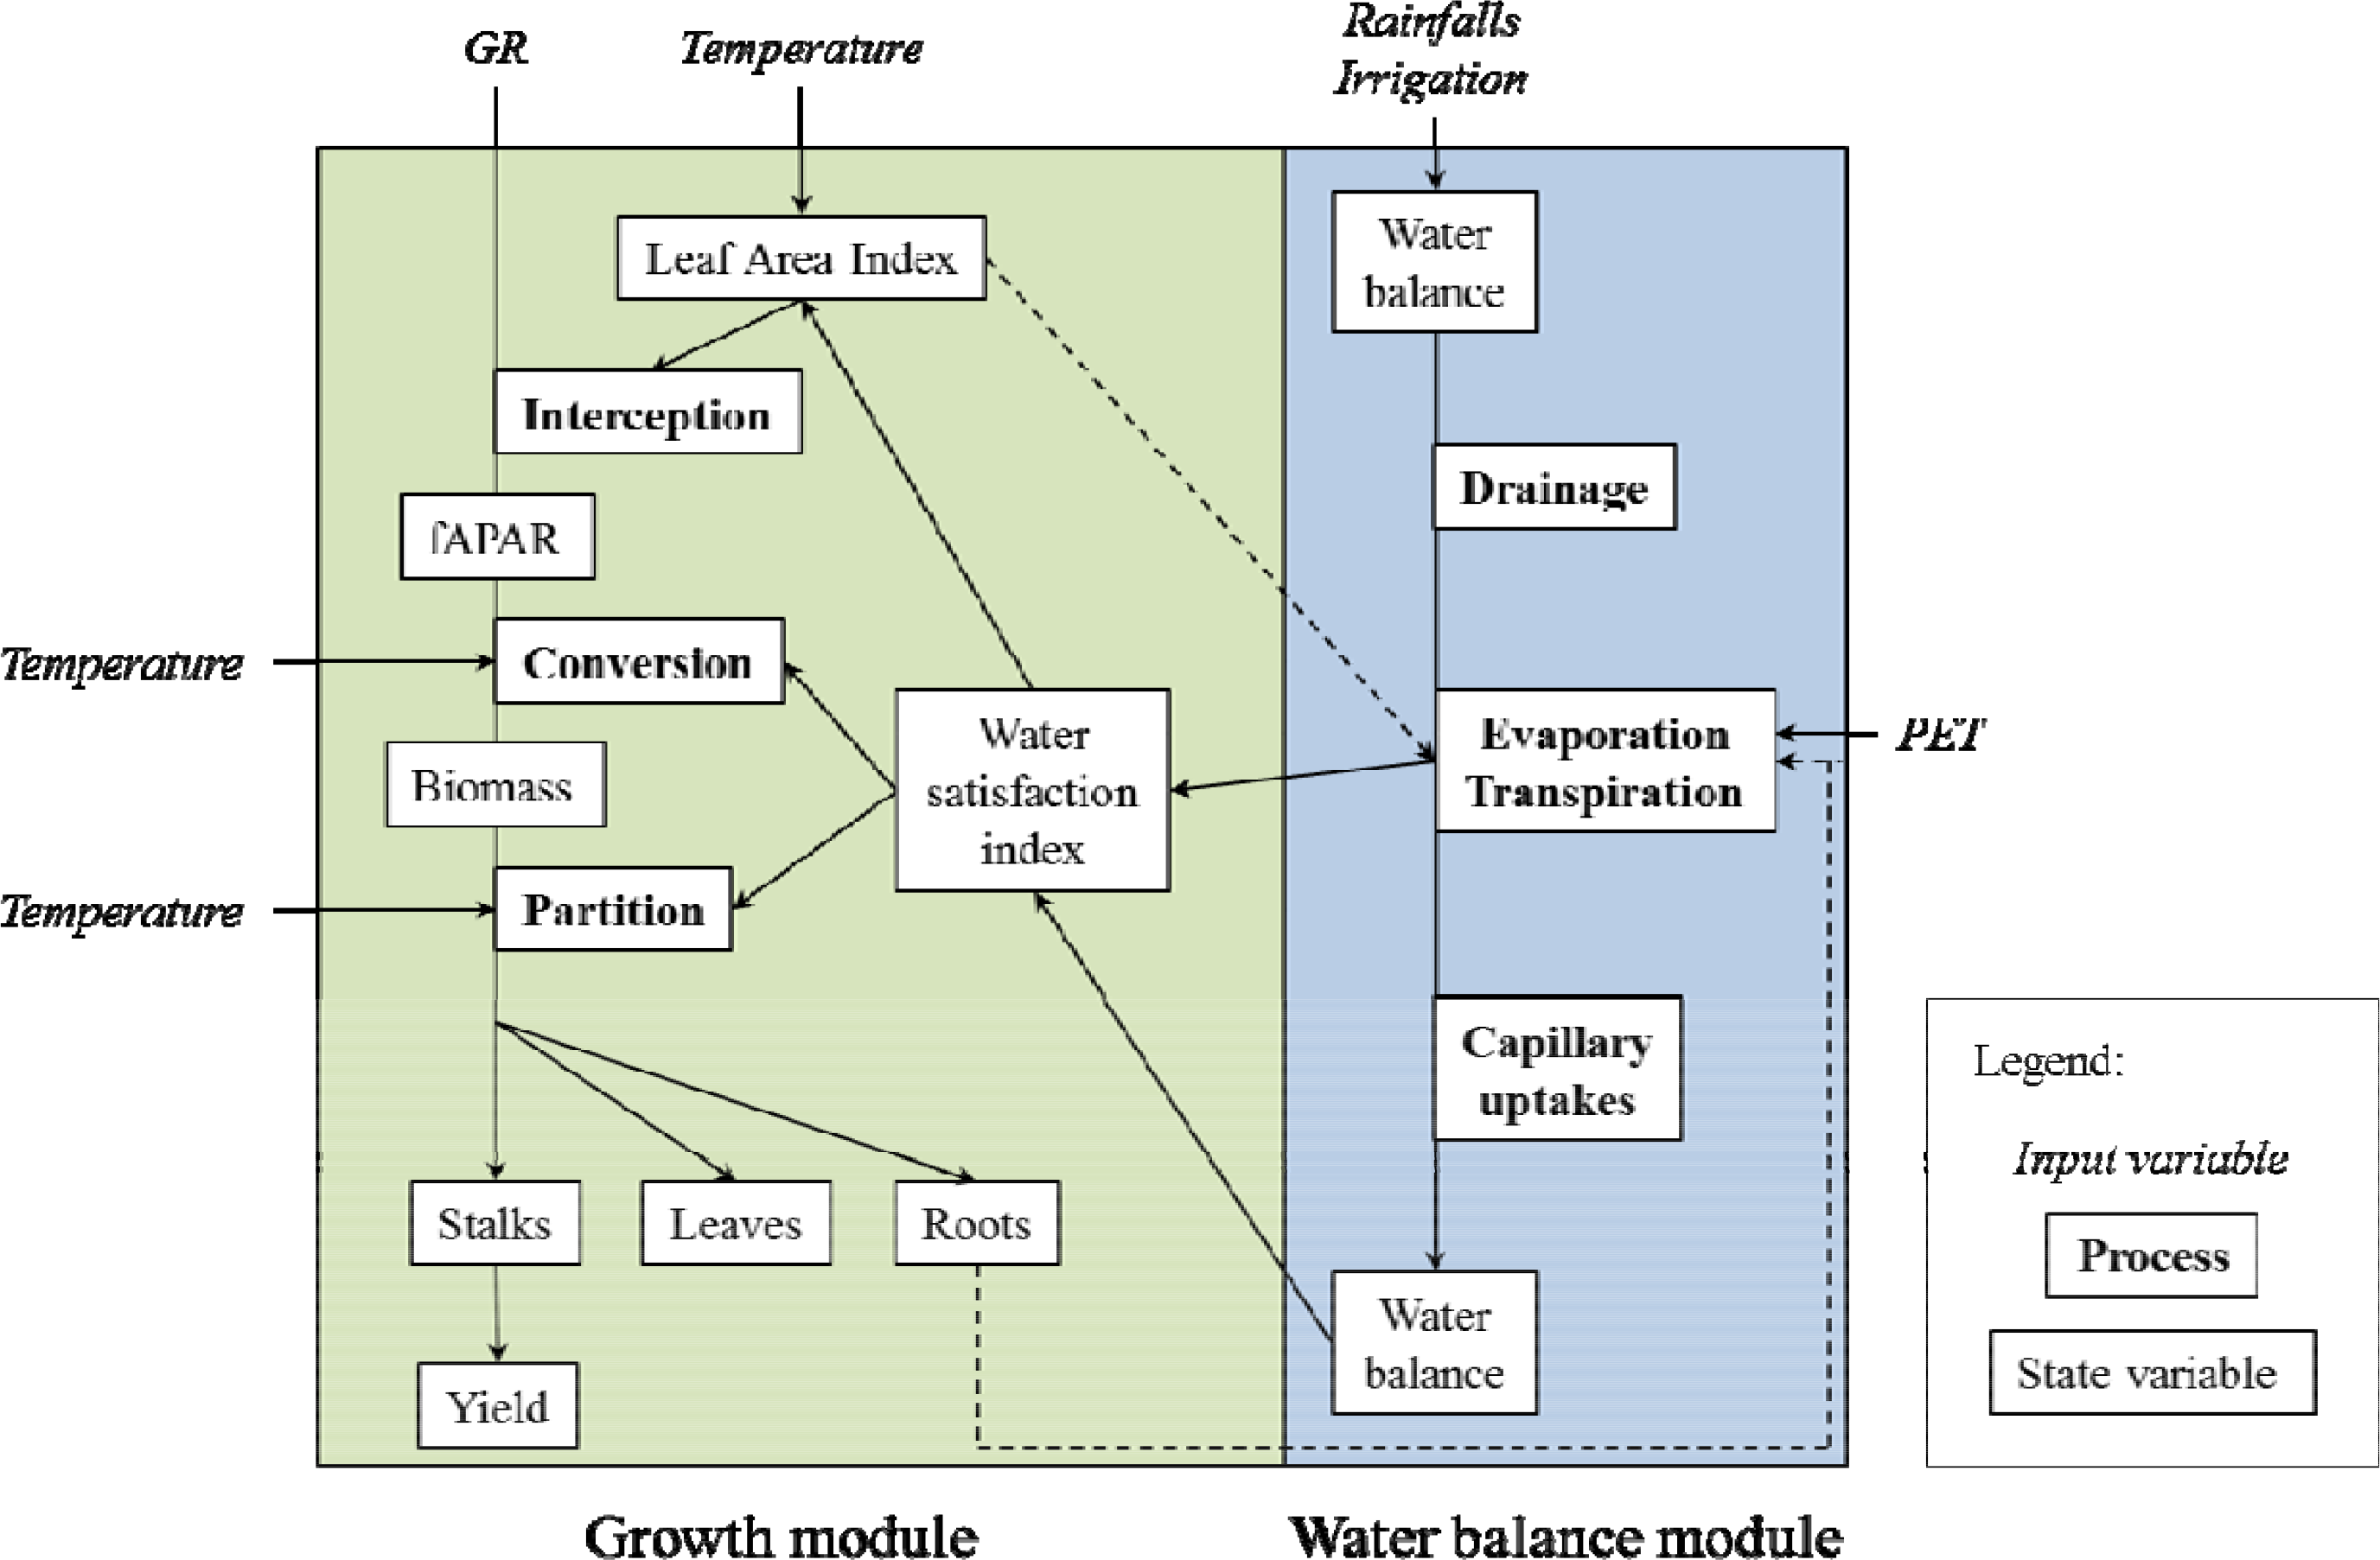
2.2.4. MOSICAS Sugarcane Crop Model

MOSICAS is a semi-empirical sugarcane crop model [8], and it was used to simulate the daily growth of a uniform first ratoon sugarcane field planted with the cultivar R570 as a function of the climatic inputs and specific soil, cultivar and cropping practice parameters.
This model relies on a water balance module and growth module (Figure 3). The water balance module was adapted by [33] from the CERES Maize model [34], and it computed a water satisfaction index based on the water inputs and outputs. The growth module was based on a big leaf model [35], and it computed the daily accumulated biomass production (dry and fresh) based on the water satisfaction index, global radiation and temperature and radiation use efficiency. Similar to the Kumar-Monteith model, the fAPAR is a major variable in the estimation of the biomass production.
We used the forced-coupling method to input the fAPAR values derived from the NDVI into the MOSICAS model. Forcing a model consists of replacing the simulated values of a state variable by observed values. The model then considers the actual state of development of crop development of the studied fields. The daily values of the NDVI were derived from the NDVI temporal profiles computed with Equations (2)(4). The fAPAR values were then computed based on Equation (5).
Two MOSICAS methods were tested: simulations without forcing (referred to as the MOSICAS-RAW method) and with complete forcing (referred to as the MOSICAS-FORCED method) of MOSICAS.

2.2.5. Influence of the Number of Satellite Images

The sensitivity of the four methods (empirical NDVI-based, Kumar-Monteith, MOSICAS-RAW and MOSICAS-FORCED) to the (i) number of satellite images used in the yield estimation process and (ii) date of the yield forecast (up to two months before the harvest with a 15-day time step) was tested so that recommendations could be provided for an operational yield forecasting method.
To do so, we grouped the study fields into classes according to the number of available satellite images per field and performed an analysis of variance on the absolute error of the yield estimation to determine if the number of satellite images had a significant effect.
To evaluate the sensitivity of the methods to the forecast date, we used Equation (7) to compute the yield of each field by comparing the previous harvest date and four calendar dates te set to 15 May, 1 June, 15 June, and 1 July.
The integrated values of the NDVI, Kumar-Monteith model and MOSICAS simulated yields were computed at date te and regressed against the final yields. The four yield forecasts and yield observations at harvest were evaluated and compared using RMSE values. The earlier yield forecasts induced a decreasing number of available satellite images. A linear regression was used instead of the logistic function described in Section 3.2.1 whenever there were fewer than four images to describe the NDVI dynamics of the field.

3. Results

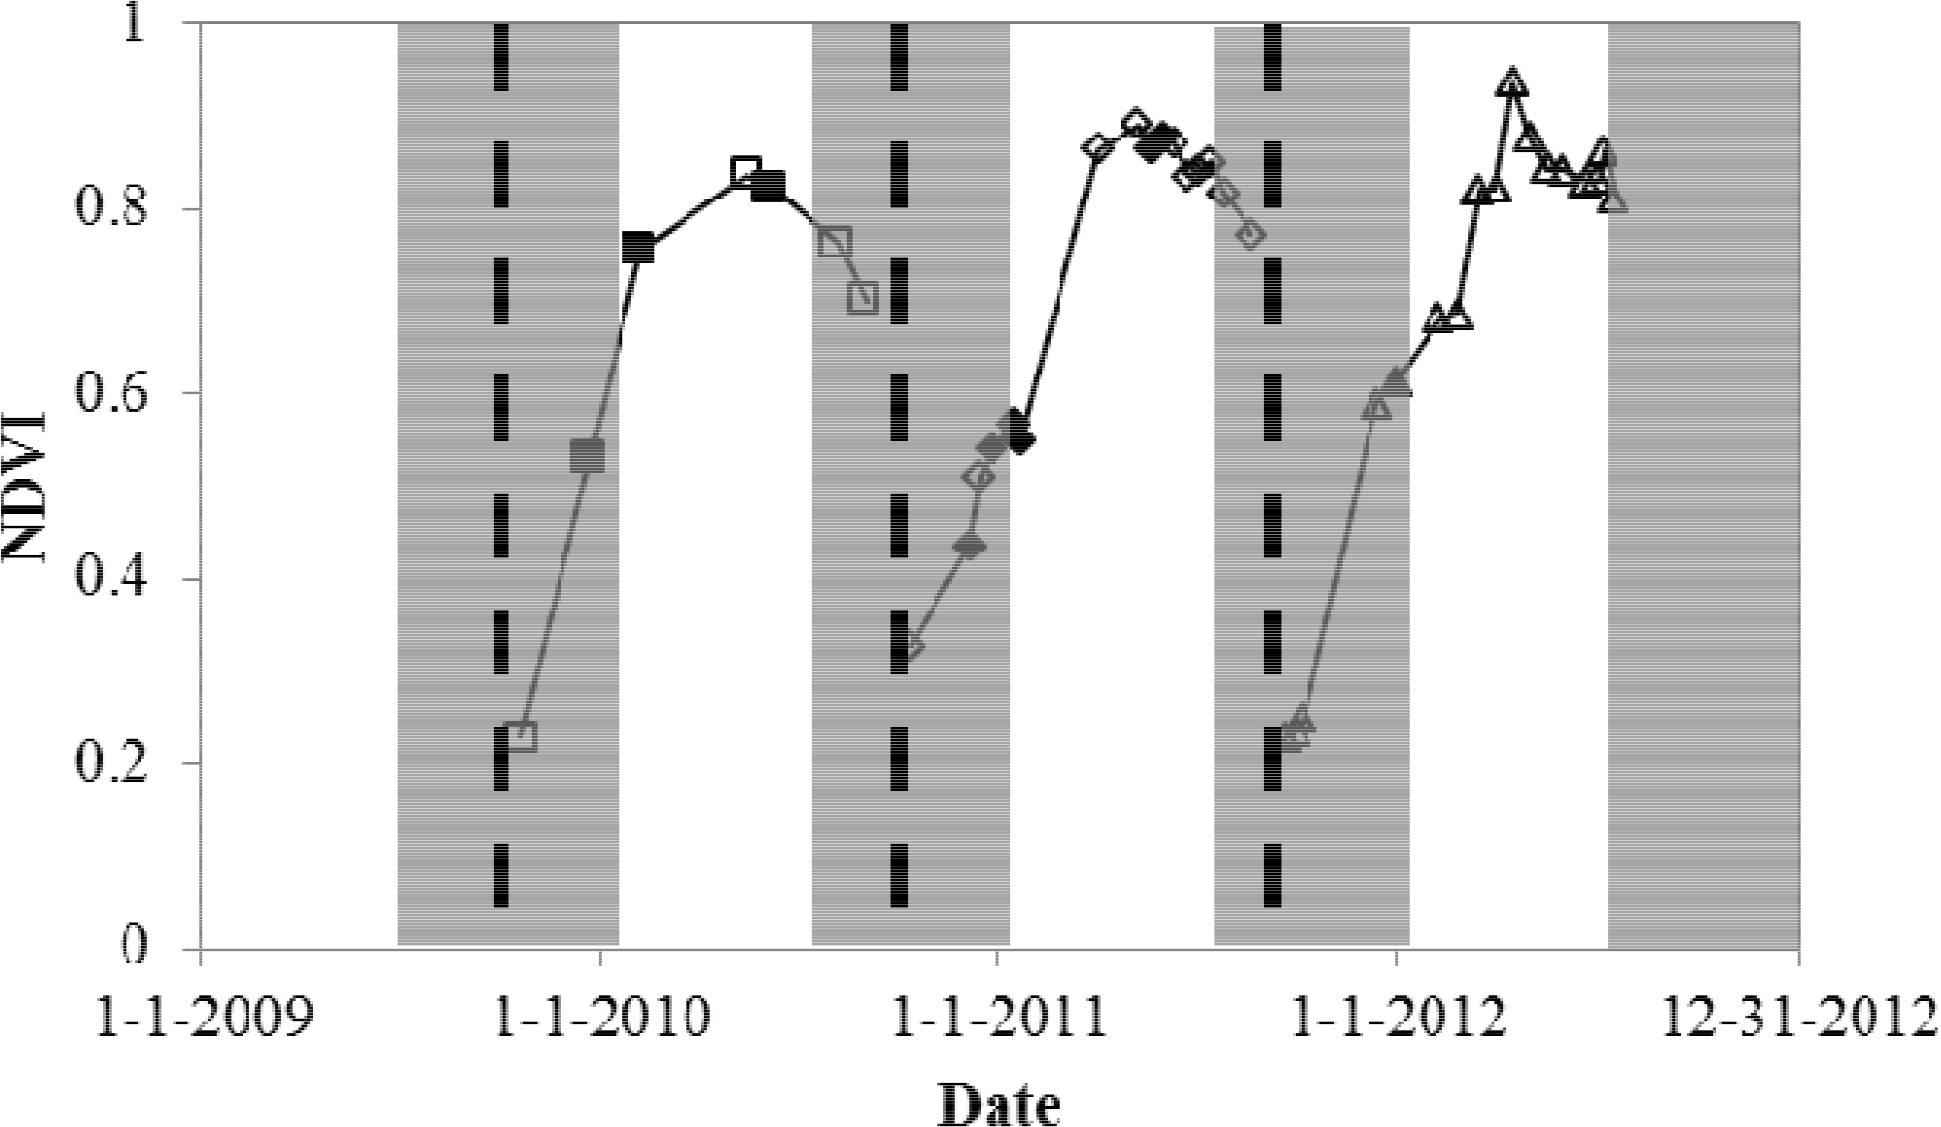
3.1. NDVI Temporal Profile

The evolution of the NDVI as a function of the thermal time and for different periods is illustrated in Figure 4.
The adjustments showed positive results, with the RMSE ranging from 0.0006 and 0.065 and mean value at 0.025.

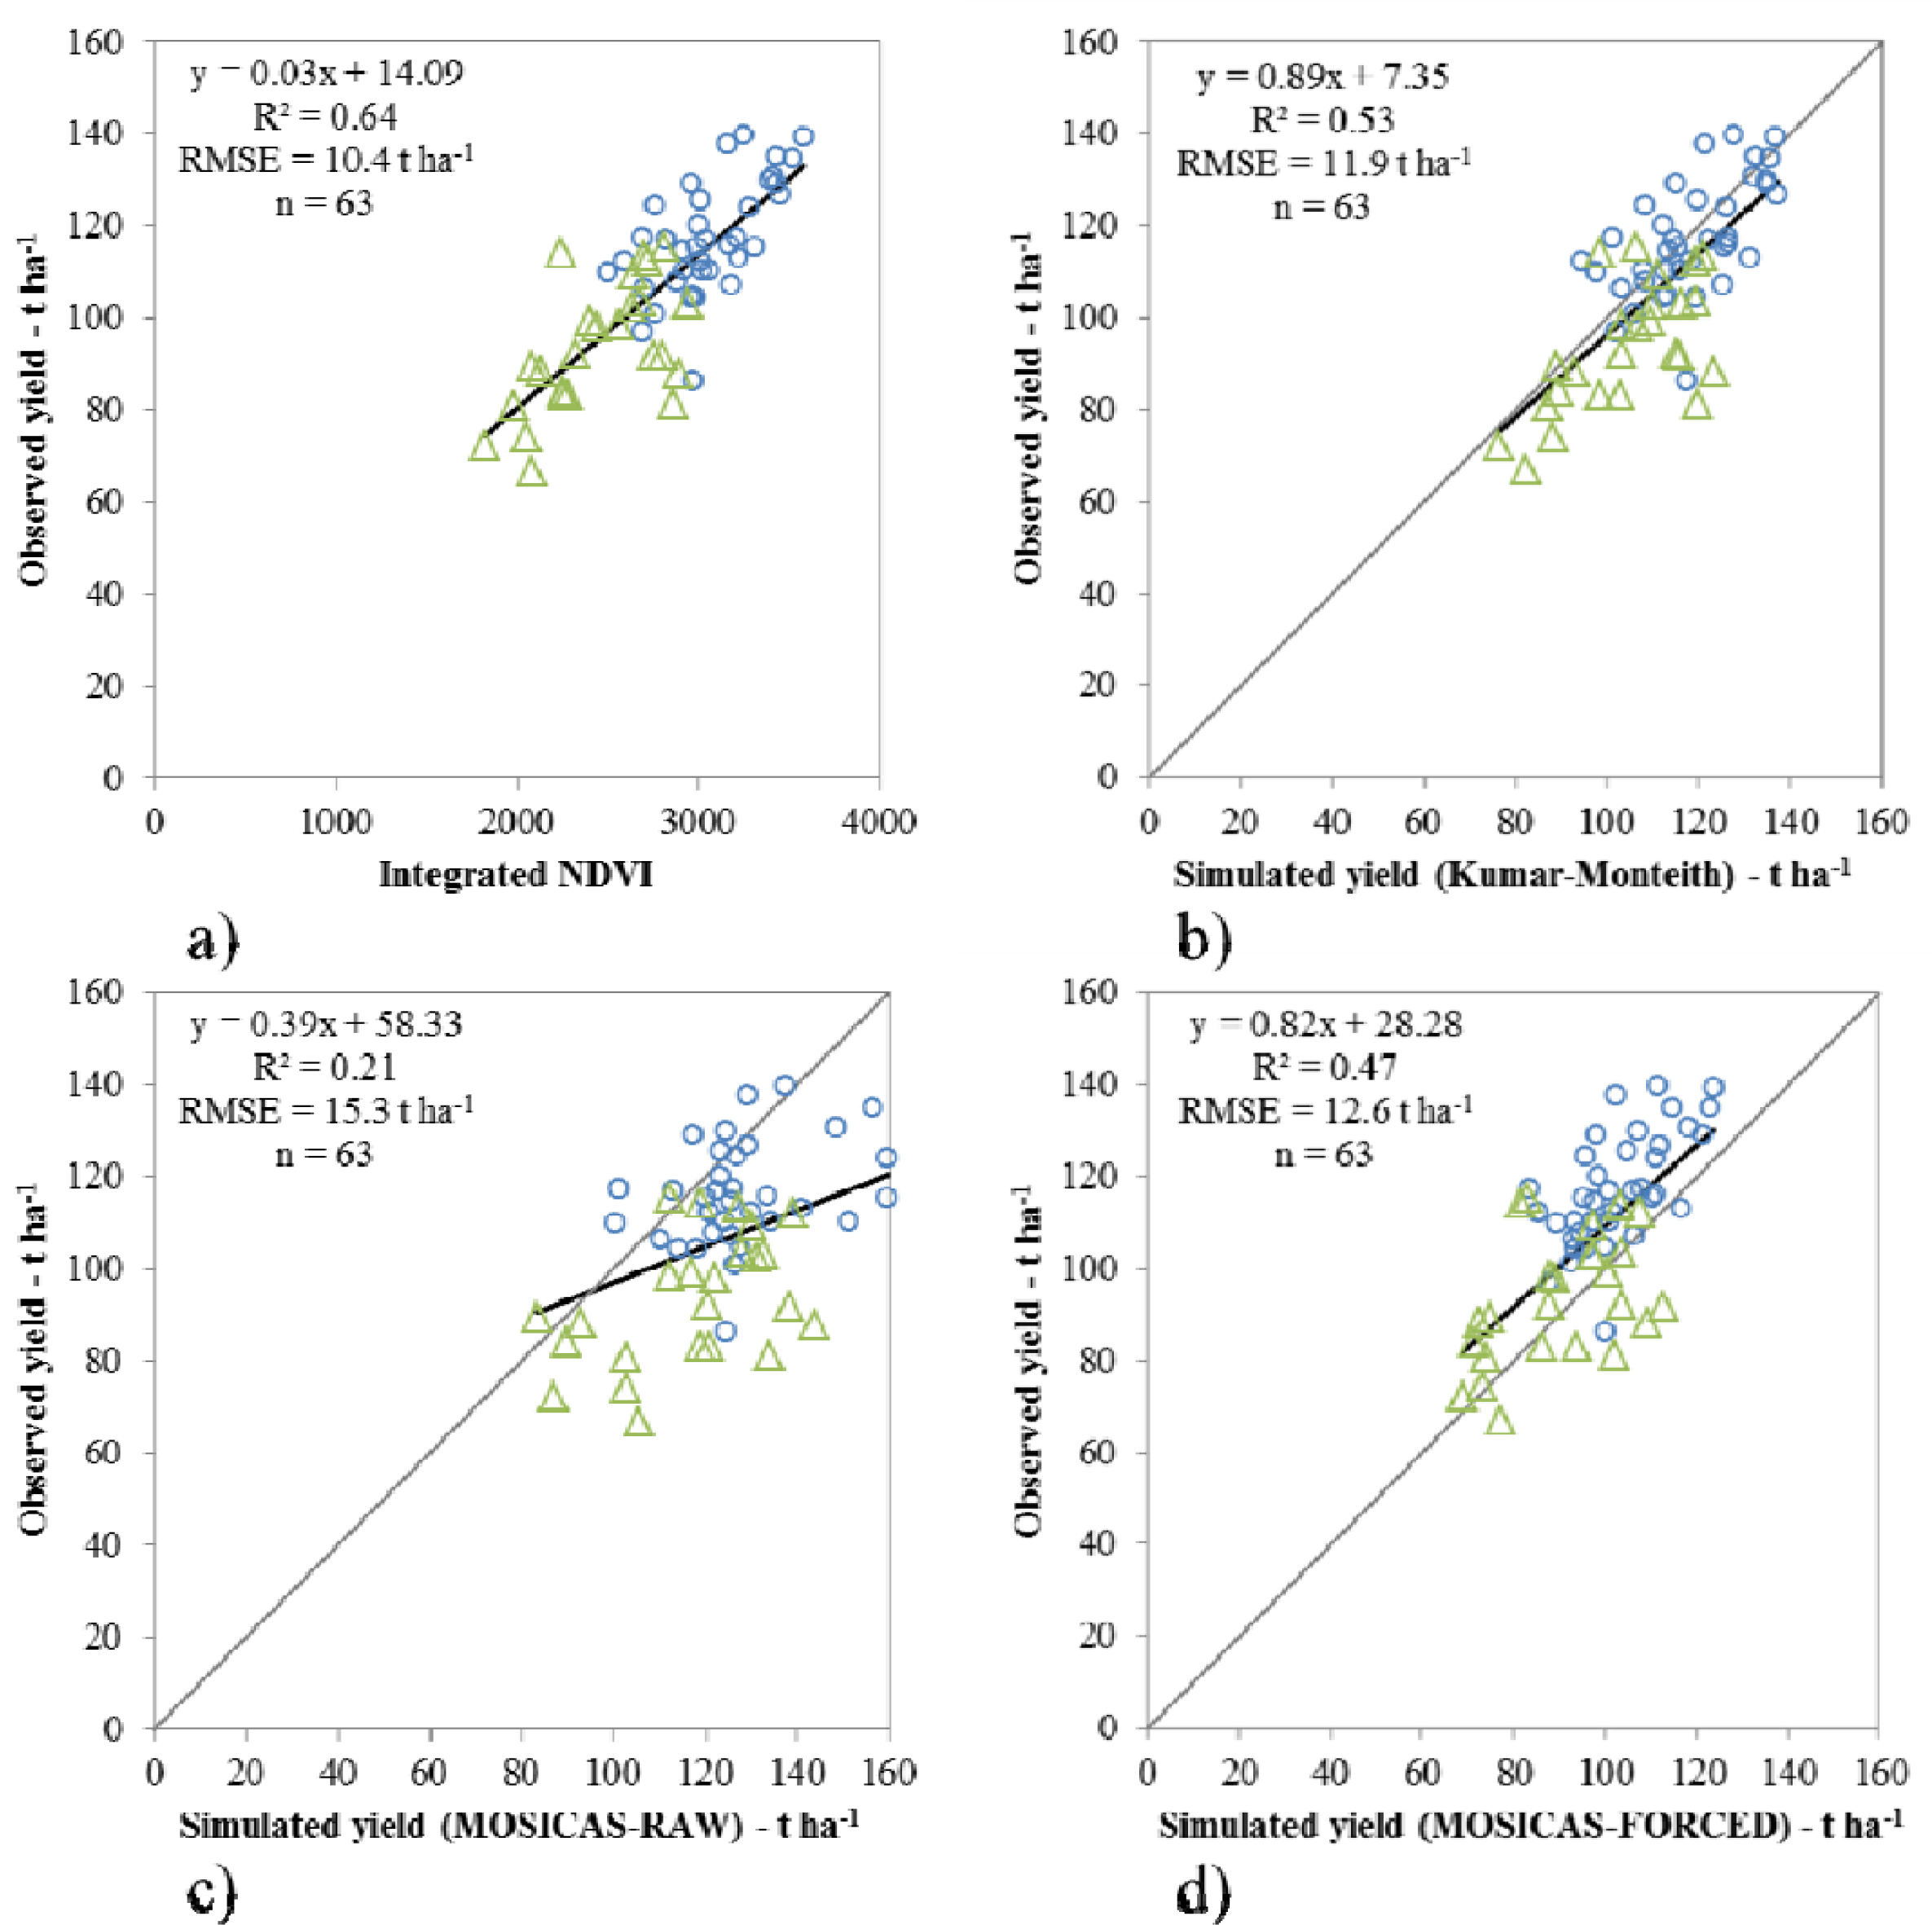
3.2. Comparison of the Methods

We compared the yield estimation accuracy of each method, and linear regression was established between the outputs of the models and observed yield at the field scale (Figure 5).
Computations were made using the NDVI values observed for the entire growing cycle.
The best results were obtained with the integrated NDVI empirical model, which had a root mean square error of 10.4 t·ha−1, which was followed by the Kumar-Monteith model and the MOSICAS-FORCED method (RMSE of 11.9 t·ha−1 and 12.6 t·ha−1, respectively). The MOSICAS-RAW simulations were the least accurate (RMSE of 15.3 t·ha−1). An analysis of variance of the absolute estimation errors showed that the year did not have a significant effect on the linear regressions (p > 0.14). However, the location of the study sites (north and south regions) did have an effect on the linear regressions based on the MOSICAS-RAW and MOSICAS-FORCED methods (p = 0.04 and 0.002, respectively).
Finally, the MOSICAS-RAW method tended to overestimate the observed yield, whereas the MOSICAS-FORCED method tended to underestimate the yield, which is shown on Figure 5.

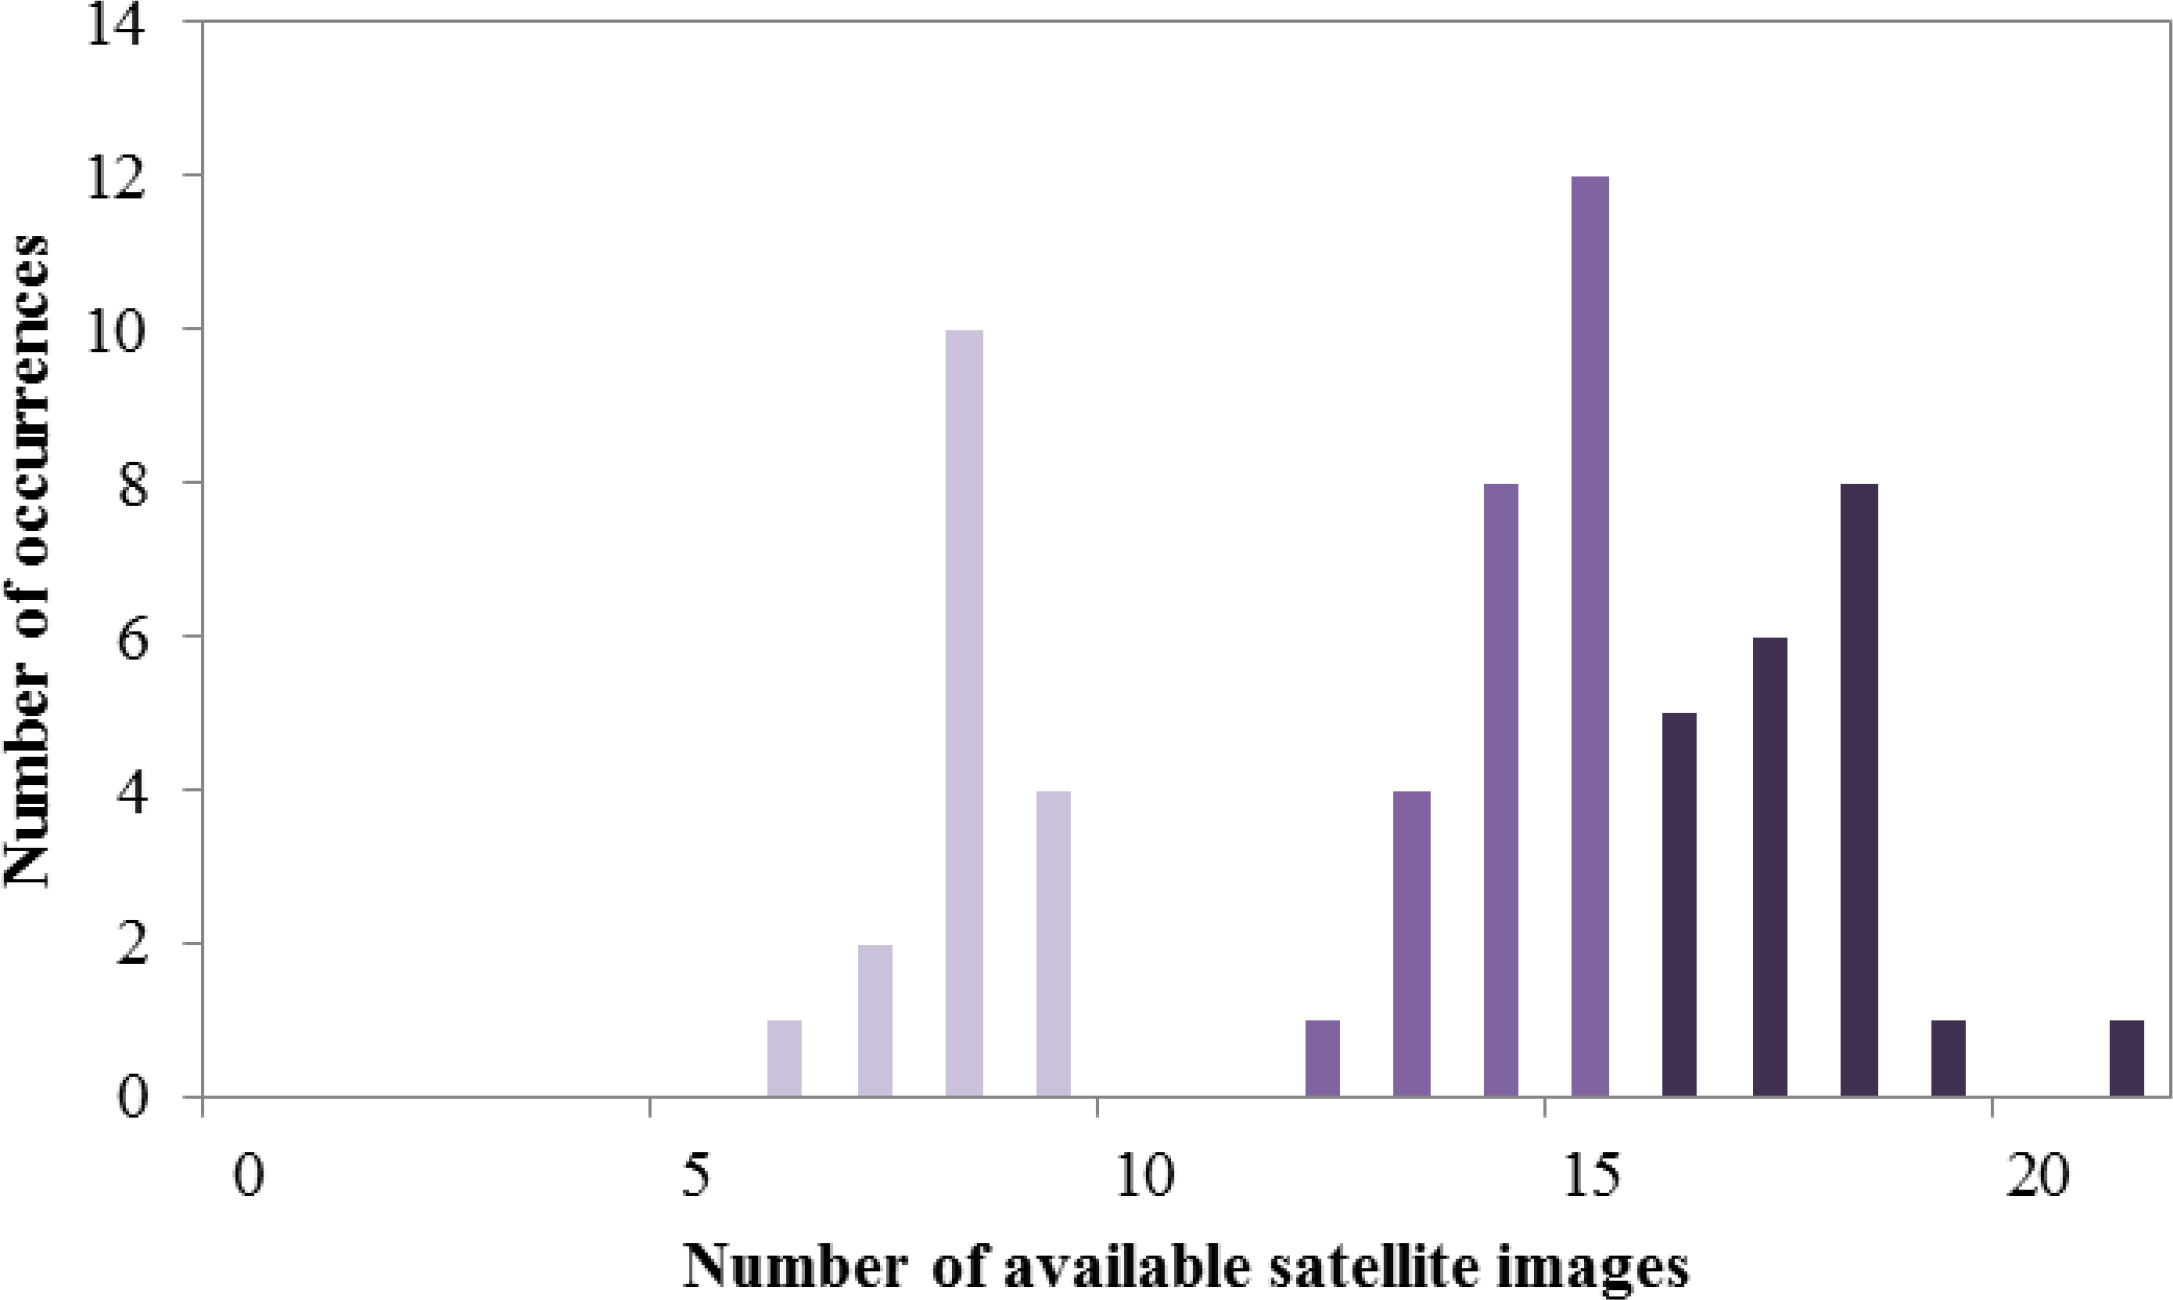
3.3. Influence of the Number of Satellite Images

We tested the influence of the number of satellite images in the methods on the estimated yield accuracy.
We first compared the results of the MOSICAS-RAW simulations with those of the MOSICAS-FORCED simulations to determine if the use of remote sensing data improved the yield estimation. The analysis of variance performed on the absolute estimation errors showed that forcing the model with remote sensing data significantly increased the accuracy (p < 0.0001).
The influence of the number of satellite images was then tested for all of the methods. Because we had a different number of available satellite images for each field, we aggregated the fields into three classes (Figure 6).
The analysis of variance showed that the number of available satellite images did not have a significant effect on the accuracy of the estimation of the yield (p-value = 0.59, 0.63 and 0.18 for MOSICAS-FORCED, integrated-NDVI based and Kumar-Monteith methods, respectively).

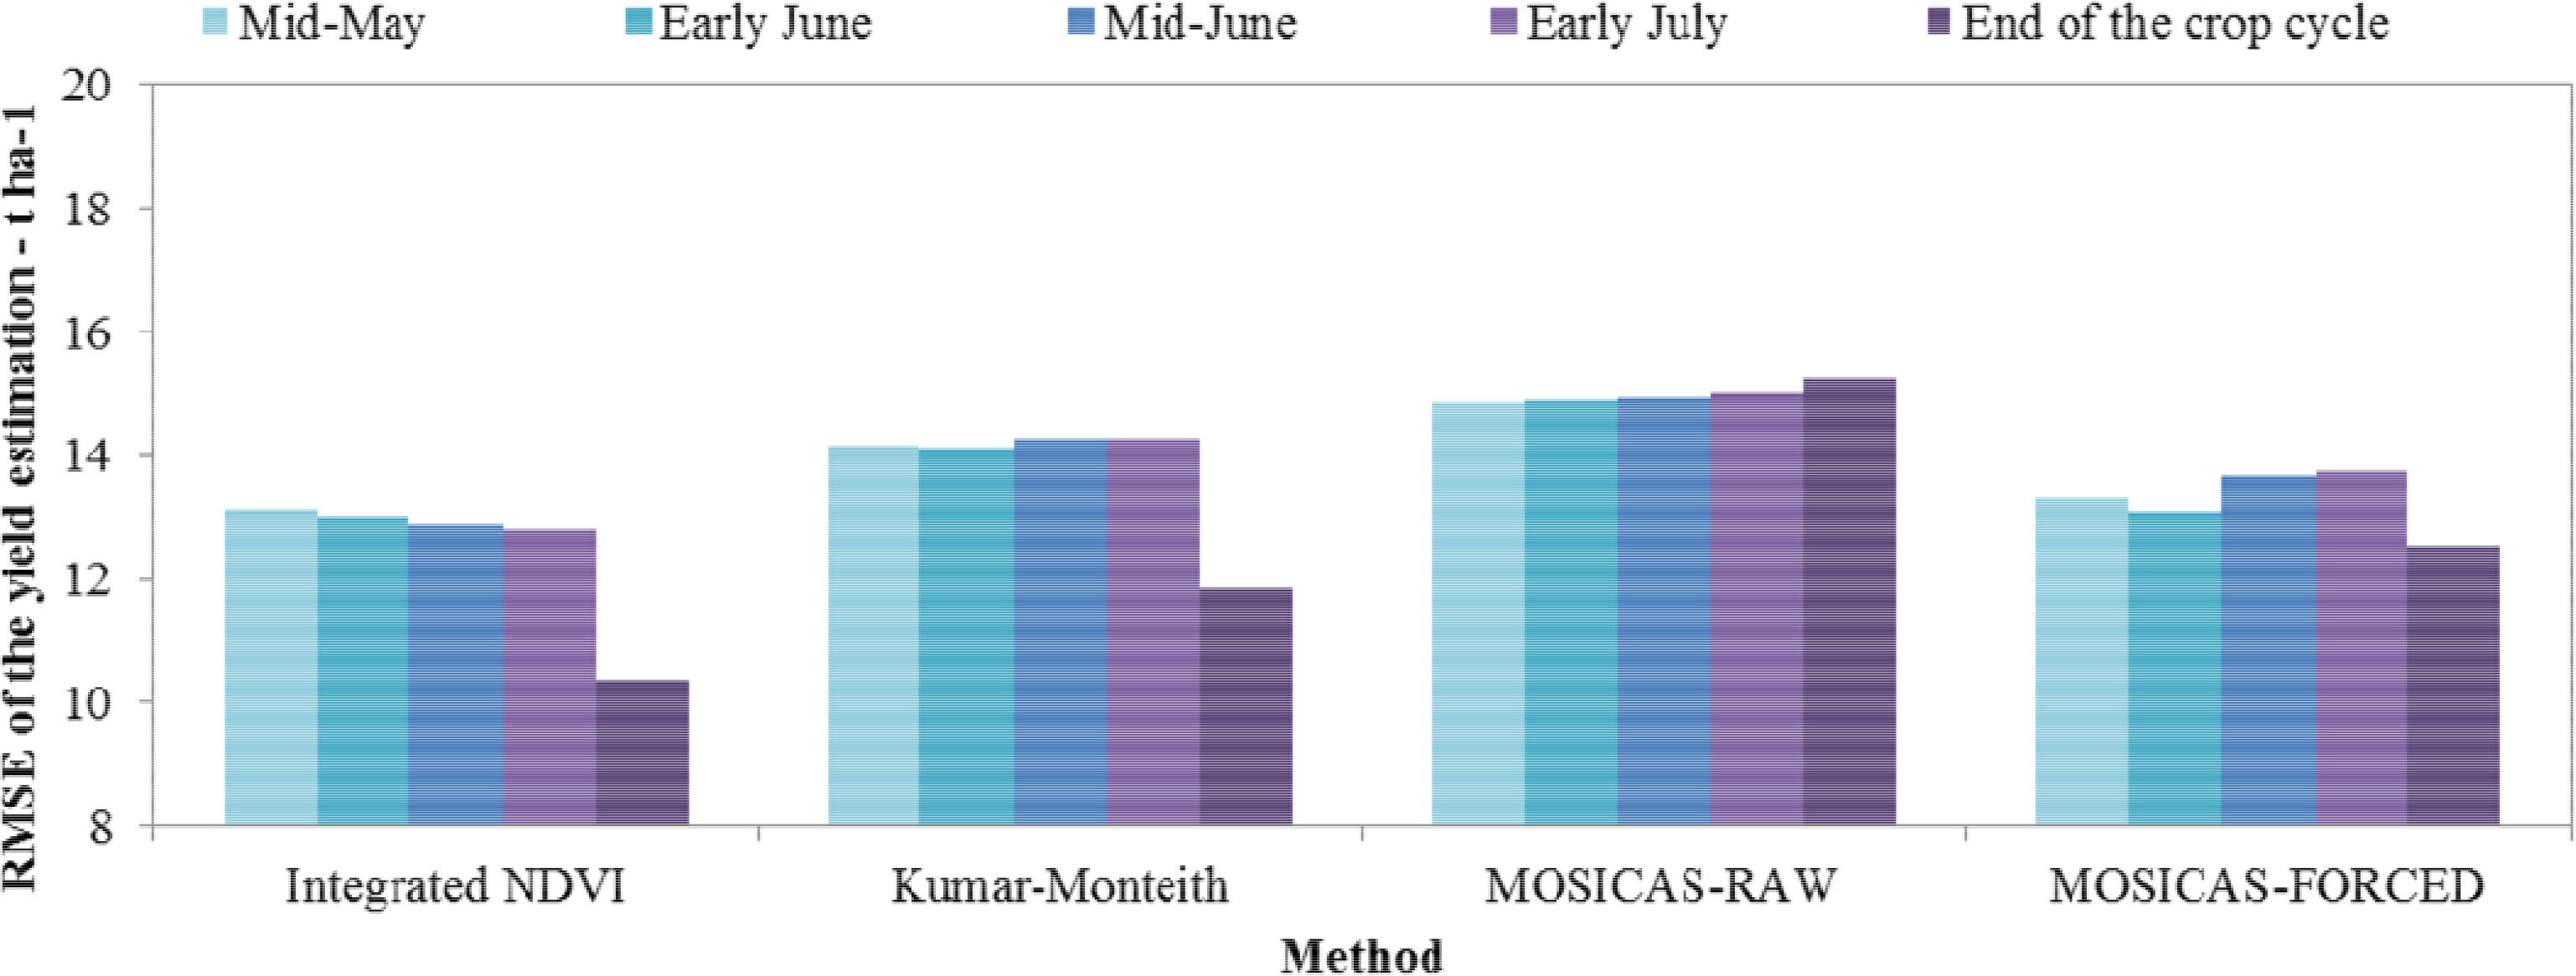
3.4. Early Forecasts

As previously stated, early yield forecasts are vitally important for the sugarcane industry. To evaluate the effect of the forecast date on the yield accuracy, we compared the actual yield measured at harvest with the simulated yield obtained from each method at five different dates (Figure 7): four forecast dates from mid-May to early July (at the beginning of the harvest) with a two-week time step and the actual harvest date of the field.
For the earliest yield forecasts (mid-May), the RMSE ranged between 13.1 and 14.8 t·ha−1. The best results were obtained with the empirical NDVI and MOSICAS-FORCED models. There was little variation in the accuracy of the forecasted yield for simulation dates between mid-May and early July. The mean RMSE values were 13.0, 14.2, 14.9 and 13.4 t·ha−1 for the empirical NDVI, Kumar-Monteith, MOSICAS-RAW and MOSICAS-FORCED methods, respectively.
According to the RMSE, the loss of accuracy between the early yield forecasts and harvest date yield estimations was higher for the integrated NDVI and Kumar-Monteith models than for the MOSICAS methods, and there was almost no influence from the forecast date on the accuracy of the MOSICAS-RAW method.

4. Discussion

4.1. Model’s Relevance

We tested the ability of three remote sensing-based methods to estimate the yield of sugarcane at the field scale under a wide range of climatic conditions and cropping practices. The accuracy of methods in estimating and providing early forecasts of sugarcane yield were evaluated for two contrasting regions of Reunion Island.
The results showed that the integrated NDVI empirical model provided the best yield estimation with an RMSE of 10.4 t·ha−1, whereas the conventionally used MOSICAS-RAW method estimated the yield with an RMSE of 15.3 t·ha−1. An analysis of variance showed that the cropping year (3 years in the data set) had no effect on the linear regressions between the simulated and observed yields. Our dataset did not include the exceptional climatic years (i.e., cyclonic years our drought years); therefore, the results should be confirmed by comparing yield estimations for two climatically contrasted cropping years, or on a longer period. Yet inter-annual climatic variability on yield estimation accuracy has not been directly tested, the highly contrasted climatic conditions from one field to another tend to show that the model is robust. We showed that the linear regression was significantly different for MOSICAS-RAW and MOSICAS-FORCED simulations depending on the study site. Certain fields located in the southern study site were irrigated, and because we used approximations of the actual volume of irrigated water, we may have introduced errors to the computations that could have resulted in a significant difference between the northern rainfed fields and southern irrigated fields. The comparison of the methods showed that the increased complexity of the processes simulated by the model did not result in an increase of yield estimation accuracy (see Table 1). The use of global radiation with the Kumar-Monteith model reduced the quality of the estimation compared to the integrated NDVI method, and integrating the water input data with the MOSICAS models resulted in a reduced accuracy of the results compared to the Kumar-Monteith’s method. In both cases, the uncertainty linked to the measurements may explain this reduction of accuracy, as there is a high spatial heterogeneity of climatic conditions.
The analysis of variance showed that forcing the model with remote sensing data resulted in a significantly increased accuracy of yield estimation, and it also showed that the number of satellite images used in the model had no influence on this accuracy. This result might be explained by the fact that the minimum number of satellite images of our studied fields was high, with at least 5 available images, which was sufficient to describe the dynamics of NDVI during crop growth.
We previously found that early forecasts of the yield, which are usually at one and a half months before the beginning of the harvest campaign, are required at the field level; however, the four methods performed poorly and had accuracies ranging between 13.0 and 13.4 t·ha−1. There was a significant increase in accuracy, however, for the empirical NDVI model, Kumar-Monteith model and MOSICAS-FORCED method when the simulations were run until the date of harvest. Remote sensing data provide representative information on the vegetative development of the field, and using this information over the complete growth cycle incorporates any phenomena that might affect the crop’s growth. However, stresses that affect the crop after the last satellite image has been acquired are not integrated in the computations. Consequently, earlier estimations of the yield include more unquantifiable errors.

4.2. Sources of Errors and Operational Considerations

Models that estimate yield must be able to perform an accurate forecast of biomass production at the field scale, and models should also be easy to set up and contain all required input data. The empirical NDVI model appears to be the easiest to set up, and it requires the least amount of input data for processing (see Table 1).
Considering the results presented in this paper, the most suitable method for sugarcane yield estimation at the field scale appears to be the empirical NDVI model because it is the simplest model to set up and provides the most accurate yield estimation over a complete cycle of the crop. For early forecasts (before the harvest period), its accuracy is lower, which was expected, but it is still equivalent to the accuracy of crop growth models run without remote sensing data. This method requires five different inputs as stated in Table 1.
As previously stated, a minimum of 5 satellites images per field should be used to estimate the yield of sugarcane fields. A number of radiometric corrections must be applied before image processing, and to be comparable, those images must be converted for the top of canopy reflectance or at least be intercalibrated, such as in [36,37]. Although several methods have been developed to automatically remove clouds from satellite images [38], there are always residual clouds and shadows that should be manually removed.
In addition, harvest dates are required to compute the thermal age of the fields; these dates cannot be systematically acquired at the field scale because of the number of smallholders with various harvest dates, but must be available before the beginning of the simulations. Several methods based on remote sensing are available to acquire harvest dates: El Hajj et al [39] used a fuzzy logic-based process to estimate the harvest date of sugarcane fields based on a SPOT-5 image time series, and Baghdadi et al [40] investigated the use of radar images from Terra SAR-X images to monitor the harvest of sugarcane fields.

5. Conclusions

We compared three methods of estimation of the sugarcane yield based on remote sensing: (1) an empirical relationship with a growing season-integrated Normalized Difference Vegetation Index NDVI, (2) the Kumar-Monteith efficiency model, and (3) a forced-coupling method with the sugarcane model MOSICAS and satellite-derived fAPAR.
Our results showed that the method based on the empirical relationship gave the most accurate estimation of crop yields. All methods show a loss of accuracy for early predictions. It has also been shown that a minimum of 5 satellite images has to be acquired in order to correctly describe the dynamic of the NDVI, and that a more important number of images will not result in a significant enhancement of the accuracy of the crop yield estimation. Finally, considering that the integrated NDVI method (i) was the most accurate to estimate the crop yield and (ii) that it is the easiest method to set up, we recommend its use for the estimation of the yield of sugarcane fields.
The method based on the empirical NDVI model should be implemented and tested at the island scale. Additional ground data are required for further method evaluation in environmental and cropping conditions that were not tested in this study. This approach should take advantage of the upcoming open access Sentinel-2 Earth observation system that will provide 10-m resolution satellite images on a 10-day (then 5-day) frequency.

Acknowledgments

The authors are grateful to the CNES (Centre National d’Études Spatiales) for the access to the ISLE-REUNION KALIDEOS data base. The authors also acknowledge the financial support of the European Agricultural Fund for Rural Development and the Regional Council of Reunion Island.

Author Contributions

Julien Morel processed the data. Julien Morel, Pierre Todoroff, Agnès Bégué, Jean-François Martiné and Michel Petit analyzed the results. Julien Morel, Pierre Todoroff and Agnès Bégué wrote the paper. Aurore Bury participated in building the database by providing characteristics of sugarcane varieties and production data. All authors shared equally the editing of the manuscript.

Conflicts of Interest

The authors declare no conflict of interest.

References

  1. Lobell, D.B.; Asner, G.P.; Ortiz-Monasterio, J.I.; Benning, T.L. Remote sensing of regional crop production in the Yaqui Valley, Mexico: Estimates and uncertainties. Agric. Ecosyst. Environ 2003, 94, 205–220. [Google Scholar]
  2. Santin-Janin, H.; Garel, M.; Chapuis, J.L.; Pontier, D. Assessing the performance of NDVI as a proxy for plant biomass using non-linear models: A case study on the Kerguelen Archipelago. Polar Biol 2009, 32, 861–871. [Google Scholar]
  3. Le Maire, G.; Marsden, C.; Nouvellon, Y.; Grinand, C.; Hakamada, R.; Stape, J.-L.; Laclau, J.-P. MODIS NDVI time-series allow the monitoring of eucalyptus plantation biomass. Remote Sens. Environ 2011, 115, 2613–2625. [Google Scholar]
  4. Houborg, R.; Soegaard, H.; Boegh, E. Combining vegetation index and model inversion methods for the extraction of key vegetation biophysical parameters using terra and aqua modis reflectance data. Remote Sens. Environ 2007, 106, 39–58. [Google Scholar]
  5. Bartlett, D.S.; Whiting, G.J.; Hartman, J.M. Use of vegetation indices to estimate indices to estimate intercepted solar radiation and net carbon dioxide exchange of a grass canopy. Remote Sens. Environ 1989, 30, 115–128. [Google Scholar]
  6. Bégué, A. Leaf area index, intercepted photosynthetically active radiation, and spectral vegetation indices: A sensitivity analysis for regular-clumped canopies. Remote Sens. Environ 1993, 46, 45–59. [Google Scholar]
  7. Kumar, M.; Monteith, J.L. Remote Sensing Crop Growth; Academic Press: Leicester, UK, 1981. [Google Scholar]
  8. Martiné, J.-F. Analysis and forecasting of the sucrose content of sugarcane crops during the harvest period in Reunion Island. In Proceedings of the 26th Congress of the International Society of Sugar Cane Technologists, Durban, South Africa, 29 July–2 August 2007; pp. 607–612.
  9. Bolton, D.K.; Friedl, M.A. Forecasting crop yield using remotely sensed vegetation indices and crop phenology metrics. Agric. For. Meteorol 2013, 173, 74–84. [Google Scholar]
  10. Tucker, C.J.; Vanpraet, C.L.; Sharman, M.J.; van Ittersum, G. Satellite remote sensing of total herbaceous biomass production in the Senegalese Sahel: 1980–1984. Remote Sens. Environ 1985, 17, 233–249. [Google Scholar]
  11. Duveiller, G.; López-Lozano, R.; Baruth, B. Enhanced processing of 1-km spatial resolution fapar time series for sugarcane yield forecasting and monitoring. Remote Sens 2013, 5, 1091–1116. [Google Scholar]
  12. Mulianga, B.; Bégué, A.; Simoes, M.; Todoroff, P. Forecasting regional sugarcane yield based on time integral and spatial aggregation of MODIS NDVI. Remote Sens 2013, 5, 2184–2199. [Google Scholar]
  13. Bégué, A.; Lebourgeois, V.; Bappel, E.; Todoroff, P.; Pellegrino, A.; Baillarin, F.; Siegmund, B. Spatio-temporal variability of sugarcane fields and recommendations for yield forecast using NDVI. Int. J. Remote Sens 2010, 31, 5391–5407. [Google Scholar] [Green Version]
  14. Monteith, J.L. Solar radiation and productivity in tropical ecosystems. J. Appl. Ecol 1972, 9, 744–766. [Google Scholar]
  15. Delécolle, R.; Maas, S.J.; Guérif, M.; Baret, F. Remote sensing and crop production models: Present trends. ISPRS J. Photogramm. Remote Sens 1992, 47, 145–161. [Google Scholar]
  16. Asrar, G.; Kanemasu, E.T.; Jackson, R.D.; Pinter, P.J., Jr. Estimation of total above-ground phytomass production using remotely sensed data. Remote Sens. Environ 1985, 17, 211–220. [Google Scholar]
  17. Liu, J.; Pattey, E.; Miller, J.R.; McNairn, H.; Smith, A.; Hu, B. Estimating crop stresses, aboveground dry biomass and yield of corn using multi-temporal optical data combined with a radiation use efficiency model. Remote Sens. Environ 2010, 114, 1167–1177. [Google Scholar]
  18. Dorigo, W.A.; Zurita-Milla, R.; de Wit, A.J.W.; Brazile, J.; Singh, R.; Schaepman, M.E. A review on reflective remote sensing and data assimilation techniques for enhanced agroecosystem modeling. Int. J. Appl. Earth Obs. Geoinf 2007, 9, 165–193. [Google Scholar]
  19. Atzberger, C. Advances in remote sensing of agriculture: Context description, existing operational monitoring systems and major information needs. Remote Sens 2013, 5, 949–981. [Google Scholar]
  20. Morel, J.; Martine, J.F.; Begue, A.; Todoroff, P.; Petit, M. A comparison of two coupling methods for improving a sugarcane model yield estimation with a NDVI-derived variable. In Proceedings of the Remote Sensing for Agriculture, Ecosystems, and Hydrology XIV of the Conference, Edinburgh, UK, 24–27 September 2012.
  21. Raunet, M. Le milieu physique et les sols de l’ile de la réunion. In Conséquences pour la Mise en Valeur Agricole; CIRAD: Montpellier, France, 1991; p. 438. [Google Scholar]
  22. De Boissezon, H.; Rabaute, T.; Marzocchi-Polizzi, S.; Froidefond, J.M.; Dehouck, A.; Pennober, G.; Lafon, V. The Kalideos Databases, Reference Remote Sensing Data Repositories for Coastal Applications—Content and Examples of Applications; OCOSS: Brest, France, 2010; p. 6. [Google Scholar]
  23. Clevers, J.G.P.W.; Wonder, O.W.; Jongschaap, R.E.E.; Desprats, J.F.; King, C.; Prévot, L.; Bruguier, N. Using spot data for calibrating a wheat growth model under mediterranean conditions. Agronomie 2002, 22, 687–694. [Google Scholar]
  24. R Development Core Team. R: A Language and Environment for Statistical Computing; R Foundation for Statistical Computing: Vienna, Austria, 2010. [Google Scholar]
  25. Lofton, J.; Tubana, B.S.; Kanke, Y.; Teboh, J.; Viator, H.; Dalen, M. Estimating sugarcane yield potential using an in-season determination of normalized difference vegetative index. Sensors 2012, 12, 7529–7547. [Google Scholar]
  26. Martiné, J.-F. Modélisation de la Production Potentielle de la Canne à Sucre en Zone Tropicale, Sous Conditions Thermiques et Hydriques Contrastées; Institut National Agronomique Paris-Grignon: Paris, France, 2003. [Google Scholar]
  27. Robertson, M.J.; Wood, A.W.; Muchow, R.C. Growth of sugarcane under high input conditions in tropical Australia. I. Radiation use, biomass accumulation and partitioning. Field Crops Res 1996, 48, 11–25. [Google Scholar]
  28. Papaioannou, G.; Papanikolaou, N.; Retalis, D. Relationships of photosynthetically active radiation and shortwave irradiance. Theor. Appl. Climatol 1993, 48, 23–27. [Google Scholar]
  29. Stanhill, G.; Fuchs, M. The relative flux density of photosynthetically active radiation. J. Appl. Ecol 1977, 14, 317–322. [Google Scholar]
  30. Christensen, S.; Goudriaan, J. Deriving light interception and biomass from spectral reflectance ratio. Remote Sens. Environ 1993, 43, 87–95. [Google Scholar]
  31. Morel, J.; Bégué, A.; Todoroff, P.; Martine, J.F.; Lebourgeois, V.; Petit, M. Coupling a sugarcane crop model with the remotely sensed time series of fipar to optimise the yield estimation. Eur. J. Agron 2014, in press.. [Google Scholar]
  32. Lingle, S.E. Sugarcane. In Crop Yield, Physiology and Processes; Smith, D.L., Hamel, C., Eds.; Springer-Verlag: Berlin, Germany, 1999; pp. 287–310. [Google Scholar]
  33. Gabrielle, B.; Menasseri, S.; Houot, S. Analysis and field evaluation of the ceres models water balance component. Soil Sci. Soc. Am. J 1995, 59, 1403–1412. [Google Scholar]
  34. Jones, C.A.; Kiniry, J.R.; Dyke, P.T. Ceres-Maize: A Simulation Model of Maize Growth and Development; Texas A&M University Press: Texas, TX, USA, 1986. [Google Scholar]
  35. Sellers, P.J.; Dickinson, R.E.; Randall, D.A.; Betts, A.K.; Hall, F.G.; Berry, J.A.; Collatz, G.J.; Denning, A.S.; Mooney, H.A.; Nobre, C.A.; et al. Modeling the exchanges of energy, water, and carbon between continents and the atmosphere. Science 1997, 275, 502–509. [Google Scholar]
  36. Bappel, E. Apport de la Télédétection Aérospatiale pour l’Aide à la Gestion de la Sole Cannière Réunionnaise; La Réunion: Saint-Denis, France, 2005. [Google Scholar]
  37. El Hajj, M.; Bégué, A.; Lafrance, B.; Hagolle, O.; Dedieu, G.; Rumeau, M. Relative radiometric normalization and atmospheric correction of a SPOT 5 time series. Sensors 2008, 8, 2774–2791. [Google Scholar]
  38. Champion, N. Automatic cloud detection from multi-temporal satellite images: Towards the use of pléiades time series. Int. Arc. Photogramm. Remote Sens. Spatial Inf. Sci 2012, 1, 559–564. [Google Scholar]
  39. El Hajj, M.; Bégué, A.; Guillaume, S.; Martiné, J.-F. Integrating SPOT-5 time series, crop growth modeling and expert knowledge for monitoring agricultural practices—The case of sugarcane harvest on Reunion island. Remote Sens. Environ 2009, 113, 2052–2061. [Google Scholar]
  40. Baghdadi, N.; Cresson, R.; Todoroff, P.; Moinet, S. Multitemporal observations of sugarcane by TerraSAR-X images. Sensors 2010, 10, 8899–8919. [Google Scholar]
Figure 1. Location of the sugarcane fields and sugarcane mills on Reunion Island. The magnified insets show the two study sites (fields and weather and pluviometer stations).
Remotesensing 06 06620f1
Figure 2. Example of the NDVI time profile of a southern sugarcane field for three consecutive years. Shaded areas represent the harvest period. Bold dashed black lines represent the harvest dates. Open symbols represent the SPOT-4 images, and solid symbols represent the SPOT-5 images.
Remotesensing 06 06620f2
Figure 3. Simplified organization chart of MOSICAS. Adapted from [26].
Remotesensing 06 06620f3
Figure 4. Measured (symbols) and interpolated (lines) NDVI values in a field.
Remotesensing 06 06620f4
Figure 5. Comparison of the yield estimation accuracy of the methods: (a) empirical NDVI; (b) Kumar-Monteith model; (c) MOSICAS RAW; and (d) MOSICAS-FORCED. Blue circles represent the fields located in the northern site, green triangles represent the fields located in the southern site.
Remotesensing 06 06620f5
Figure 6. Aggregation of the fields according to the number of images.
Remotesensing 06 06620f6
Figure 7. Influence of the yield forecast date on the accuracy of the forecasted yield.
Remotesensing 06 06620f7
Table 1. Comparison of the requirements and accuracy of each model.
ModelIntegrated NDVIKumar-MonteithMOSICAS-RAWMOSICAS-FORCED
Sugarcane GISxxxx
Satellite images≥5≥50≥5
Harvest datesxxxx
Daily temperaturexxxx
NDVI-degree day modelxxx
Global radiationxxx
Rainfallxx
Irrigationxx
Number of inputs5668
RMSE, in t·ha−110.411.915.312.6

