
A One Year Landsat 8 Conterminous United States Study of Cirrus and Non-Cirrus Clouds


Abstract
:
1. Introduction
2. Data
3. Methods
3.1. Pre-Processing
3.2. CONUS Weekly Cloud Analysis
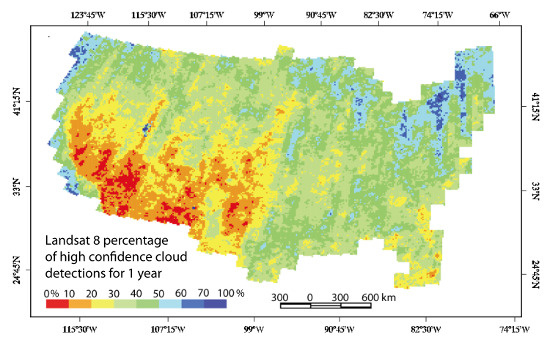
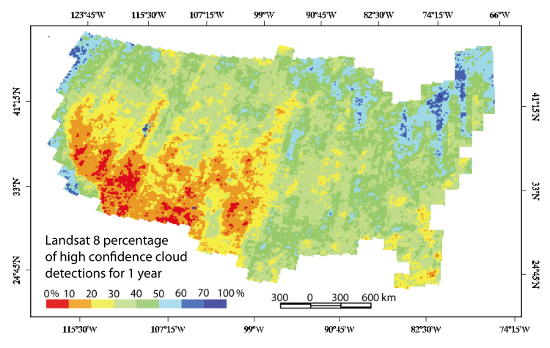
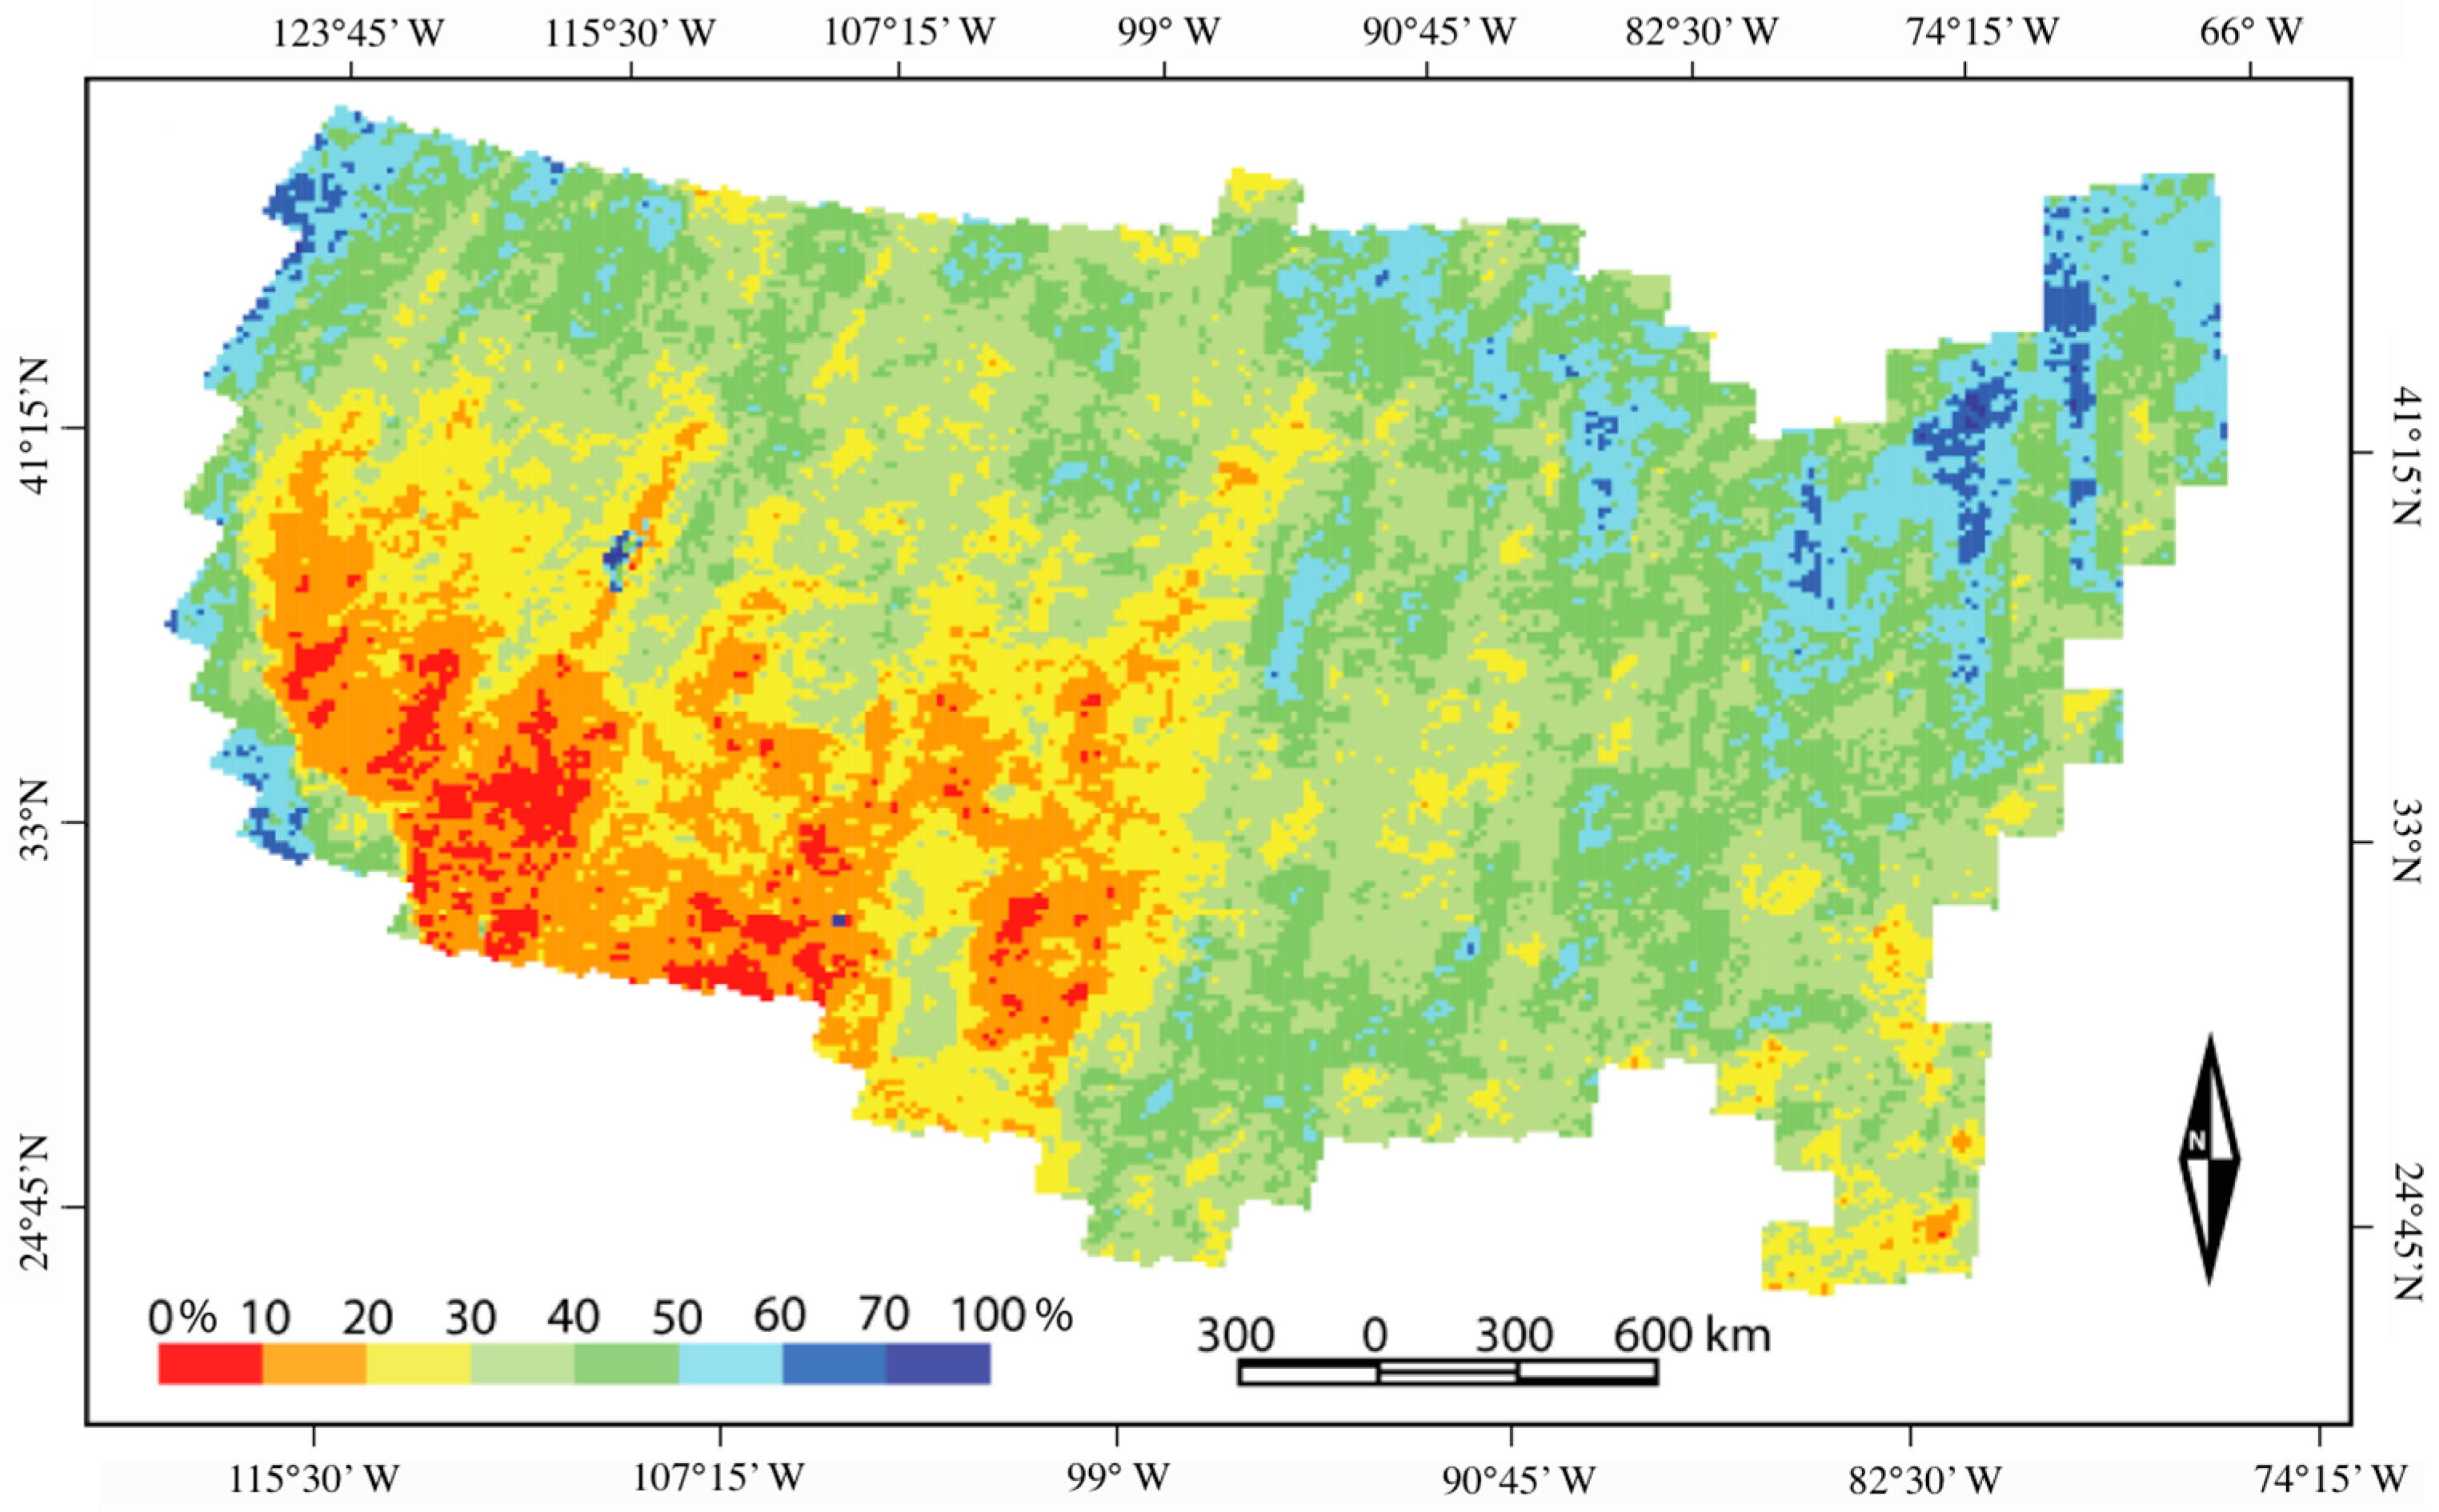
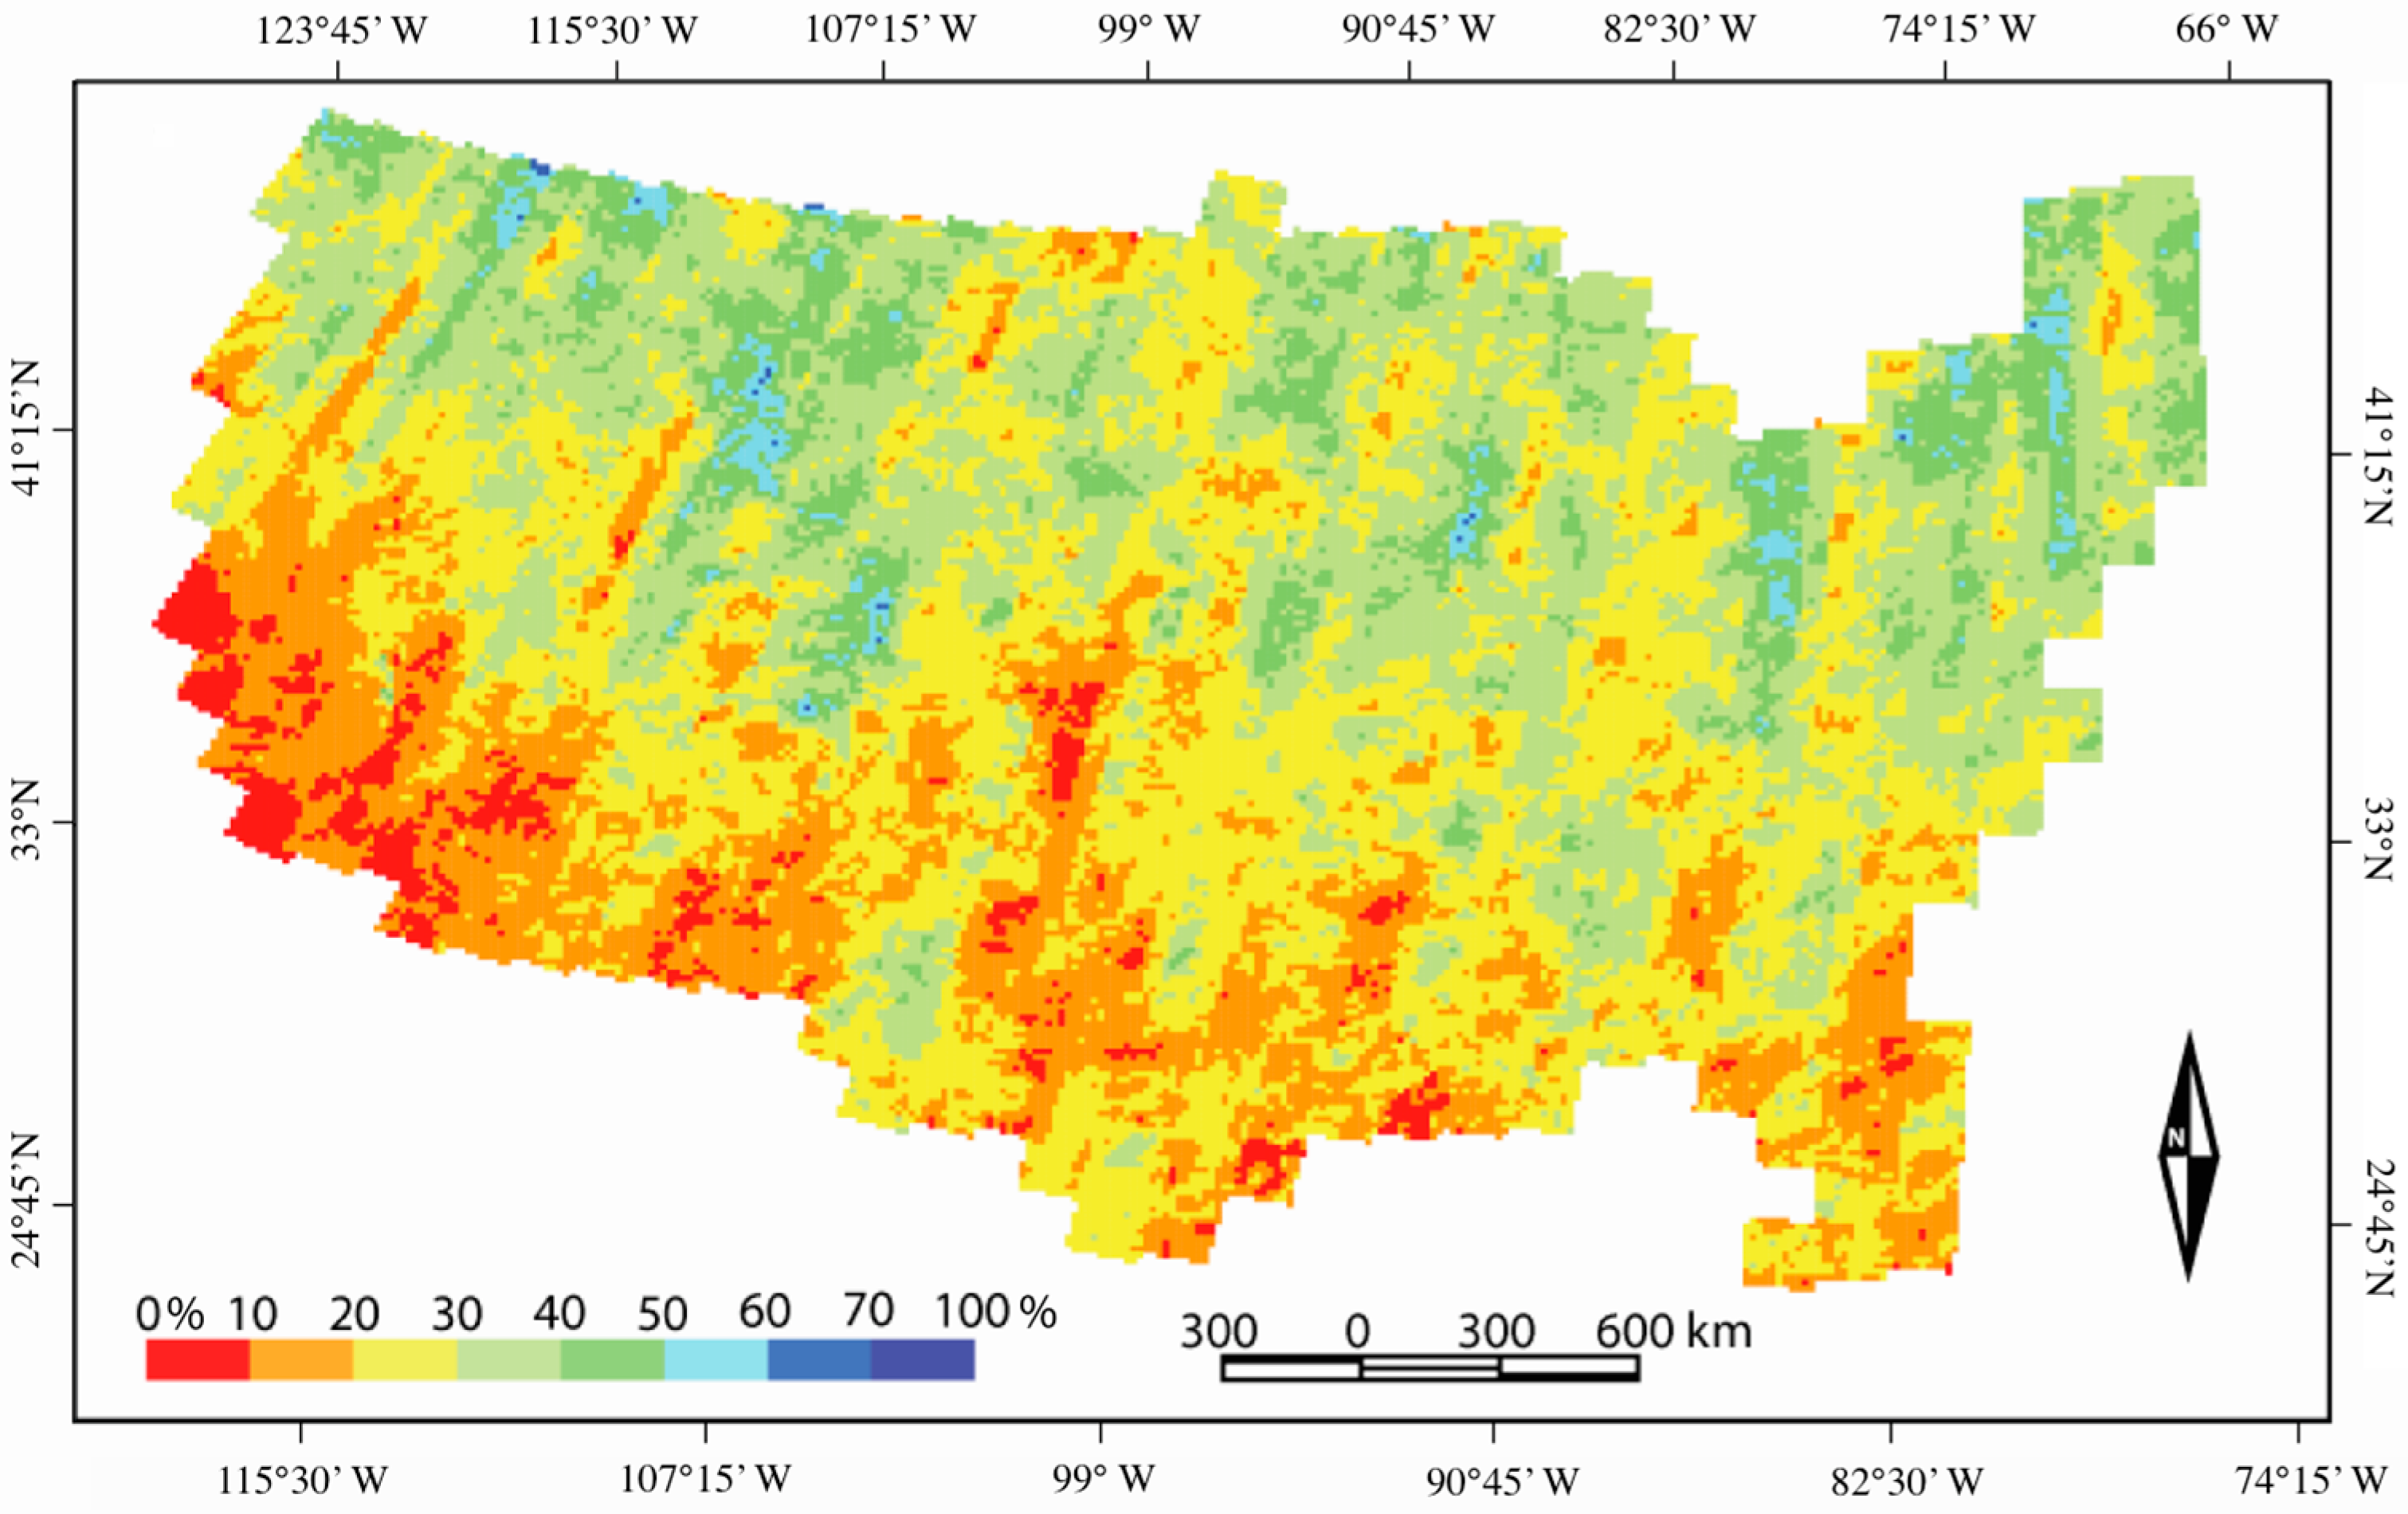
3.3. CONUS Annual Pixel Level Cloud Analysis
4. Results
4.1. CONUS Weekly Cloud Analysis


| Cloud Detection State | Mean of 53 Weekly Percentages (%) |
|---|---|
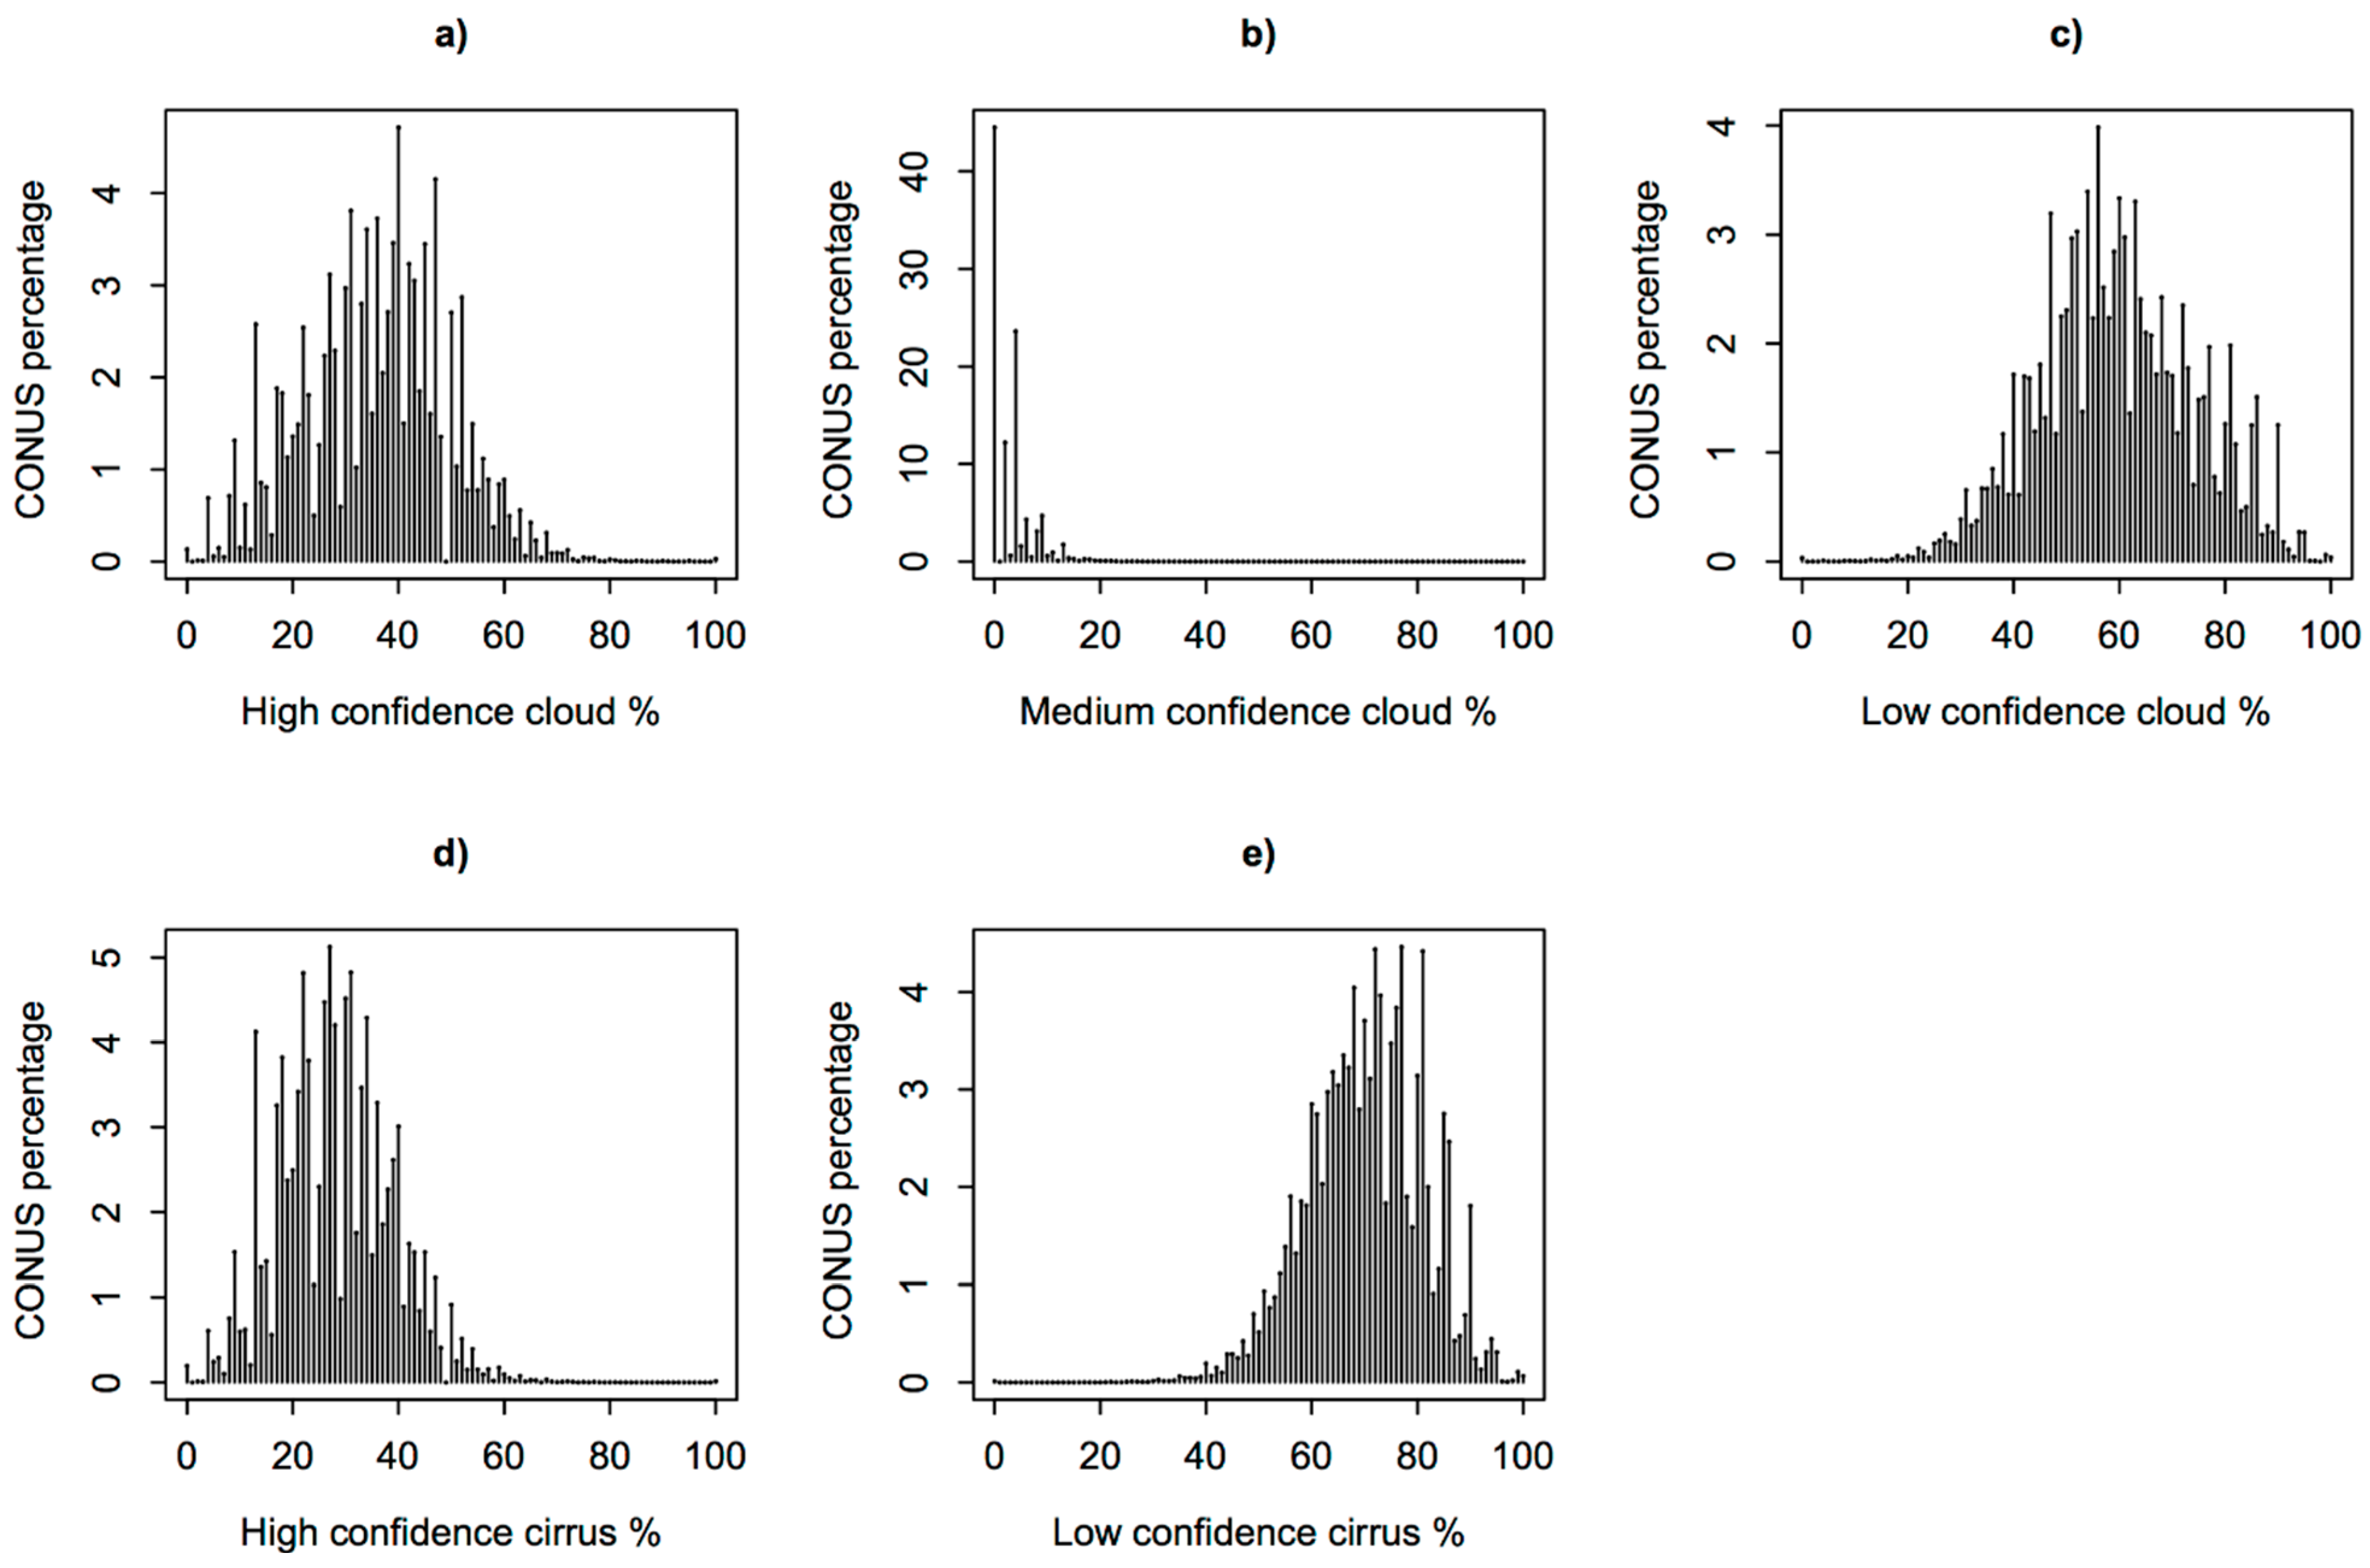
| High confidence cloud | 36.6 |
| Medium confidence cloud | 3.2 |
| Low confidence cloud | 60.2 |
| High confidence cirrus | 29.3 |
| Low confidence cirrus | 70.7 |
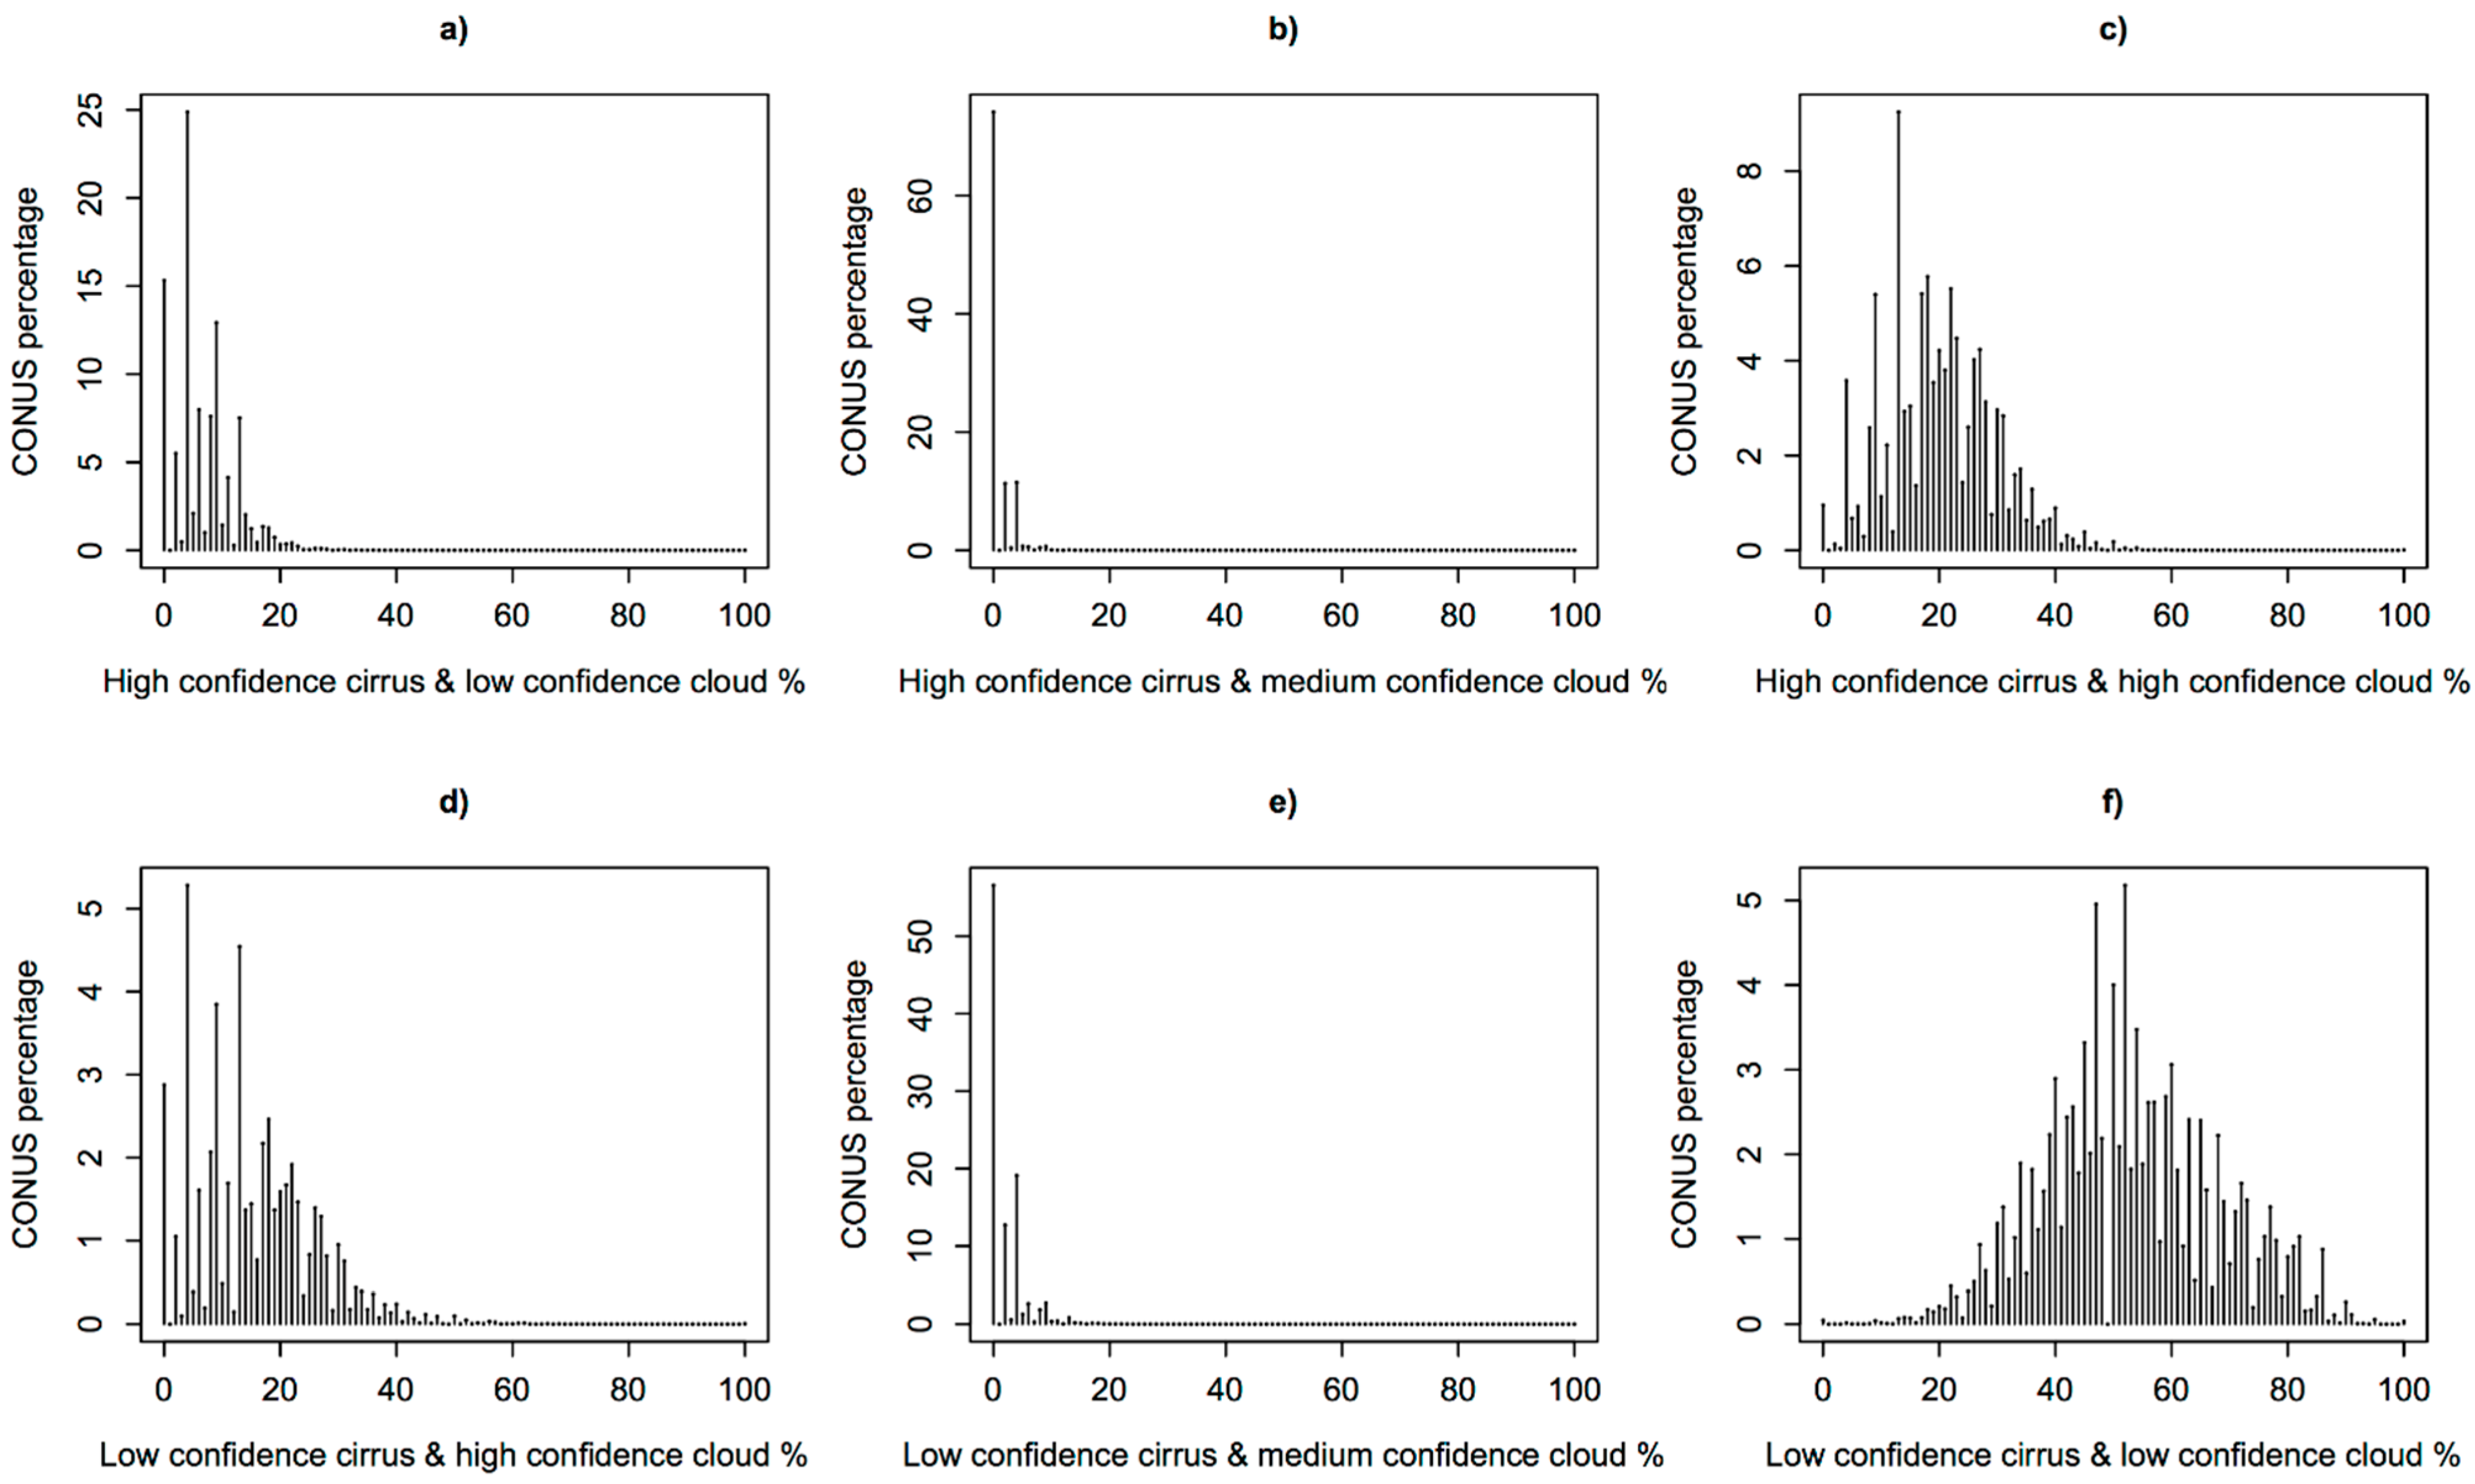
| High confidence cirrus & High confidence cloud | 21.1 |
| High confidence cirrus & Medium confidence cloud | 1.0 |
| High confidence cirrus & Low confidence cloud | 7.3 |
| Low confidence cirrus & High confidence cloud | 15.5 |
| Low confidence cirrus & Medium confidence cloud | 2.2 |
| Low confidence cirrus & Low confidence cloud | 53.0 |
4.2. CONUS Annual Pixel Level Cloud Analysis


5. Discussion
6. Conclusions
Acknowledgments
Author Contributions
Conflicts of Interest
References
- Roy, D.P.; Wulder, M.A.; Loveland, T.R.; Woodcock, C.E.; Allen, R.G.; Anderson, M.C.; Helder, D.; Irons, J.R.; Johnson, D.M.; Kennedy, R.; et al. Landsat-8: Science and product vision for terrestrial global change research. Remote Sens. Environ. 2014, 145, 154–172. [Google Scholar] [CrossRef]
- Irons, J.R.; Dwyer, J.L.; Barsi, J.A. The next Landsat satellite: The Landsat data continuity mission. Remote Sens. Environ. 2012, 122, 11–21. [Google Scholar] [CrossRef]
- USGS. Landsat 8 Data Users Handbook; USGS-Earth Resources Observation and Science: Sioux Falls, SD, USA, 2014. [Google Scholar]
- Stephens, G.L.; Vane, D.G.; Boain, R.J.; Mace, G.G.; Sassen, K.; Wang, Z.; Illingworth, A.J.; OʼConnor, E.J.; Rossow, W.B.; Durden, S.L. The CloudSat mission and the A-Train: A new dimension of space-based observations of clouds and precipitation. Bull. Am. Meteorol. Soc. 2002, 83, 1771–1790. [Google Scholar] [CrossRef]
- Stubenrauch, C.; Rossow, W.; Kinne, S.; Ackerman, S.; Cesana, G.; Chepfer, H.; di Girolamo, L.; Getzewich, B.; Guignard, A.; Heidinger, A. Assessment of global cloud datasets from satellites: Project and database initiated by the GEWEX Radiation Panel. Bull. Am. Meteorol. Soc. 2013, 94, 1031–1049. [Google Scholar] [CrossRef]
- Davis, A.; Marshak, A.; Cahalan, R.; Wiscombe, W. The Landsat scale break in stratocumulus as a three-dimensional radiative transfer effect: Implications for cloud remote sensing. J. Atmos. Sci. 1997, 54, 241–260. [Google Scholar] [CrossRef]
- Sano, E.E.; Ferreira, L.G.; Asner, G.P.; Steinke, E.T. Spatial and temporal probabilities of obtaining cloud-free Landsat images over the Brazilian tropical savanna. Int. J. Remote Sens. 2007, 28, 2739–2752. [Google Scholar] [CrossRef]
- Lindquist, E.; Hansen, M.C.; Roy, D.P.; Justice, C.O. The suitability of decadal image data sets for mapping tropical forest cover change in the Democratic Republic of Congo: Implications for the global land survey. Int. J. Remote Sens. 2008, 29, 7269–7275. [Google Scholar] [CrossRef]
- Kaufman, Y.J. The effect of subpixel clouds on remote sensing. Int. J. Remote Sens. 1987, 8, 839–857. [Google Scholar] [CrossRef]
- Kovalskyy, V.; Roy, D.P. The global availability of Landsat 5 TM and Landsat 7 ETM+ land surface observations and implications for global 30 m Landsat data product generation. Remote Sens. Environ. 2013, 130, 280–293. [Google Scholar] [CrossRef]
- Irish, R.R.; Barker, J.L.; Goward, S.N.; Arvidson, T. Characterization of the Landsat-7 ETM+ automated cloud-cover assessment (ACCA) algorithm. Photogram. Eng. Remote Sens. 2006, 72, 1179–1188. [Google Scholar] [CrossRef]
- Ju, J.; Roy, D.P. The availability of cloud-free Landsat ETM+ data over the conterminous United States and globally. Remote Sens. Environ. 2008, 112, 1196–1211. [Google Scholar] [CrossRef]
- Gao, B.; Kaufman, Y.J. Selection of the 1.375-μm MODIS channel for remote sensing of cirrus clouds and stratospheric aerosols from space. J. Atmos. Sci. 1995, 52, 4231–4237. [Google Scholar] [CrossRef]
- Gao, B.; Kaufman, Y.J.; Han, W.; Wiscombe, W.J. Corection of thin cirrus path radiances in the 0.4–1.0 μm spectral region using the sensitive 1.375 μm cirrus detecting channel. J. Geophys. Res. 1998, 103, 32169–32176. [Google Scholar] [CrossRef]
- Gao, B.-C.; Li, R.-R. Quantitative improvement in the estimates of NDVI values from remotely sensed data by correcting thin cirrus scattering effects. Remote Sens. Environ. 2000, 74, 494–502. [Google Scholar] [CrossRef]
- Meyer, K.; Yang, P.; Gao, B.-C. Optical thickness of tropical cirrus clouds derived from the MODIS 0.66 and 1.375-μm channels. IEEE Trans. Geosci. Remote Sens. 2004, 42, 833–841. [Google Scholar] [CrossRef]
- Sassen, K.; Wang, Z.; Liu, D. Global distribution of cirrus clouds from CloudSat/Cloud Aerosol lidar and infrared pathfinder satellite observations (CALIPSO) measurements. J. Geophys. Res. 2008, 113, 2156–2202. [Google Scholar]
- Wylie, D.P.; Menzel, W.P.; Woolf, H.M.; Strabala, K.I. Four years of global cirrus cloud statistics using HIRS. J. Clim. 1994, 7, 1972–1986. [Google Scholar] [CrossRef]
- Chepfer, H.; Goloub, P.; Spinhirne, J.; Flamant, P.H.; Lavorato, M.; Sauvage, L.; Brogniez, G.; Pelon, J. Cirrus cloud properties derived from POLDER-1/ADEOS polarized radiances: First validation using a ground-based lidar network. J. Appl. Meteorol. 2000, 39, 154–168. [Google Scholar] [CrossRef]
- Mace, G.G.; Zhang, Q.; Vaughan, M.; Marchand, R.; Stephens, G.; Trepte, C.; Winker, D. A description of hydrometeor layer occurrence statistics derived from the first year of merged Cloudsat and CALIPSO data. J. Geophys. Res. 2009, 114, 2156–2202. [Google Scholar]
- Yuan, T.; Oreopoulos, L. On the global character of overlap between low and high clouds. Geophys. Res. Lett. 2013, 40, 5320–5326. [Google Scholar] [CrossRef]
- Lee, D.S.; Storey, J.C.; Choate, M.J.; Hayes, R.W. Four years of Landsat-7 on-orbit geometric calibration and performance. IEEE Trans. Geosci. Remote Sens. 2004, 42, 2786–2795. [Google Scholar] [CrossRef]
- Storey, J.; Choate, M.; Lee, K. Geometric performance comparison between the OLI and the ETM+. In In Proceedings of the 2008 PECORA Conference, Denver, CO, USA, 18–20 November 2008; Volume 17, pp. 18–20.
- Roy, D.P.; Ju, J.; Kline, K.; Scaramuzza, P.L.; Kovalskyy, V.; Hansen, M.; Loveland, T.R.; Vermote, E.; Zhang, C. Web-enabled Landsat Data (WELD): Landsat ETM+ composited mosaics of the conterminous United States. Remote Sens. Environ. 2010, 114, 35–49. [Google Scholar] [CrossRef]
- Storey, J.; NASA Goddard Space Flight Center. Personal communication. 2014. [Google Scholar]
- Arvidson, T.; Goward, S.; Gasch, J.; Williams, D. Landsat-7 long-term acquisition plan. Photogram. Eng. Remote Sens. 2006, 72, 1137–1146. [Google Scholar] [CrossRef]
- Wilson, M.J.; Oreopoulos, L. Enhancing a simple MODIS CLOUD mask algorithm for the Landsat data continuity mission. IEEE Trans. Geosci. Remote Sens. 2013, 51, 723–731. [Google Scholar] [CrossRef]
- USGS. Landsat Data Continuity Mission Level 1 (L1) Data Format Control Book (DFCB); USGS EROS: Sioux Falls, SD, USA, 2012.
- Scaramuzza, P.L.; Bouchard, M.A.; Dwyer, J.L. Development of the Landsat data continuity mission cloud-cover assessment algorithms. IEEE Trans. Geosci. Remote Sens. 2012, 50, 1140–1154. [Google Scholar] [CrossRef]
- Ben-Dor, E. A precaution regarding cirrus cloud detection from airborne imaging spectrometer data using the 1.38 μm water vapor band. Remote Sens. Environ. 1994, 50, 346–350. [Google Scholar] [CrossRef]
- Roskovensky, J.; Liou, K. Detection of thin cirrus using a combination of 1.38-μm reflectance and window brightness temperature difference. J. Geophys. Res. 2003, 108, 2156–2202. [Google Scholar] [CrossRef]
- Frey, R.A.; Ackerman, S.A.; Liu, Y.; Strabala, K.I.; Zhang, H.; Key, J.R.; Wang, X. Cloud detection with MODIS. Part I: Improvements in the MODIS cloud mask for collection 5. J. Atmos. Ocean. Technol. 2008, 25, 1057–1072. [Google Scholar] [CrossRef]
- Cohen, W.B.; Maiersperger, T.K.; Gower, S.T.; Turner, D.P. An improved strategy for regression of biophysical variables and Landsat ETM+ data. Remote Sens. Environ. 2003, 84, 561–571. [Google Scholar] [CrossRef]
- Platnick, S.; King, M.D.; Ackerman, S.A.; Menzel, W.P.; Baum, B.A.; Riédi, J.C.; Frey, R.A. The MODIS cloud products: Algorithms and examples from Terra. IEEE Trans. Geosci. Remote Sens. 2003, 41, 459–473. [Google Scholar] [CrossRef]
- Zhu, Z.; Woodcock, C.E. Automated cloud, cloud shadow, and snow detection in multitemporal Landsat data: An algorithm designed specifically for monitoring land cover change. Remote Sens. Environ. 2014, 152, 217–234. [Google Scholar] [CrossRef]
- Ackerman, S.; Strabala, K.; Menzel, P.; Frey, R.; Moeller, C.; Liam, G.; Baum, B.; Wetzel Seemann, S.; Zhang, H. Discriminating Clear-Sky from Cloud with MODIS: Algorithm Theoretical Bases Document (MOD35). Available online: http://modis.gsfc.nasa.gov/data/atbd/atbd_mod06.pdf (accessed on 12 December 2014).
- Zhu, Z.; Woodcock, C.E. Object-based cloud and cloud shadow detection in Landsat imagery. Remote Sens. Environ. 2012, 118, 83–94. [Google Scholar] [CrossRef]
- Ackerman, S.A.; Holz, R.E.; Frey, R.; Eloranta, E.W.; Maddux, B.C.; McGill, M. Cloud detection with MODIS. Part II: Validation. J. Atmos. Ocean. Technol. 2008, 25, 1073–1086. [Google Scholar] [CrossRef]
© 2015 by the authors; licensee MDPI, Basel, Switzerland. This article is an open access article distributed under the terms and conditions of the Creative Commons Attribution license (http://creativecommons.org/licenses/by/4.0/).
Share and Cite
Kovalskyy, V.; Roy, D.P. A One Year Landsat 8 Conterminous United States Study of Cirrus and Non-Cirrus Clouds. Remote Sens. 2015, 7, 564-578. https://0-doi-org.brum.beds.ac.uk/10.3390/rs70100564
Kovalskyy V, Roy DP. A One Year Landsat 8 Conterminous United States Study of Cirrus and Non-Cirrus Clouds. Remote Sensing. 2015; 7(1):564-578. https://0-doi-org.brum.beds.ac.uk/10.3390/rs70100564
Chicago/Turabian StyleKovalskyy, Valeriy, and David P. Roy. 2015. "A One Year Landsat 8 Conterminous United States Study of Cirrus and Non-Cirrus Clouds" Remote Sensing 7, no. 1: 564-578. https://0-doi-org.brum.beds.ac.uk/10.3390/rs70100564