
Estimating Land Development Time Lags in China Using DMSP/OLS Nighttime Light Image

Abstract
:
1. Introduction
2. Data and Methods
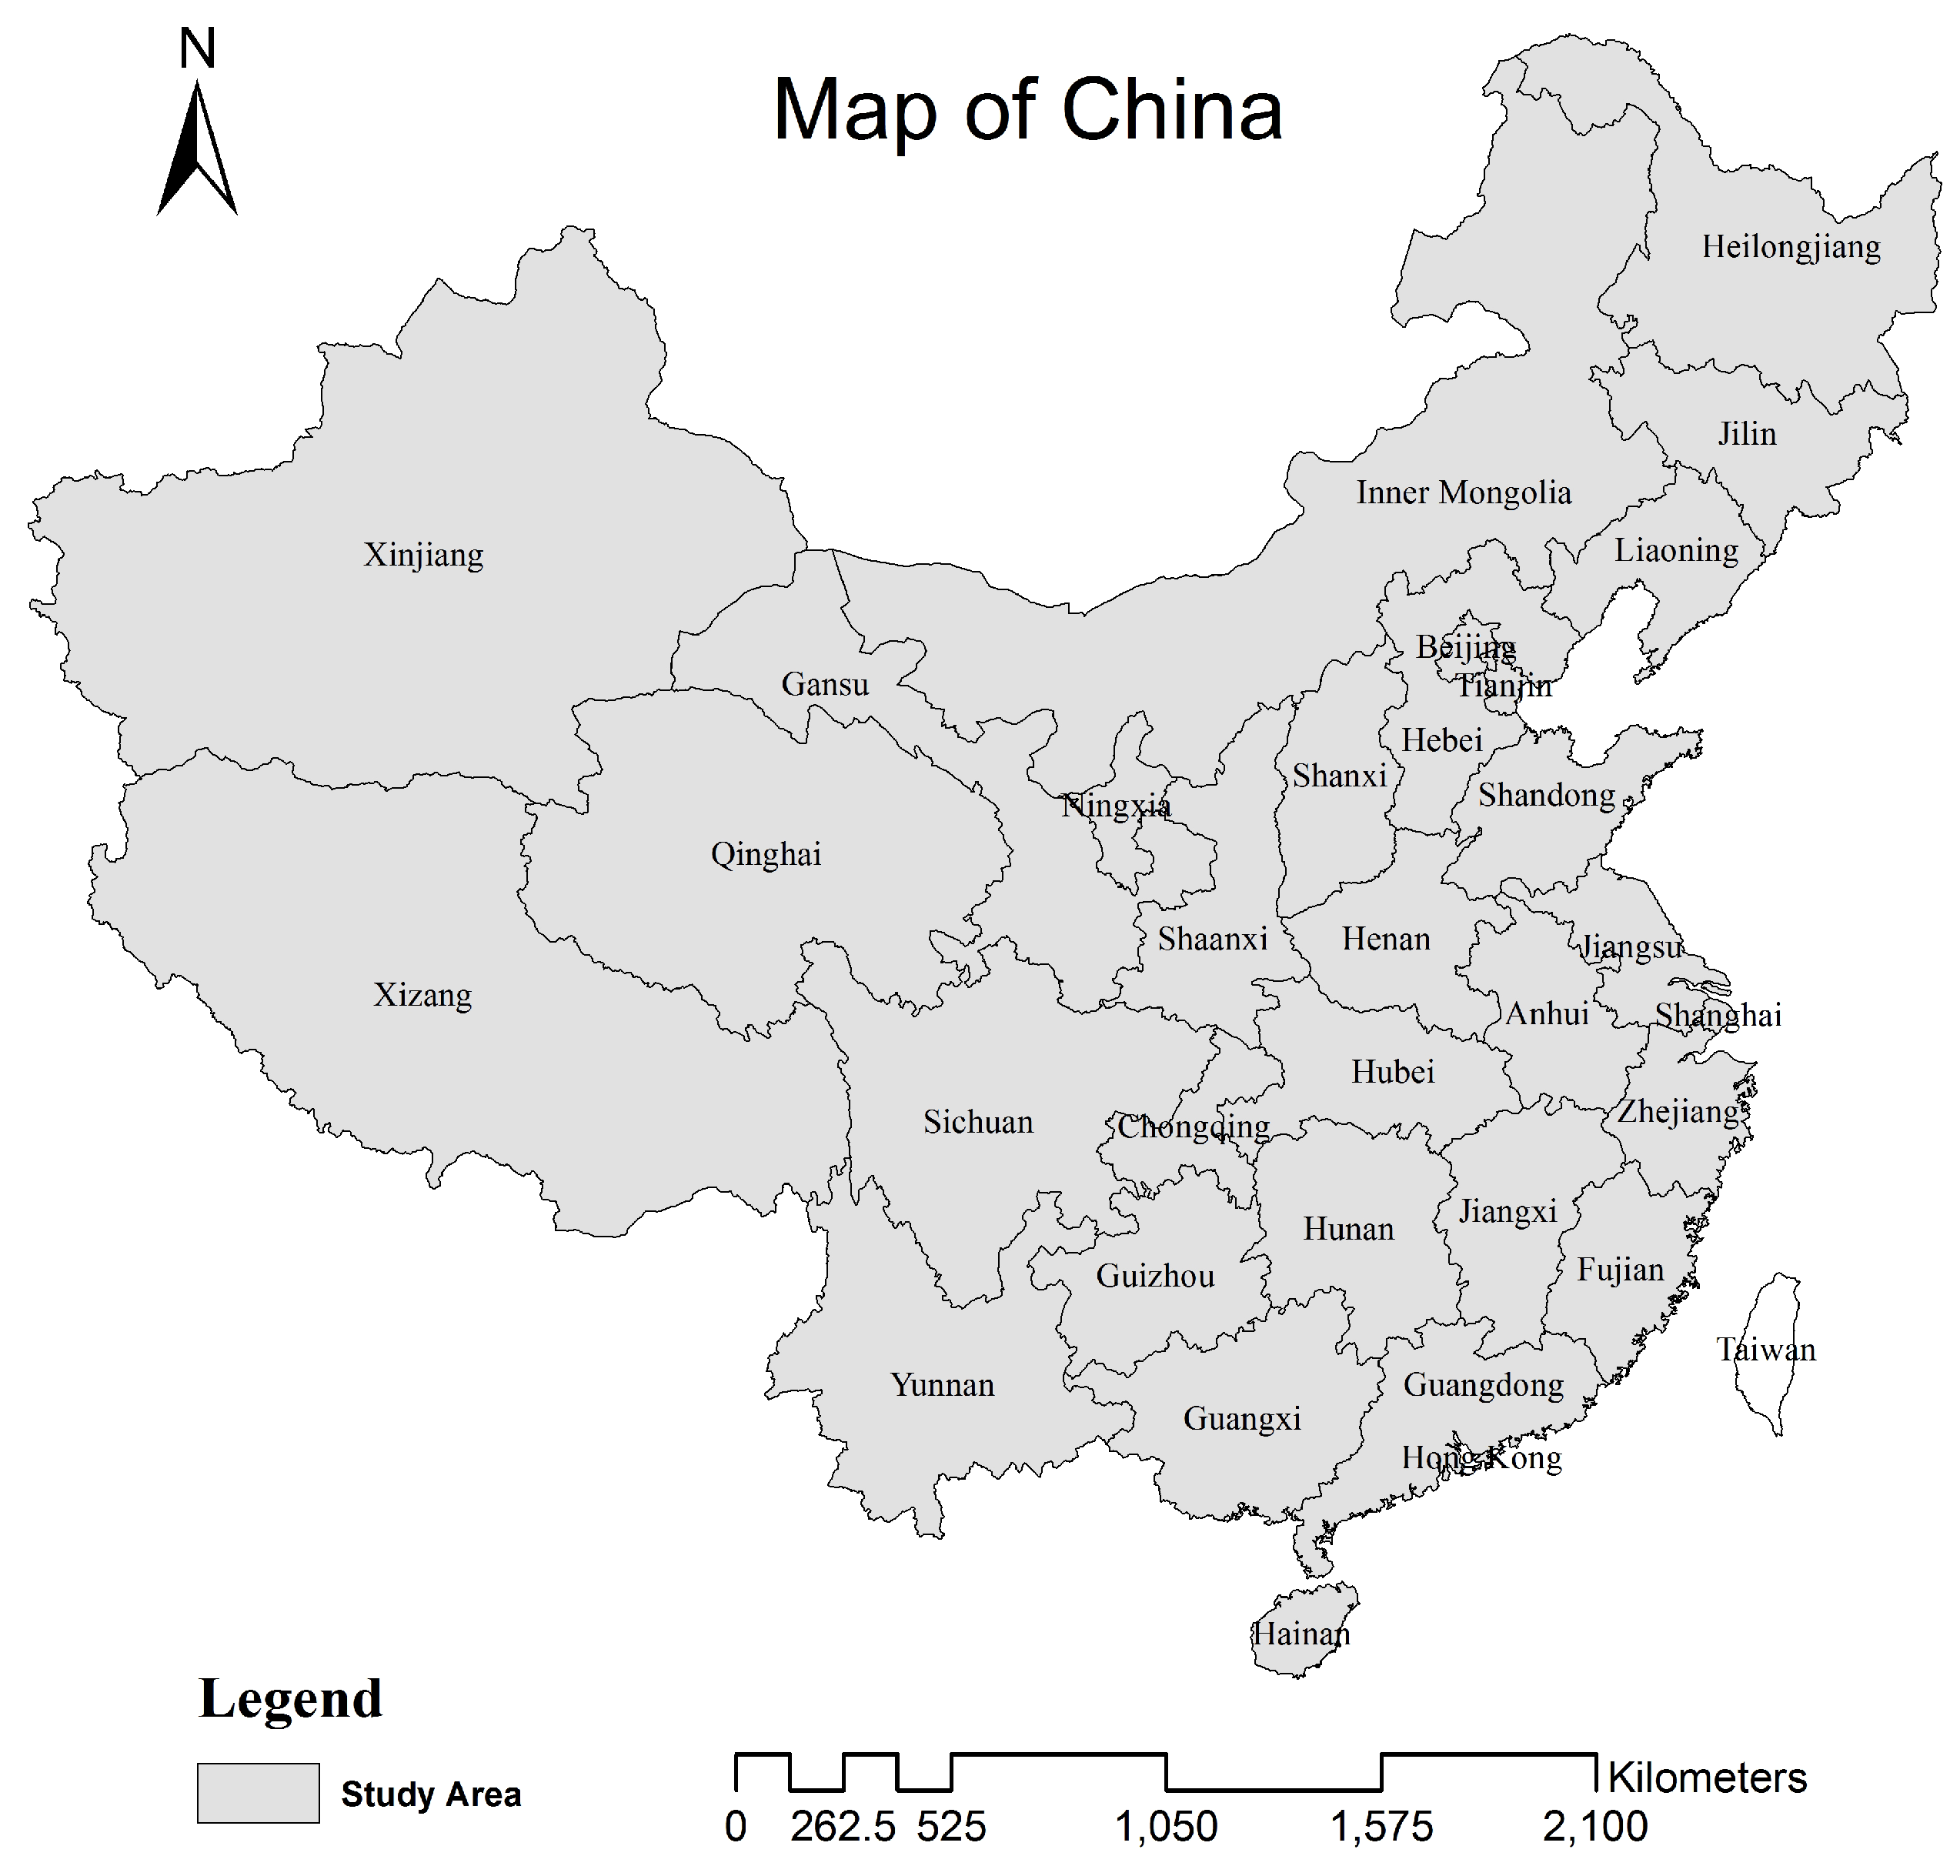
2.1. Study Area


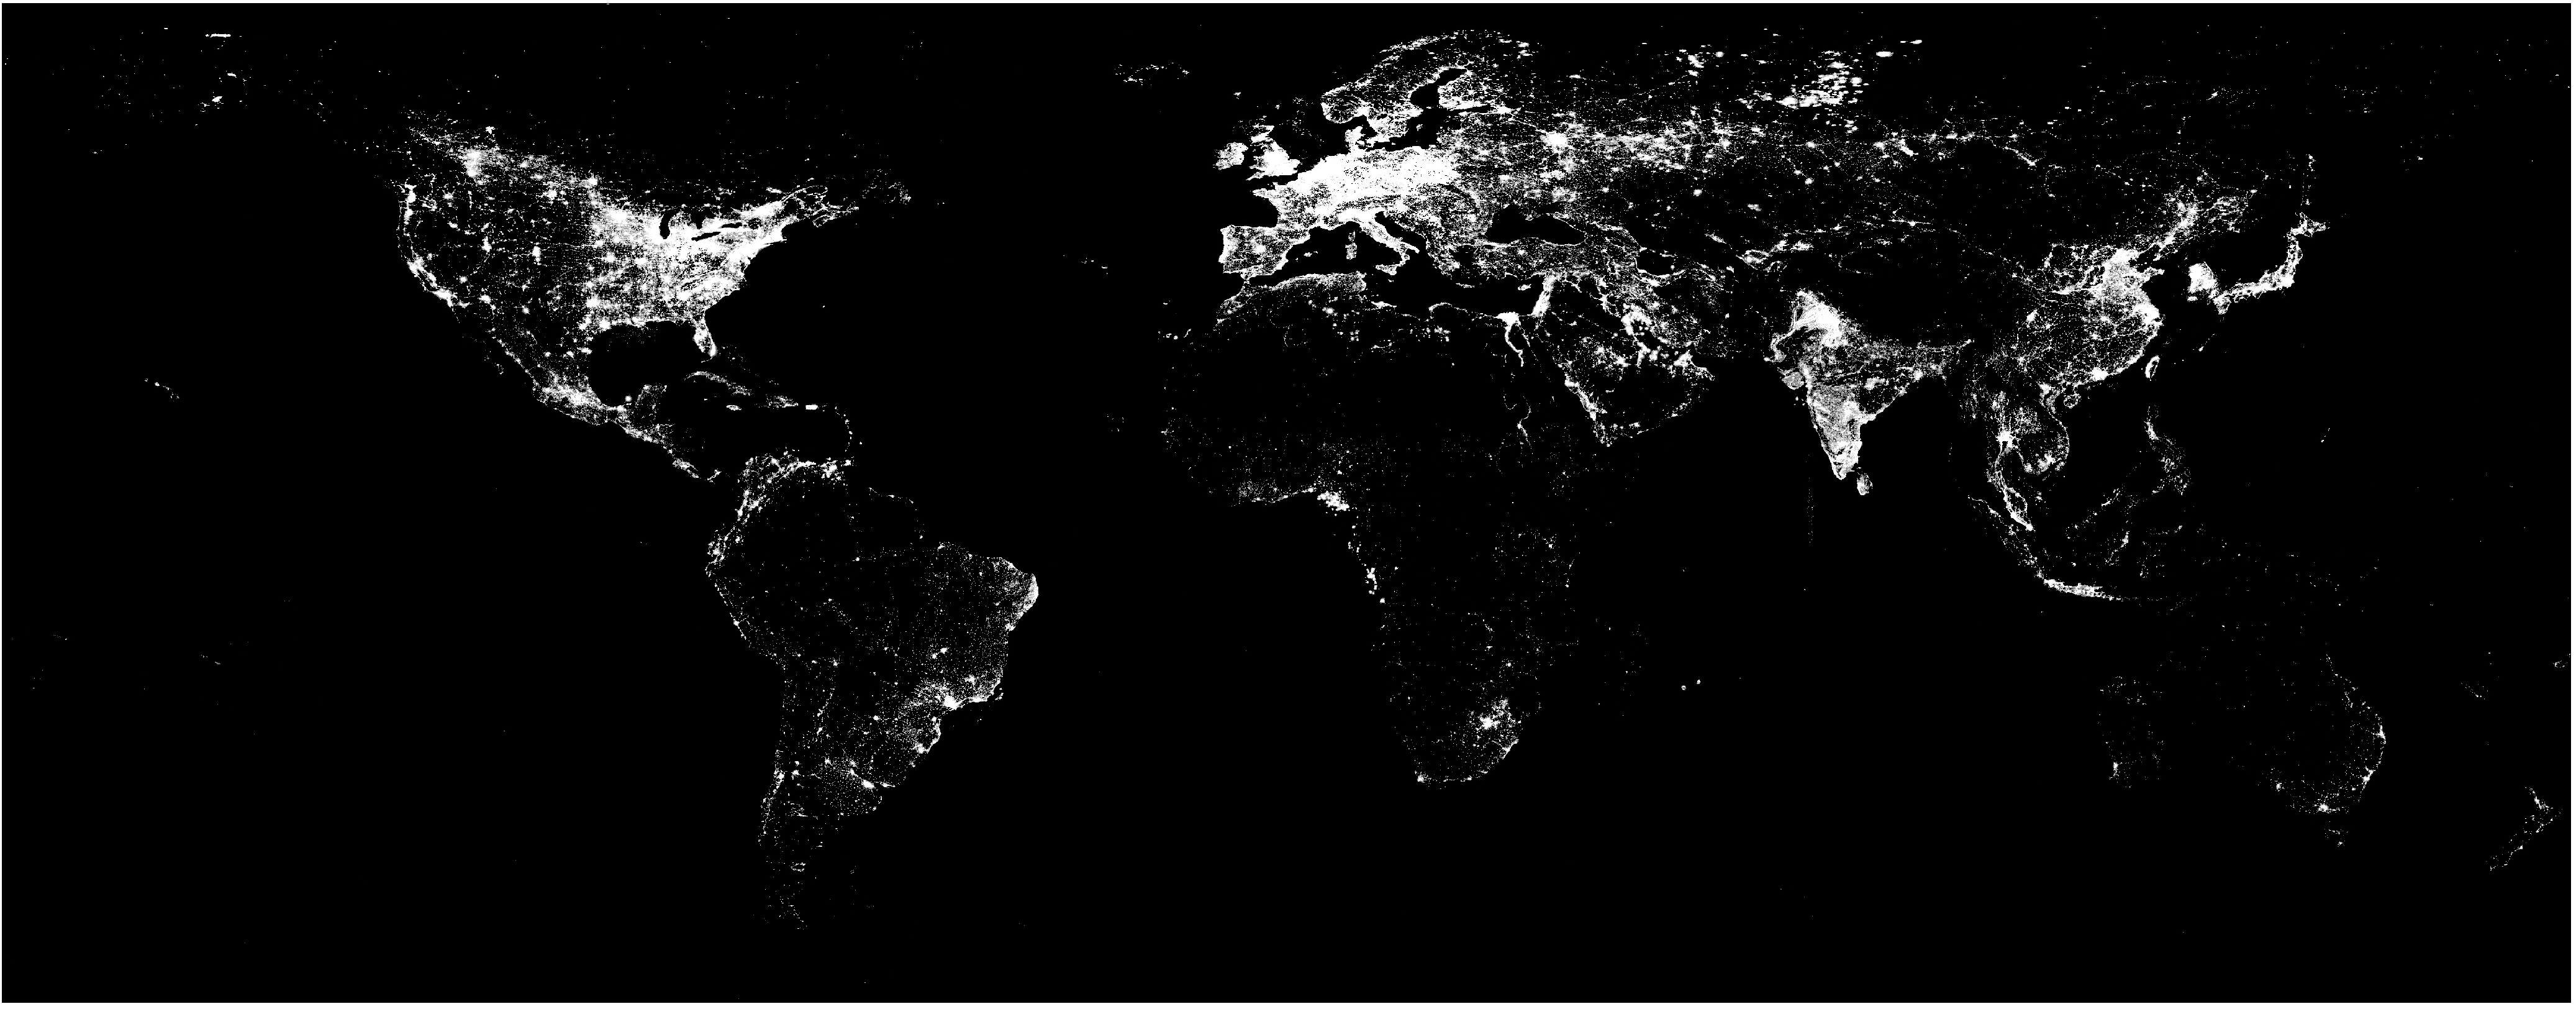
2.2. DMSP/OLS NTL Data

| Year | Satellite | |||
|---|---|---|---|---|
| 2000 | F14 | F15 | ||
| 2001 | F14 | F15 | ||
| 2002 | F14 | F15 | ||
| 2003 | F14 | F15 | ||
| 2004 | F15 | F16 | ||
| 2005 | F15 | F16 | ||
| 2006 | F15 | F16 | ||
| 2007 | F15 | F16 | ||
| 2008 | F16 | |||
| 2009 | F16 | |||
| 2010 | F18 | |||

2.3. Socioeconomic Statistical Data and Fundamental Geographic Data
2.4. DMSP/OLS NTL Data Pre-Processing

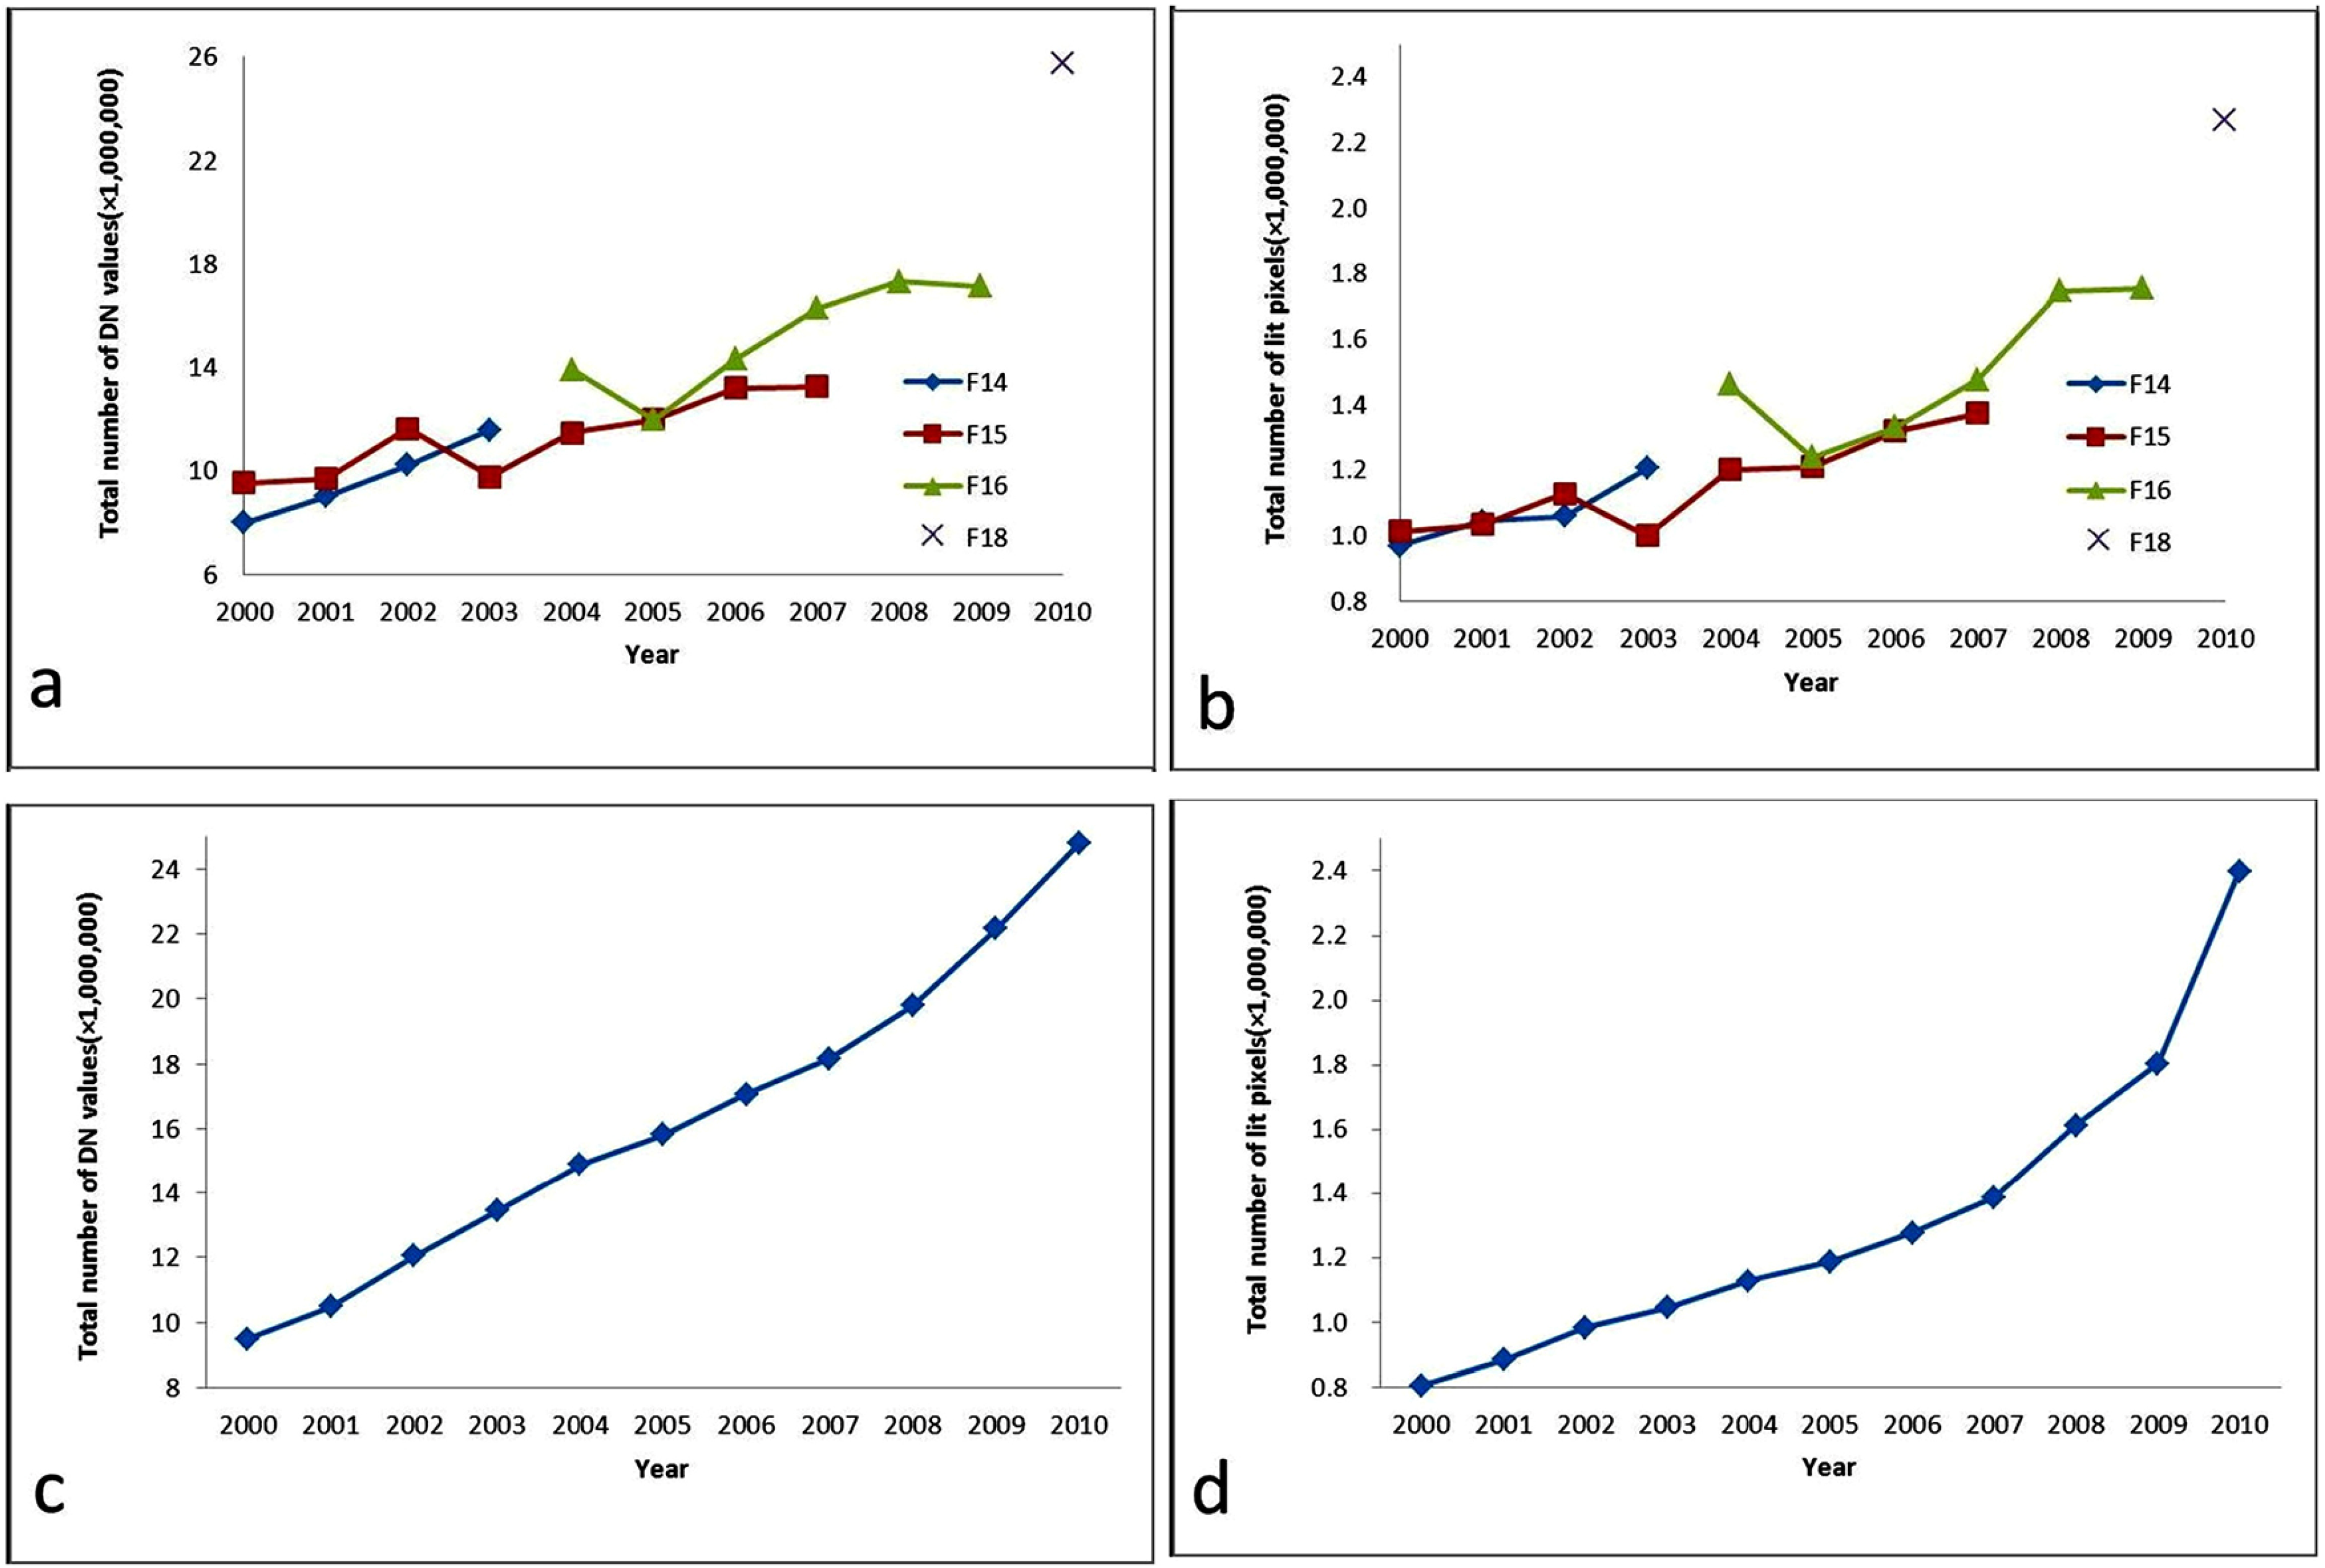
2.4.1. Inter-Calibration of Annual Composites
2.4.2. Intra-Annual Composition
2.4.3. Inter-Annual Corrections
2.5. Extraction of Built-Up Areas
2.6. Increment of Developed Pixels (IDP)
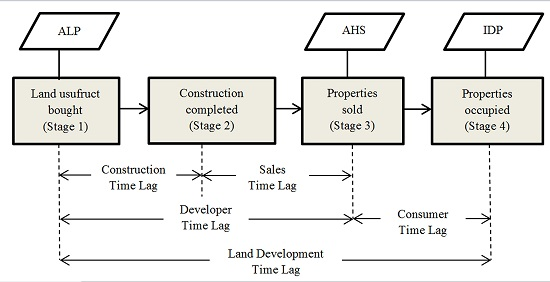
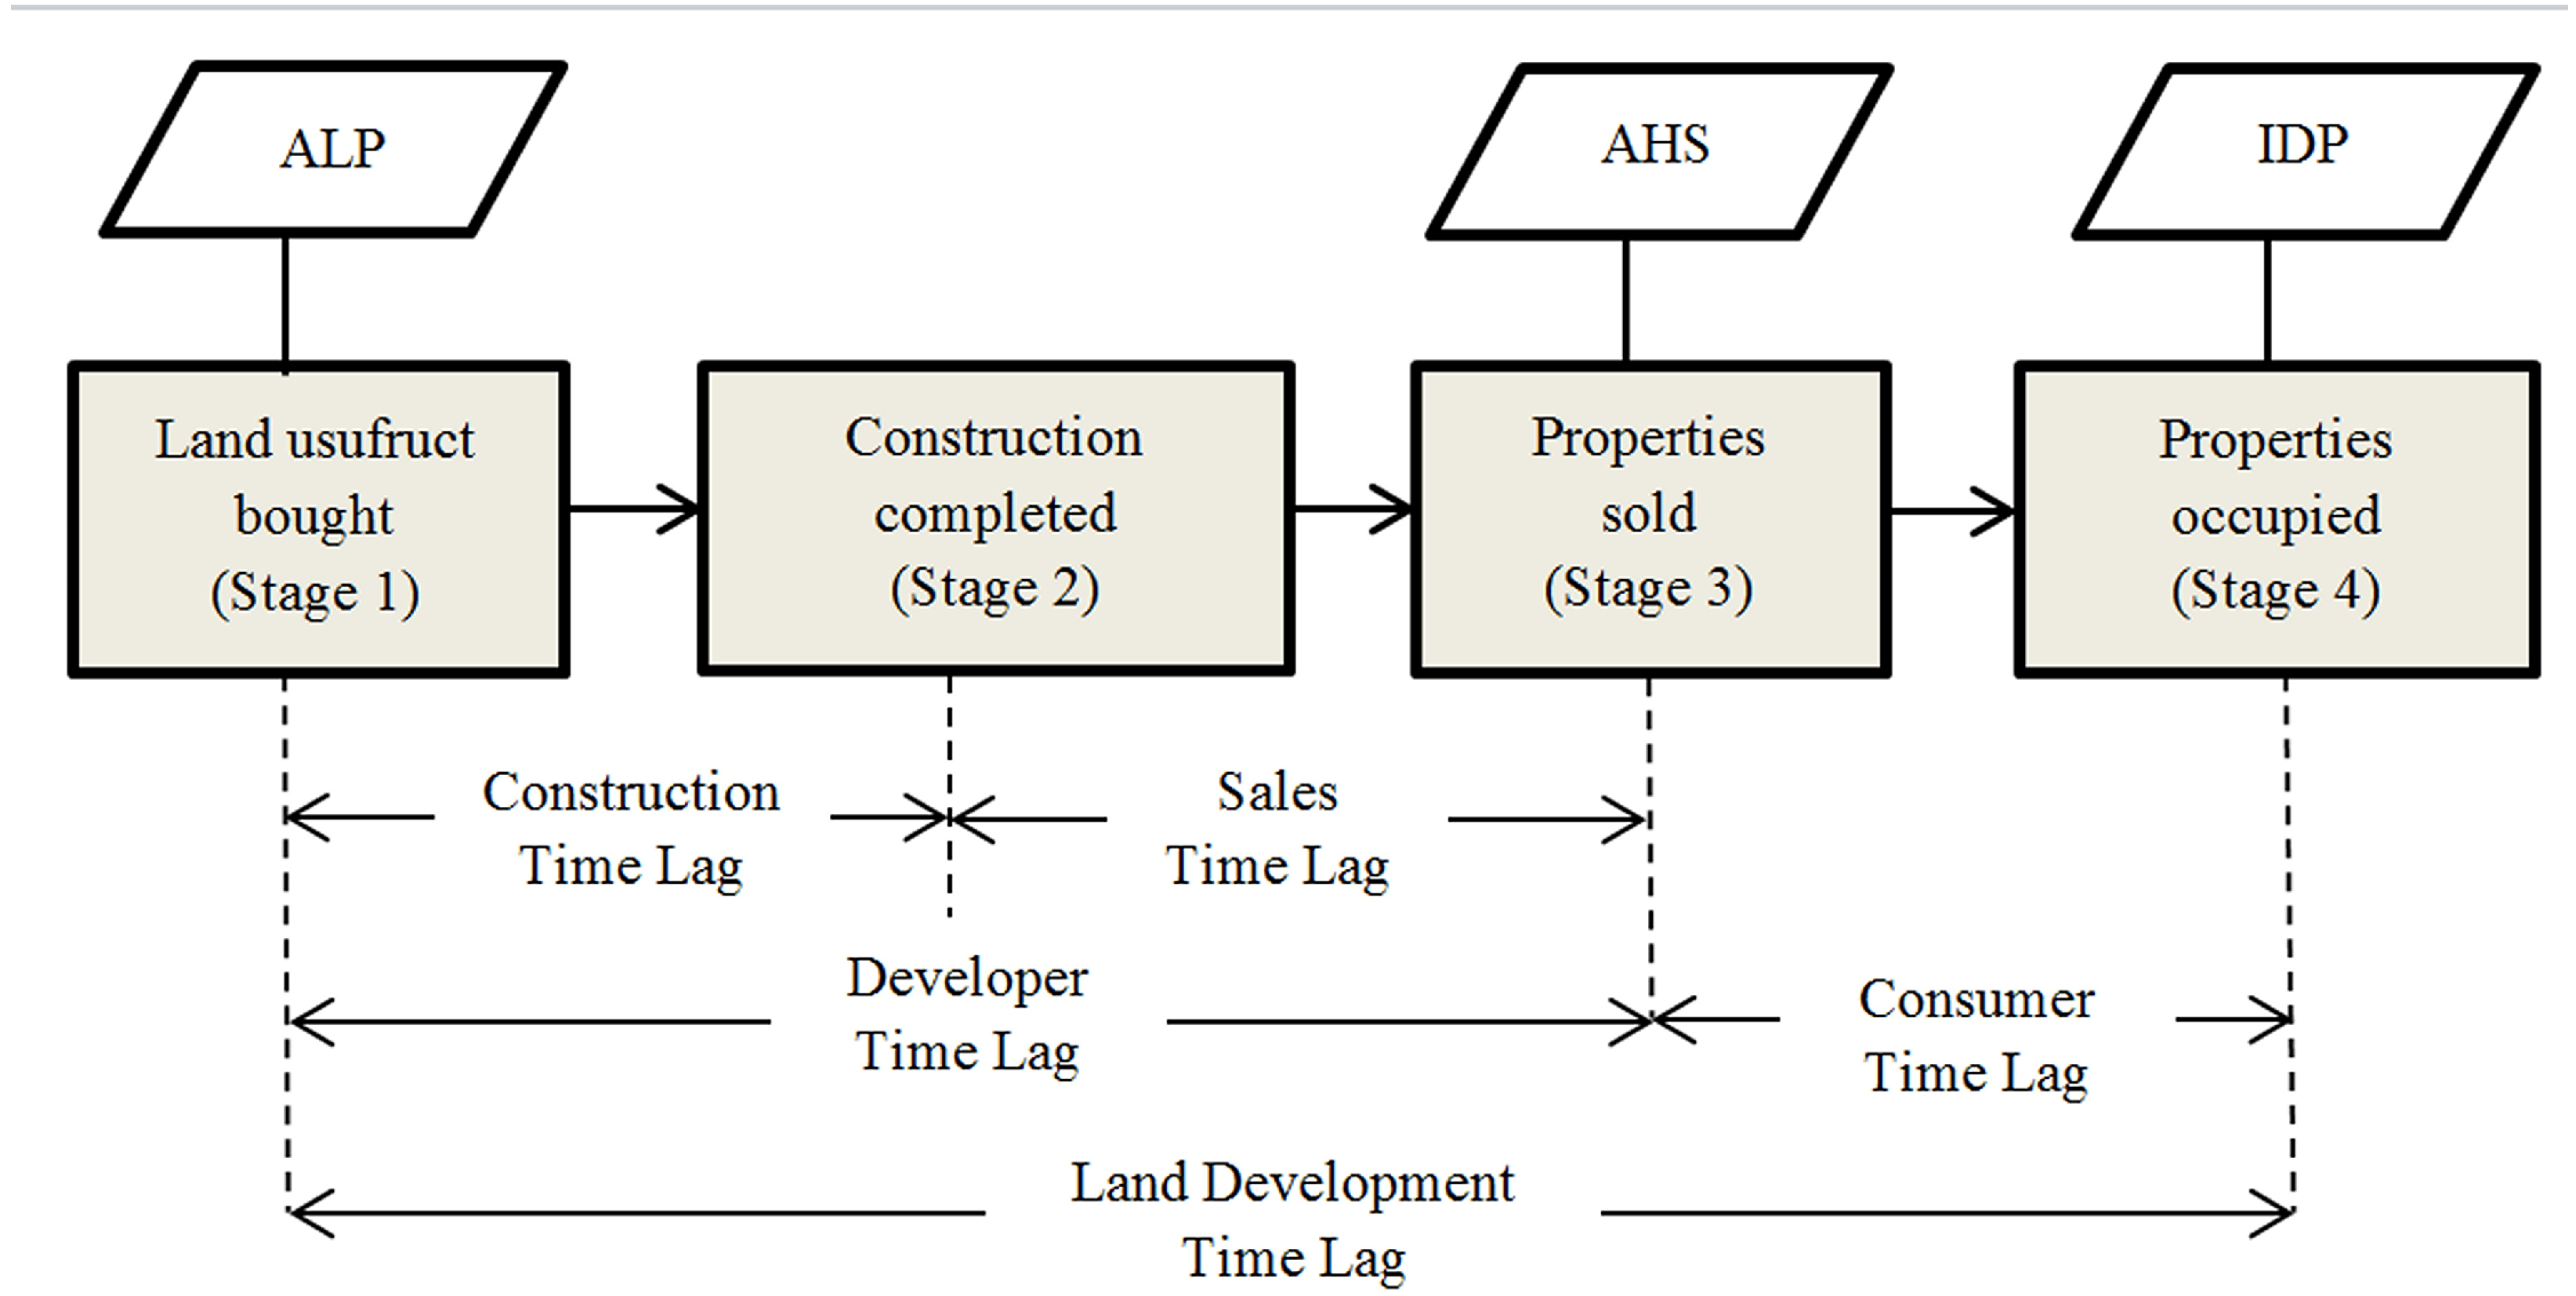
2.7. Estimation of Land Development Time Lags

2.8. Comprehensive Real Estate Price Index (CREPI)
3. Results
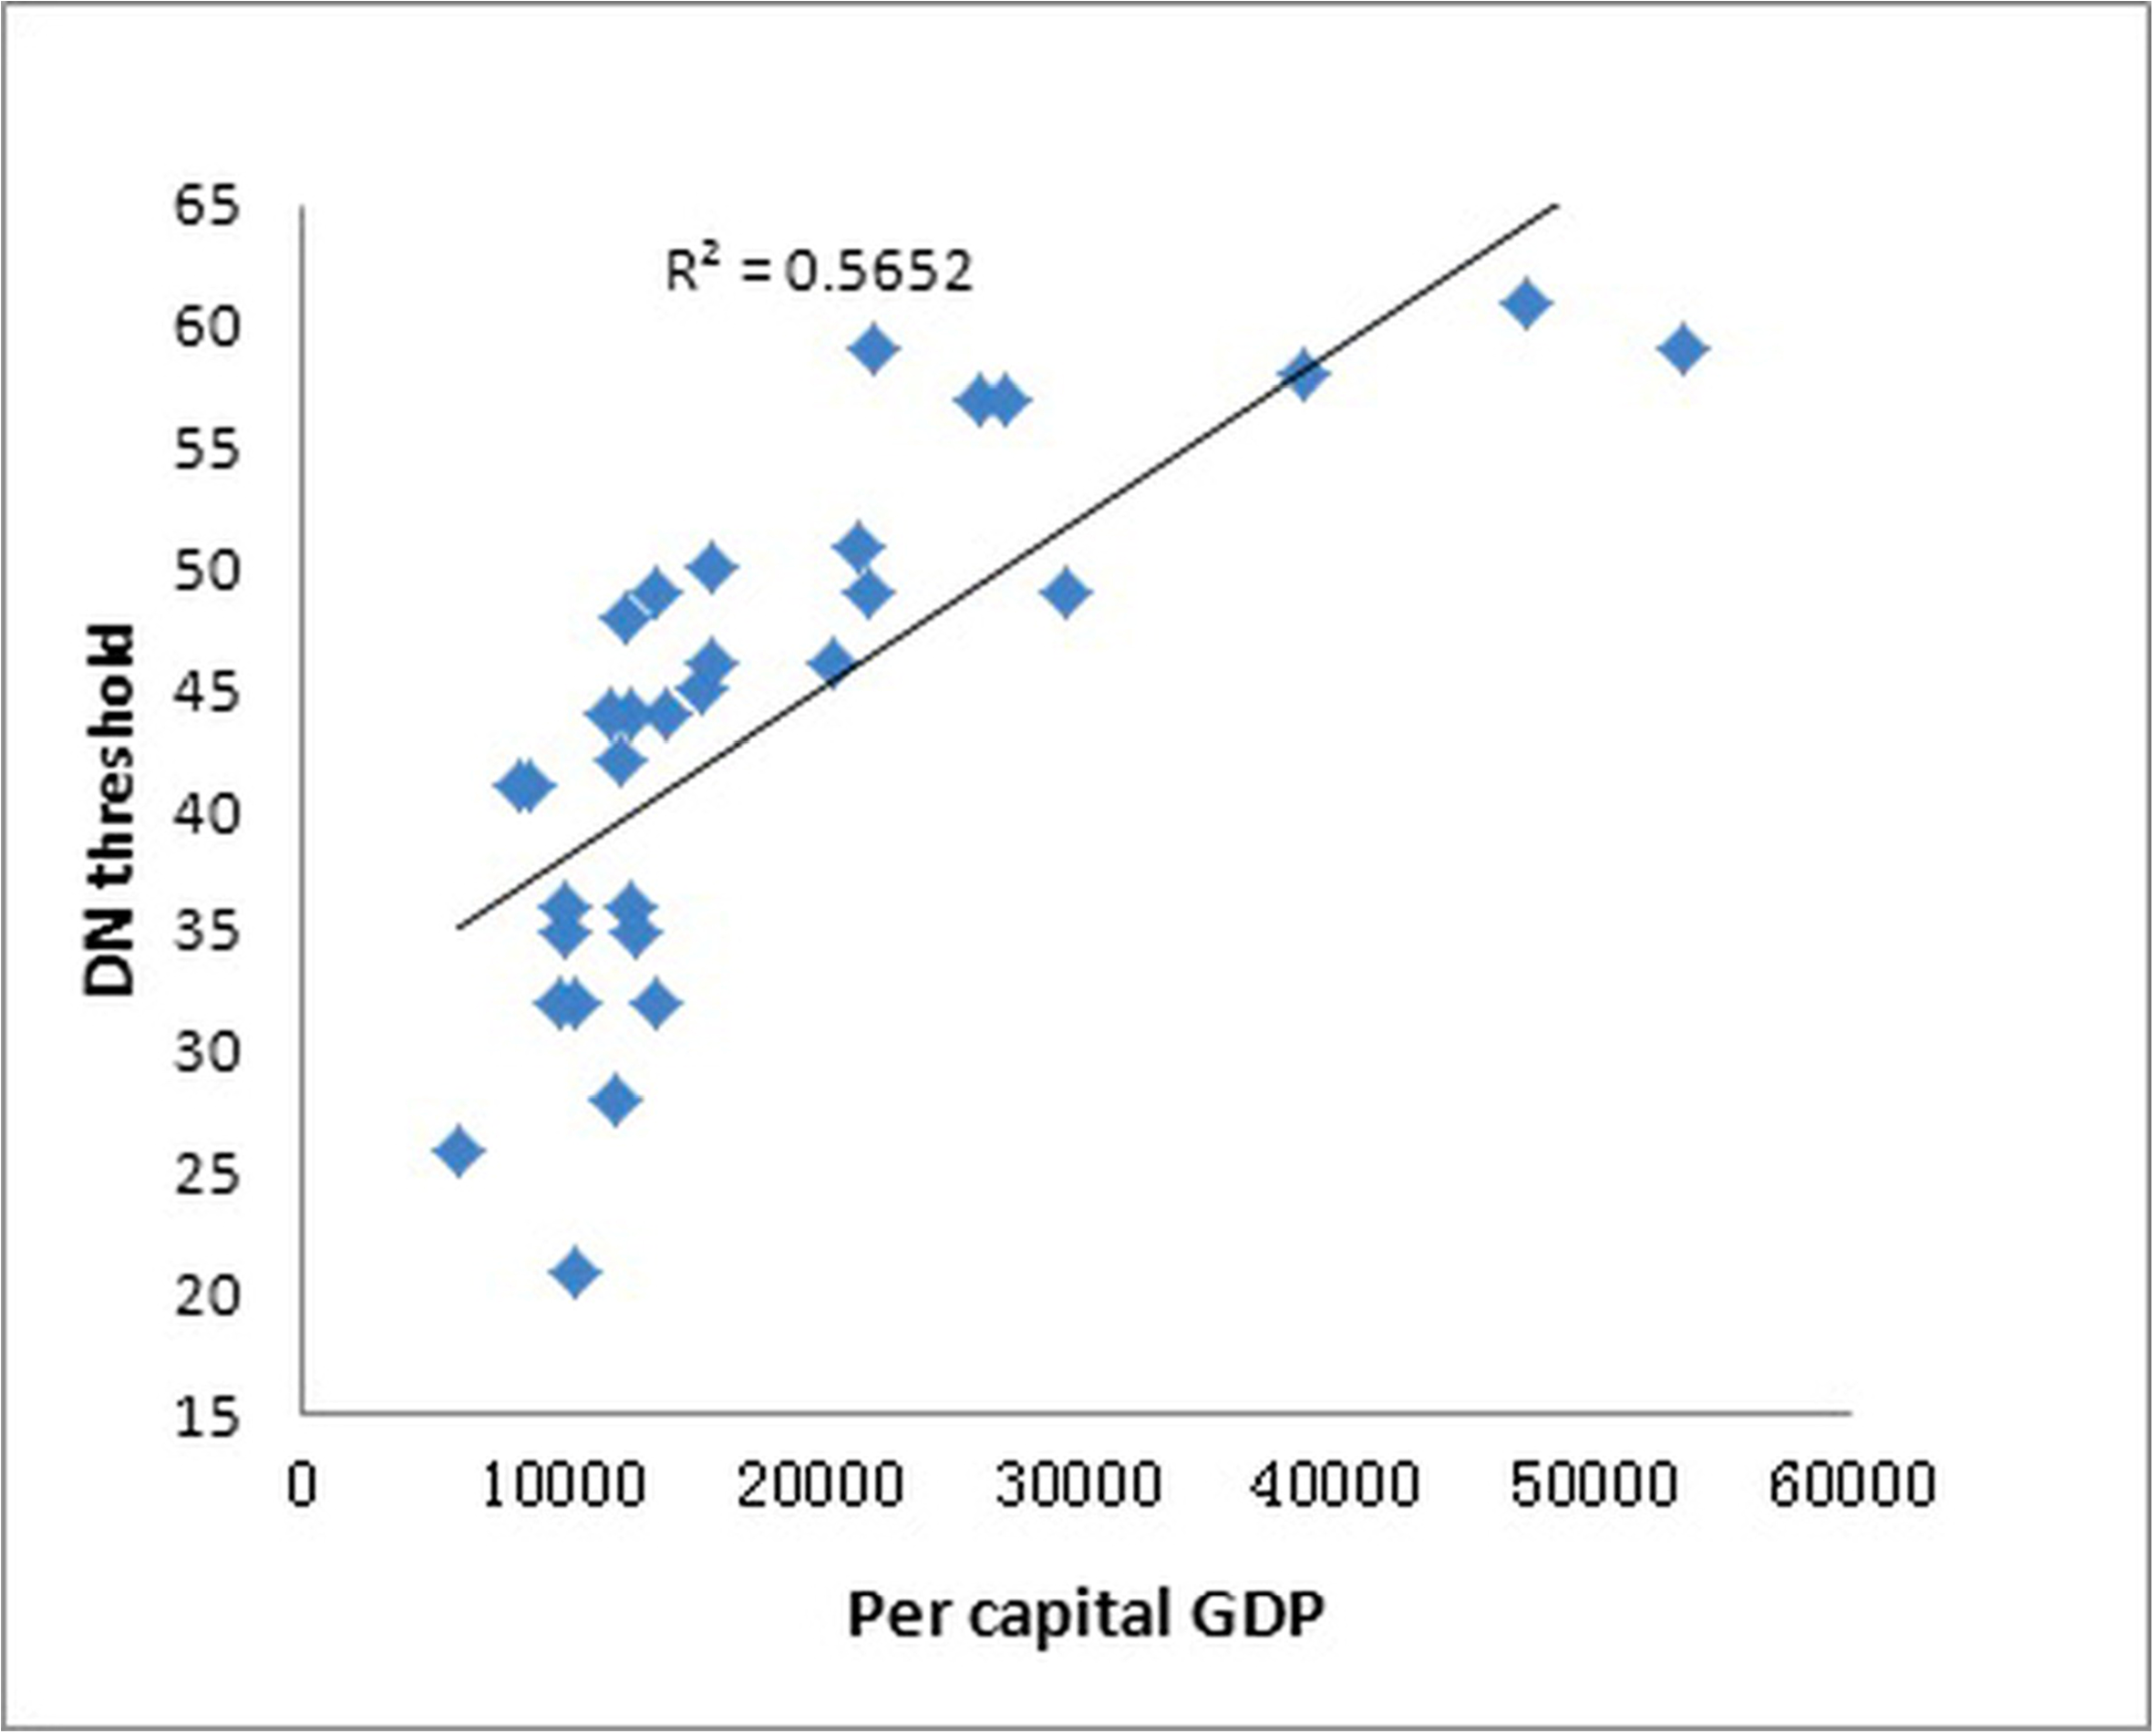
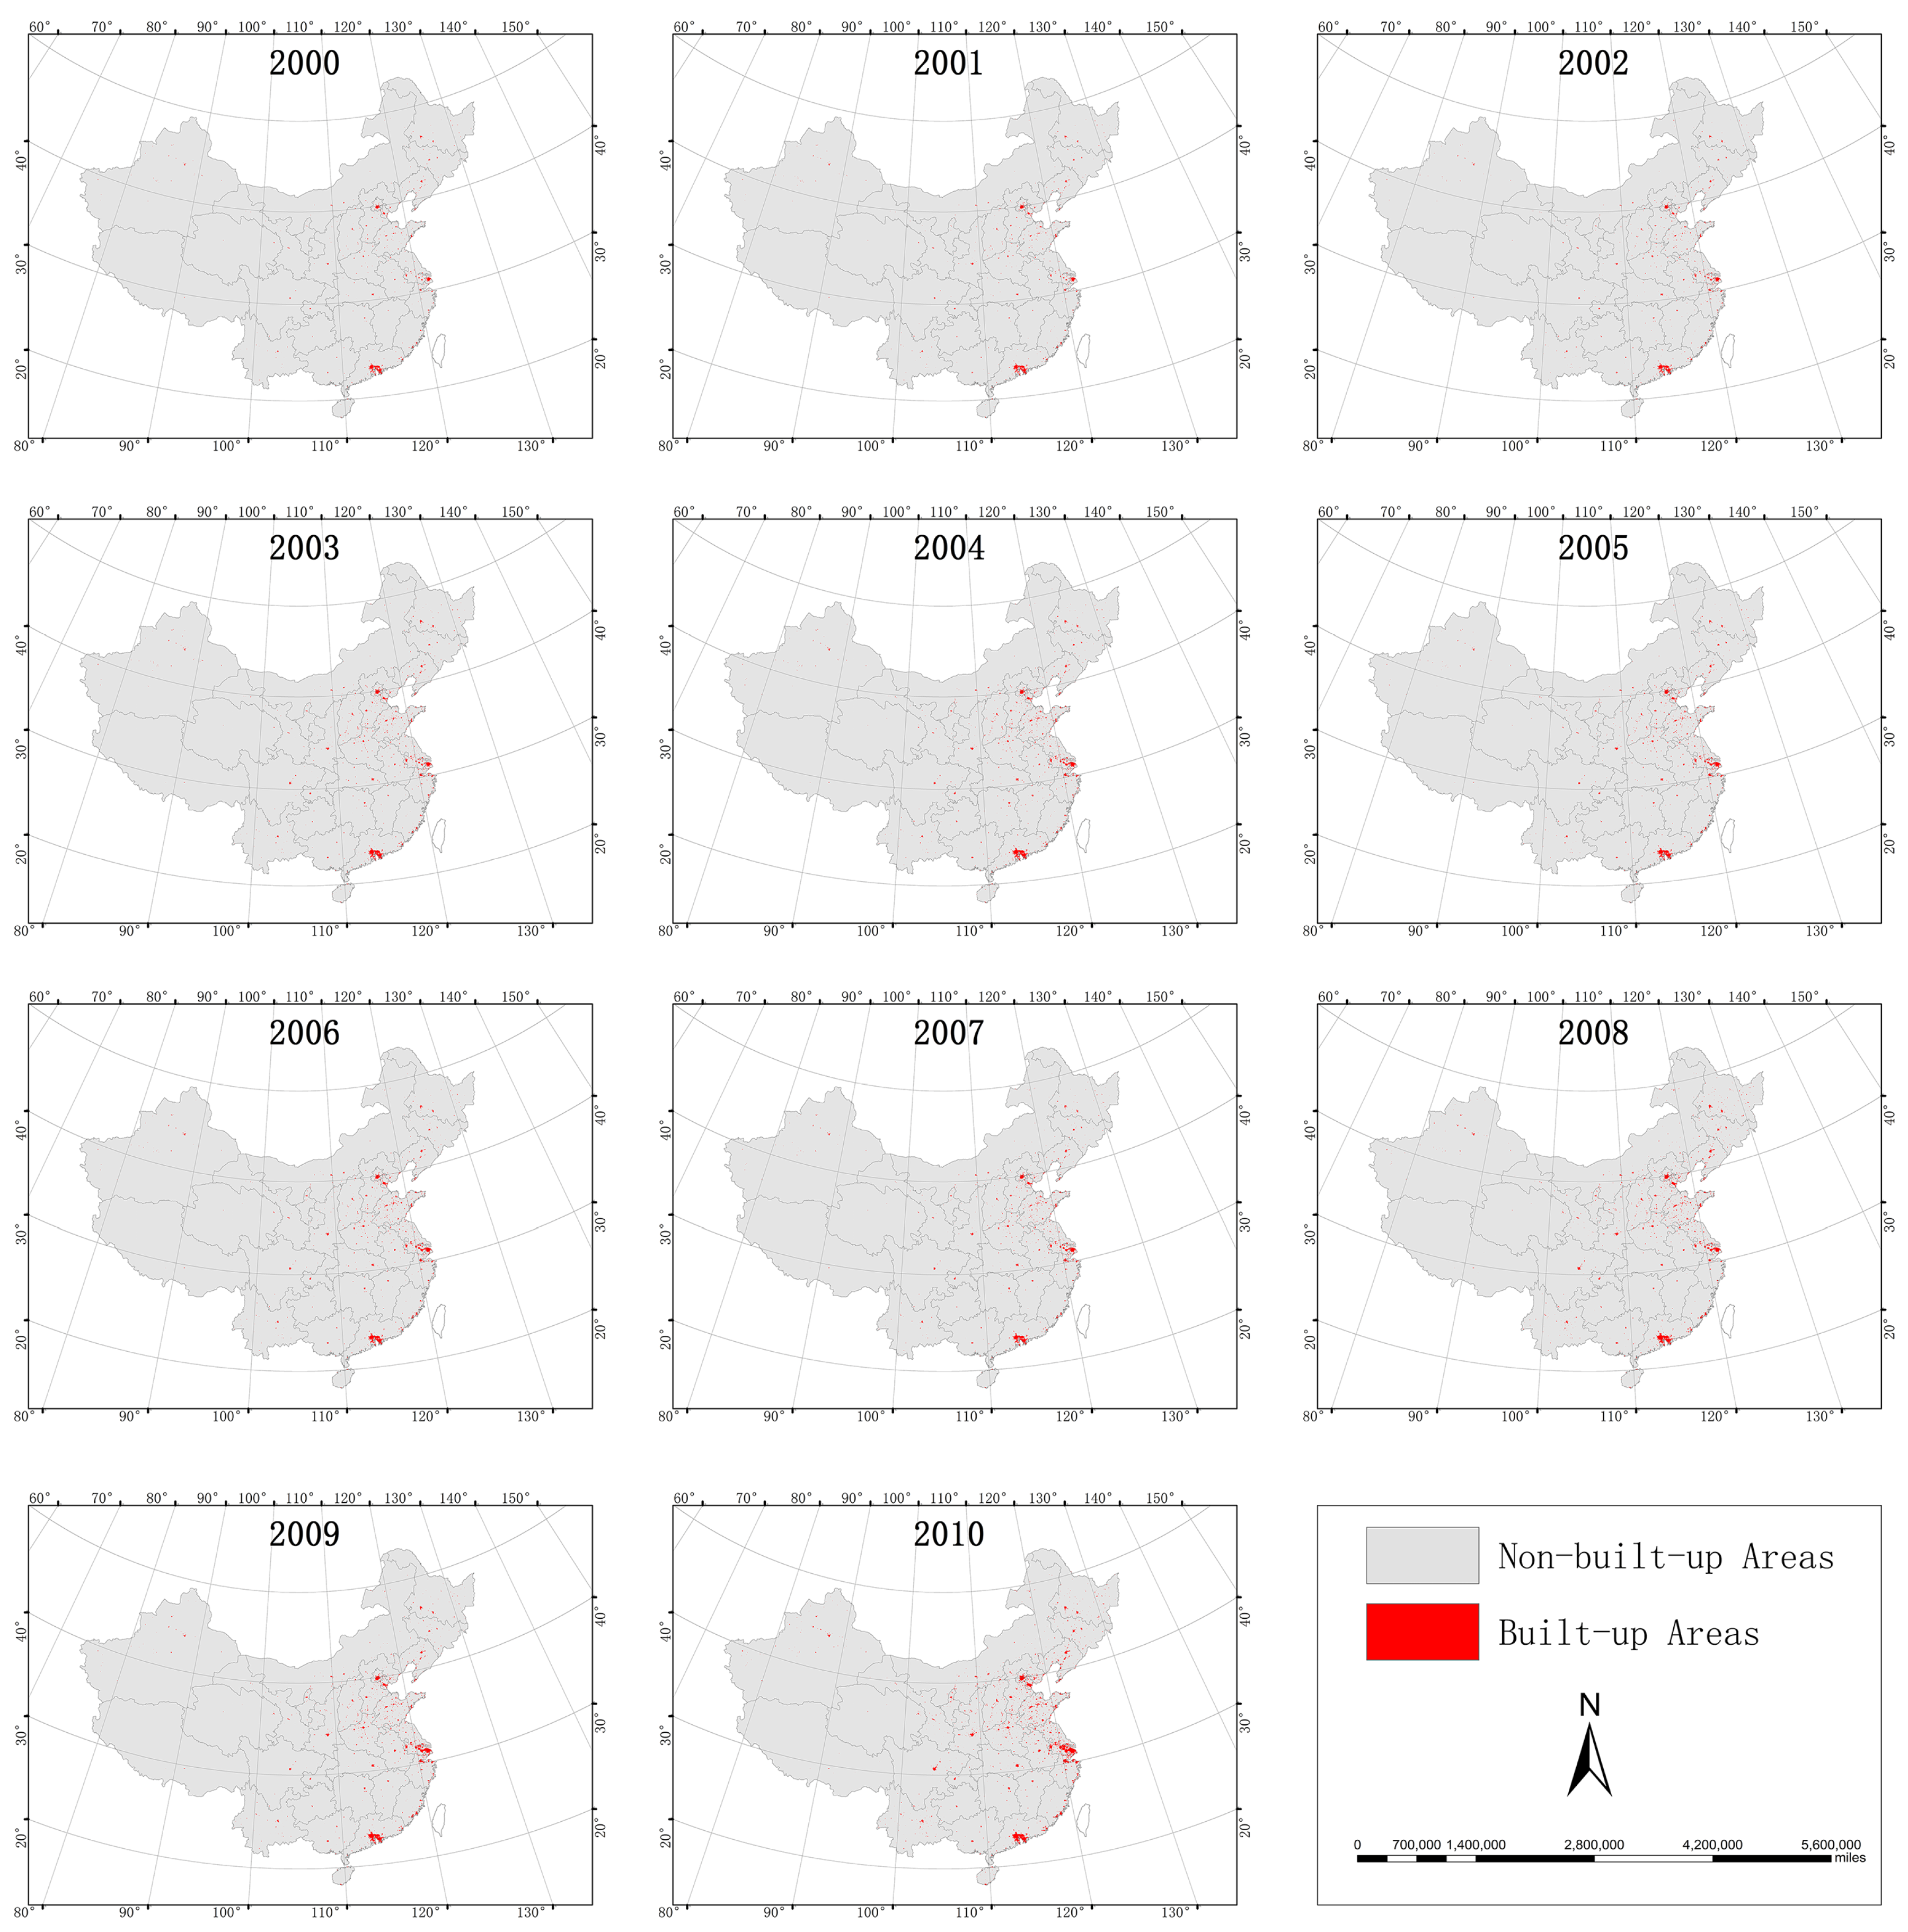
3.1. Extraction Thresholds and Maps of Built-up Areas
| Provinces | Threshold | Provinces | Threshold | Provinces | Threshold |
|---|---|---|---|---|---|
| Beijing | 61 | Ningxia | 48 | Hainan | 36 |
| Shanghai | 59 | Inner Mongolia | 46 | Anhui | 35 |
| Shandong | 59 | Jilin | 46 | Chongqing | 35 |
| Tianjin | 58 | Heilongjiang | 45 | Hubei | 32 |
| Jiangsu | 57 | Henan | 44 | Sichuan | 32 |
| Guangdong | 57 | Qinghai | 44 | Xizang | 32 |
| Fujian | 51 | Xinjiang | 44 | Hunan | 28 |
| Hebei | 50 | Shaanxi | 42 | Guizhou | 26 |
| Shanxi | 49 | Yunnan | 41 | Jiangxi | 21 |
| Liaoning | 49 | Gansu | 41 | ||
| Zhejiang | 49 | Guangxi | 36 |

3.2. Land Development Time Lags

| Provinces | Time Lags (l) | Developer Time Lags (ld) | Adjusted Time Lags (lad) | Max. Cross-Correlation Coefficient of ALP and IDP | Max. Cross-Correlation Coefficient of ALP and AHS | Per Capita GDP in 2000 (Chinese Yuan) |
|---|---|---|---|---|---|---|
| Anhui | 3 | 2 | 3 | 0.63 | 0.89 | 4779 |
| Beijing | 4 | 3 | 4 | 0.75 | 0.66 | 24,122 |
| Chongqing | 4 | 3 | 4 | 0.46 | 0.68 | 5616 |
| Fujian | 1 | 4 | 4 | 0.56 | 0.74 | 11,194 |
| Gansu | 2 | 3 | 3 | 0.77 | 0.77 | 4129 |
| Guangdong | 4 | 3 | 4 | 0.68 | 0.54 | 12,736 |
| Guangxi | 4 | 3 | 4 | 0.72 | 0.92 | 4652 |
| Guizhou | 3 | 3 | 3 | 0.65 | 0.71 | 2759 |
| Hainan | 4 | 2 | 4 | 0.97 | 0.77 | 6798 |
| Hebei | 2 | 2 | 2 | 0.79 | 0.94 | 7592 |
| Heilongjiang | 4 | 2 | 4 | 0.78 | 0.95 | 8294 |
| Henan | 1 | 2 | 2 | 0.26 | 0.93 | 5450 |
| Hubei | 0 | 5 | 5 | 0.53 | 0.59 | 6293 |
| Hunan | 4 | 2 | 4 | 0.51 | 0.73 | 5425 |
| Jiangsu | 4 | 2 | 4 | 0.63 | 0.61 | 11,765 |
| Jiangxi | 5 | 5 | 5 | 0.65 | 0.66 | 4851 |
| Jilin | 2 | 2 | 2 | 0.89 | 0.92 | 7351 |
| Liaoning | 2 | 2 | 2 | 0.87 | 0.93 | 11,177 |
| Inner Mongolia | 3 | 2 | 3 | 0.96 | 0.97 | 6502 |
| Ningxia | 0 | 0 | 0 | 0.81 | 0.78 | 5376 |
| Qinghai | 1 | 1 | 1 | 0.85 | 0.63 | 5138 |
| Shaanxi | 5 | 2 | 5 | 0.51 | 0.92 | 4968 |
| Shandong | 1 | 4 | 4 | 0.49 | 0.48 | 9555 |
| Shanghai | 5 | 3 | 5 | 0.76 | 0.5 | 30,047 |
| Shanxi | 5 | 2 | 5 | 0.75 | 0.92 | 5722 |
| Sichuan | 4 | 4 | 4 | 0.72 | 0.39 | 4956 |
| Tianjin | 5 | 3 | 5 | 0.51 | 0.85 | 17,353 |
| Xinjiang | 2 | 2 | 2 | 0.57 | 0.41 | 7372 |
| Xizang | 4 | 3 | 4 | 0.70 | 0.52 | 4572 |
| Yunnan | 2 | 2 | 2 | 0.71 | 0.91 | 4770 |
| Zhejiang | 0 | 5 | 5 | 0.70 | 0.13 | 13,416 |
3.3. Rate of Change in Housing/Land Price
| Provinces | RCHP | RCLP | Adjusted Time Lags | Provinces | RCHP | RCLP | Adjusted Time Lags |
|---|---|---|---|---|---|---|---|
| Zhejiang | 16.9% | 27.0% | 5 | Guangxi | 9.4% | 15.8% | 4 |
| Shanghai | 15.0% | 36.7% | 5 | Guangdong | 8.8% | 15.2% | 4 |
| Tianjin | 13.5% | 25.6% | 5 | Heilongjiang | 7.9% | 7.5% | 4 |
| Jiangxi | 12.7% | 22.1% | 5 | Anhui | 13.4% | 25.6% | 3 |
| Shaanxi | 12.0% | 26.2% | 5 | Inner Mongolia | 12.0% | 15.5% | 3 |
| Shanxi | 11.6% | 19.7% | 5 | Guizhou | 10.2% | 23.9% | 3 |
| Hubei | 10.6% | 27.2% | 5 | Yunnan | 6.1% | 15.2% | 3 |
| Hainan | 16.0% | 23.4% | 4 | Jilin | 10.0% | 24.0% | 2 |
| Beijing | 13.7% | 36.4% | 4 | Hebei | 9.3% | 14.7% | 2 |
| Jiangsu | 13.5% | 29.2% | 4 | Henan | 9.2% | 15.3% | 2 |
| Chongqing | 12.2% | 28.3% | 4 | Gansu | 8.9% | 15.8% | 2 |
| Sichuan | 11.9% | 28.3% | 4 | Liaoning | 8.1% | 17.8% | 2 |
| Fujian | 11.6% | 25.6% | 4 | Xinjiang | 8.0% | 10.8% | 2 |
| Hunan | 11.3% | 22.1% | 4 | Qinghai | 9.3% | 6.8% | 1 |
| Shandong | 10.7% | 27.4% | 4 | Ningxia | 9.3% | 5.7% | 0 |
| Xizang | 10.4% | 12.2% | 4 |
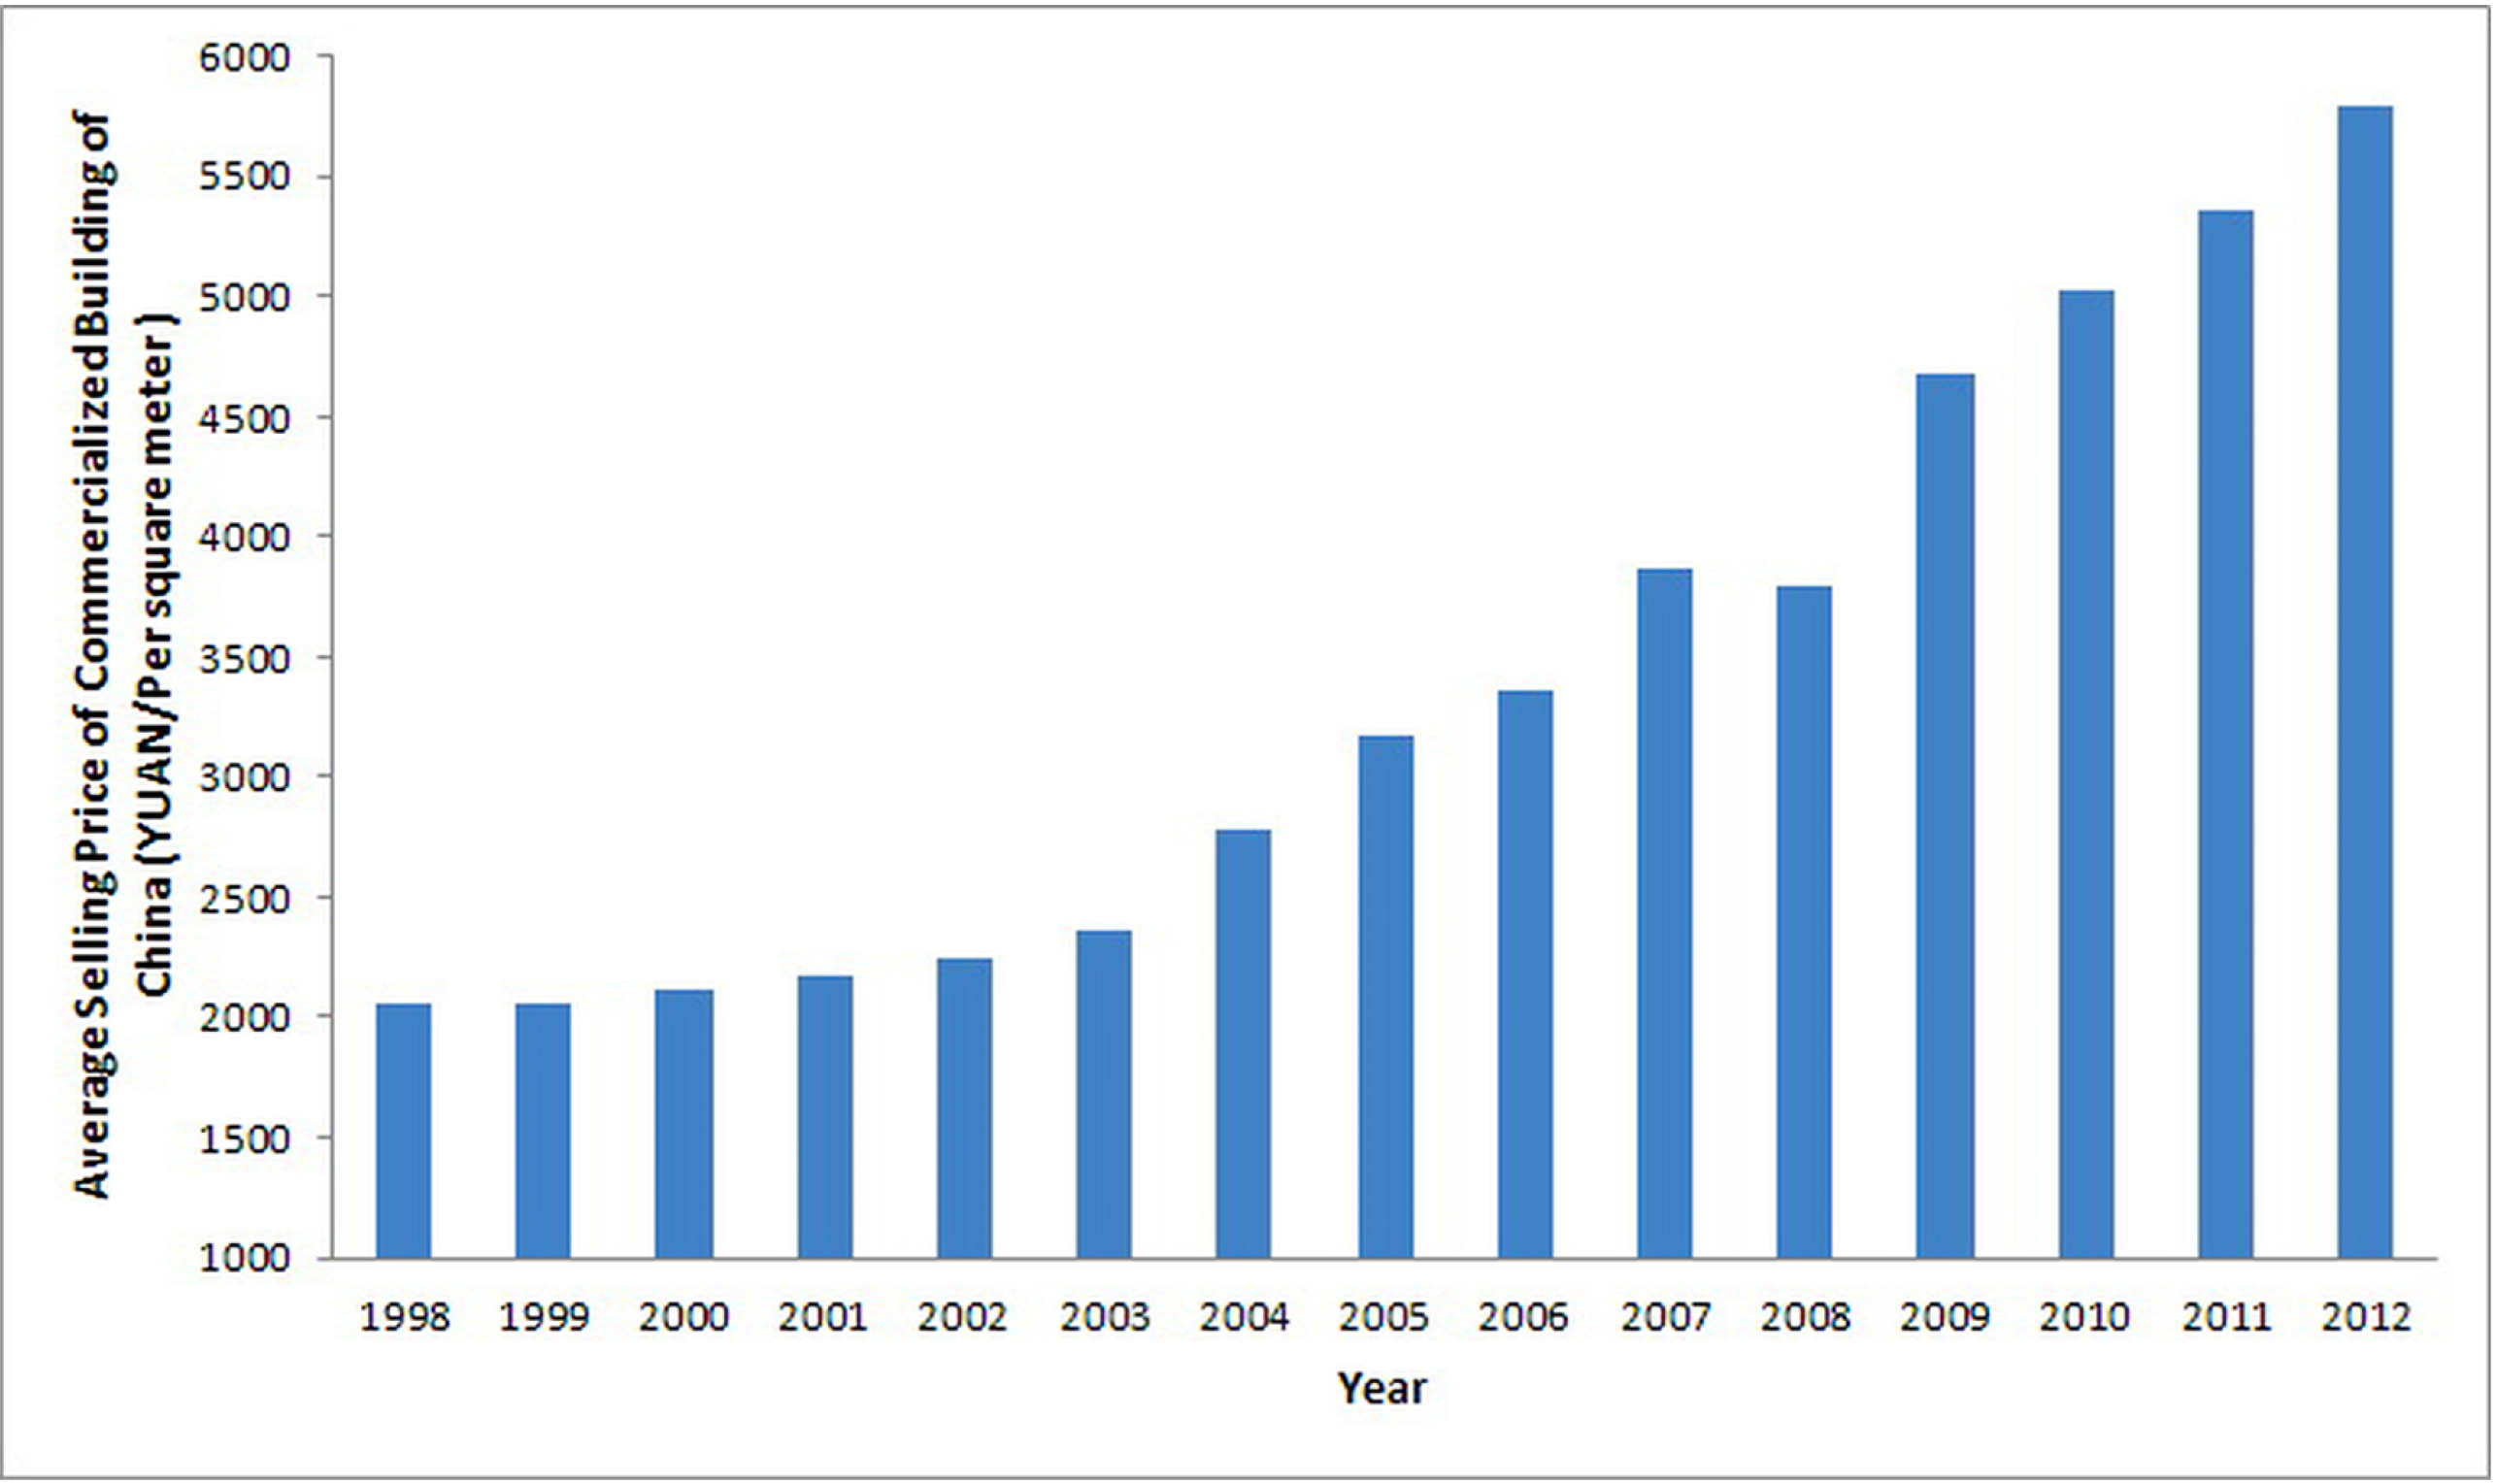
3.4. Comprehensive Real Estate Price Index (CREPI)
| Provinces | CREPI | Provinces | CREPI | Provinces | CREPI |
|---|---|---|---|---|---|
| Shanghai | 0.912 | Jiangxi | 0.570 | Hebei | 0.293 |
| Beijing | 0.847 | Shandong | 0.563 | Gansu | 0.293 |
| Zhejiang | 0.844 | Hubei | 0.555 | Liaoning | 0.288 |
| Hainan | 0.746 | Hunan | 0.505 | Guangdong | 0.275 |
| Jiangsu | 0.722 | Shanxi | 0.499 | Xinjiang | 0.170 |
| Tianjin | 0.664 | Guizhou | 0.483 | Qinghai | 0.166 |
| Anhui | 0.659 | Jilin | 0.476 | Yunnan | 0.153 |
| Chongqing | 0.647 | Inner Mongolia | 0.431 | Ningxia | 0.148 |
| Sichuan | 0.634 | Guangxi | 0.316 | Heilongjiang | 0.112 |
| Shaanxi | 0.585 | Xizang | 0.304 | ||
| Fujian | 0.576 | Henan | 0.298 |
4. Discussion
4.1. Built-Up Area Extraction
4.2. Land Development Time Lags and Developer Time Lags
4.3. Real Estate Pricing, CREPI, and Time Lags
4.4. Maximum Profit—Common Driving Force behind Land Banking
4.5. Uncertainty and Validation
5. Conclusions
Acknowledgments
Author Contributions
Conflicts of Interest
References
- Hui, E.C.M.; Liang, C.; Wang, Z.; Song, B.; Gu, Q. Real estate bubbles in China: A tale of two cities. Constr. Manag. Econ. 2012, 30, 951–961. [Google Scholar] [CrossRef]
- Chen, P. Mitigating Real Estate Presale Problems in China; University of Calgary: Calgary, AB, Cananda, 2007. [Google Scholar]
- Zhang, H. Effects of urban land supply policy on real estate in China: An econometric analysis. J. Real Estate Lit. 2008, 16, 55–72. [Google Scholar]
- Zhu, H.B. Analysis of the reason, harm and countermeasure of real estate developer regrating land. Guangdong Land Sci. 2011, 10, 45–48. (In Chinese) [Google Scholar]
- White, P. Land availability, land banking and the price of land for housing: A review of recent debates. Land Dev. Stud. 1986, 3, 101–111. [Google Scholar] [CrossRef]
- Keuschnigg, C.; Nielsen, S.B. Housing markets and vacant land. J. Econ. Dyn. Control 1996, 20, 1731–1762. [Google Scholar] [CrossRef]
- Raymond, Y.C. Housing price, land supply and revenue from land sales. Urban Stud. 1998, 35, 1377–1392. [Google Scholar] [CrossRef]
- Clapp, J.M.; Bardos, K.S.; Wong, S.K. Empirical estimation of the option premium for residential redevelopment. Reg. Sci. Urban Econ. 2012, 42, 240–256. [Google Scholar] [CrossRef]
- Wang, W.; Cheng, H.; Zhang, L. Poverty assessment using DMSP/OLS night-time light satellite imagery at a provincial scale in China. Adv. Space Res. 2012, 49, 1253–1264. [Google Scholar] [CrossRef]
- Doll, C.N. CIESIN Thematic Guide to Night-time Light Remote Sensing and its Applications; Center for International Earth Science Information Network of Columbia University: Palisades, NY, USA, 2008. [Google Scholar]
- Amaral, S.; Monteiro, A.M.; Câmara, G.; Quintanilha, J.A. DMSP/OLS night-time light imagery for urban population estimates in the Brazilian Amazon. Int. J. Remote Sens. 2006, 27, 855–870. [Google Scholar] [CrossRef]
- Elvidge, C.D.; Erwin, E.H.; Baugh, K.E.; Ziskin, D.; Tuttle, B.T.; Ghosh, T.; Sutton, P.C. Overview of DMSP nightime lights and future possibilities. In Proceedings of the 2009 IEEE Joint Urban Remote Sensing Event, Shanghai, China, 20–22 May 2009.
- Lo, C.P. Modeling the population of China using DMSP operational linescan system nighttime data. Photo Gramm. Eng. Remote Sens. 2001, 67, 1037–1047. [Google Scholar]
- Elvidge, C.D.; Ziskin, D.; Baugh, K.E.; Tuttle, B.T.; Ghosh, T.; Pank, D.W.; Erwin, E.H.; Zhizhin, W. A fifteen year record of global natural gas flaring derived from satellite data. Energies 2009, 2, 595–622. [Google Scholar] [CrossRef]
- Sutton, P.C.; Taylor, M.J.; Elvidge, C.D. Using DMSP OLS imagery to characterize urban populations in developed and developing countries. In Remote Sensing of Urban and Suburban Areas; Rashed, T., Jürgens, C., Eds.; Springer: Berlin, Germany, 2010; pp. 329–348. [Google Scholar]
- Roychowdhury, K.; Jones, S.D.; Arrowsmith, C.; Reinke, K. A comparison of high and low gain DMSP/OLS satellite images for the study of socio-economic metrics. IEEE J. Sel. Top. Appl. Earth Observ. Remote Sens. 2011, 4, 35–42. [Google Scholar] [CrossRef]
- Sutton, P.C. Modeling population density with night-time satellite imagery and GIS. Comput. Environ. Urban Syst. 1997, 21, 227–244. [Google Scholar] [CrossRef]
- Chand, T.K.; Badarinath, K.V.S.; Elvidge, C.D.; Tuttle, B.T. Spatial characterization of electrical power consumption patterns over India using temporal DMSP-OLS night-time satellite data. Int. J. Remote Sens. 2009, 30, 647–661. [Google Scholar] [CrossRef]
- Elvidge, C.D.; Baugh, K.E.; Kihn, E.A.; Kroehl, H.W.; Davis, E.R.; Davis, C.W. Relation between satellite observed visible-near infrared emissions, population, economic activity and electric power consumption. Int. J. Remote Sens. 1997, 18, 1373–1379. [Google Scholar] [CrossRef]
- Gallaway, T.; Olsen, R.N.; Mitchell, D.M. The economics of global light pollution. Ecol. Econ. 2010, 69, 658–665. [Google Scholar] [CrossRef]
- Elvidge, C.D.; Hobson, V.R.; Baugh, K.E.; Dietz, J.B.; Shimabukuro, Y.E.; Krug, T.; Krug, T.; Novo, E.M.L.M.; Echavarria, F.R. DMSP-OLS estimation of tropical forest area impacted by surface fires in Roraima, Brazil: 1995 versus 1998. Int. J. Remote Sens. 2001, 22, 2661–2673. [Google Scholar] [CrossRef]
- Chand, T.K.; Badarinath, K.V.S.; Murthy, M.S.R.; Rajshekhar, G.; Elvidge, C.D.; Tuttle, B.T. Active forest fire monitoring in Uttaranchal State, India using multi-temporal DMSP-OLS and MODIS data. Int. J. Remote Sens. 2007, 28, 2123–2132. [Google Scholar] [CrossRef]
- Fuller, D.O.; Fulk, M. Comparison of NOAA-AVHRR and DMSP-OLS for operational fire monitoring in Kalimantan, Indonesia. Int. J. Remote Sens. 2000, 21, 181–187. [Google Scholar] [CrossRef]
- Standley, A.P. The use of coincident DMSP SSM/I and OLS satellite data to improve snow cover detection and discrimination. Int. J. Remote Sens. 1999, 20, 285–305. [Google Scholar] [CrossRef]
- Witmer, F.D.; O’Loughlin, J. Detecting the effects of wars in the Caucasus regions of Russia and Georgia using radiometrically normalized DMSP-OLS nighttime lights imagery. GISci. Remote Sens. 2011, 48, 478–500. [Google Scholar] [CrossRef]
- Croft, T.A. Nighttime images of the earth from space. Sci. Am. 1978, 239, 86–98. [Google Scholar] [CrossRef]
- Imhoff, M.L.; Stutzer, D.C.; Elvidge, C.D.; Lawrence, W.T. A technique for using composite DMSP/OLS “City Lights” satellite data to map urban area. Remote Sens. Environ. 1997, 61, 361–370. [Google Scholar] [CrossRef]
- Henderson, M.; Yeh, E.T.; Gong, P.; Elvidge, C.D.; Baugh, K. Validation of urban boundaries derived from global night-time satellite imagery. Int. J. Remote Sens. 2003, 24, 595–609. [Google Scholar] [CrossRef]
- Liu, Z.F.; He, C.Y.; Zhang, Q.F.; Huang, Q.X.; Yang, Y. Extracting the dynamics of urban expansion in China using DMSP-OLS nighttime light data from 1992 to 2008. Landsc. Urban Plan. 2012, 106, 62–72. [Google Scholar] [CrossRef]
- Yuan, T.; Zheng, X.Q.; Zhou, W. Analysis of territorial development intensity in China using DMSP/OLS data. In Proceedings of the IET International Conference on Smart and Sustainable City, Shanghai, China, 6–8 July 2011; pp. 227–232.
- Yao, Y.L.; Li, Y. House vacancy at urban areas in China with nocturnal light data of DMSP-OLS. In Proceedings of the 2011 IEEE International Conference on Spatial Data Mining and Geographical Knowledge Services, Fuzhou, China, 29 June–1 July 2011; pp. 457–462.
- Ma, T.; Zhou, C.H.; Pei, T.; Haynie, S.; Fan, J.F. Quantitative estimation of urbanization dynamics using time series of DMSP/OLS nighttime light data: A comparative case study from China’s cities. Remote Sens. Environ. 2012, 124, 99–107. [Google Scholar] [CrossRef]
- Sutton, P.C. A scale-adjusted measure of “urban sprawl” using nighttime satellite imagery. Remote Sens. Environ. 2003, 86, 353–369. [Google Scholar] [CrossRef]
- Barth, J.R.; Lea, M.; Li, T. China’s Housing Market: Is a Bubble About to Burst? Available online: http://0-dx-doi-org.brum.beds.ac.uk/10.2139/ssrn.2191087/ (accessed on 18 December 2012).
- Guo, K.; Wang, J.; Shi, G.S.; Cao, X.H. Cluster analysis on city real estate market of China: Based on a new integrated method for time series clustering. Proc. Comput. Sci. 2012, 9, 1299–1305. [Google Scholar] [CrossRef]
- Zhuo, L.; Li, Q.; Shi, P.J.; Chen, J.; Zheng, J.; Li, X.; Wang, F. Characteristics analysis of urban land expansion in China in 1990s Using DMSP/OLS Data. Acta Sci. Nat. Univ. Sunyatseni 2007, 46, 98–102. (In Chinese) [Google Scholar]
- He, C.Y.; Shi, P.Y.; Li, J.G.; Chen, J.; Pan, Y.Z.; Zhou, L.; Ichinose, T. Restoring urbanization process in China in the 1990s by using non-radiance calibrated DMSP/OLS nighttime lights imagery and statistical data. Chin. Sci. Bull. 2006, 51, 1614–1620. [Google Scholar] [CrossRef]
- Small, C.; Pozzi, F.; Elvidge, C.D. Spatial analysis of global urban extent from DMSP-OLS night lights. Remote Sens. Environ. 2005, 96, 277–291. [Google Scholar] [CrossRef]
- Shu, S.; Yu, B.L.; Wu, J.P.; Liu, H.X. Methods for deriving urban built up area using night light data: Assessment and application. Remote Sens. Technol. Appl. 2011, 26, 169–176. (In Chinese) [Google Scholar]
- Zhang, X.; Ge, Q.; Zheng, J. Relationships between climate change and vegetation in Beijing using remote sense data and phenologhical data. Acta Phytoecol. Sin. 2004, 28, 499–506. (In Chinese) [Google Scholar]
- Van der Meer, F. Spectral curve shape matching with a continuum removed CCSM algorithm. Int. J. Remote Sens. 2000, 21, 3179–3185. [Google Scholar] [CrossRef]
- Wang, H.X.; Cai, M.H.; Shao, J.L. An analysis of property developers idle land based on real option theory. Areal Res. Dev. 2013, 32, 114–118. (In Chinese) [Google Scholar]
- Barlow, J. Controlling the housing land market: Some examples from Europe. Urban Stud. 1993, 30, 1129–1149. [Google Scholar] [CrossRef]
- Titman, S. Urban land prices under uncertainty. Am. Econ. Rev. 1985, 75, 505–514. [Google Scholar]
© 2015 by the authors; licensee MDPI, Basel, Switzerland. This article is an open access article distributed under the terms and conditions of the Creative Commons Attribution license (http://creativecommons.org/licenses/by/4.0/).
Share and Cite
Zhang, L.; Qu, G.; Wang, W. Estimating Land Development Time Lags in China Using DMSP/OLS Nighttime Light Image. Remote Sens. 2015, 7, 882-904. https://0-doi-org.brum.beds.ac.uk/10.3390/rs70100882
Zhang L, Qu G, Wang W. Estimating Land Development Time Lags in China Using DMSP/OLS Nighttime Light Image. Remote Sensing. 2015; 7(1):882-904. https://0-doi-org.brum.beds.ac.uk/10.3390/rs70100882
Chicago/Turabian StyleZhang, Li, Ge Qu, and Wen Wang. 2015. "Estimating Land Development Time Lags in China Using DMSP/OLS Nighttime Light Image" Remote Sensing 7, no. 1: 882-904. https://0-doi-org.brum.beds.ac.uk/10.3390/rs70100882