
Spatio-Temporal Changes in Vegetation Activity and Its Driving Factors during the Growing Season in China from 1982 to 2011


Abstract
:
1. Introduction
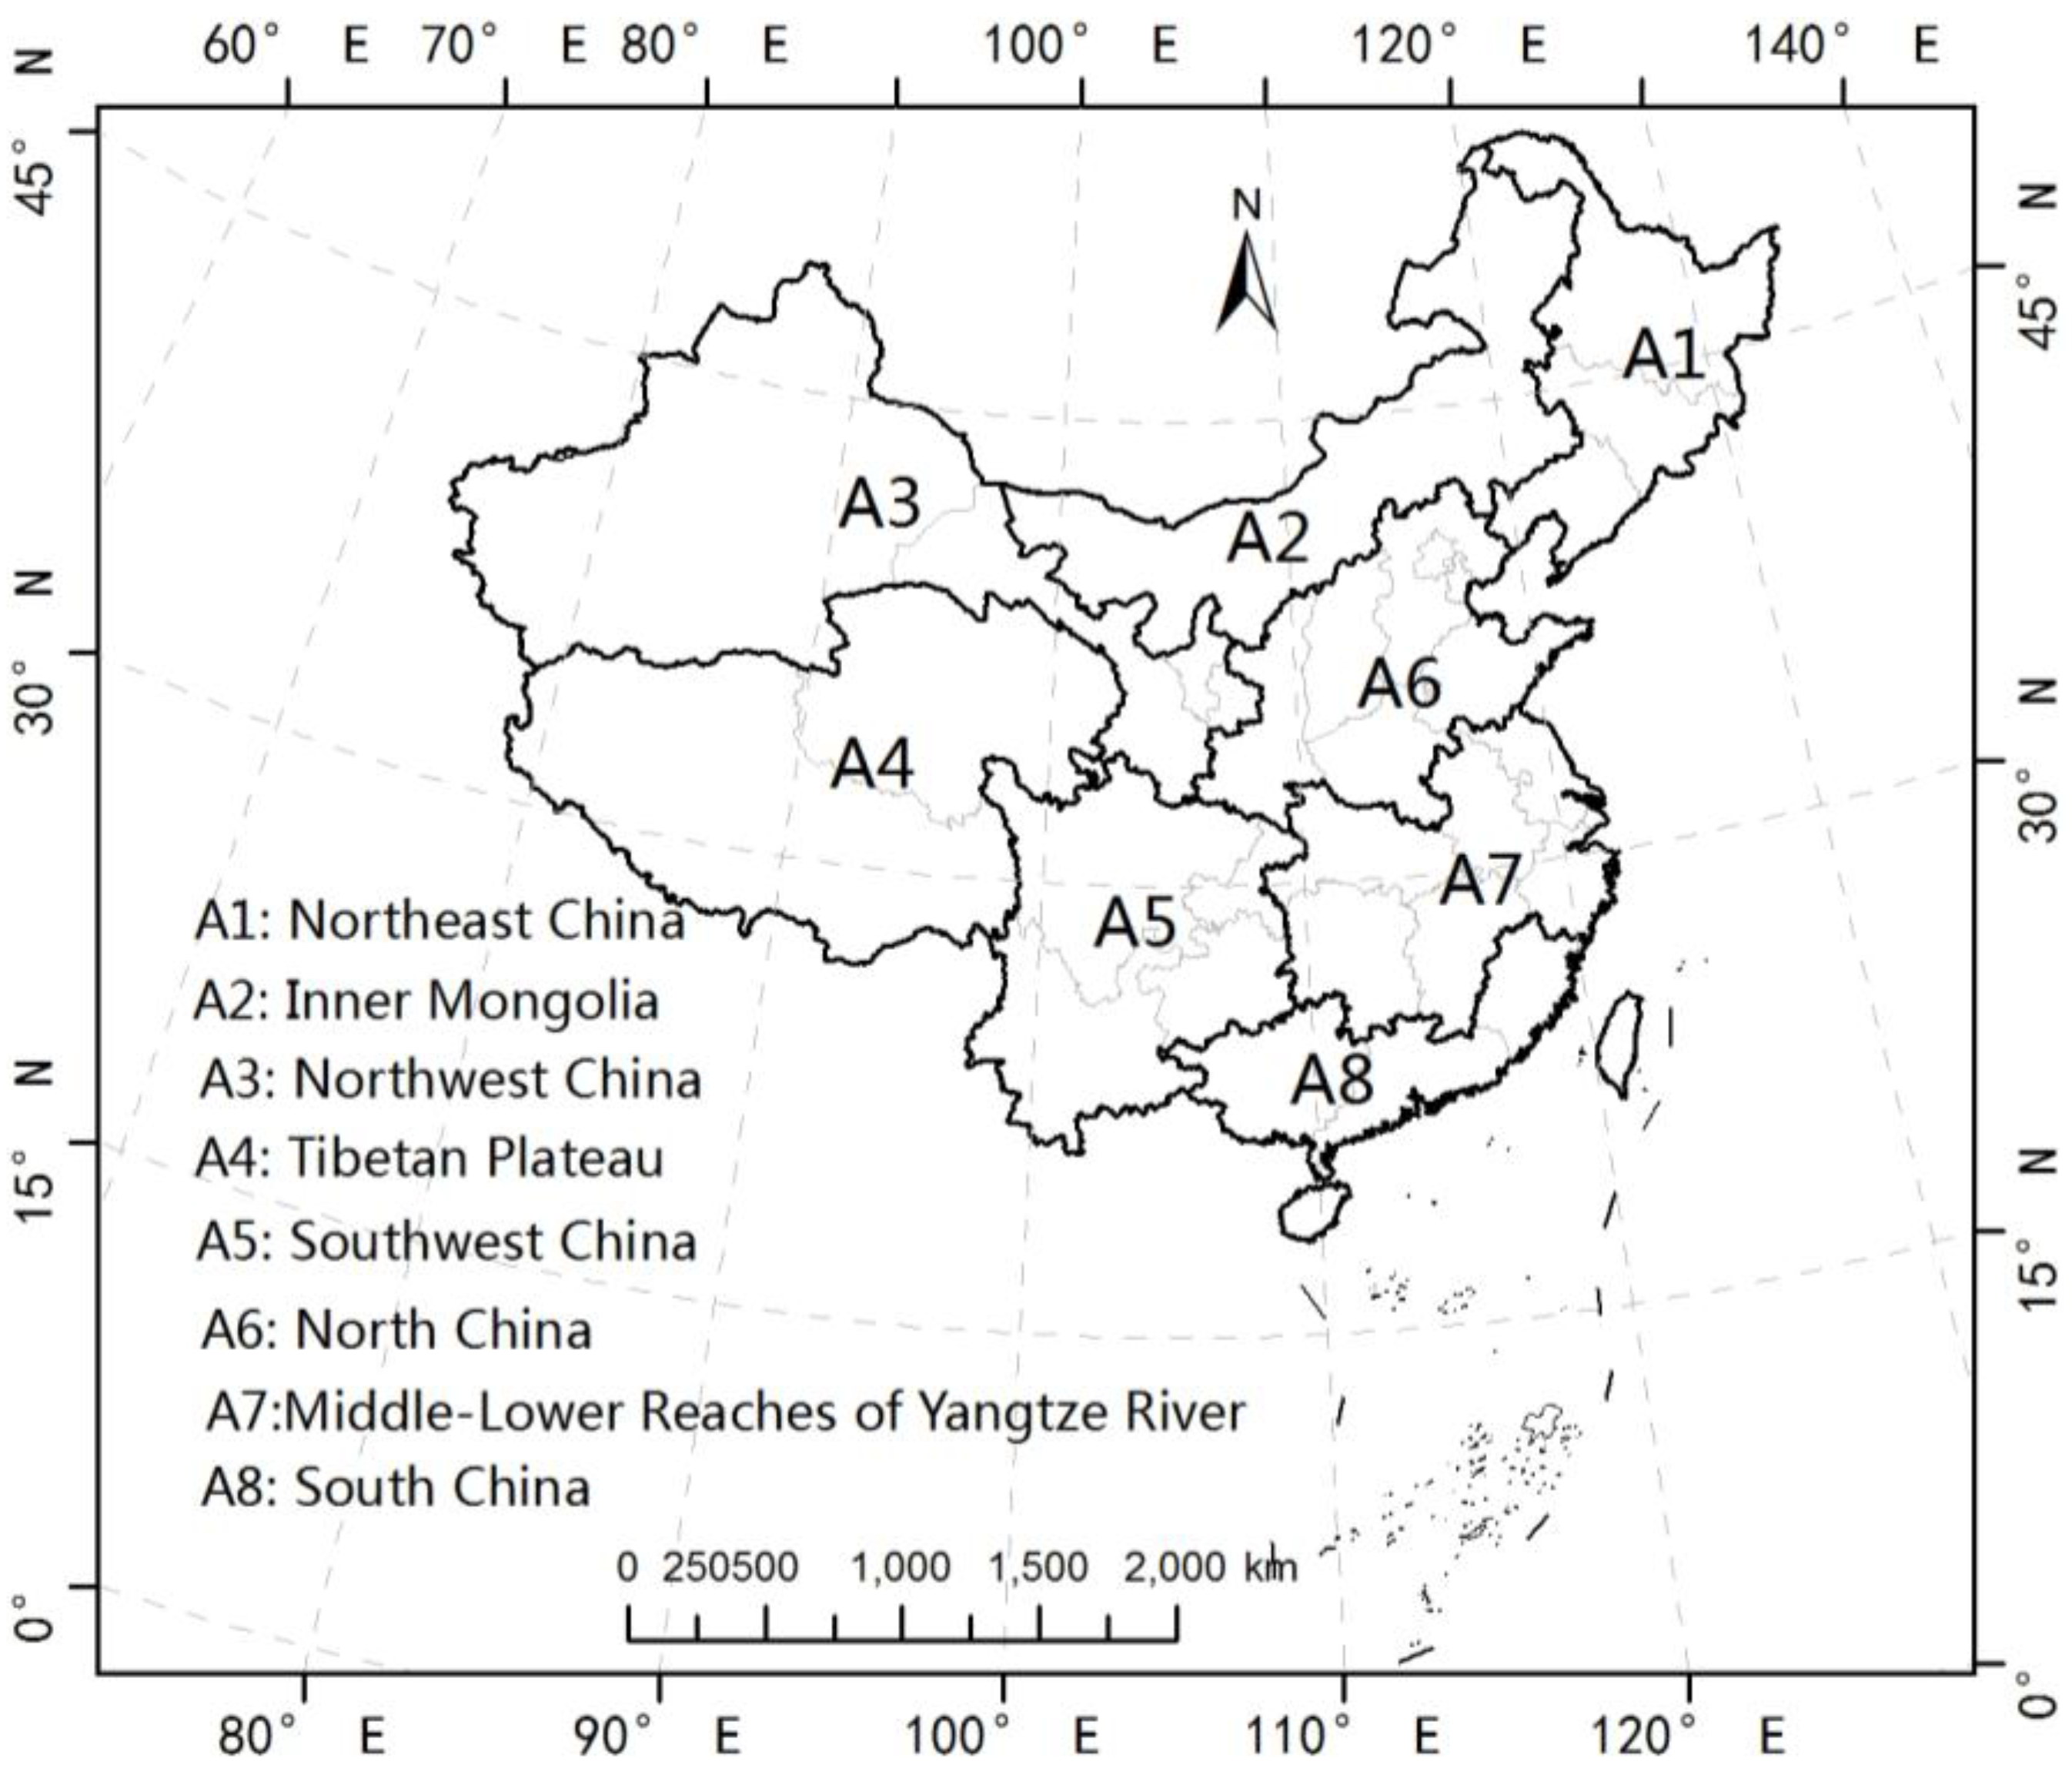
2. Materials
2.1. NOAA AVHRR NDVI
2.2. Climate Data
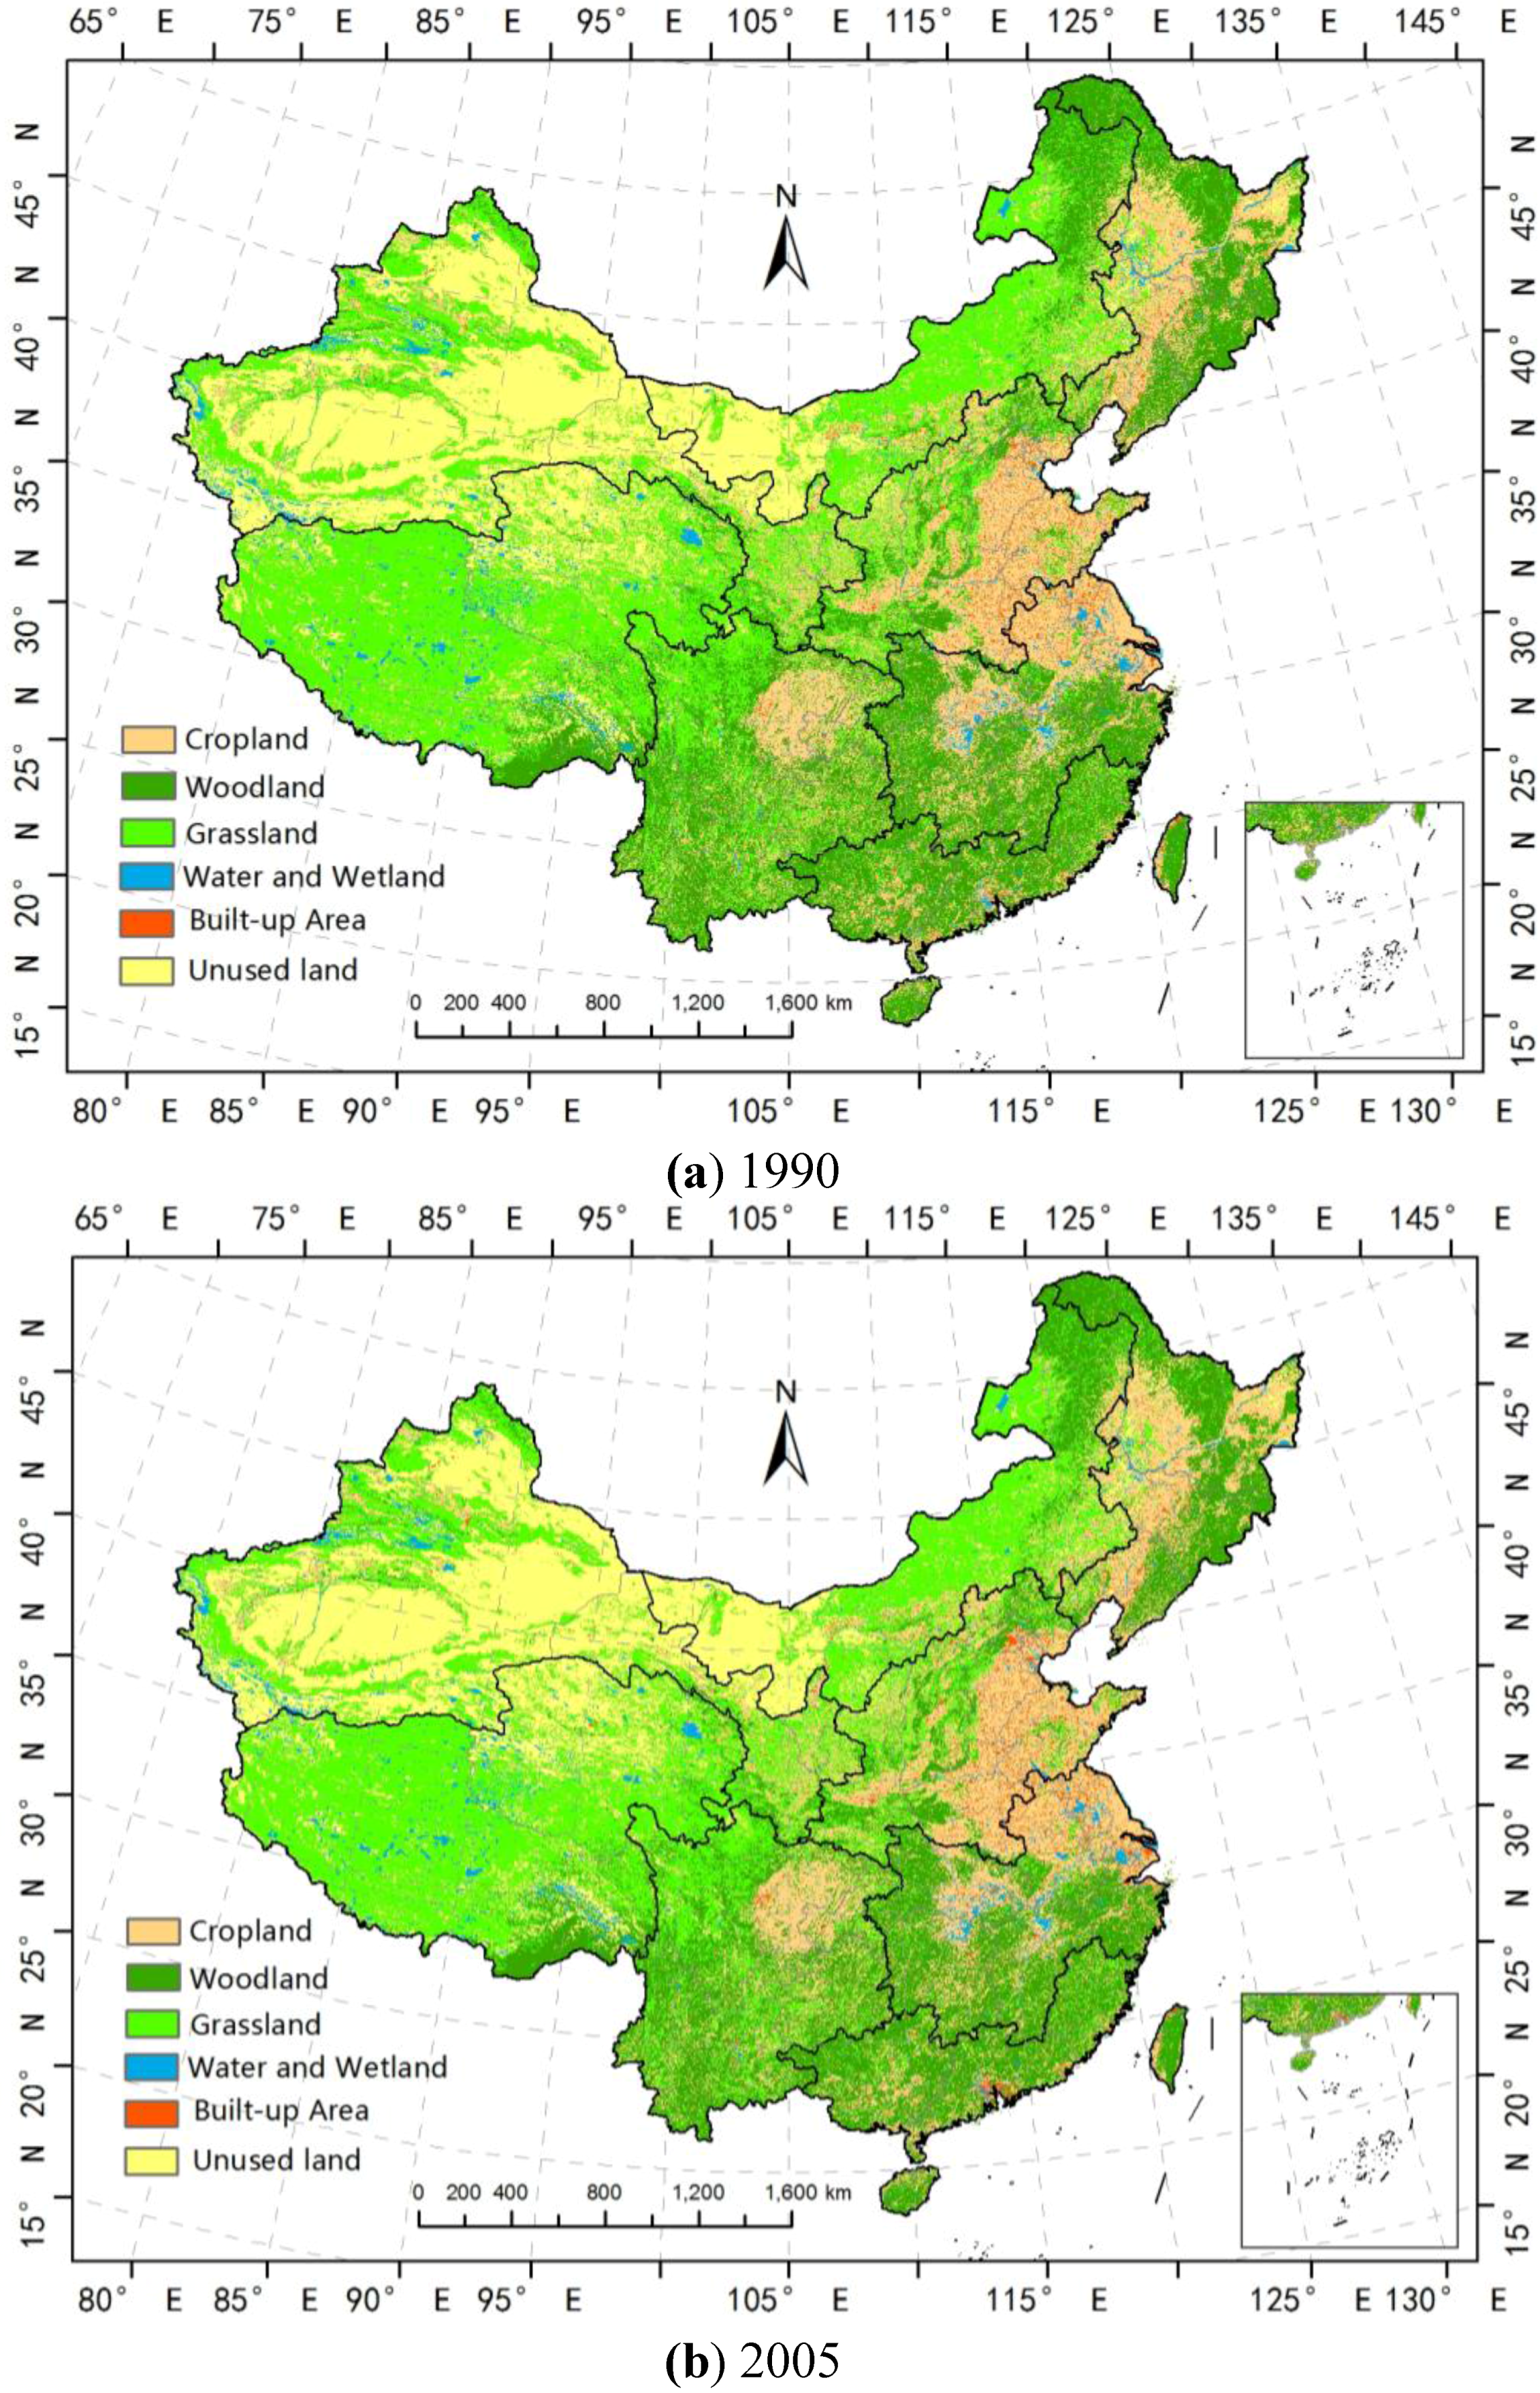
2.3. Land-Cover Data

| 1st Level Classes | 2nd Level Classes |
|---|---|
| Cropland | Paddy and dry farming land |
| Woodland | Forest, shrub, woods and others (e.g., orchards, tea-garden) |
| Grassland | Dense, moderate and sparse grass |
| Water body | Stream and rivers, lakes, reservoir, ponds, permanent ice and snow, beach and shore, and bottomland |
| Built-up land | Urban area, rural settlements and others (e.g., factories, mining) |
| Unused land | Sandy land, Gobi, Salina, wetland, bare soil, bare rock and others (e.g., alpine desert, tundra) |
3. Methods
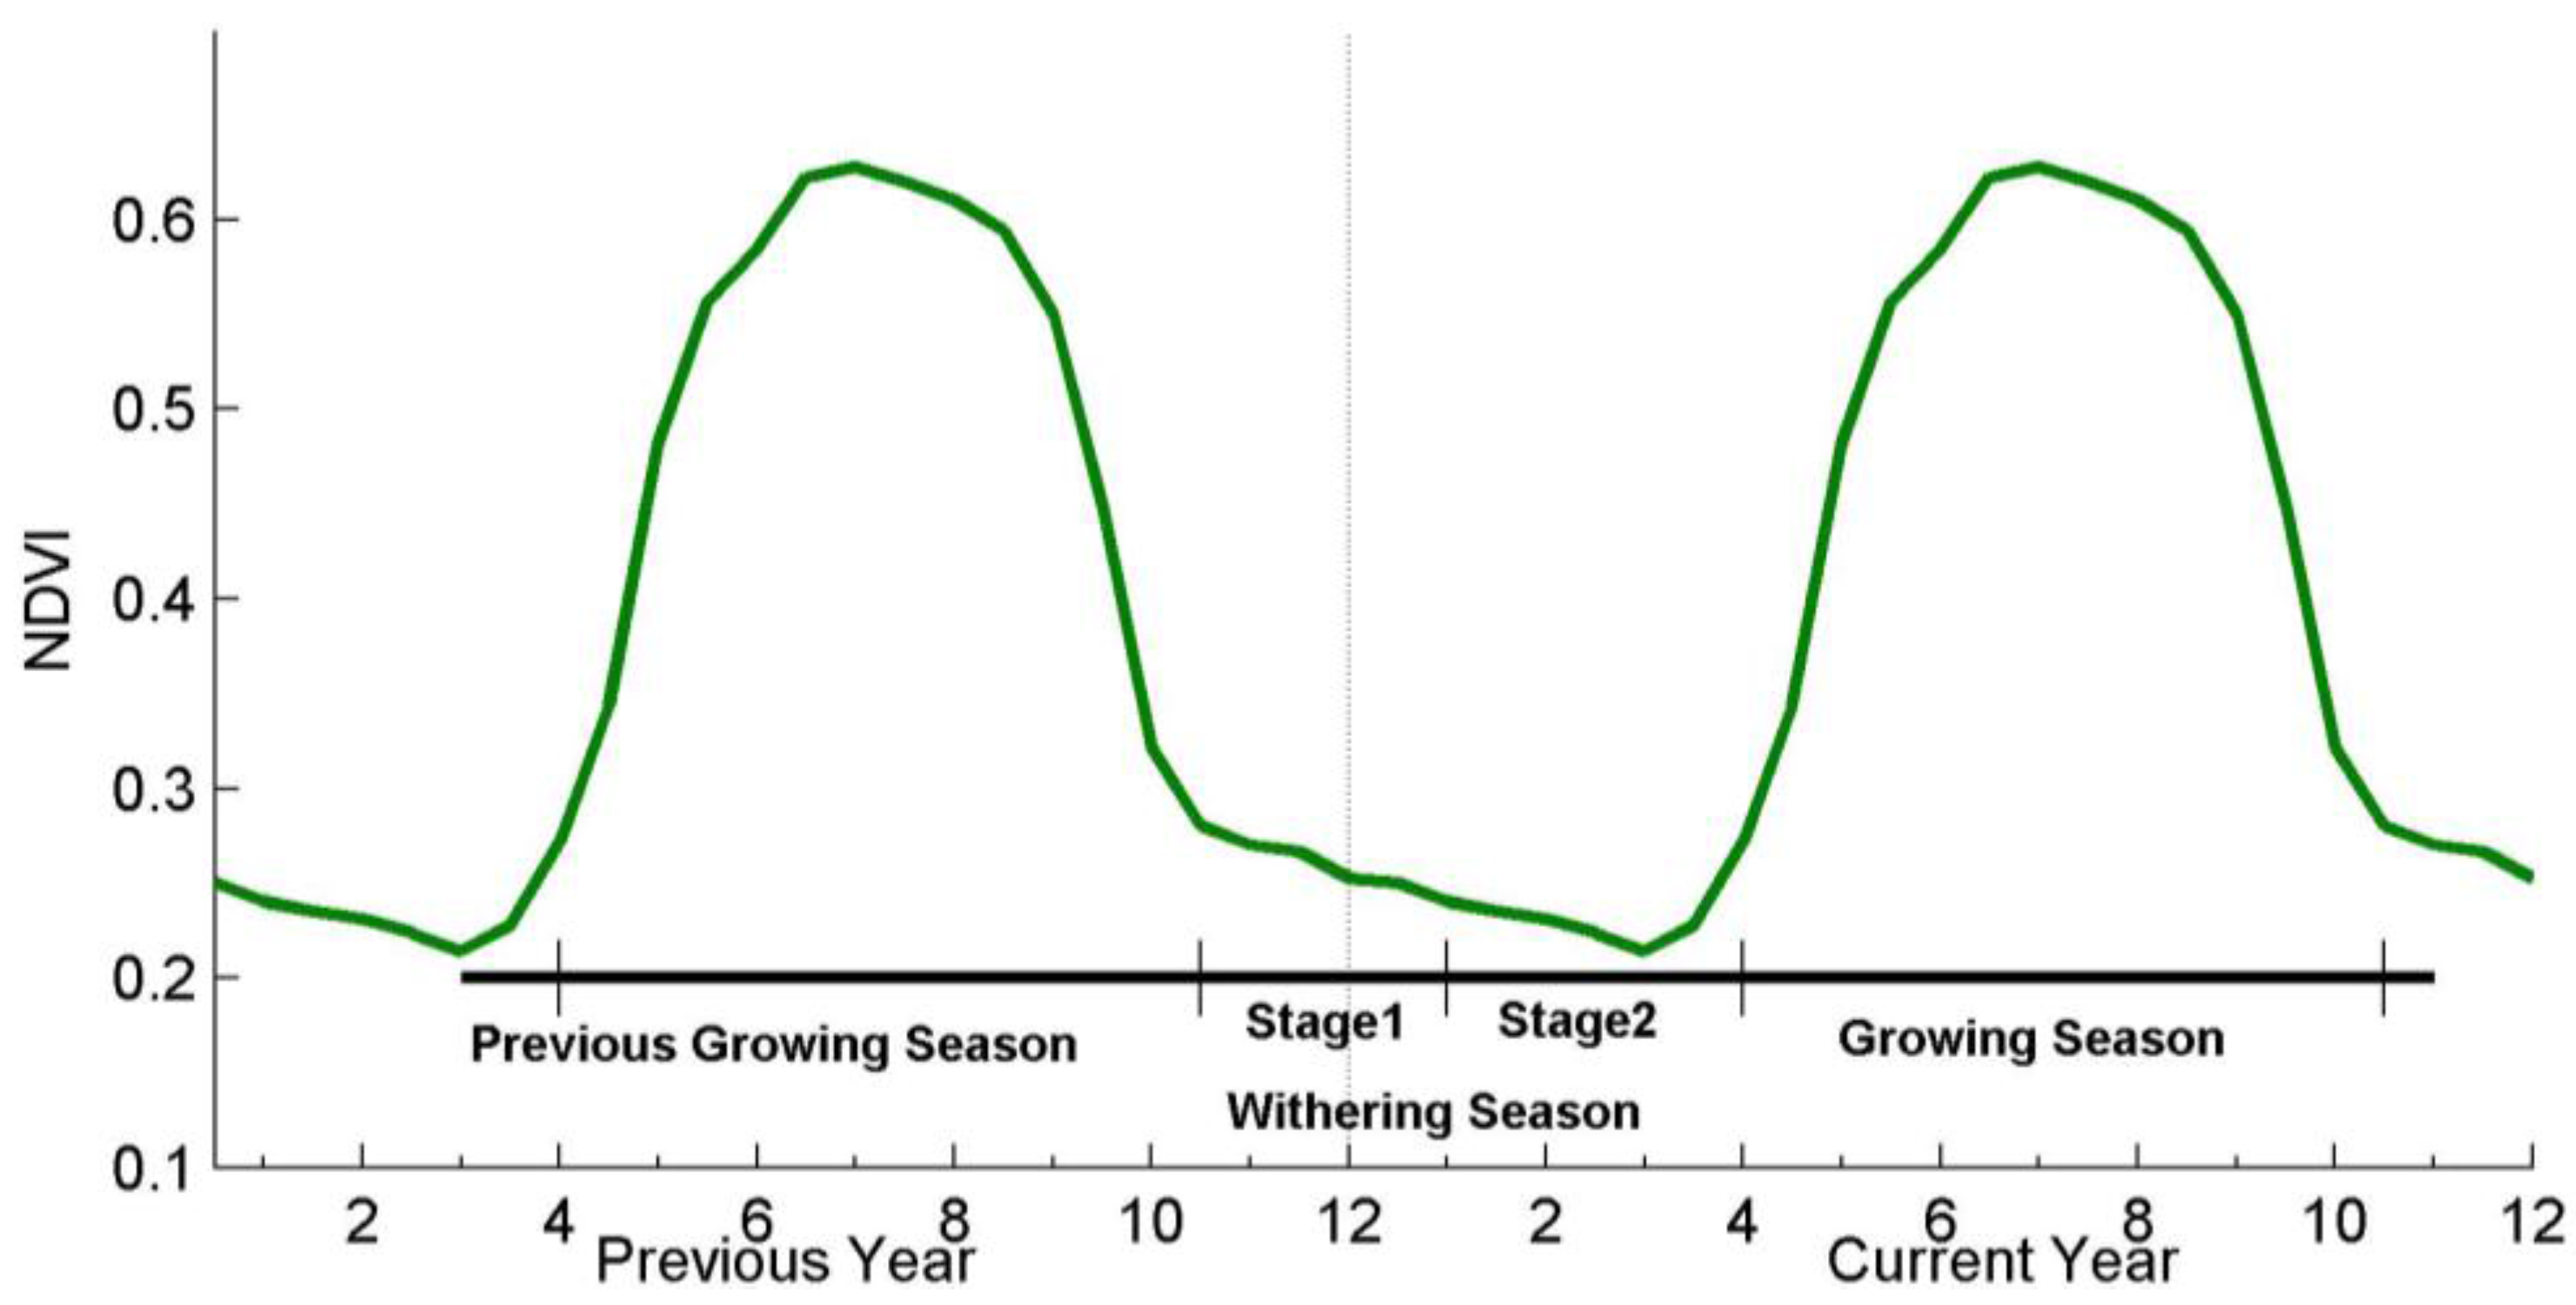
3.1. Extraction of Phenological Parameters
3.2. Linear Trend Analysis

3.3. Multiple Regression Model of the NDVI-Climate Relationship

3.4. Model Residuals and Detection of the Contribution of Human Activities
4. Results and Discussion
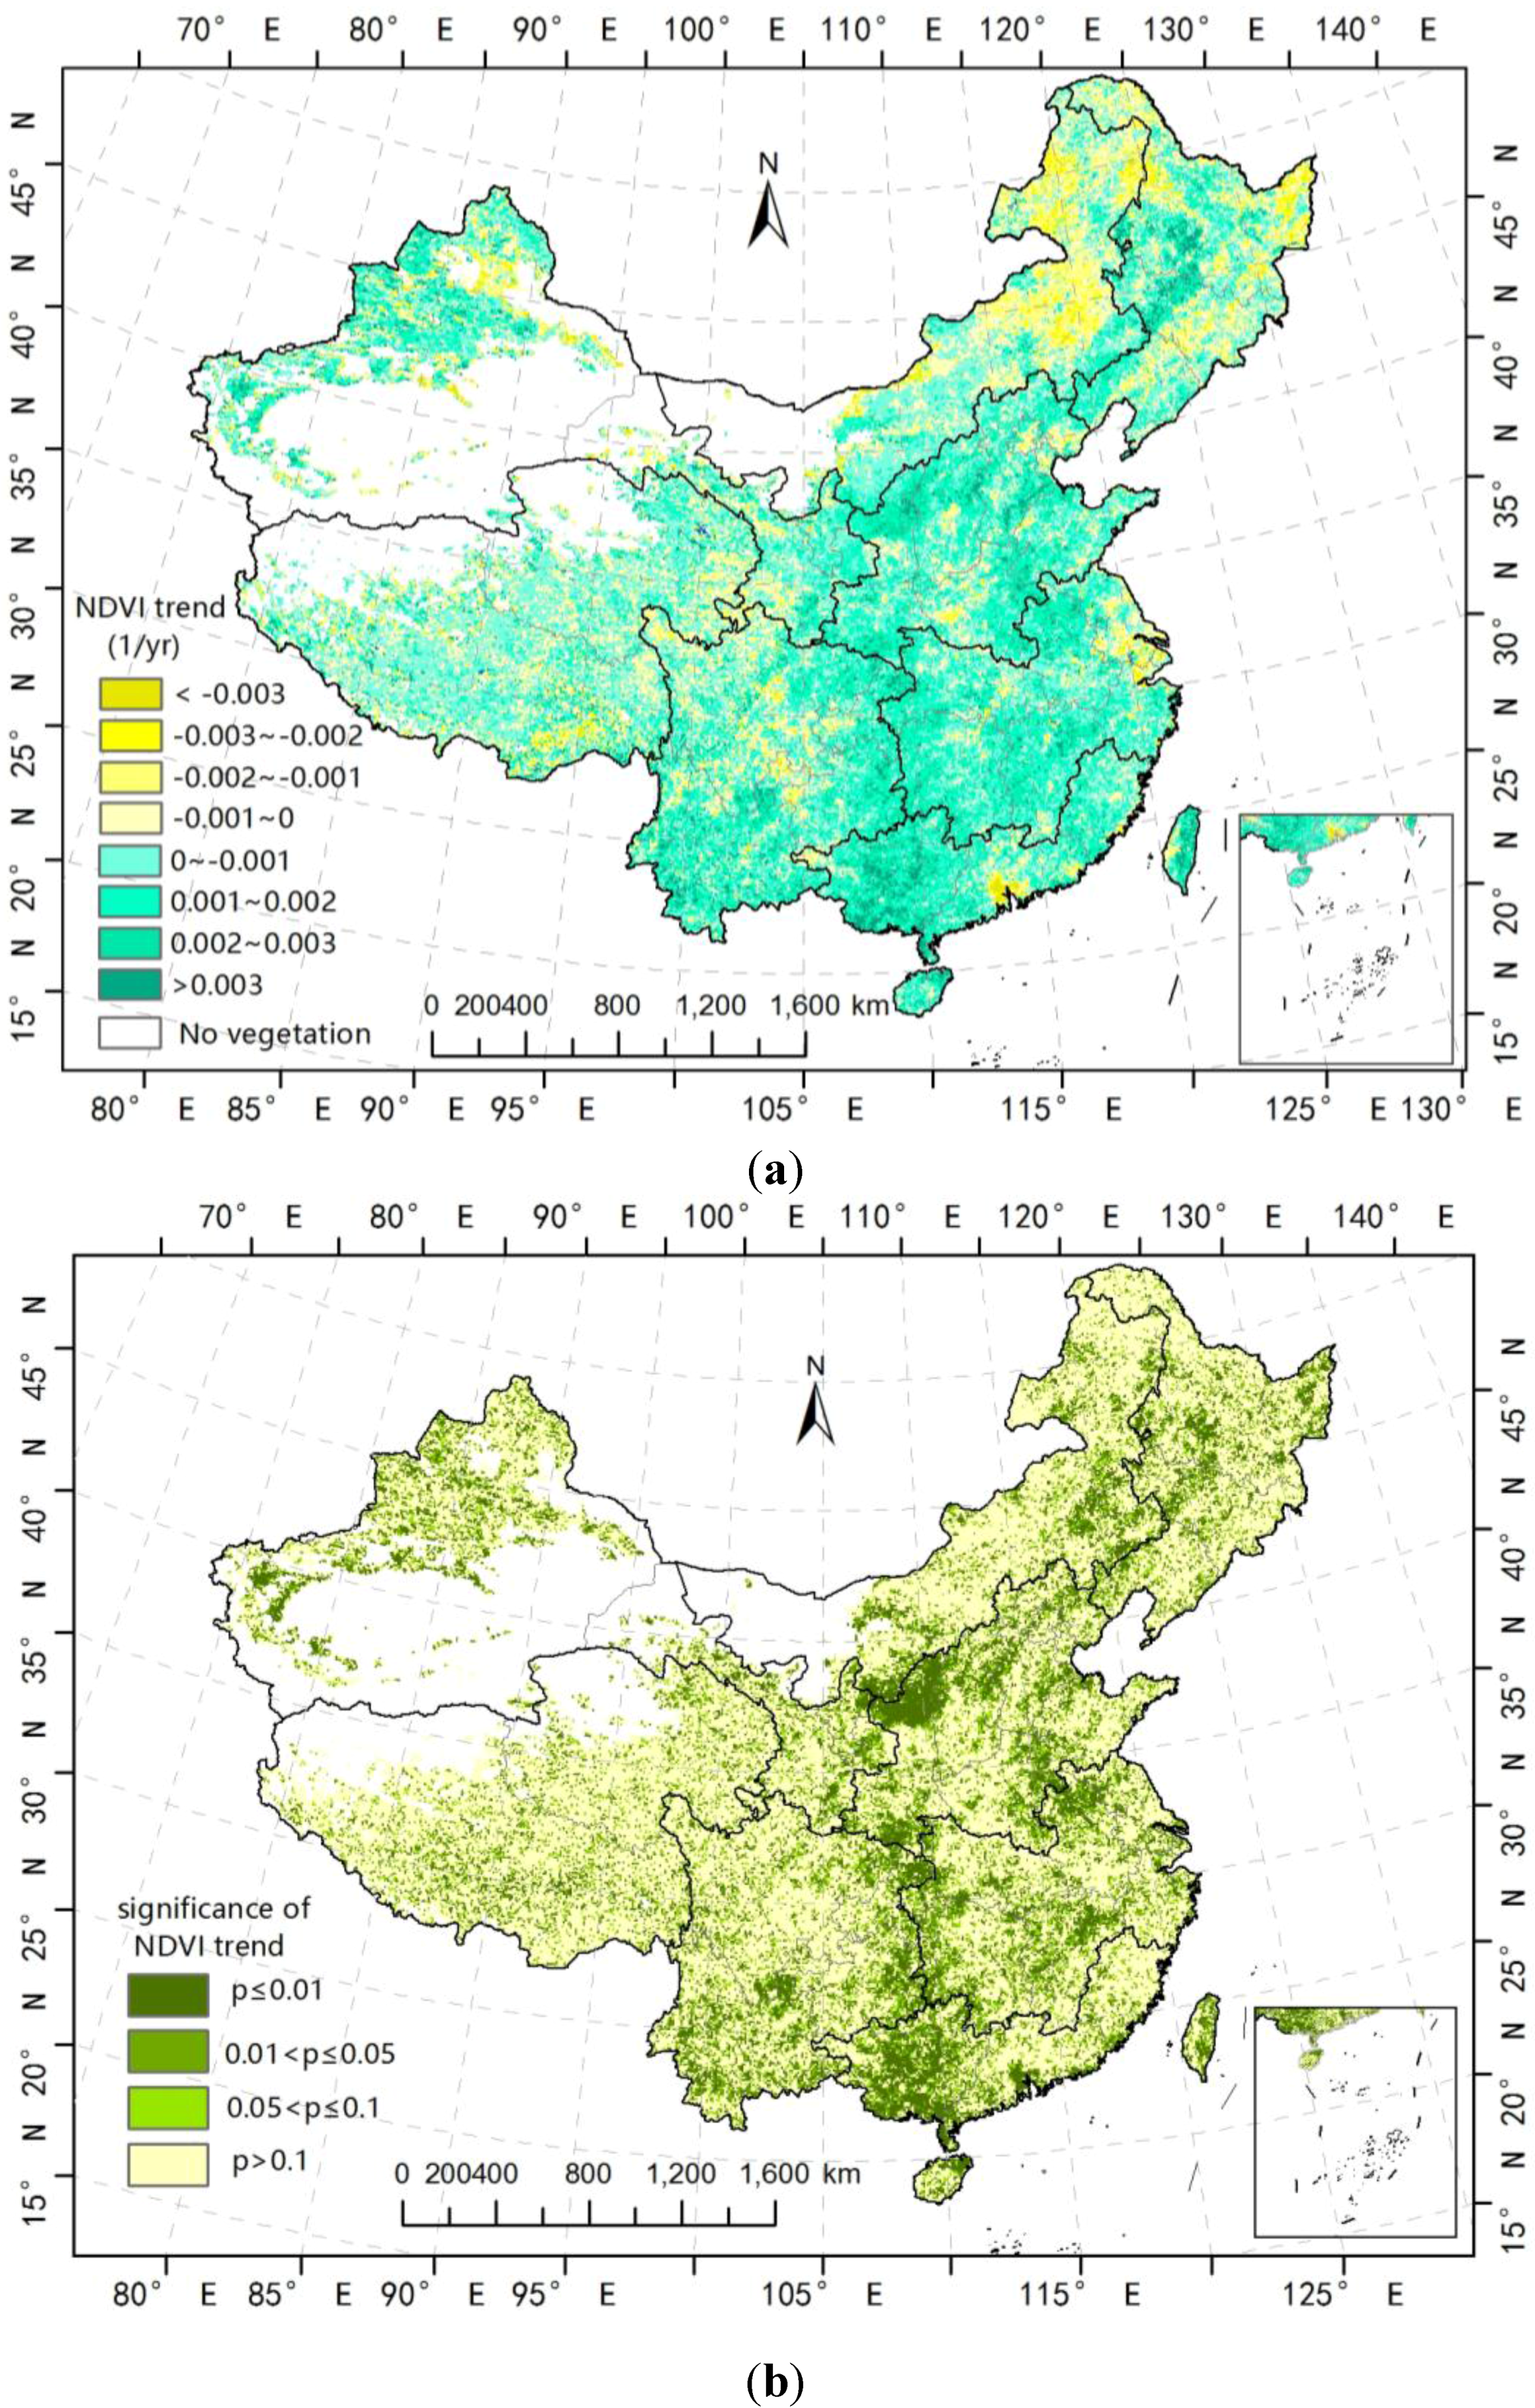
4.1. Spatio-Temporal Changes in Growing-Season NDVI
| Region | Average Slope (10−3) | Slope | T-Test | ||||||
|---|---|---|---|---|---|---|---|---|---|
| <–0.002 | <0 | 0 | >0 | >0.002 | Significant Decrease (p < 0.05) | Significant Increase (p < 0.05) | No Significance | ||
| Northeast China (A1) | 0.22 | 5.85% | 45.33% | 0.00% | 54.73% | 9.51% | 9.81% | 14.47% | 75.72% |
| Inner Mongolia (A2) | –0.18 | 6.09% | 44.00% | 20.54% | 35.48% | 2.15% | 12.20% | 10.02% | 77.78% |
| Northwest China (A3) | 0.18** | 2.69% | 16.14% | 54.23% | 29.63% | 5.02% | 6.78% | 21.53% | 71.69% |
| Tibetan Plateau (A4) | 0.18 | 2.11% | 27.36% | 28.26% | 44.45% | 3.65% | 4.17% | 12.13% | 83.70% |
| Southwest China (A5) | 0.79 | 1.58% | 25.76% | 0.00% | 74.24% | 16.35% | 2.82% | 25.31% | 71.87% |
| North China (A6) | 0.95** | 0.86% | 19.79% | 0.00% | 80.34% | 16.79% | 2.01% | 32.77% | 65.22% |
| Middle to Lower Reaches of Yangtze River (A7) | 0.93* | 1.76% | 19.06% | 0.00% | 81.01% | 16.06% | 3.26% | 28.94% | 67.80% |
| South China (A8) | 1.31** | 2.43% | 17.25% | 0.00% | 83.08% | 27.52% | 3.34% | 36.56% | 60.10% |
| All | 0.40** | 2.95% | 26.52% | 20.78% | 52.76% | 9.35% | 5.68% | 21.22% | 73.10% |


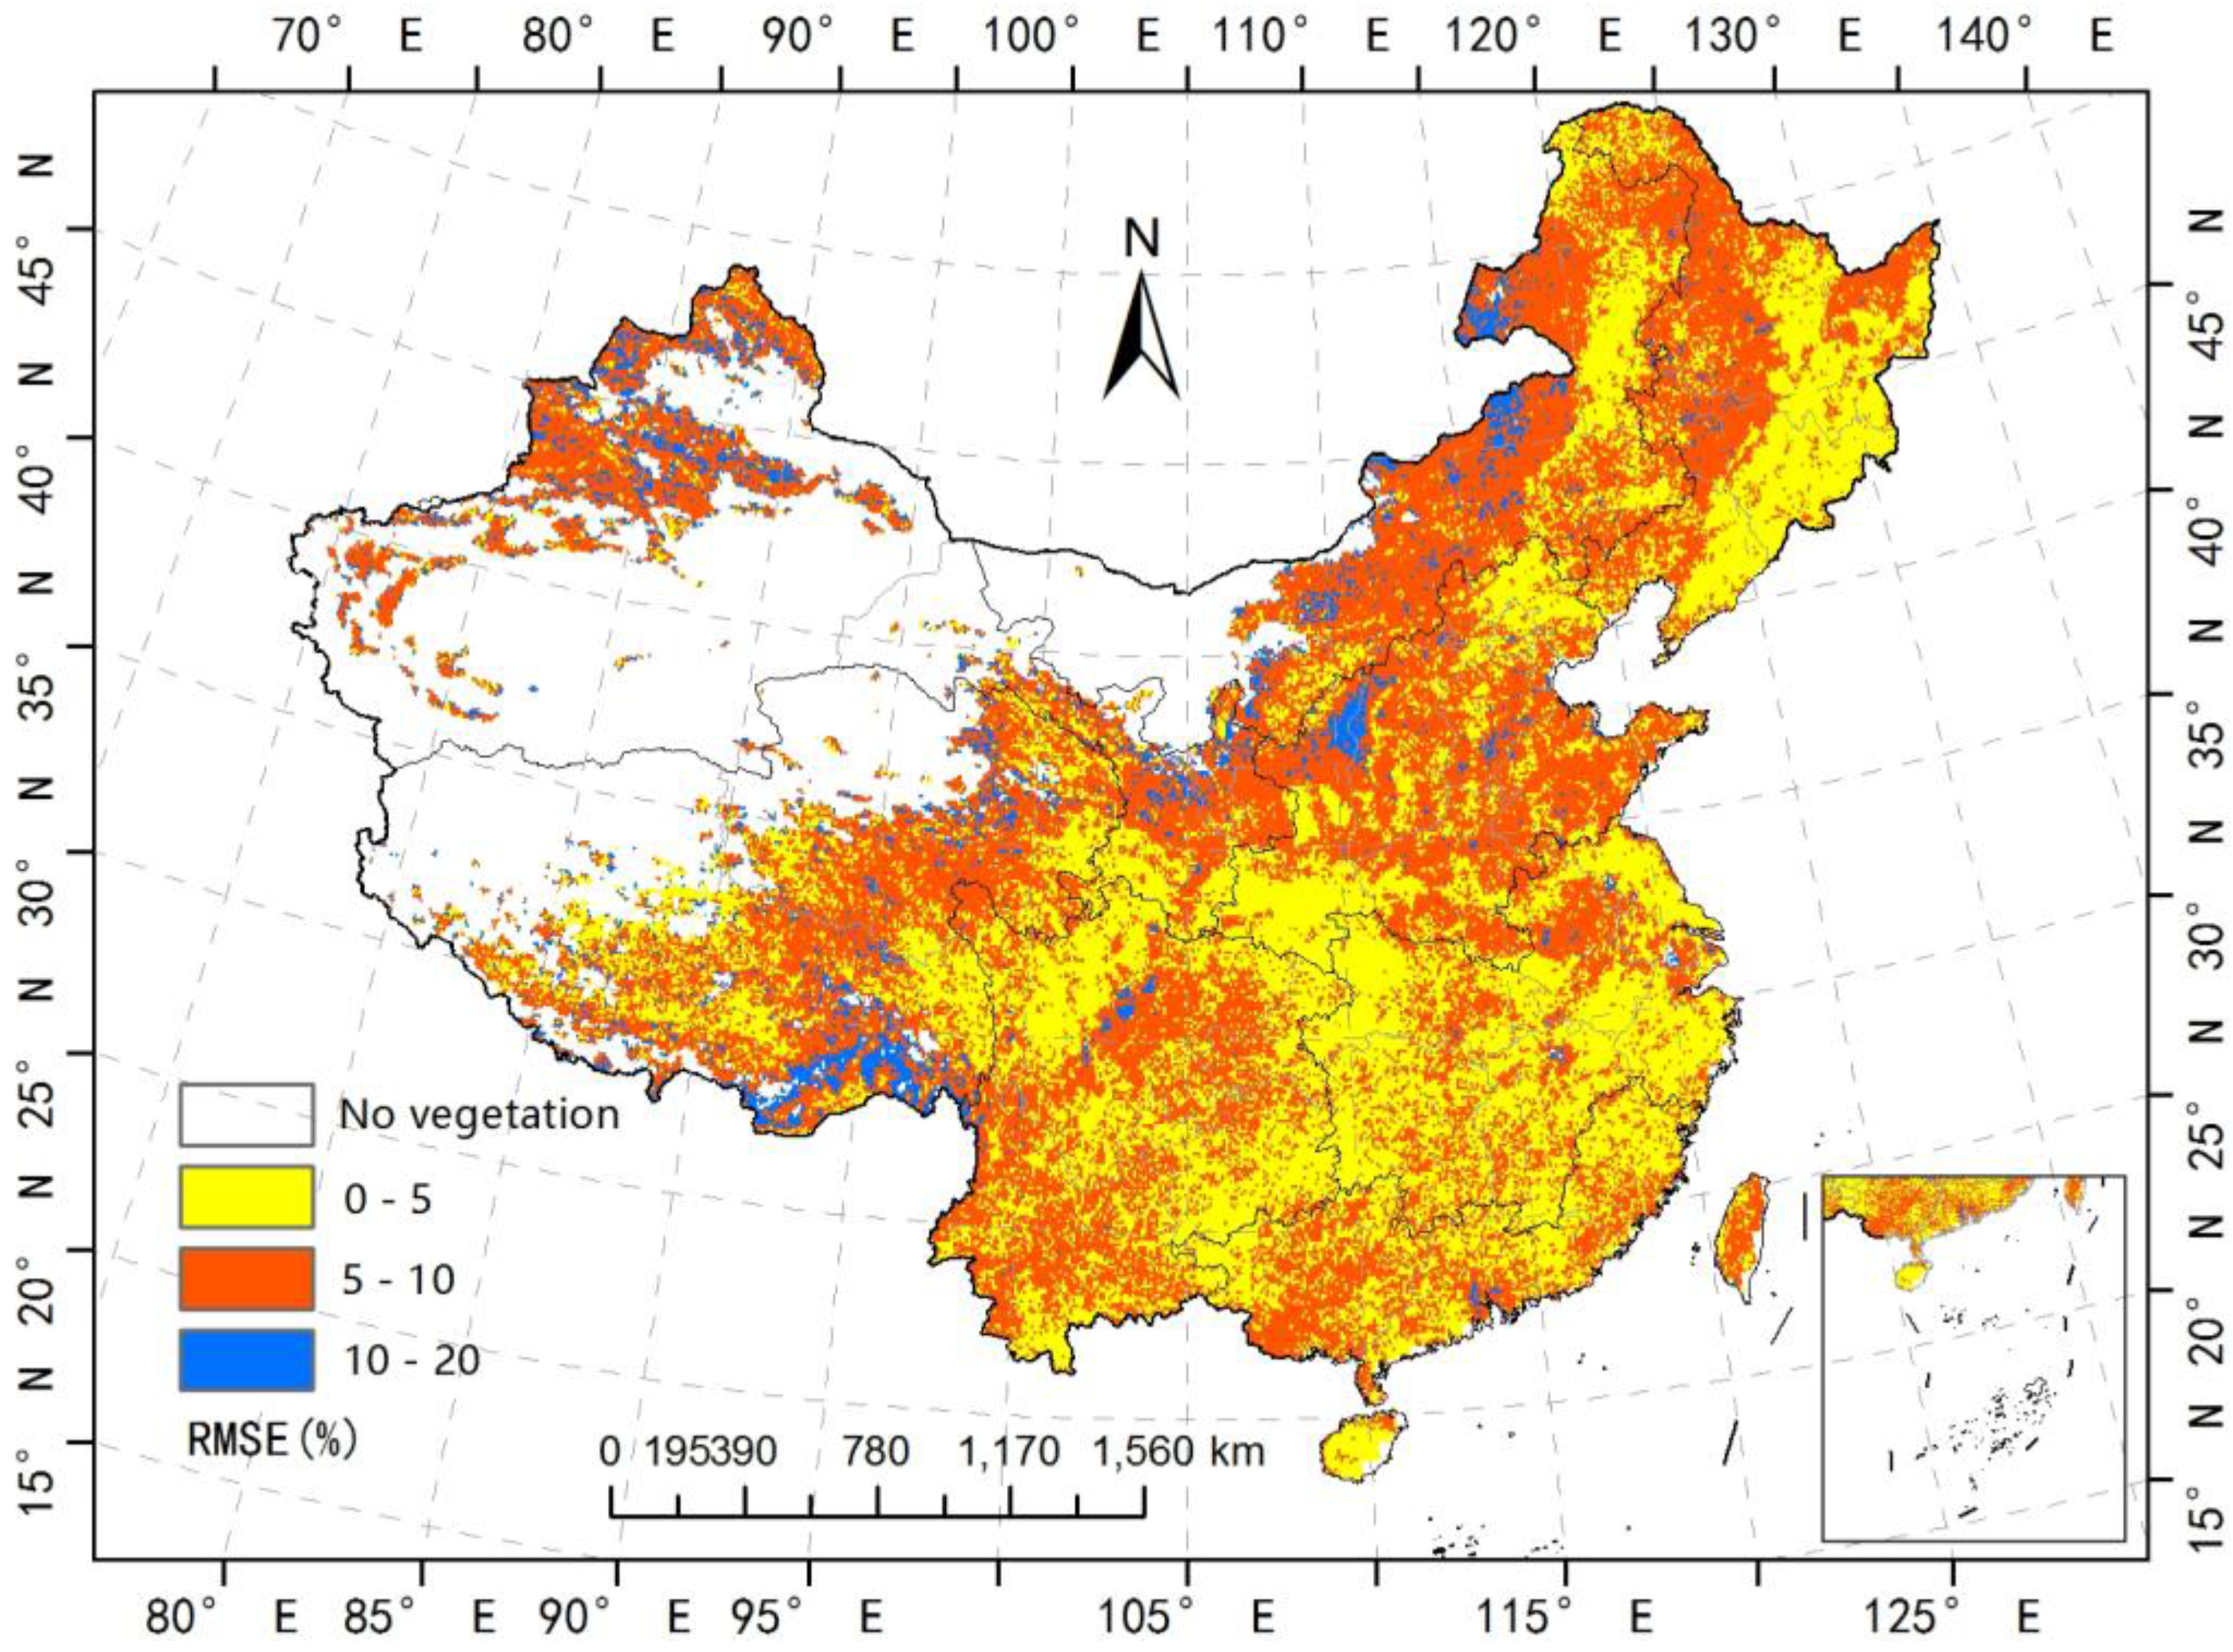
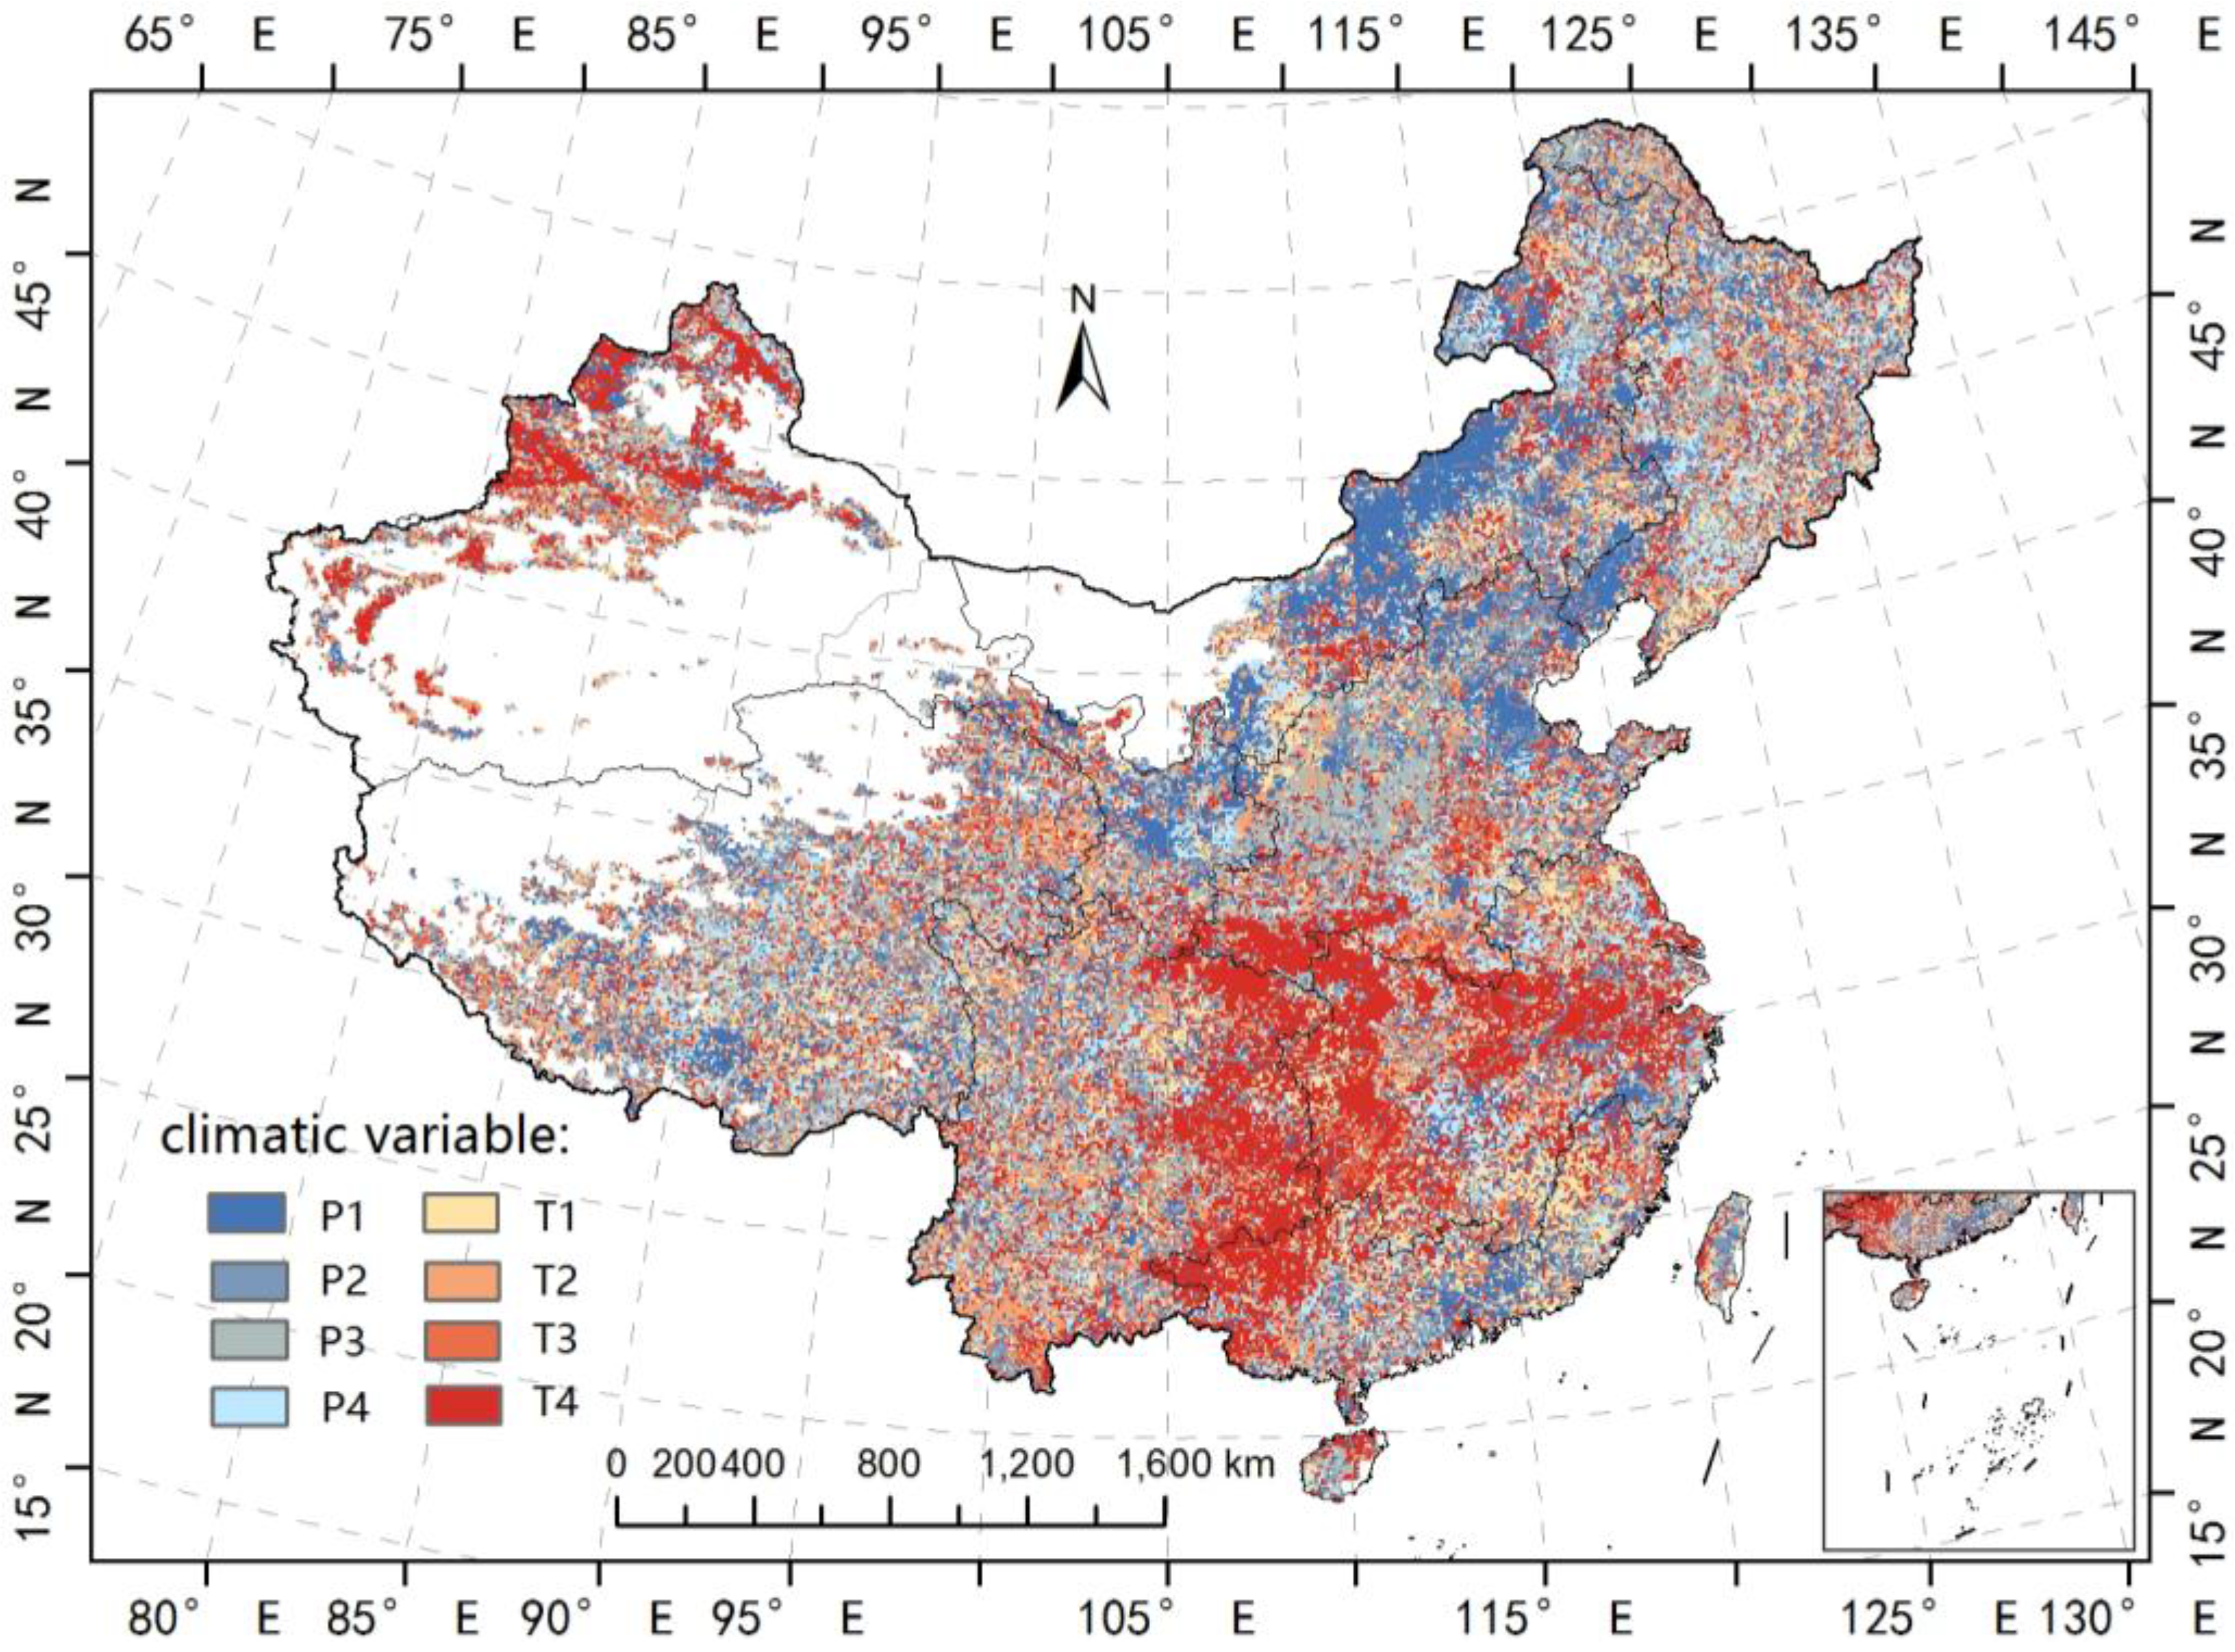
4.2. Effects of Climate Variables on Vegetation Variations
| Factor | A1 | A2 | A3 | A4 | A5 | A6 | A7 | A8 |
|---|---|---|---|---|---|---|---|---|
| P1 | −0.74 | 4.78 | 1.92 | −1.50 | −0.89 | 1.60 | −4.42 | −4.72 |
| P2 | 4.01 | 0.30 | −0.85 | 3.25 | −1.41 | 7.98 | −1.90 | 1.79 |
| P3 | 3.44 | −0.22 | 2.17 | −0.13 | 1.84 | 10.79 | −0.47 | −1.20 |
| P4 | 2.52 | 1.41 | 0.00 | −0.73 | −0.16 | −0.81 | 3.29 | −0.01 |
| T1 | −0.04 | 2.05 | 2.39 | 2.87 | 3.04 | 4.36 | 3.50 | 6.49 |
| T2 | 0.22 | −1.61 | −2.07 | −0.88 | 4.42 | 3.14 | 0.57 | −0.77 |
| T3 | 0.86 | −0.39 | 0.55 | 0.38 | 0.96 | 0.67 | 4.36 | 3.27 |
| T4 | 0.92 | 1.83 | 0.80 | −1.85 | 2.19 | 0.34 | 1.90 | 1.75 |
| B | 608.65 | 332.97 | 137.49 | 214.86 | 637.76 | 513.91 | 651.67 | 659.13 |
| Slope(predicted NDVI) | 0.06 | −0.14 | 0.11 | 0.18 | 0.63 | 0.80 | 0.66 | 0.39 |
| RMSE | 9.84 | 5.93 | 3.86 | 5.63 | 11.63 | 10.67 | 16.05 | 19.12 |
| RMSE (%) | 1.62% | 1.78% | 2.81% | 2.62% | 1.82% | 2.08% | 2.46% | 2.90% |


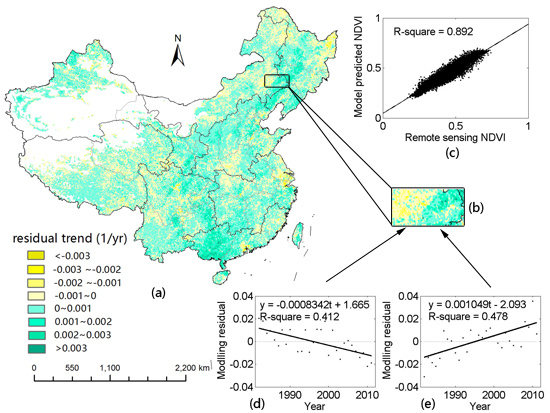
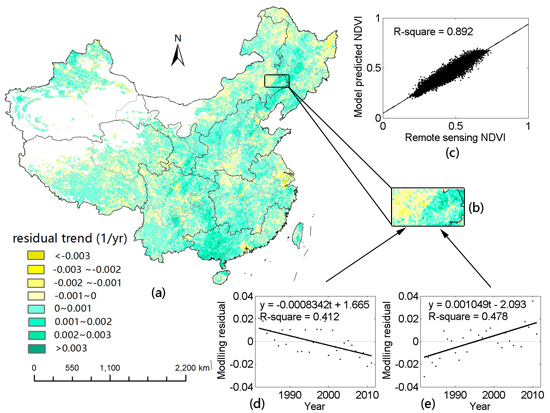
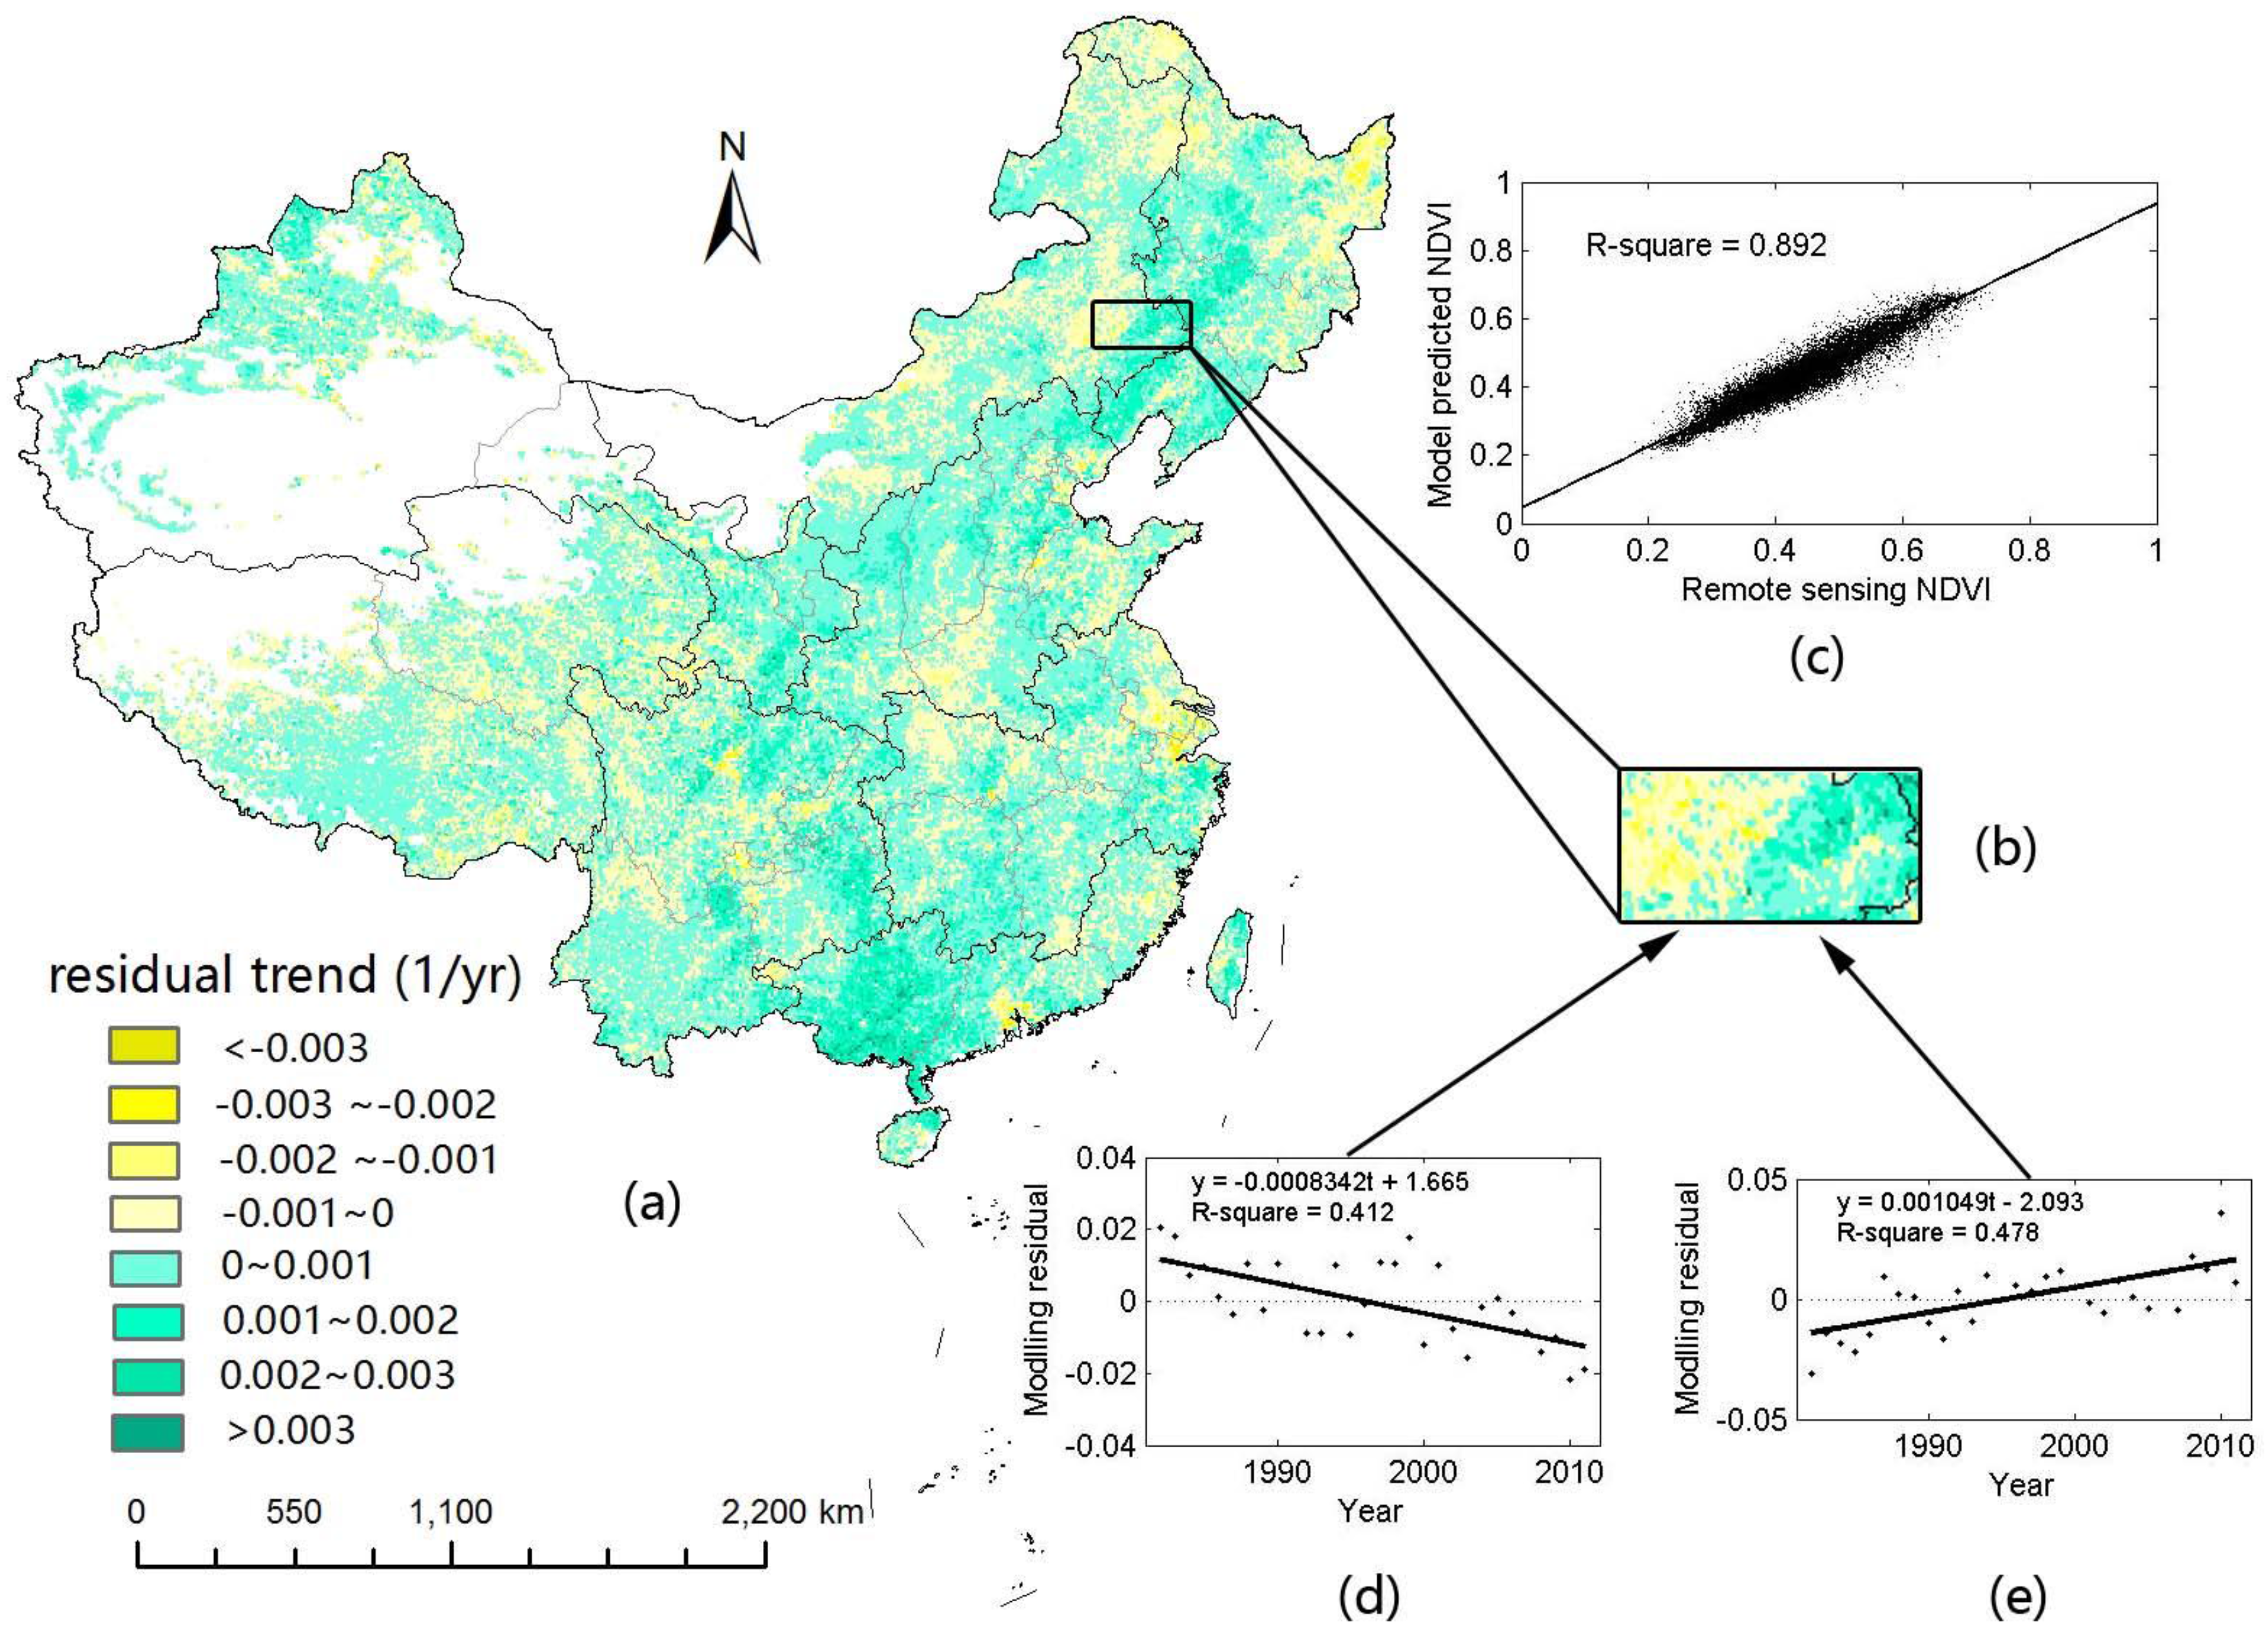
4.3. Effects of Human Activities on Vegetation Variations
| Region | Significantly Declined (p < 0.05) | Significantly Increased (p < 0.05) | No Significance | ||
|---|---|---|---|---|---|
| —— | Proportion | Area (103 km2) | Proportion | Area (103 km2) | Proportion |
| Northeast China (A1) | 2.02% | 16.90 | 6.94% | 57.92 | 91.04% |
| Inner Mongolia (A2) | 0.58% | 5.31 | 2.70% | 24.83 | 96.72% |
| Northwest China (A3) | 1.13% | 9.22 | 4.52% | 36.86 | 94.36% |
| Tibetan Plateau (A4) | 1.00% | 10.75 | 0.93% | 10.05 | 98.07% |
| Southwest China (A5) | 1.24% | 11.78 | 6.33% | 60.10 | 92.43% |
| North China (A6) | 0.81% | 6.72 | 3.68% | 30.46 | 95.51% |
| Middle to Lower Reaches of Yangtze River (A7) | 1.90% | 14.78 | 2.09% | 16.32 | 96.01% |
| South China (A8) | 1.39% | 6.66 | 18.71% | 89.60 | 79.90% |
| All | 1.23% | 82.112 | 4.88% | 326.144 | 93.89% |


| Region | Cropland | Woodland | Grassland | Water Bodies | Built-up Area | Unused Land |
|---|---|---|---|---|---|---|
| Northeast China (A1) | 26.20 | –11.17 | –9.47 | –1.79 | 0.94 | –4.71 |
| Inner Mongolia (A2) | 10.90 | –2.72 | –11.73 | –0.57 | 0.73 | 3.39 |
| Northwest China (A3) | 11.97 | 2.56 | –12.10 | 2.96 | 1.63 | –7.01 |
| Tibetan Plateau (A4) | 0.17 | –0.21 | –1.20 | 0.52 | 0.37 | 0.34 |
| Southwest China (A5) | –2.83 | –0.63 | 1.64 | –0.09 | 1.80 | 0.11 |
| North China (A6) | –8.89 | 1.74 | –1.45 | 0.84 | 10.17 | –2.41 |
| Middle to Lower Reaches of Yangtze River (A7) | –10.72 | –0.10 | –0.41 | 2.73 | 8.84 | –0.34 |
| South China (A8) | –5.06 | 1.55 | –3.67 | 0.86 | 6.35 | –0.04 |
| All | 21.74 | –8.98 | –38.40 | 5.47 | 30.83 | –10.67 |

5. Conclusions
Acknowledgments
Author Contributions
Conflicts of Interest
References
- Wang, F.; Wang, X.; Zhao, Y.; Yang, Z. Temporal variations of NDVI and correlations between NDVI and hydro-climatological variables at Lake Baiyangdian, China. Int. J. Biometeorol. 2013, 58, 1531–1543. [Google Scholar] [CrossRef]
- Sims, D.A.; Rahman, A.F.; Cordova, V.D.; El-Masri, B.Z.; Baldocchi, D.D.; Bolstad, P.V.; Flanagan, L.B.; Goldstein, A.H.; Hollinger, D.Y.; Misson, L. A new model of gross primary productivity for North American ecosystems based solely on the enhanced vegetation index and land surface temperature from modis. Remote Sens. Environ. 2008, 112, 1633–1646. [Google Scholar] [CrossRef]
- Fensholt, R.; Rasmussen, K.; Nielsen, T.T.; Mbow, C. Evaluation of earth observation based long term vegetation trends—Intercomparing NDVI time series trend analysis consistency of Sahel from AVHRR GIMMS, TERRA MODIS and SPOT VGT data. Remote Sens. Environ. 2009, 113, 1886–1898. [Google Scholar] [CrossRef]
- Myneni, R.B.; Keeling, C.; Tucker, C.; Asrar, G.; Nemani, R. Increased plant growth in the northern high latitudes from 1981 to 1991. Nature 1997, 386, 698–702. [Google Scholar] [CrossRef]
- Kawabata, A.; Ichii, K.; Yamaguchi, Y. Global monitoring of interannual changes in vegetation activities using NDVI and its relationships to temperature and precipitation. Int. J. Remote Sens. 2001, 22, 1377–1382. [Google Scholar] [CrossRef]
- Los, S.O.; Collatz, G.J.; Bounoua, L.; Sellers, P.J.; Tucker, C.J. Global interannual variations in sea surface temperature and land surface vegetation, air temperature, and precipitation. J. Clim. 2001, 14, 1535–1549. [Google Scholar] [CrossRef]
- Chen, B.; Xu, G.; Coops, N.C.; Ciais, P.; Innes, J.L.; Wang, G.; Myneni, R.B.; Wang, T.; Krzyzanowski, J.; Li, Q.; et al. Changes in vegetation photosynthetic activity trends across the Asia–Pacific region over the last three decades. Remote Sens. Environ. 2014, 144, 28–41. [Google Scholar] [CrossRef]
- Xu, G.; Zhang, H.; Chen, B.; Zhang, H.; Innes, J.L.; Wang, G.; Yan, J.; Zheng, Y.; Zhu, Z.; Myneni, R.B. Changes in vegetation growth dynamics and relations with climate over China’s landmass from 1982 to 2011. Remote Sens. 2014, 6, 3263–3283. [Google Scholar] [CrossRef]
- White, M.A.; Beurs, D.; Kirsten, M.; Didan, K.; Inouye, D.W.; Richardson, A.D.; Jensen, O.P.; O’Keefe, J.; Zhang, G.; Nemani, R.R. Intercomparison, interpretation, and assessment of spring phenology in North America estimated from remote sensing for 1982–2006. Glob. Chang. Biol. 2009, 15, 2335–2359. [Google Scholar] [CrossRef]
- Braswell, B.; Schimel, D.; Linder, E.; Moore, B. The response of global terrestrial ecosystems to interannual temperature variability. Science 1997, 278, 870–873. [Google Scholar] [CrossRef]
- Horion, S.; Fensholt, R.; Tagesson, T.; Ehammer, A. Using Earth Observation-based dry season NDVI trends for assessment of changes in tree cover in the Sahel. Int. J. Remote Sens. 2014, 35, 2493–2515. [Google Scholar] [CrossRef]
- Liu, X.; Zhang, J.; Zhu, X.; Pan, Y.; Liu, Y.; Zhang, D.; Lin, Z. Spatiotemporal changes in vegetation coverage and its driving factors in the three-river headwaters region during 2000–2011. J. Geogr. Sci. 2014, 24, 288–302. [Google Scholar] [CrossRef]
- Xu, L.; Myneni, R.B.; Chapin, F.S., III; Callaghan, T.V.; Pinzon, J.E.; Tucker, C.J.; Zhu, Z.; Bi, J.; Ciais, P.; Tømmervik, H.; et al. Temperature and vegetation seasonality diminishment over northern lands. Nat. Clim. Chang. 2013, 3, 581–586. [Google Scholar] [CrossRef]
- Jeong, S.J.; Ho, C.H.; Gim, H.J.; Brown, M.E. Phenology shifts at start vs. end of growing season in temperate vegetation over the northern hemisphere for the period 1982–2008. Glob. Chang. Biol. 2011, 17, 2385–2399. [Google Scholar] [CrossRef]
- Cong, N.; Wang, T.; Nan, H.; Ma, Y.; Wang, X.; Myneni, R.B.; Piao, S. Changes in satellite-derived spring vegetation green-up date and its linkage to climate in China from 1982 to 2010: A multimethod analysis. Glob. Chang. Biol. 2013, 19, 881–891. [Google Scholar] [CrossRef] [PubMed]
- An, Y.; Gao, W.; Gao, Z. Characterizing land condition variability in northern China from 1982 to 2011. Environ. Earth Sci. 2013, 72, 663–676. [Google Scholar] [CrossRef]
- Xiao, J.; Moody, A. Trends in vegetation activity and their climatic correlates: China 1982 to 1998. Int. J. Remote Sens. 2004, 25, 5669–5689. [Google Scholar] [CrossRef]
- Piao, S. Interannual variations of monthly and seasonal normalized difference vegetation index (NDVI) in China from 1982 to 1999. J. Geophys. Res. 2003, 108. [Google Scholar] [CrossRef]
- Tucker, C.J.; Slayback, D.A.; Pinzon, J.E.; Los, S.O.; Myneni, R.B.; Taylor, M.G. Higher northern latitude normalized difference vegetation index and growing season trends from 1982 to 1999. Int. J. Biometeorol. 2001, 45, 184–190. [Google Scholar] [CrossRef] [PubMed]
- Pettorelli, N.; Vik, J.O.; Mysterud, A.; Gaillard, J.-M.; Tucker, C.J.; Stenseth, N.C. Using the satellite-derived NDVI to assess ecological responses to environmental change. Trends Ecol. Evol. 2005, 20, 503–510. [Google Scholar] [CrossRef] [PubMed]
- Propastin, P.; Kappas, M.; Muratova, N. Inter-annual changes in vegetation activities and their relationship to temperature and precipitation in central Asia from 1982 to 2003. J. Environ. Inform. 2008, 12, 75–87. [Google Scholar] [CrossRef]
- Piao, S.; Mohammat, A.; Fang, J.; Cai, Q.; Feng, J. Ndvi-based increase in growth of temperate grasslands and its responses to climate changes in China. Glob. Environ. Change 2006, 16, 340–348. [Google Scholar] [CrossRef]
- Meng, M.; Ni, J.; Zong, M. Impacts of changes in climate variability on regional vegetation in China: NDVI-based analysis from 1982 to 2000. Ecol. Res. 2011, 26, 421–428. [Google Scholar] [CrossRef]
- Song, Y.; Ma, M. A statistical analysis of the relationship between climatic factors and the normalized difference vegetation index in China. Int. J. Remote Sens. 2011, 32, 3947–3965. [Google Scholar] [CrossRef]
- Wang, J.; Rich, P.M.; Price, K.P. Temporal responses of NDVI to precipitation and temperature in the Central Great Plains, USA. Int. J. Remote Sens. 2003, 24, 2345–2364. [Google Scholar] [CrossRef]
- Nicholson, S.E.; Davenport, M.L.; Malo, A.R. A comparison of the vegetation response to rainfall in the Sahel and East Africa, using normalized difference vegetation index from NOAA AVHRR. Clim. Change 1990, 17, 209–241. [Google Scholar] [CrossRef]
- Xiao, X.; Ojima, D.S.; Parton, W.J.; Chen, Z.; Chen, D. Sensitivity of Inner Mongolia grasslands to climate change. J. Biogeogr. 1995, 22, 643–648. [Google Scholar] [CrossRef]
- Chuai, X.W.; Huang, X.J.; Wang, W.J.; Bao, G. NDVI, temperature and precipitation changes and their relationships with different vegetation types during 1998–2007 in Inner Mongolia, China. Int. J. Climatol. 2013, 33, 1696–1706. [Google Scholar] [CrossRef]
- Miao, L.; Ye, P.; He, B.; Chen, L.; Cui, X. Future climate impact on the desertification in the dry land Asia using AVHRR GIMMS NDVI3g data. Remote Sens. 2015, 7, 3863–3877. [Google Scholar] [CrossRef]
- Fabricante, I.; Oesterheld, M.; Paruelo, J. Annual and seasonal variation of NDVI explained by current and previous precipitation across northern Patagonia. J. Arid Environ. 2009, 73, 745–753. [Google Scholar] [CrossRef]
- Mueller, T.; Dressler, G.; Tucker, C.; Pinzon, J.; Leimgruber, P.; Dubayah, R.; Hurtt, G.; Böhning-Gaese, K.; Fagan, W. Human land-use practices lead to global long-term increases in photosynthetic capacity. Remote Sens. 2014, 6, 5717–5731. [Google Scholar] [CrossRef]
- Omuto, C.; Vargas, R.; Alim, M.; Paron, P. Mixed-effects modelling of time series NDVI-rainfall relationship for detecting human-induced loss of vegetation cover in drylands. J. Arid Environ. 2010, 74, 1552–1563. [Google Scholar] [CrossRef]
- Li, H.; Yang, X. Temperate dryland vegetation changes under a warming climate and strong human intervention-with a particular reference to the District Xilin Gol, Inner Mongolia, China. Catena 2014, 119, 9–20. [Google Scholar] [CrossRef]
- Tian, H.; Cao, C.; Chen, W.; Bao, S.; Yang, B.; Myneni, R.B. Response of vegetation activity dynamic to climatic change and ecological restoration programs in Inner Mongolia from 2000 to 2012. Ecol. Eng. 2015, 82, 276–289. [Google Scholar] [CrossRef]
- Savitzky, A.; Golay, M.J. Smoothing and differentiation of data by simplified least squares procedures. Anal. Chem. 1964, 36, 1627–1639. [Google Scholar] [CrossRef]
- Liu, Y.; Lu, S.; Chen, Y. Spatio-temporal change of urban–rural equalized development patterns in China and its driving factors. J. Rural. Stud. 2013, 32, 320–330. [Google Scholar] [CrossRef]
- Carter, C.A.; Zhong, F.; Zhu, J. Advances in Chinese agriculture and its global implications. Appl. Econ. Perspect. Policy 2012, 34, 1–36. [Google Scholar] [CrossRef]
- Duan, H.; Yan, C.; Tsunekawa, A.; Song, X.; Li, S.; Xie, J. Assessing vegetation dynamics in the three-north shelter forest region of China using AVHRR NDVI data. Environ. Earth Sci. 2011, 64, 1011–1020. [Google Scholar] [CrossRef]
- De Jong, R.; de Bruin, S.; de Wit, A.; Schaepman, M.E.; Dent, D.L. Analysis of monotonic greening and browning trends from global NDVI time-series. Remote Sens. Environ. 2011, 115, 692–702. [Google Scholar] [CrossRef] [Green Version]
- Weiss, E.; Marsh, S.; Pfirman, E. Application of NOAA-AVHRR NDVI time-series data to assess changes in Saudi Arabia’s rangelands. Int. J. Remote Sens. 2001, 22, 1005–1027. [Google Scholar] [CrossRef]
- Evans, J.; Geerken, R. Discrimination between climate and human-induced dryland degradation. J. Arid Environ. 2004, 57, 535–554. [Google Scholar] [CrossRef]
- Wessels, K.; Prince, S.; Malherbe, J.; Small, J.; Frost, P.; VanZyl, D. Can human-induced land degradation be distinguished from the effects of rainfall variability? A case study in South Africa. J. Arid Environ. 2007, 68, 271–297. [Google Scholar] [CrossRef]
- Jiang, N.; Zhu, W.; Zheng, Z.; Chen, G.; Fan, D. A comparative analysis between GIMSS NDVIg and NDVI3g for monitoring vegetation activity change in the northern hemisphere during 1982–2008. Remote Sens. 2013, 5, 4031–4044. [Google Scholar] [CrossRef]
- Chen, J.; Jönsson, P.; Tamura, M.; Gu, Z.; Matsushita, B.; Eklundh, L. A simple method for reconstructing a high-quality NDVI time-series data set based on the Savitzky–Golay filter. Remote Sens. Environ. 2004, 91, 332–344. [Google Scholar] [CrossRef]
- Hird, J.N.; McDermid, G.J. Noise reduction of NDVI time series: An empirical comparison of selected techniques. Remote Sens. Environ. 2009, 113, 248–258. [Google Scholar] [CrossRef]
- Roerink, G.; Menenti, M.; Verhoef, W. Reconstructing cloudfree NDVI composites using Fourier analysis of time series. Int. J. Remote Sens. 2000, 21, 1911–1917. [Google Scholar] [CrossRef]
- Jönsson, P.; Eklundh, L. TIMESAT—A program for analyzing time-series of satellite sensor data. Comput. Geosci. 2004, 30, 833–845. [Google Scholar] [CrossRef]
- Swets, D.L.; Reed, B.C.; Rowland, J.D.; Marko, S.E. A weighted least-squares approach to temporal NDVI smoothing. In Proceedings of the 1999 American Society for Photogrammetry and Remote Sensing (ASPRS) Annual Conference, Portland, OR, USA, 17–21 May 1999.
- Harris, I.; Jones, P.; Osborn, T.; Lister, D. Updated highresolution grids of monthly climatic observations—The CRU TS3. 10 Dataset. Int. J. Climatol. 2014, 34, 623–642. [Google Scholar] [CrossRef] [Green Version]
- Ichii, K.; Kawabata, A.; Yamaguchi, Y. Global correlation analysis for NDVI and climatic variables and NDVI trends: 1982–1990. Int. J. Remote Sens. 2002, 23, 3873–3878. [Google Scholar] [CrossRef]
- Wu, D.; Wu, H.; Zhao, X.; Zhou, T.; Tang, B.; Zhao, W.; Jia, K. Evaluation of spatiotemporal variations of global fractional vegetation cover based on GIMMS NDVI data from 1982 to 2011. Remote Sens. 2014, 6, 4217–4239. [Google Scholar] [CrossRef]
- Keys, R. Cubic convolution interpolation for digital image processing. IEEE Trans. Acoust. 1981, 29, 1153–1160. [Google Scholar] [CrossRef]
- Liu, J.; Liu, M.; Tian, H.; Zhuang, D.; Zhang, Z.; Zhang, W.; Tang, X.; Deng, X. Spatial and temporal patterns of China’s cropland during 1990–2000: An analysis based on Landsat TM data. Remote Sens. Environ. 2005, 98, 442–456. [Google Scholar] [CrossRef]
- Reed, B.C.; Brown, J.F.; VanderZee, D.; Loveland, T.R.; Merchant, J.W.; Ohlen, D.O. Measuring phenological variability from satellite imagery. J. Veg. Sci. 1994, 5, 703–714. [Google Scholar] [CrossRef]
- Beurs, K.M.D.; Henebry, G.M. Northern annular mode effects on the land surface phenologies of northern Eurasia. J. Clim. 2008, 21, 4257–4279. [Google Scholar] [CrossRef]
- Van Leeuwen, W.J. Monitoring the effects of forest restoration treatments on post-fire vegetation recovery with MODIS multitemporal data. Sensors 2008, 8, 2017–2042. [Google Scholar] [CrossRef]
- Moulin, S.; Kergoat, L.; Viovy, N.; Dedieu, G. Global-scale assessment of vegetation phenology using NOAA/AVHRR satellite measurements. J. Clim. 1997, 10, 1154–1170. [Google Scholar] [CrossRef]
- Piao, S.; Fang, J.; Zhou, L.; Ciais, P.; Zhu, B. Variations in satellite-derived phenology in China’s temperate vegetation. Glob. Chang. Biol. 2006, 12, 672–685. [Google Scholar] [CrossRef]
- Xin, J.; Yu, Z.; van Leeuwen, L.; Driessen, P.M. Mapping crop key phenological stages in the North China Plain using NOAA time series images. Int. J. Appl. Earth. Obs. Geoinf. 2002, 4, 109–117. [Google Scholar] [CrossRef]
- Tao, F.; Yokozawa, M.; Xu, Y.; Hayashi, Y.; Zhang, Z. Climate changes and trends in phenology and yields of field crops in China, 1981–2000. Agric. For. Meteorol. 2006, 138, 82–92. [Google Scholar] [CrossRef]
- Aiken, L.S.; West, S.G.; Reno, R.R. Multiple Regression: Testing and Interpreting Interactions; Sage Press: London, UK, 1991. [Google Scholar]
- Wang, H.; Chen, A.; Wang, Q.; He, B. Drought dynamics and impacts on vegetation in China from 1982 to 2011. Ecol. Eng. 2015, 75, 303–307. [Google Scholar] [CrossRef]
- Jobbágy, E.G.; Sala, O.E.; Paruelo, J.M. Patterns and controls of primary production in the patagonian steppe: A remote sensing approach. Ecology 2002, 83, 307–319. [Google Scholar]
- Wang, Z.; Zhang, B.; Zhang, S.; Li, X.; Liu, D.; Song, K.; Li, J.; Li, F.; Duan, H. Changes of land use and of ecosystem service values in Sanjiang Plain, Northeast China. Environ. Monit. Assess. 2006, 112, 69–91. [Google Scholar] [CrossRef] [PubMed]
- Zhang, T.H.; Zhao, H.L.; Li, S.G.; Li, F.R.; Shirato, Y.; Ohkuro, T.; Taniyama, I. A comparison of different measures for stabilizing moving sand dunes in the Horqin Sandy Land of Inner Mongolia, China. J. Arid Environ. 2004, 58, 203–214. [Google Scholar] [CrossRef]
- Li, Y.; Cui, J.; Zhang, T.; Okuro, T.; Drake, S. Effectiveness of sand-fixing measures on desert land restoration in Kerqin Sandy Land, Northern China. Ecol. Eng. 2009, 35, 118–127. [Google Scholar] [CrossRef]
- Nin-Pratt, A.; Yu, B.; Fan, S. Comparisons of agricultural productivity growth in China and India. J. Prod. Anal. 2010, 33, 209–223. [Google Scholar] [CrossRef]
© 2015 by the authors; licensee MDPI, Basel, Switzerland. This article is an open access article distributed under the terms and conditions of the Creative Commons Attribution license (http://creativecommons.org/licenses/by/4.0/).
Share and Cite
Qu, B.; Zhu, W.; Jia, S.; Lv, A. Spatio-Temporal Changes in Vegetation Activity and Its Driving Factors during the Growing Season in China from 1982 to 2011. Remote Sens. 2015, 7, 13729-13752. https://0-doi-org.brum.beds.ac.uk/10.3390/rs71013729
Qu B, Zhu W, Jia S, Lv A. Spatio-Temporal Changes in Vegetation Activity and Its Driving Factors during the Growing Season in China from 1982 to 2011. Remote Sensing. 2015; 7(10):13729-13752. https://0-doi-org.brum.beds.ac.uk/10.3390/rs71013729
Chicago/Turabian StyleQu, Bo, Wenbin Zhu, Shaofeng Jia, and Aifeng Lv. 2015. "Spatio-Temporal Changes in Vegetation Activity and Its Driving Factors during the Growing Season in China from 1982 to 2011" Remote Sensing 7, no. 10: 13729-13752. https://0-doi-org.brum.beds.ac.uk/10.3390/rs71013729