Communication

Investigating Bi-Temporal Hyperspectral Lidar Measurements from Declined Trees—Experiences from Laboratory Test

1
Department of Forest Sciences, University of Helsinki, FI-00014 Helsinki, Finland
2
Centre of Excellence in Laser Scanning Research, Finnish Geospatial Research Institute (FGI), FI-02431 Masala, Finland
3
Finnish Geospatial Research Institute (FGI), FI-02431 Masala, Finland
*
Author to whom correspondence should be addressed.
Remote Sens. 2015, 7(10), 13863-13877; https://0-doi-org.brum.beds.ac.uk/10.3390/rs71013863
Submission received: 6 July 2015 / Revised: 7 October 2015 / Accepted: 16 October 2015 / Published: 22 October 2015
(This article belongs to the Special Issue Remote Sensing of Forest Health)

Abstract

:
Global warming is posing a threat to the health and condition of forests as the amount and length of biotic and abiotic disturbances increase. Most methods for detecting disturbances and measuring forest health are based on multi- and hyperspectral imaging. We conducted a test with spruce and pine trees using a hyperspectral Lidar instrument in a laboratory to determine the capability of combined range and reflectance measurements to investigate forest health. A simple drought treatment was conducted by leaving the harvested trees outdoors without a water supply for 12 days. The results showed statistically significant variation in reflectance after the drought treatment for both species. However, the changes differed between the species, indicating that drought-induced alterations in spectral characteristics may be species-dependent. Based on our results, hyperspectral Lidar has the potential to detect drought in spruce and pine trees.

Graphical Abstract

1. Introduction

The Earth’s warming climate is posing a threat to the health and condition of forests, particularly boreal forests, which are one of the Earth’s ecosystems predicted to be most affected by climate change [1,2]. The rising temperature increases the amount and length of drought periods, which, along with other climate-induced and biotic disturbances (e.g., pest insects and wind damage), result in increased forest damage and decreased biomass accumulation [3,4,5,6,7,8]. However, the lack of adequate data on forest health status hinders the understanding of climate change risks for forests; thus, more accurate forest health data are needed in climate change modeling [3]. Declined trees are more susceptible to damage—caused by, for example, drought and pest insects—than healthy, vigorous trees; thus, early detection is vital in reducing the spread of infections [9,10,11]. In preemptive attempts to avoid tree die-off during disturbance periods, novel methods are required to accurately monitor declined trees.
Spectral absorbance can be measured using active or passive multi- or hyperspectral remote sensing. Passive hyperspectral sensors measure light energy that originates from the sun and is then reflected from targets on the ground to the sensor. Passive hyperspectral sensors are able to distinguish reflected energy on several tens or hundreds of bands, locating usually between 400 nm and 2500 nm wavelengths. However, passive sensors are highly influenced by illumination, atmospheric absorbance, viewing geometry, canopy structure and understory vegetation reflection, which makes processing of the data complicated [12,13,14]. Active multi- and hyperspectral remote sensing methods are based on detecting energy that is emitted from the sensor and reflected back from a target object. Thus, they are not affected by prevailing illumination conditions simplifying processing of the data.
Lidar (light detection and ranging) is an efficient active remote sensing technique to measure vegetation structure and biomass [15]. Lidar pulses are able to penetrate through the vegetation canopy, enabling simultaneous point cloud collection from multiple vegetation layers as well as ground level. Therefore, airborne, terrestrial and spaceborne scanning Lidar are widely used to collect forest structural parameters [16,17,18,19,20]. However, most of the current Lidar sensors provide only a 3D point cloud collected using a single wavelength and with an uncalibrated intensity information. The restricted information on the spectral characteristics of target objects limits the efficient classification or estimation of vegetation biochemical parameters [21,22].
Spectral characteristics of vegetation could be mapped with Lidar by using multiple wavelengths simultaneously. The concept of a multispectral full waveform canopy Lidar has been tested by simulating return waveforms using models of tree structure and leaf optical properties. Simulated multispectral Lidar was able to separate canopy and understory signals [23]. Respectively, Suomalainen et al. [24] has demonstrated the use of a simulated hyperspectral Lidar in classification of needles and branches [24]. Terrestrial dual-wavelength Lidar systems, operating at 1064 nm and 1540 nm wavelengths, have been developed and tested in laboratory conditions [25,26]. The first prototype of a full waveform hyperspectral Lidar instrument utilizing a supercontinuum laser source has been developed and constructed at the Finnish Geospatial Research Institute [27]. The hyperspectral Lidar sensor emits broadband light energy (laser pulses), and backscattered energy is reflected from the target object to the sensor, enabling simultaneous distance and reflectance measurements [27]. The instrument can produce 3-D point clouds with backscattered reflectance information on eight spectral channels between 554.8 nm and 1000.4 nm [27]. As an active remote-sensing method, spectra acquired with a multi- or hyperspectral Lidar are not affected by illumination conditions or shadows, which is an advantage over passive sensors.
The mapping of declined trees with remote sensing requires a detectable indicator of health condition. Weakened water balance can be an indicator of a declined tree, as drought results in changes in leaf biochemical properties that affect leaves’ spectral absorbance properties [28,29]. The strongest changes in spectral absorbance can be detected at water absorption bands located at 970 nm, 1200 nm, 1440 nm and 1950 nm [30,31]. Generally, the near- and shortwave infrared wavelength regions are considered to be most subject to variation due to alterations in leaf water content.
For example, vegetation indices (VI) calculated as ratios of reflectance between spectral bands can be used in the monitoring of changes in the spectral absorbance properties of plants as well. When VIs are calculated, one band is located in a wavelength area affected by the variable of interest and the other band is used as a reference band. Several vegetation indices have been developed and used to assess plant water status with hyperspectral measurements, such as the water band index (WBI), which is based on the assumption that reflectance decreases in 950–970 nm region as drought increases [32]. Gao [33] has developed a normalized difference water index for remote sensing of vegetation liquid water from space that uses 860 nm and 1240 nm bands [33]. It should be pointed out that canopy structure and species can affect the choice of optimal wavelength regions for water-status monitoring [31,34].
The detection of vegetation drought has been studied widely with passive multispectral remote-sensing data at scales varying from a single leaf to even a global scale. Large-scale detection and mapping of the temporal and spatial characteristics of drought have been investigated using the Advanced Very High Resolution Radiometer (AVHRR)-based vegetation and temperature indices with low resolution (14 km), resulting in high potential of the indices [35,36,37,38]. Landsat Thematic Mapper (TM) and Enhanced Thematic Mapper Plus (ETM+) data with medium resolution (30 m) have been used to calculate the normalized difference water index, revealing dying forest areas with an overall accuracy of 76% [39]. Satellite-based remote sensing is suitable for large-scale drought monitoring at national and regional levels in countries where extensive forest management is applied. For example, drought maps can be used as input data for modeling (e.g., forest fires, insects and disease risk) at a resolution of more than 30 m.
Higher spatial resolution remote-sensing data are required for detecting subtle changes in canopy biochemistry and structure [13]. Detailed mapping of declined trees or small groups of trees suffering from drought is needed for preemptive risk and damage management in countries where intensive small-scale forest management is applied. Small groups of trees susceptible to pest colonization need to be identified to avoid widespread damage. Detailed forest health maps can assist in allocating operational forest management activities in high-risk areas and can be used as training data for low-resolution satellite sensors to improve the accuracy of large-area forest health monitoring. Studies using spatially higher resolution data have been conducted using airborne and terrestrial remote sensing [40,41]. An unmanned aerial vehicle (UAV) platform with a micro-hyperspectral imager and a thermal camera with high resolution (40 cm) has been used to detect water stress in a citrus orchard, resulting in temperature indices and a photochemical reflectance index (PRI) yielding the best results [42]. Lidar and hyperspectral data fusion have been shown to be able to provide information on canopy stress [43]. The potential for using dual-wavelength Lidar in the detection of vegetation water content has been shown by Gaulton et al. [44]. Hyperspectral Lidar has been used previously to estimate leaf levels of chlorophyll, also an indicator of tree health, with high accuracy in Scots pine shoots (R2 = 0.88) [45].
The aim of the study was to investigate the capability of active hyperspectral Lidar measurements in tree-drought detection at the canopy scale. Here, nine Norway spruces and nine Scots pines were measured horizontally in a laboratory, simulating an airborne data acquisition with hyperspectral Lidar, 1–2 days after harvesting and again after 12 days of drought without a water supply. The hyperspectral Lidar used in the study had eight spectral channels from 554.8 nm to 1000.4 nm; thus, measurements were limited to visible and near-infrared regions. Changes in reflectance of different return types for each of the eight channels were examined, and a normalized difference vegetation index (NDVI) and a modified water index (WI) were calculated for each return to examine their capability of detecting the declined trees. Our hypothesis was that drought-induced changes in spectral reflectance could be detected with hyperspectral Lidar measurements. However, this study should be treated as a preliminary test because the lack of biophysical measurements and the size of the sample hindered our ability to make further conclusions; therefore, this paper is an introduction to further studies in developing methods for detecting declined trees using multispectral Lidar measurements. Similar tests need to be conducted with a larger dataset, both in laboratory and field conditions, including reference measurements of plant water content.

2. Material and Methods

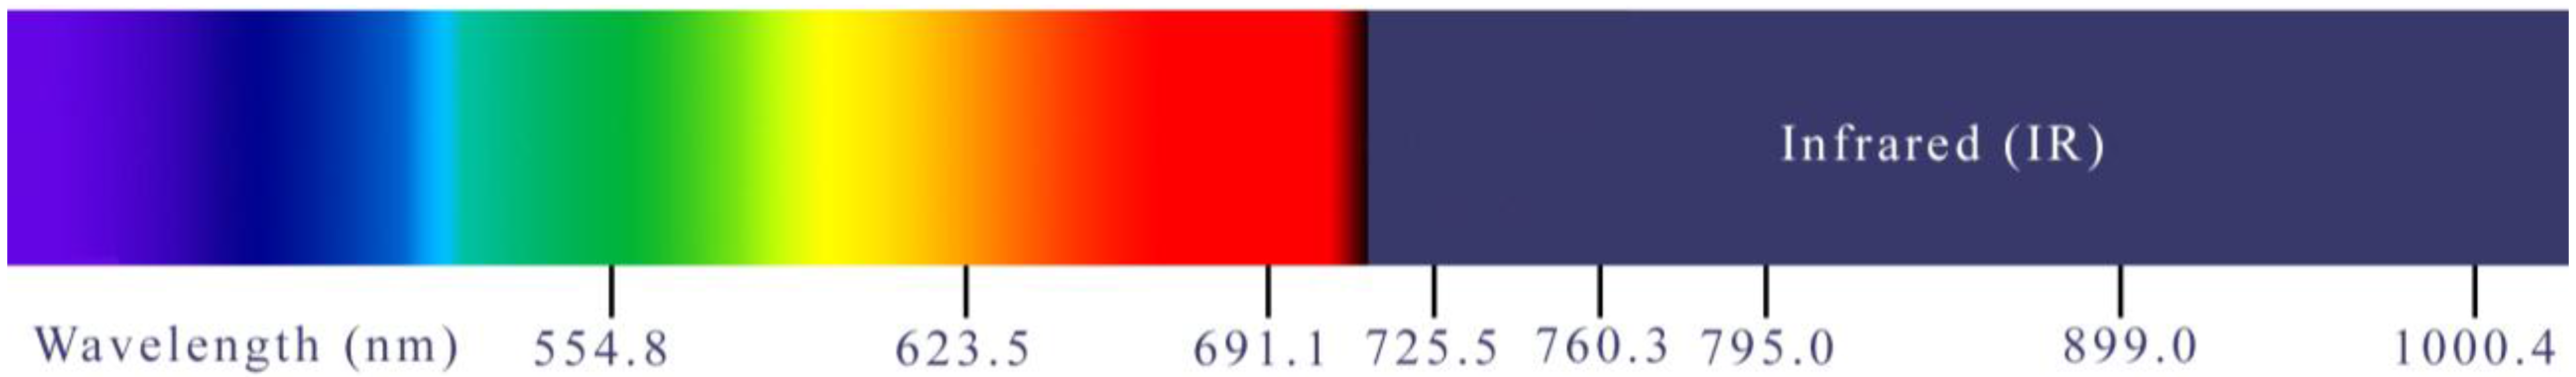
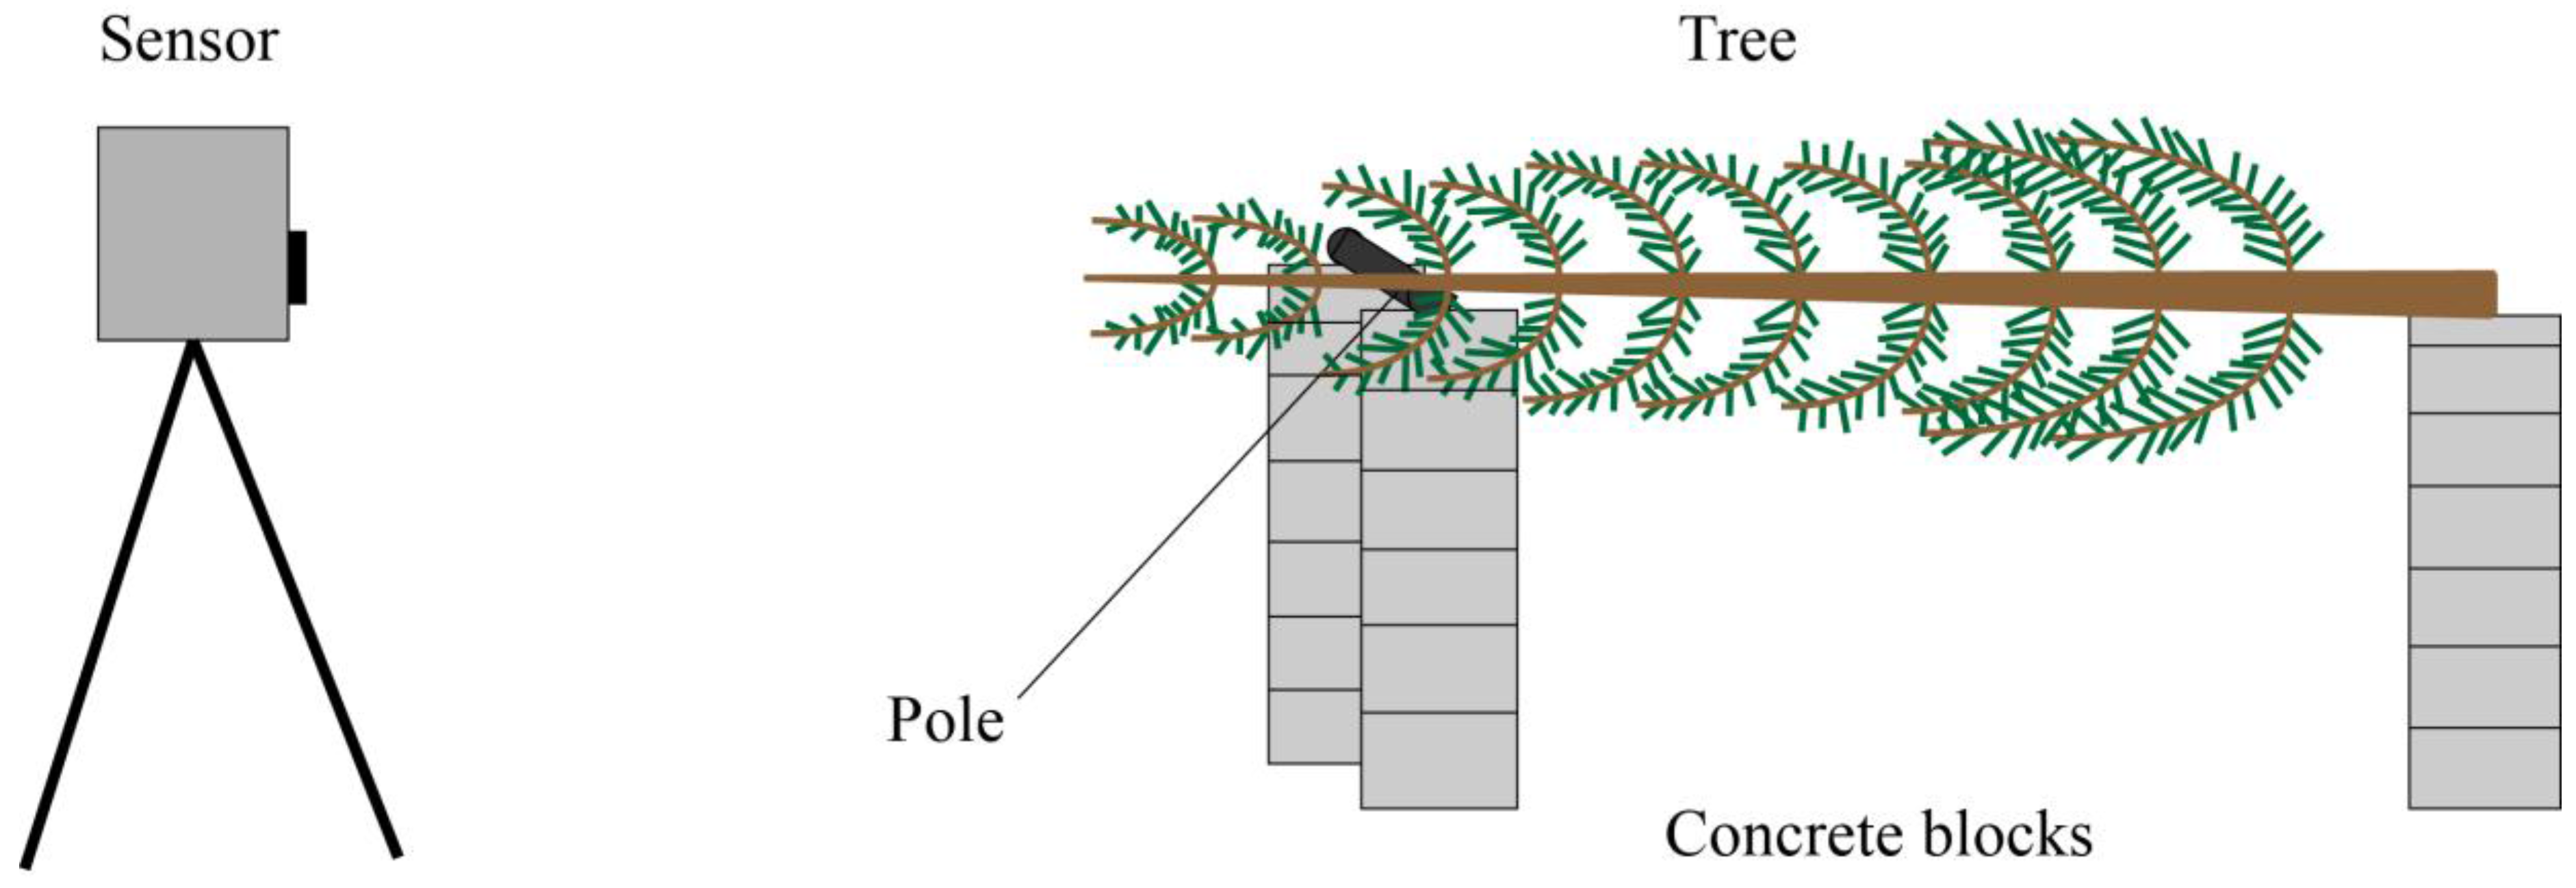
2.1. Hyperspectral Lidar Measurements

Full waveform hyperspectral Lidar is an instrument for measuring geometry and backscattered reflectance at several wavelengths simultaneously. The instrument uses a supercontinuum laser source, which sends nanosecond pulses of broadband white light. The echo waveform can be measured for each pulse with multiple wavelength channels. The design of the instrument has been described in detail by Hakala et al. [27].
The trees were measured in a laboratory under environmentally stable conditions with eight spectral channels (554.8, 623.5, 691.1, 725.5, 760.3, 795.0, 899.0 and 1000.4 nm, and full width at half maximum of 17–19 nm) from a 3-meter distance from the top of the tree (Figure 1). The diameter of the laser beam was about 4 mm at target, and divergence was 0.02°. The trees were positioned horizontally with the base of the tree on a concrete block and a plastic pole supporting the tree trunk so that the top of the canopy was pointing toward the scanner, simulating an airborne data acquisition, and each tree was measured separately (Figure 2). About 100,000 returns were recorded for each tree, depending on the tree size, with a maximum of two returns recorded for each pulse. The 3-D point clouds represent the whole trees, i.e., no effort was made to classify the data into branches and needles.
Figure 1. The spectral channels of the hyperspectral Lidar on electromagnetic spectrum.
Remotesensing 07 13863 g001
Figure 2. A schematic figure describing the experiment setting. The figure is not to scale.
Remotesensing 07 13863 g002
The trees, which were 3–3.5 meters in height and 5–6 cm in diameter at breast height, were cut and harvested 1–2 days before the measurements. The set of nine pine and nine spruce trees was first measured on 16 May 2012, and then again on 29 May 2012. As net photosynthesis and stomatal conductance is generally reduced after 2–3 days of drought [46], a drought treatment was conducted by leaving the harvested trees outdoors to lean against a wall in an upright position for 12 days with their bases lying on grass surface. The trees are referred to as “fresh trees” before the drought treatment and as “dry trees” after the treatment in the following text. Mean temperature during the treatment was 14 °C, and mean relative humidity was 59% (Figure 3). No measurements of leaf water content or water potential were conducted. The data were processed with Gaussian pulse fitting and calibrated to the backscattered reflectance factor using a reference target [27].
Figure 3. Relative humidity and temperature near the study site during the drought treatment.
Remotesensing 07 13863 g003

2.2. Analysis of Spectral Characteristics

Statistics were calculated from the reflectance value distributions for each tree in return type categories to describe and compare the distribution of the reflectance values in each sample (Table 1). These features were the mean, standard deviation, and quantiles 0 (minimum), 25, 50 (median), 75 and 100 (maximum) of the reflectance value distributions. The quantiles were calculated as cumulative probabilities from the reflectance value distributions, i.e., which value cuts off the first, e.g., 25%, of the data when it is sorted in ascending order.
Table 1. The return type categories and their descriptions.
Return TypeDescription
SingleLaser pulses that generate only one return from the target.
FirstThe first return from a pulse generating more than a single return.
SecondThe second return from a pulse generating more than a single return.
All-firstSingle and first returns combined as defined above.
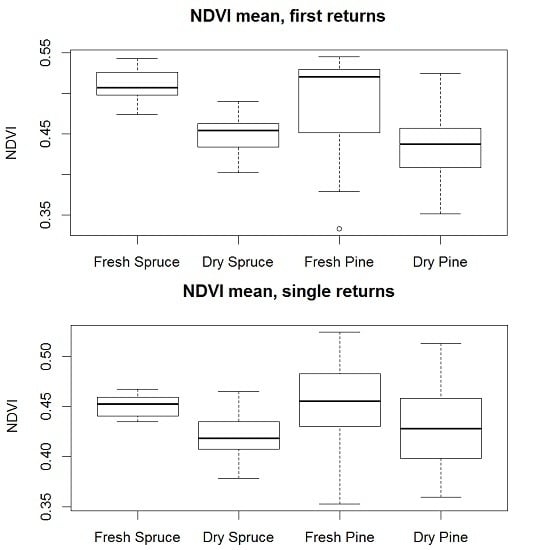
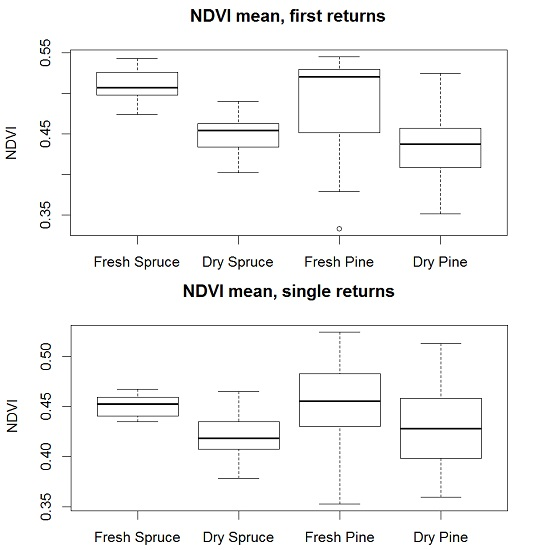
In addition to these features, vegetation indices used previously in drought-detection studies were calculated for each return from their reflectance data. The indices were a normalized difference vegetation index (1) and a modified water index (2) [32,47]. The NDVI is a commonly used multispectral vegetation index based on the difference in canopy reflectance at visible light (400–700 nm) and near-infrared (700–1100 nm) wavelength regions. The NDVI has a greater value for healthy vigorous canopies and a lower value for stressed canopies. We used red at 691.1 nm and near-infrared at 795.0 nm, which have been employed in similar studies before [48,49]. The WI, which utilizes a weak water absorption band at 970 nm and a reference band at 900 nm [50], was developed for estimation of plant water content and water stress at ground level [32]. The index was modified and a water absorption band at 1000.4 nm was used instead of 970 nm, which was not available. The same statistical features were calculated for NDVI and WI as for the reflectance value distributions.
Paired-sample and one-tailed t-tests were then used to test whether there were statistically significant differences in the reflectance values between the scans at tree level and to determine the direction of change in the reflectance values after the drought treatment. As the sample size was small and groups of nine samples were compared, the statistical results were validated with a non-parametric Wilcoxon signed-rank test for the group differences.
NDVI = (R795.0 − R691.1)/( R795.0 + R691.1)
WI = R1000.4/(R899)

3. Results

The return-type distributions were statistically different (p < 0.05) after the treatment of both species. The percentage of single returns increased in the pines as opposed to a decrease in first returns and a slight decrease in second returns (Table 2). The effect of the treatment on return-type distribution was different for the spruces, as the percentage of single returns decreased after the treatment but the share of first returns increased significantly.
Table 2. The percentage of each return type in the point clouds for each species before and after the drought treatment calculated from all measurements (n = 36).
Measurement/Return typeSingle (%)All-First (%)First (%)Second (%)
Pine fresh69.091.021.99.0
Pine dry72.591.519.08.5
Spruce fresh71.691.019.49.0
Spruce dry67.291.224.08.8
Note: All-first returns include both single and first returns.
Statistically significant differences were detected in reflectance after the treatment (Figure 4). The greatest changes in spectral reflectance were detected in the near-infrared region (NIR) bands from 725.5 nm to 1000.4 nm for both species. The reflectance of these bands varied more than bands in the visible light spectrum. A statistically significant increase in reflectance throughout the spectrum was detected in the pines using single and all-first returns while first and second returns measured a statistically significant increase in reflectance in the visible light and NIR regions from 554.8 nm to 725.5 nm. In the spruces, a significant decrease in reflectance in the NIR region from 725.5 nm to 795 nm was detected using all return types, while significant changes were detected in reflectance in the visible light region from 623.5 nm to 691.1 nm using only second returns.
Figure 4. Means of reflectance for the return types and their standard deviations (vertical bars) for each spectral channel. Black lines represent fresh trees, and red lines represent dry trees (drought induced trees).
Remotesensing 07 13863 g004
Statistically significant decreases (p < 0.05) were detected in NDVI mean for all return types after the drought treatment, except second returns for both species (Figure 5). First returns showed the strongest difference in NDVI values between the fresh and dry trees following the treatment.
The WI mean showed a statistically significant decrease (p < 0.05) for pines, following the drought treatment, for all-first returns (Figure 6). For pine, quantile 25 of the WI showed a statistically significant decrease for first and second returns, quantile 50 for all return types, quantile 75 for single and all-first returns, and quantile 100 for second returns, respectively. This indicates that the distribution of WI values was altered after the drought treatment, especially between quantiles 25 and 75 of the data, although mean differences were detected only with all-first returns. Spruces did not show the same variation in WI, and no statistically significant changes were detected following the drought treatment.
Figure 5. The normalized difference vegetation index (NDVI) mean calculated from the point clouds for all return types of fresh and dry trees (drought-induced trees). Each box consists of nine values. The black line represents the median of these values.
Remotesensing 07 13863 g005
Figure 6. The water index (WI) statistics calculated from the point clouds with the most significant difference after the treatment for all return types of fresh and dry trees (drought-induced trees). Each box consists of nine values. The black line represents the median of these values.
Remotesensing 07 13863 g006

4. Discussion

Statistically significant changes were detected in spectral reflectance of hyperspectral Lidar pulses after the treatment. However, the changes were opposite for the two species. The reflectance decreased significantly in the NIR bands in the spruces. A similar decrease in reflectance has been associated with forest decline [51]. The effect of the treatment was opposite for the pines, whose reflectance increased across all eight bands. Dried pine needles have been shown to have higher reflectance than fresh needles [28]. Similar results have been shown for several other species [52,53]. Increased reflectance in the pines could partially derive from physical effects such as the stature of needles being different after the treatment. Drought results in a decrease in xylem pressure, which can induce conduit wall collapse in the needles and loss of rigidity [11,54]. The needles were closer to each other, allowing more needles to fall under the laser beam, increasing reflectance and probability of a single return compared to the first measurement. The small size of the laser beam at target enables the beam to be entirely obstructed by canopy vegetation, resulting in a single return [55]. This phenomenon was also observed in return-type distributions, as the proportion of single returns increased and the proportion of first and second returns decreased after the treatment.
The pulse types produced different reflectance values in the measurements, and not all were equal in discriminating changes in reflectance after the treatment. For the spruces, all return types measured a statistically significant decrease in NIR reflectance between 725.5 nm and 795 nm, while only second returns were able to detect statistically significant alterations in visible light spectrum from 623.5 nm to 691.1 nm. As spruce needles are small, the laser hits from the needles probably created multiple echoes, explaining the greater change in reflectance of first and second returns [55]. For the pines, all-first returns and single returns had significantly higher reflectance after the treatment across all eight wavelength bands, while first and second returns were not altered in a statistically significant manner. This likely was partially due to an increase in the proportion of single returns after the treatment and variation in the stature of the needles, as was discussed before. A similar increase in reflectance along the spectrum has been shown previously due to decreased leaf water content [56].
The NDVI was significantly lower after the drought treatment for both species in all return types except second returns. The NDVI was able to discriminate the dry spruces with all-first, first and single returns, although the reflectance of NIR bands was not significantly altered after the treatment in all-first and single returns. Although the direction of change in reflectance was opposite for the two species, the NDVI performed consistently and seems to not be sensitive to the direction of change in reflectance. The NDVI from multispectral Lidar has shown its potential before by explaining 82% of the variation in foliage nitrogen uptake with seven vegetation species [57]. However, it is unclear how much returns from woody material with varying NDVI values influenced the results. Generally, bark has low NDVI value, but it can be quite variable due to the presence of lichen and moss [44]. Separating returns between leaves and woody material may be possible if the difference in NDVI is clearly distinguishable [26].
The WI mean showed a statistically significant decrease after the treatment for the pines using all-first returns, while first, single and second returns showed statistically significant differences only for quantiles 25, 50, 75 and 100 (second returns only). This indicates that most of the differences in the distribution of WI occurred between quantiles 25 and 75 of the data. This may be due to the heterogeneity of plant material or uneven reduction of moisture content in the canopy, as no effort was made to separate woody material and foliage. Laser returns from woody material have a lower WI because of lower moisture content, and trunk and branches tend to retain moisture for longer time periods than foliage because transpiration occurs through leaves. Therefore, no changes were detected with quantile 0. WI was not a strong classifier for the spruces, indicating that indices for detecting declined trees may be species dependent. Leaf structure (including thickness and internal leaf structure) may affect the variation of spectral reflectance and spectral indices due to decreased leaf water content (an influence that has been shown before [58,59]); thus, the main tree species should be studied for detecting drought-damaged and declined trees in forestry and urban planning. In Scandinavia, this is feasible, as only three tree species (Scots pine, Norway spruce and Silver birch) form the vast majority of forest and commercial timber.
Furthermore, a more detailed study on the effect of multiple scattering of the laser radiation within the canopy and the effect of laser spot size on the needle-level scattering should be carried out to study the effect of the changing canopy structure on the laser returns and the spectral ratios (cf. [60,61]). These effects may have affected the results, decreasing the observed change in spectral ratios due to drought. Previous studies have also indicated that leaf reflectance absorption properties affect the ability to account for leaf angle effects on laser readings [62]. It was shown that higher reflectance increased the ability to account for leaf angle effects, and a choice of wavelengths in the NIR region was discussed, as vegetation reflects NIR radiation efficiently [62]. The first results suggest that spectral indices from multispectral Lidar might be insensitive to range or the target-scattering cross section, but more experiments are needed to confirm this at the canopy scale [44]. The results of this study back up this theory vaguely as the NDVI performed consistently.
Multispectral and hyperspectral Lidar instruments are being developed further, and their use in operational forest and environment monitoring is increasing rapidly. However, the hyperspectral Lidar instrument used in this study is not yet safe for the eyes, limiting its operation outside of laboratories. A multispectral Lidar with three spectral channels by Optech Inc. is being used commercially already, and considering the development pace of Lidar technologies, new instruments will emerge in the markets in the coming years.
Preliminary tests with hyperspectral Lidar showed promising results, indicating that multispectral and hyperspectral Lidar have potential for forest health monitoring. Further studies are needed to investigate the use of spectral indices from multispectral or hyperspectral Lidar in forest health mapping. As was shown here, many uncertainties must be addressed before operational forest health mapping with multispectral Lidar is feasible. Subsequent studies are being planned to address some of these uncertainties.

5. Conclusions

The choice of optimal wavelengths for multispectral Lidar in forest health monitoring needs to be studied. Based on our results, the drought treatment affected spectral reflectance, but the direction of change was opposite for the two species. Reflectance increased significantly in the visible wavelengths for the pines, while the spruces showed less variation in this spectrum. However, the NDVI calculated from the point clouds showed a statistically significant decrease after the drought treatment for both species, indicating that the index is not sensitive to the direction of change in reflectance. This is a promising result as NDVI can be calculated using a dual-wavelength Lidar system, which are already commercially available. The wavelengths of the hyperspectral Lidar instrument were limited to 1000.4 nm; thus, the effect of drought at longer wavelengths in the NIR region will remain a future topic. The availability of wavelengths in commercial Lidar systems is limited, emphasizing the demand of such studies.
The drought treatment resulted in significant changes in reflectance of the trees, particularly in the NIR region. First and single returns detected greater difference in NDVI after the treatment than second returns, indicating that a sensor capable of detecting one return per pulse is sufficient for calculating NDVI. The WI showed statistically significant differences only for pine, and the differences were mainly found using the quantiles of the WI distribution indicating that NDVI performed better in detecting drought of the these two indices. Hyperspectral Lidar showed potential in drought detection of vegetation, but more detailed investigations are needed for quantifying the sensitivity of the instrument for the detection of drought at different scales from leaf to stand level.

Acknowledgments

This work was made possible by the Finnish Society of Forest Science under grant (number 201510040). The Academy of Finland is also acknowledged for its financial support in the form of Centre of Excellence in Laser Scanning Research (CoE-LaSR) (project number 273806).

Author Contributions

Samuli Junttila wrote the first draft of the manuscript and analyzed the data. Sanna Kaasalainen designed the test and contributed to improving the manuscript. Mikko Vastaranta contributed to improving the manuscript and organizing the cooperation between FGI and University of Helsinki. Teemu Hakala and Olli Nevalainen conducted the measurements and processed the data. Markus Holopainen contributed to improving the manuscript.

Conflicts of Interest

The authors declare no conflict of interest.

References

  1. Solomon, S.; Qin, D.; Manning, M.; Chen, Z.; Marquis, M.; Averyt, K.; Tignor, M.; Miller, H. Climate Change 2007: The Physical Science Basis. Agenda 2007, 6, 333. [Google Scholar]
  2. Gitay, H.; Brown, S.; Easterling, W.; Jallow, B.; Antle, J.; Apps, M.; Beamish, R.; Chapin, T.; Cramer, W.; Frangi, J. Ecosystems and Their Goods and Services; Cambridge University Press: New York, NY, USA, 2001. [Google Scholar]
  3. Allen, C.D.; Macalady, A.K.; Chenchouni, H.; Bachelet, D.; McDowell, N.; Vennetier, M.; Kitzberger, T.; Rigling, A.; Breshears, D.D.; Hogg, E. A global overview of drought and heat-induced tree mortality reveals emerging climate change risks for forests. For. Ecol. Manage. 2010, 259, 660–684. [Google Scholar] [CrossRef]
  4. Netherer, S.; Schopf, A. Potential effects of climate change on insect herbivores in european forests—general aspects and the pine processionary moth as specific example. For. Ecol. Manage. 2010, 259, 831–838. [Google Scholar] [CrossRef]
  5. Le Houérou, H.N. Climate change, drought and desertification. J. Arid Environ. 1996, 34, 133–185. [Google Scholar] [CrossRef]
  6. Lindner, M.; Maroschek, M.; Netherer, S.; Kremer, A.; Barbati, A.; Garcia-Gonzalo, J.; Seidl, R.; Delzon, S.; Corona, P.; Kolström, M. Climate change impacts, adaptive capacity, and vulnerability of European forest ecosystems. For. Ecol. Manage. 2010, 259, 698–709. [Google Scholar] [CrossRef]
  7. Overpeck, J.T.; Rind, D.; Goldberg, R. Climate-induced changes in forest disturbance and vegetation. Nature 1990, 343, 51–53. [Google Scholar] [CrossRef]
  8. Hogg, E.; Brandt, J.; Michaelian, M. Impacts of a regional drought on the productivity, dieback, and biomass of western Canadian aspen forests. Can. J. For. Res. 2008, 38, 1373–1384. [Google Scholar] [CrossRef]
  9. Fettig, C.J.; Klepzig, K.D.; Billings, R.F.; Munson, A.S.; Nebeker, T.E.; Negrón, J.F.; Nowak, J.T. The effectiveness of vegetation management practices for prevention and control of bark beetle infestations in coniferous forests of the western and southern United States. For. Ecol. Manage. 2007, 238, 24–53. [Google Scholar] [CrossRef]
  10. Wermelinger, B. Ecology and management of the spruce bark beetle IPS typographus—A review of recent research. For. Ecol. Manage. 2004, 202, 67–82. [Google Scholar] [CrossRef]
  11. Bréda, N.; Huc, R.; Granier, A.; Dreyer, E. Temperate forest trees and stands under severe drought: A review of ecophysiological responses, adaptation processes and long-term consequences. Ann. For. Sci. 2006, 63, 625–644. [Google Scholar] [CrossRef]
  12. Asner, G.P. Biophysical and biochemical sources of variability in canopy reflectance. Remote Sens. Environ. 1998, 64, 234–253. [Google Scholar] [CrossRef]
  13. Dawson, T.; North, P.; Plummer, S.; Curran, P. Forest ecosystem chlorophyll content: Implications for remotely sensed estimates of net primary productivity. Int. J. Remote Sens. 2003, 24, 611–617. [Google Scholar] [CrossRef]
  14. Huete, A.; Jackson, R.; Post, D. Spectral response of a plant canopy with different soil backgrounds. Remote Sens. Environ. 1985, 17, 37–53. [Google Scholar] [CrossRef]
  15. Kankare, V.; Holopainen, M.; Vastaranta, M.; Puttonen, E.; Yu, X.; Hyyppä, J.; Vaaja, M.; Hyyppä, H.; Alho, P. Individual tree biomass estimation using terrestrial laser scanning. ISPRS J. Photogramm. Remote Sens. 2013, 75, 64–75. [Google Scholar] [CrossRef]
  16. Hyyppä, J.; Hyyppä, H.; Leckie, D.; Gougeon, F.; Yu, X.; Maltamo, M. Review of methods of small‐footprint airborne laser scanning for extracting forest inventory data in boreal forests. Int. J. Remote Sens. 2008, 29, 1339–1366. [Google Scholar] [CrossRef]
  17. van Leeuwen, M.; Nieuwenhuis, M. Retrieval of forest structural parameters using Lidar remote sensing. Eur. J. For. Res. 2010, 129, 749–770. [Google Scholar] [CrossRef]
  18. Wulder, M.A.; White, J.C.; Nelson, R.F.; Næsset, E.; Ørka, H.O.; Coops, N.C.; Hilker, T.; Bater, C.W.; Gobakken, T. Lidar sampling for large-area forest characterization: A review. Remote Sens. Environ. 2012, 121, 196–209. [Google Scholar] [CrossRef]
  19. Tang, H.; Dubayah, R.; Brolly, M.; Ganguly, S.; Zhang, G. Large-scale retrieval of leaf area index and vertical foliage profile from the spaceborne waveform Lidar (GLAS/ICESat). Remote Sens. Environ. 2014, 154, 8–18. [Google Scholar] [CrossRef]
  20. Tang, H.; Brolly, M.; Zhao, F.; Strahler, A.H.; Schaaf, C.L.; Ganguly, S.; Zhang, G.; Dubayah, R. Deriving and validating leaf area index (LAI) at multiple spatial scales through Lidar remote sensing: A case study in sierra national forest. Remote Sens. Environ. 2014, 143, 131–141. [Google Scholar] [CrossRef]
  21. Puttonen, E.; Suomalainen, J.; Hakala, T.; Räikkönen, E.; Kaartinen, H.; Kaasalainen, S.; Litkey, P. Tree species classification from fused active hyperspectral reflectance and Lidar measurements. For. Ecol. Manage. 2010, 260, 1843–1852. [Google Scholar] [CrossRef]
  22. Wallace, A.; Nichol, C.; Woodhouse, I. Recovery of forest canopy parameters by inversion of multispectral Lidar data. Remote Sens. 2012, 4, 509–531. [Google Scholar] [CrossRef]
  23. Morsdorf, F.; Nichol, C.; Malthus, T.; Woodhouse, I.H. Assessing forest structural and physiological information content of multi-spectral Lidar waveforms by radiative transfer modelling. Remote Sens. Environ. 2009, 113, 2152–2163. [Google Scholar] [CrossRef] [Green Version]
  24. Suomalainen, J.; Hakala, T.; Kaartinen, H.; Räikkönen, E.; Kaasalainen, S. Demonstration of a virtual active hyperspectral Lidar in automated point cloud classification. ISPRS J. Photogramm. Remote Sens. 2011, 66, 637–641. [Google Scholar] [CrossRef]
  25. Douglas, E.S.; Strahler, A.; Martel, J.; Cook, T.; Mendillo, C.; Marshall, R.; Chakrabarti, S.; Schaaf, C.; Woodcock, C.; Li, Z. In Dwel: A dual-wavelength echidna Lidar for ground-based forest scanning. In Proceedings of 2012 IEEE International Geoscience and Remote Sensing Symposium (IGARSS), Munich, Germany, 22–27 July 2012; pp. 4998–5001.
  26. Danson, F.M.; Gaulton, R.; Armitage, R.P.; Disney, M.; Gunawan, O.; Lewis, P.; Pearson, G.; Ramirez, A.F. Developing a dual-wavelength full-waveform terrestrial laser scanner to characterize forest canopy structure. Agric. For. Meteorol. 2014, 198, 7–14. [Google Scholar] [CrossRef]
  27. Hakala, T.; Suomalainen, J.; Kaasalainen, S.; Chen, Y. Full waveform hyperspectral Lidar for terrestrial laser scanning. Opt. Express 2012, 20, 7119–7127. [Google Scholar] [CrossRef] [PubMed]
  28. Dawson, T.P.; Curran, P.J.; Plummer, S.E. Liberty—modeling the effects of leaf biochemical concentration on reflectance spectra. Remote Sens. Environ. 1998, 65, 50–60. [Google Scholar] [CrossRef]
  29. Breshears, D.D.; Myers, O.B.; Meyer, C.W.; Barnes, F.J.; Zou, C.B.; Allen, C.D.; McDowell, N.G.; Pockman, W.T. Tree die-off in response to global change-type drought: Mortality insights from a decade of plant water potential measurements. Front. Ecol. Environ. 2008, 7, 185–189. [Google Scholar] [CrossRef]
  30. Eitel, J.U.; Gessler, P.E.; Smith, A.M.; Robberecht, R. Suitability of existing and novel spectral indices to remotely detect water stress in populus spp. For. Ecol. Manage. 2006, 229, 170–182. [Google Scholar] [CrossRef]
  31. Sims, D.A.; Gamon, J.A. Estimation of vegetation water content and photosynthetic tissue area from spectral reflectance: A comparison of indices based on liquid water and chlorophyll absorption features. Remote Sens. Environ. 2003, 84, 526–537. [Google Scholar] [CrossRef]
  32. Penuelas, J.; Filella, I.; Biel, C.; Serrano, L.; Save, R. The reflectance at the 950–970 nm region as an indicator of plant water status. Int. J. Remote Sens. 1993, 14, 1887–1905. [Google Scholar] [CrossRef]
  33. Gao, B.-C. NDWI—a normalized difference water index for remote sensing of vegetation liquid water from space. Remote Sens. Environ. 1996, 58, 257–266. [Google Scholar] [CrossRef]
  34. Poulos, H.; Goodale, U.; Berlyn, G. Drought response of two mexican oak species, quercus laceyi and q. Sideroxyla (fagaceae), in relation to elevational position. Am. J. Bot. 2007, 94, 809–818. [Google Scholar] [CrossRef] [PubMed]
  35. Kogan, F. Application of vegetation index and brightness temperature for drought detection. Adv. Space Res. 1995, 15, 91–100. [Google Scholar] [CrossRef]
  36. Singh, R.P.; Roy, S.; Kogan, F. Vegetation and temperature condition indices from NOAA AVHRR data for drought monitoring over India. Int. J. Remote Sens. 2003, 24, 4393–4402. [Google Scholar] [CrossRef]
  37. Unganai, L.S.; Kogan, F.N. Drought monitoring and corn yield estimation in southern Africa from AVHRR data. Remote Sens. Environ. 1998, 63, 219–232. [Google Scholar] [CrossRef]
  38. Seiler, R.; Kogan, F.; Sullivan, J. AVHRR-based vegetation and temperature condition indices for drought detection in Argentina. Adv. Space Res. 1998, 21, 481–484. [Google Scholar] [CrossRef]
  39. Wang, C.; Lu, Z.; Haithcoat, T.L. Using landsat images to detect oak decline in the Mark Twain national forest, Ozark highlands. For. Ecol. Manage. 2007, 240, 70–78. [Google Scholar] [CrossRef]
  40. Römer, C.; Wahabzada, M.; Ballvora, A.; Pinto, F.; Rossini, M.; Panigada, C.; Behmann, J.; Léon, J.; Thurau, C.; Bauckhage, C. Early drought stress detection in cereals: Simplex volume maximisation for hyperspectral image analysis. Funct. Plant. Biol. 2012, 39, 878–890. [Google Scholar] [CrossRef]
  41. Imanishi, J.; Morimoto, Y.; Imanishi, A.; Sugimoto, K.; Isoda, K. The independent detection of drought stress and leaf density using hyperspectral resolution data. Landsc. Ecol. Eng. 2007, 3, 55–65. [Google Scholar] [CrossRef]
  42. Zarco-Tejada, P.J.; González-Dugo, V.; Berni, J.A. Fluorescence, temperature and narrow-band indices acquired from a UAV platform for water stress detection using a micro-hyperspectral imager and a thermal camera. Remote Sens. Environ. 2012, 117, 322–337. [Google Scholar] [CrossRef]
  43. Swatantran, A.; Dubayah, R.; Roberts, D.; Hofton, M.; Blair, J.B. Mapping biomass and stress in the sierra nevada using Lidar and hyperspectral data fusion. Remote Sens. Environ. 2011, 115, 2917–2930. [Google Scholar] [CrossRef]
  44. Gaulton, R.; Danson, F.; Ramirez, F.; Gunawan, O. The potential of dual-wavelength laser scanning for estimating vegetation moisture content. Remote Sens. Environ. 2013, 132, 32–39. [Google Scholar] [CrossRef]
  45. Nevalainen, O.; Hakala, T.; Suomalainen, J.; Mäkipää, R.; Peltoniemi, M.; Krooks, A.; Kaasalainen, S. Fast and nondestructive method for leaf level chlorophyll estimation using hyperspectral Lidar. Agric. For. Meteorol. 2014, 198, 250–258. [Google Scholar] [CrossRef]
  46. Green, T.; Mitchell, R. Effects of nitrogen on the response of loblolly pine to water stress. I. Photosynthesis and stomatal conductance. New Phytol. 1992, 1992, 627–633. [Google Scholar] [CrossRef]
  47. Rouse, J.W.; Haas, R.H.; Schell, J.A.; Deering, D.W.; Harlan, J.C. Monitoring the Vernal Advancement and Retrogradation (Greenwave Effect) of Natural Vegetation; Texas A & M University, Remote Sensing Center: College, TX, USA, 1974. [Google Scholar]
  48. Asner, G.P.; Nepstad, D.; Cardinot, G.; Ray, D. Drought stress and carbon uptake in an amazon forest measured with spaceborne imaging spectroscopy. Proc. Natl. Acad. Sci. USA 2004, 101, 6039–6044. [Google Scholar] [CrossRef] [PubMed]
  49. Haboudane, D.; Miller, J.R.; Pattey, E.; Zarco-Tejada, P.J.; Strachan, I.B. Hyperspectral vegetation indices and novel algorithms for predicting green LAI of crop canopies: Modeling and validation in the context of precision agriculture. Remote Sens. Environ. 2004, 90, 337–352. [Google Scholar] [CrossRef]
  50. Peñuelas, J.; Pinol, J.; Ogaya, R.; Filella, I. Estimation of plant water concentration by the reflectance water index WI (r900/r970). Int. J. Remote Sens. 1997, 18, 2869–2875. [Google Scholar] [CrossRef]
  51. Rock, B.; Hoshizaki, T.; Miller, J. Comparison of in situ and airborne spectral measurements of the blue shift associated with forest decline. Remote Sens. Environ. 1988, 24, 109–127. [Google Scholar] [CrossRef]
  52. Stimson, H.C.; Breshears, D.D.; Ustin, S.L.; Kefauver, S.C. Spectral sensing of foliar water conditions in two co-occurring conifer species: Pinus edulis and juniperus monosperma. Remote Sens. Environ. 2005, 96, 108–118. [Google Scholar] [CrossRef]
  53. Carter, G.A. Primary and secondary effects of water content on the spectral reflectance of leaves. Am. J. Bot. 1991, 916–924. [Google Scholar] [CrossRef]
  54. Cochard, H.; Froux, F.; Mayr, S.; Coutand, C. Xylem wall collapse in water-stressed pine needles. Plant. Physiol. 2004, 134, 401–408. [Google Scholar] [CrossRef] [PubMed]
  55. Kotchenova, S.Y.; Shabanov, N.V.; Knyazikhin, Y.; Davis, A.B.; Dubayah, R.; Myneni, R.B. Modeling Lidar waveforms with time‐dependent stochastic radiative transfer theory for remote estimations of forest structure. J. Geophys. Res. Atmos. 2003, 2003, D108. [Google Scholar] [CrossRef]
  56. Cao, Z.; Wang, Q.; Zheng, C. Best hyperspectral indices for tracing leaf water status as determined from leaf dehydration experiments. Ecol. Indicators 2015, 54, 96–107. [Google Scholar] [CrossRef]
  57. Wei, G.; Shalei, S.; Bo, Z.; Shuo, S.; Faquan, L.; Xuewu, C. Multi-wavelength canopy Lidar for remote sensing of vegetation: Design and system performance. ISPRS J. Photogramm. Remote Sens. 2012, 69, 1–9. [Google Scholar] [CrossRef]
  58. Zarco-Tejada, P.J.; Rueda, C.; Ustin, S. Water content estimation in vegetation with MODIS reflectance data and model inversion methods. Remote Sens. Environ. 2003, 85, 109–124. [Google Scholar] [CrossRef]
  59. Ceccato, P.; Flasse, S.; Tarantola, S.; Jacquemoud, S.; Grégoire, J.-M. Detecting vegetation leaf water content using reflectance in the optical domain. Remote Sens. Environ. 2001, 77, 22–33. [Google Scholar] [CrossRef]
  60. Hakala, T.; Nevalainen, O.; Kaasalainen, S.; Mäkipää, R. Multispectral Lidar time series of pine canopy chlorophyll content. Biogeosciences 2015, 12, 1629–1634. [Google Scholar] [CrossRef] [Green Version]
  61. Féret, J.-B.; François, C.; Gitelson, A.; Asner, G.P.; Barry, K.M.; Panigada, C.; Richardson, A.D.; Jacquemoud, S. Optimizing spectral indices and chemometric analysis of leaf chemical properties using radiative transfer modeling. Remote Sens. Environ. 2011, 115, 2742–2750. [Google Scholar] [CrossRef]
  62. Eitel, J.U.; Magney, T.S.; Vierling, L.A.; Dittmar, G. Assessment of crop foliar nitrogen using a novel dual-wavelength laser system and implications for conducting laser-based plant physiology. ISPRS J. Photogramm. Remote Sens. 2014, 97, 229–240. [Google Scholar] [CrossRef]

