Article

Landsat-Based Long-Term Monitoring of Total Suspended Matter Concentration Pattern Change in the Wet Season for Dongting Lake, China

1
School of Geographic Science, Nanjing Normal University, Nanjing 210023, China
2
School of Geography and Planning, Gannan Normal University, Ganzhou 341000, China
3
Jiangsu Center for Collaborative Innovation in Geographical Information Resource Development and Application, Nanjing 210023, China
4
Nanjing Hydraulic Research Institute, Nanjing 210029, China
*
Author to whom correspondence should be addressed.
Remote Sens. 2015, 7(10), 13975-13999; https://0-doi-org.brum.beds.ac.uk/10.3390/rs71013975
Submission received: 20 June 2015 / Revised: 19 October 2015 / Accepted: 20 October 2015 / Published: 23 October 2015
(This article belongs to the Special Issue Remote Sensing of Water Resources)

Abstract

:
Assessing the impacts of environmental change and anthropogenic activities on the historical and current total suspended matter (TSM) pattern in Dongting Lake, China, is a large challenge. We addressed this challenge by using more than three decades of Landsat data. Based on in situ measurements, we developed an algorithm based on the near-infrared (NIR) band to estimate TSM in Dongting Lake. The algorithm was applied to Landsat images to derive TSM distribution maps from 1978 to 2013 in the wet season, revealing significant inter-annual and spatial variability. The relationship of TSM to water level, precipitation, and wind speed was analyzed, and we found that: (1) sand mining areas usually coincide with regions that have high TSM levels in Dongting Lake; (2) water level and seven-day precipitation were both important to TSM variation, but no significant relationship was found between TSM and wind speed or other meteorological data; (3) the increased level of sand mining in response to rapid economic growth has deeply influenced the TSM pattern since 2000 due to the resuspension of sediment; and (4) TSM variation might be associated with policy changes regarding the management of sand mining; it might also be affected by lower water levels caused by the impoundment of the Three Gorges Dam since 2000.

Graphical Abstract

1. Introduction

Total suspended matter (TSM) is a key parameter for describing water quality. TSM transports nutrients and contaminants, reduces light transmission through a water column and influences entire aquatic ecosystems [1]. Accurate spatiotemporal information on TSM distribution patterns is therefore important for understanding lake ecosystem dynamics and for the development of effective and quantitative monitoring of aquatic environments, in order to both protect the lake ecosystem and improve water quality management [2,3,4].
Dongting Lake, the second largest freshwater lake in China, is an important lake in the local ecological system. However, like many lakes in China, environmental change and anthropogenic activities in the area threaten its water quality [5,6,7]. An increasing level of sand mining, for example, has stirred up heavy metals in the sediment load from the lake’s floor, which could then enter the food chain through aquatic products, thus posing a health threat to the local population [8,9]. In addition, the impoundment of the Three Gorges Dam in the upstream of the Yangtze River changed the hydrologic processes and influenced the distribution of sediments and wetland [10]. Dongting Lake is thus clearly an important region that needs proper monitoring.
Traditionally, TSM measurements in the lake waters have been obtained from cruise samples. It is thus difficult to achieve and compare TSM patterns for all of Dongting Lake over a period of years using existing methods. The limited number of measurements obtained through regular point sampling cannot represent the overall temporal and spatial distribution of TSM, and has proven to be problematic when lakes, particularly when they are large, have high spatial and temporal variation in their biogeochemical environments. In fact, a systematic assessment of long-term changes in the TSM pattern in Dongting Lake has never been completed, nor have any potential linkages to natural processes and anthropogenic activities been established.
The development of remote sensing techniques has made it possible to monitor optical active substances such as chlorophyll-a and TSM in a waterbody [11]. Over recent decades, a number of studies have demonstrated that TSM distribution in open sea and inland waters can be mapped from various types of satellite remote sensing data, such as the land satellite (Landsat), Sea-Viewing Wide Field-of-View Sensor (SeaWiFS), Moderate Resolution Imaging Spectroradiometer (MODIS), and Medium Resolution Imaging Spectrometer (MERIS) [12,13,14,15]. The first Landsat satellite was launched on 23 July 1972 [16], and the latest Landsat 8 was launched on 11 February 2013 [17]. The Multispectral Scanner (MSS), Thematic Mapper (TM), Enhanced Thematic Mapper Plus (ETM+), and Operational Land Imager (OLI) sensors obtained more than four decades of massive data from the Earth’s surface by the end of 2014. Landsat satellites might offer the only prospect for documenting historical TSM over a period greater than three decades. Compared with other frequently used satellites, such as MODIS and MERIS, the MSS/TM/ETM+/OLI sensors from Landsat satellites have multispectral bands that observe Earth with higher spatial resolution (Table 1). In addition to the continuity of the satellite’s mission, ensured via several Landsat sensors, the quality of Landsat data and Landsat’s long-term archive in particular have provided the basis for evaluating remotely sensed data and their use for the long-term monitoring of TSM, chlorophyll-a, water clarity, and Secchi depth [11,18,19,20]. Moreover, Landsat satellite-derived images of TSM can be retrieved using single-band algorithms based on reflectance in the red or near-infrared (NIR) spectral regions, which is caused by the backscattering of particulate matter [21]. By using the red or NIR bands of Landsat sensors, the accuracy of derived-TSM is highly reliable [22,23]. However, the observation of water quality parameters using remote sensing remains a challenge, due to heavy cloud cover in the area, therefore limited satellite image availability, and the limited availability of ground truth measurements.
Many previous studies of Dongting Lake have focused on aquatic environments using remote sensing approaches. For example, ENVISAT (Environmental Satellite) ASAR (Advanced Synthetic Aperture Radar) images collected in different seasons were used to illustrate the water-area variations and wetland vegetation of different species and functional types [24,25]. Several innovative studies have used remote sensing approaches to derive water parameters for Dongting Lake. For example, Wu et al. [26] first published an empirical retrieval algorithm for estimating TSM in Dongting Lake, using an exponential model of the Moderate Resolution Imaging Spectroradiometer (MODIS)-based red band minus the SWIR band. A Bayesian Regularized BP Neural Network (BRBPNN) technique was applied by Xu et al. [27] in the prediction of chlorophyll-a in the Nanzui water region in Dongting Lake. In addition, Wu et al. [28] used red band and in situ TSM measurements to develop a TSM retrieval model for Landsat 8 OLI. The derived-TSM revealed a clear spatial distribution pattern in South and East Dongting Lake in 2013 that was caused by a combination of natural (e.g., water level) and anthropogenic (e.g., sand mining) factors. The paper also suggested the potential to extend the time period in order to conduct more than 40-year water quality estimations from Landsat satellites.
This study seeks to reveal and quantify long-term changes in the TSM pattern caused by environmental factors and anthropogenic activities, and attempts to clarify their relationship. We use remote sensing data from Landsat satellites over a 35-year period (1978–2013) with the following two objectives:
(1)
Develop a model, based on the Landsat images, that addresses sensor-associated differences and atmospheric corrections to estimate TSM for inland lake water with extreme variation.
(2)
Document the long-term pattern in TSM variation in the wet season from 1978 to 2013 and understand its relationship to environmental factors and anthropogenic activities.

2. Materials and Methods
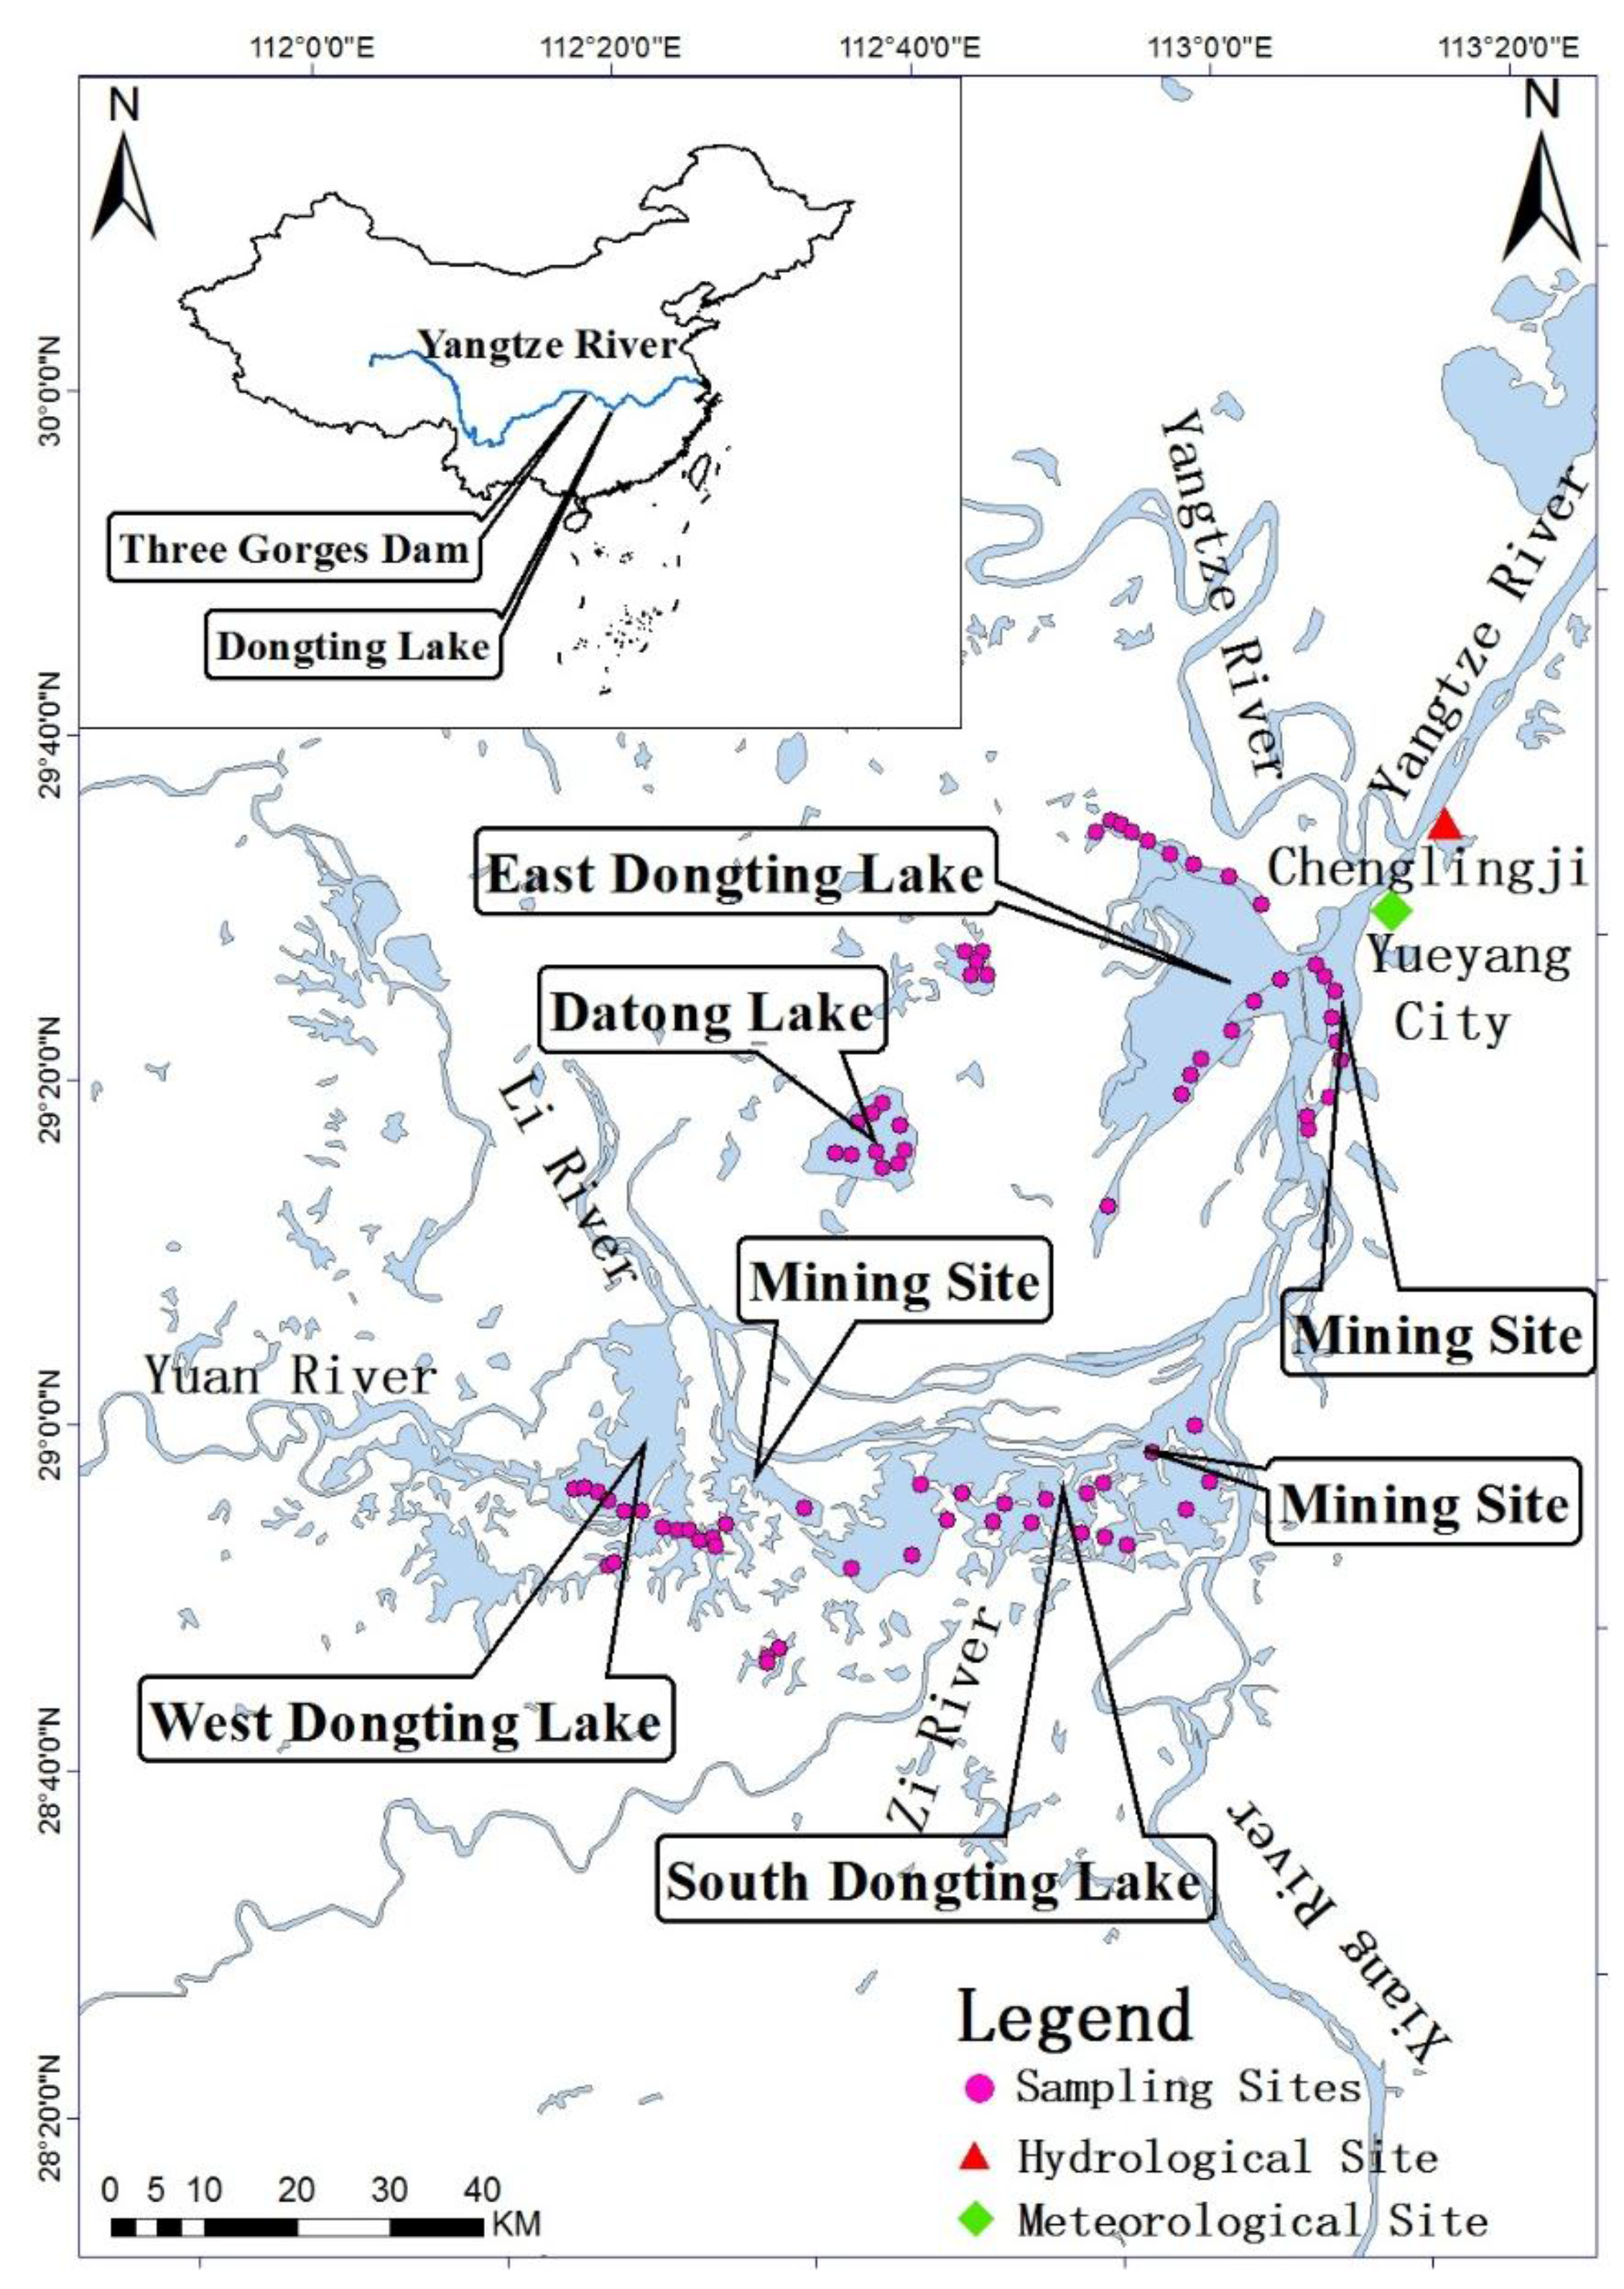
2.1. Study Area

Dongting Lake (28°30″N to 30°20″N, 111°40″E to 113°10″E) is the second largest freshwater lake in China. It serves as an important retention basin for the Yangtze River during the flood season, between July and September. The area of the lake, which is normally 2820 square kilometers, can increase dramatically during the flood season. The inflow from the Yangtze River accounts for 21.6% of the total water influx of Dongting Lake, carrying an average of 14 million tons of sediment per year [29]. As shown in Figure 1, Dongting Lake is divided geographically into three parts, East Dongting Lake, South Dongting Lake and West Dongting Lake, which are connected by waterways, and which are also fed by four major rivers: the Xiang, Zi, Yuan and Li, and a number of minor rivers. The Yangtze River and Dongting Lake join at the Chenglingji hydrological site, and Yueyang City is located in this area. There are hundreds of sand-mining vessels and automatic unloading vessels (Figure 9) in the lake. Most of the mining sites are distributed in the eastern part of East Dongting Lake (EDL), and the northern part of South Dongting Lake (SDL). The Three Gorges Dam (TGD), about 390 km from the Chenglingji hydrological site, is located in the upper Yangtze River. The main river channel of TGD was closed in 1998, and an associated open-diversion channel was finished in 2000 that led to its impoundment in June 2003.
Figure 1. Location map of Dongting Lake in China. The pink points represent the sampling sites, and the red triangle and green rhombus represent the location of the Chenglingji hydrological site and the Yueyang meteorological site, respectively. The river’s direction of flow is the same as the alphabetical order of the name of each river.
Remotesensing 07 13975 g001

2.2. Landsat Images Acquisition and Pre-Processing

Three types of data were used, including Landsat satellite data between 1978 and 2013 in the wet season, in situ remote sensing reflectance (Rrs) and TSM measurements, and gauged hydrological and meteorlogical data.
Landsat images were downloaded from the United State Geological Survey (USGS, http://glovis.usgs.gov/). The images include MSS data from 1978 to 1984, TM data from between 1985 and 2009, ETM+ data from 2000 to 2003, and OLI data for 2013. Because Dongting Lake is located in a subtropical area that often experiences heavy cloud cover in the wet season, we could only find one wet-season Landsat image for most of the years between 1978 and 2013. All selected images were cloud-free or uncovered. The acquisition period for the images was between July and September of the same year in order to ensure similar environmental and hydrological conditions and to represent TSM variation in the wet season.
There were a total of 20 images: 19 (Path/Row: 133/40 and 123/40) were used to derive long-term TSM, and one Landsat 8 OLI image (Path/Row: 124/40) was used to validate the OLI-based model. It was collected on 7 August 2013, which was coincident with the timing of fieldwork data collection, details of which can be seen in the asterisked files in Table 1. The Landsat image covered just the EDL and SDL. Because Dongting Lake is a so large, the EDL and SDL are different geographical units that might contain different natural environments and anthropogenic activities. We therefore divided the study area into two sub-regions: EDL and SDL, and used Whole Dongting Lake (WDL) to represent the total area of both EDL and SDL.
Table 1. Landsat satellite images used in the study. Note that images were acquired between July and September of each year.
Path/RowAcquisition Date (YYYY/MM/DD)SensorSpatial Resolution (m)
133/401978/08/06MSS60
123/401983/08/06MSS60
123/401984/08/16MSS60
123/401987/08/25TM30
123/401990/09/02TM30
123/401991/07/19TM30
123/401994/08/12TM30
123/401996/08/17TM30
123/401999/09/03ETM+30
123/402000/07/27TM30
123/402001/07/22ETM+30
123/402002/08/02TM30
123/402003/07/04ETM+30
123/402004/07/22TM30
123/402005/07/25TM30
123/402006/08/13TM30
123/402007/07/31TM30
123/402009/08/21TM30
123/402013/07/31OLI30
*124/402013/08/07OLI30
These images were obtained from the USGS. Also note that the real resolution of MSS is 79 m × 57 m, which has been re-sampled to 60 m by USGS. The asterisked files on 7 August 2013 were only used to validate the accuracy of the coincident OLI-based TSM model.
Landsat images were first converted to top-of-atmosphere (TOA) radiance using radiometric calibration coefficients in the metadata file. The MODTRAN5 (Moderate Resolution Atmospheric Transmission) radiation transfer code is incorporated in the FLAASH module, a solution that is considered an excellent atmospheric correction for terrestrial applications [30,31,32], as well as for an inland waterbody [33,34]. The module is suitable not only for multispectral images such as Landsat and HJ1A/B-CCD (HJ-1A/B charge-coupled device) images, but also for hyperspectral images such as Hyperion Hyperspectral images and HJ1A/B-HSI (Hyper Spectral Imager) [35,36,37]. Atmospheric correction was thus processed with a Fast Line-of-sight Atmospheric Analysis of Spectral Hypercubes (FLAASH) module embedded in The Environment for Visualizing Images (ENVI) 5.2 software, resulting in an atmospherically corrected waterbody remote sensing reflectance (Rrs). The key parameters used in the FLAASH module were selected as follows: tropical for the July to September period in the atmospheric model, rural for the aerosol model (because the study area is far from urban or industrial locations), and 2-band (K-T) for the aerosol retrieval; initial visibility was chosen as 30–40 km, depending on the image quality, and no water retrieval was conducted because no specific band was configured with the Landsat instruments. To match the spatial resolution of the other three Landsat instruments, three MSS images were resampled to 30 m using the nearest neighbor resampling method.

2.3. Field Data Collection

Three cruise surveys were carried out on 7 to 10 August 2013 over all of Dongting Lake, from which Rrs and water-sample data were measured and collected (Figure 1). There were a total of 78 sampling sites that ranged from turbid to clear water. At each site, the distance between two adjacent sampling sites was greater than 1.5 km. The longitude and latitude coordinates for each site were obtained using a global positioning system receiver, and about 1000–1500 mL of surface water were collected from a 50 cm-water depth for the laboratory measurement of TSM [38].

2.3.1. Measurement of Spectral Reflectance

An ASD FieldSpec spectroradiometer was used to measure spectral reflectance. The sensor has 512 channels over a spectral range of 350–1050 nm. Collected spectra with a spectral resolution of 1.5 nm were interpolated into 1 nm. In accordance with the Ocean Optics Protocols [39], the above-water measurement method was used to measure the radiance spectra of the reference panel, water, and sky, respectively. At each site, ten spectra were collected, from which abnormal spectra were eliminated and valid ones were retained and averaged. Finally, the remote sensing reflectance Rrs(λ) was derived via the following equation [40]:
R r s ( λ ) = ( L t r * L s k y ) / ( L p * π / ρ p )
where, Lt is the measured total radiance of the water surface; r denotes skylight reflectance at the air-water surface, and its value is affected by water-surface roughness caused by wind speed (2.2% for calm weather, 2.5% for <5 m∙s−1 wind speed, 2.6%–2.8% for about 10 m∙s−1 wind speed); Lsky is the measured radiance from sky; Lp is the measured radiance of the gray reference panel; and ρ p is the reflectance of the gray diffuse panel (30%).

2.3.2. Water Sample Analysis

Water samples were filtered on Whatman GF/F fiberglass filters, with phytoplankton pigments extracted with ethanol (90%) at 80 °C. Chlorophyll-a concentration (Chla) was determined spectrophotometrically using the method described by Lorenzen [41] and Chen et al. [42]. The concentrations of Total Suspended Matter (TSM), Organic Suspended Matter (OSM), and Inorganic Suspended Matter (ISM) were determined gravimetrically. Water samples were filtered through Whatman GF/F fiberglass filters (pre-combusted at 550 °C for 4 h and dried at 105 °C for 4 h to remove organic traces, and weighed according to the method described by Huang [43]. The filters were then re-combusted at 550 °C for 4 h in order to remove the organic fraction, and weighed again to obtain ISM. By subtracting ISM from TSM, the OSM concentration was obtained.
Some of the reflectance spectra were abnormal. A few were similar to that of vegetation because of algal blooms [44]. Other abnormal spectra were attributed to the presence of submerged plants at the lake floor in shallower areas [45]. These abnormal spectra cannot be used in the calibration and validation of the derived-TSM model. We thus collected the typical water spectra with algal blooms or submerged plants, in order to easily remove the abnormal spectra curves from the normal spectra curves. Finally, the spectral data from 16 sampling sites were thus discarded to ensure the quality of the data set, leaving 62 sampling sites with useful data.

2.4. Hydrological and Meteorological Data

Water-level data were acquired from hydrological data for Yangtze River Basin, Annual Hydrological Report of People’s Republic of China from 1978–2013. The data were collected at the Chenglingji hydrological station and represent the water level for all of Dongting Lake. Meteorological data, including daily and monthly precipitation, wind speed, temperature, air pressure and relative humidity from 1978 to 2013 were obtained from the China Meteorological Data Sharing Service System (http://cdc.cma.gov.cn/). We chose three types of precipitation data, collected from the Yueyang meteorological station, which were used to represent meteorological conditions for the entire Dongting Lake region: (1) daily precipitation data that matched the date of acquisition for each Landsat image (daily precipitation); (2) total precipitation for seven days prior to the acquisition date of each Landsat image (seven-day precipitation); and (3) total precipitation for 30 days prior to the acquisition date of each Landsat image (30-day precipitation).

2.5. Statistical Analysis and Accuracy Assessment

Statistical analyses that included calculations of the average, maximum, and minimum values and linear and non-linear regressions were performed using the Statistical Program for Social Sciences (SPSS) 20.0 software. Pearson correlation analysis was used to investigate the strength of the association between the two variables with correlation coefficient (r) in SPSS. Significance levels were reported to be significant (p < 0.05) or not significant (p > 0.05) with a t-test, which provides evidence of an association between the two variables.
Several measures were used to assess the algorithm’s performance and product uncertainties at the pixel level. The mean absolute percentage error (MAPE) and root-mean-square error (RMSE) were calculated to indicate the accuracy of the TSM models. These accuracy criteria are calculated as:
M A P E = 1 n i = 1 n | y i y i y i | * 100 %
R M S E = 1 n i = 1 n ( y i y i ) 2
where, n is the number of samples, and y i and y i ' refer to the measured and predicted values for the i-th sample.

3. Results

3.1. Data Distribution

The water quality parameters, determined from the field samples, showed high dynamic range and substantial variability (Table 2). Chla ranged between 1.9 and 124.2 μg/L with a mean value of 28.7 μg/L (standard deviation = 20.6 μg/L). The mean TSM during the sampling period was 36.4 mg/L (S.D. = 22.8 mg/L), with a maximum of 101 mg/L and a minimum of 4 mg/L. ISM and OSM ranged from 2.3 to 93.3 mg/L and 0.7 to 24.7 mg/L, with a mean value of 27.5 mg/L and 5.9 mg/L, respectively. The total 62 sample-data sites were randomly divided into two purposes: a modeling data set of 42 samples was used to train the algorithm, and a validation data set of 20 samples was used to evaluate the accuracy of the model [45].
Table 2. Statistics describing the variation of Chla concentration (Chla, μg/L), total suspended matter concentrations (TSM, mg/L), inorganic suspended matter concentrations (ISM, mg/L) and organic suspended matter concentrations (OSM, mg/L), measured in August 2013 in Dongting Lake. S.D. is the standard deviation (mg/L), and C.V. is the coefficient of variation (%).
Data SetStatisticsChla (μg/L)TSM (mg/L)ISM (mg/L)OSM (mg/L)
N = 62Maximum124.210193.324.7
Minimum1.942.30.7
Mean28.736.427.55.9
S.D.20.622.822.33.7
C.V.71.8%62.6%81.2%62.7%

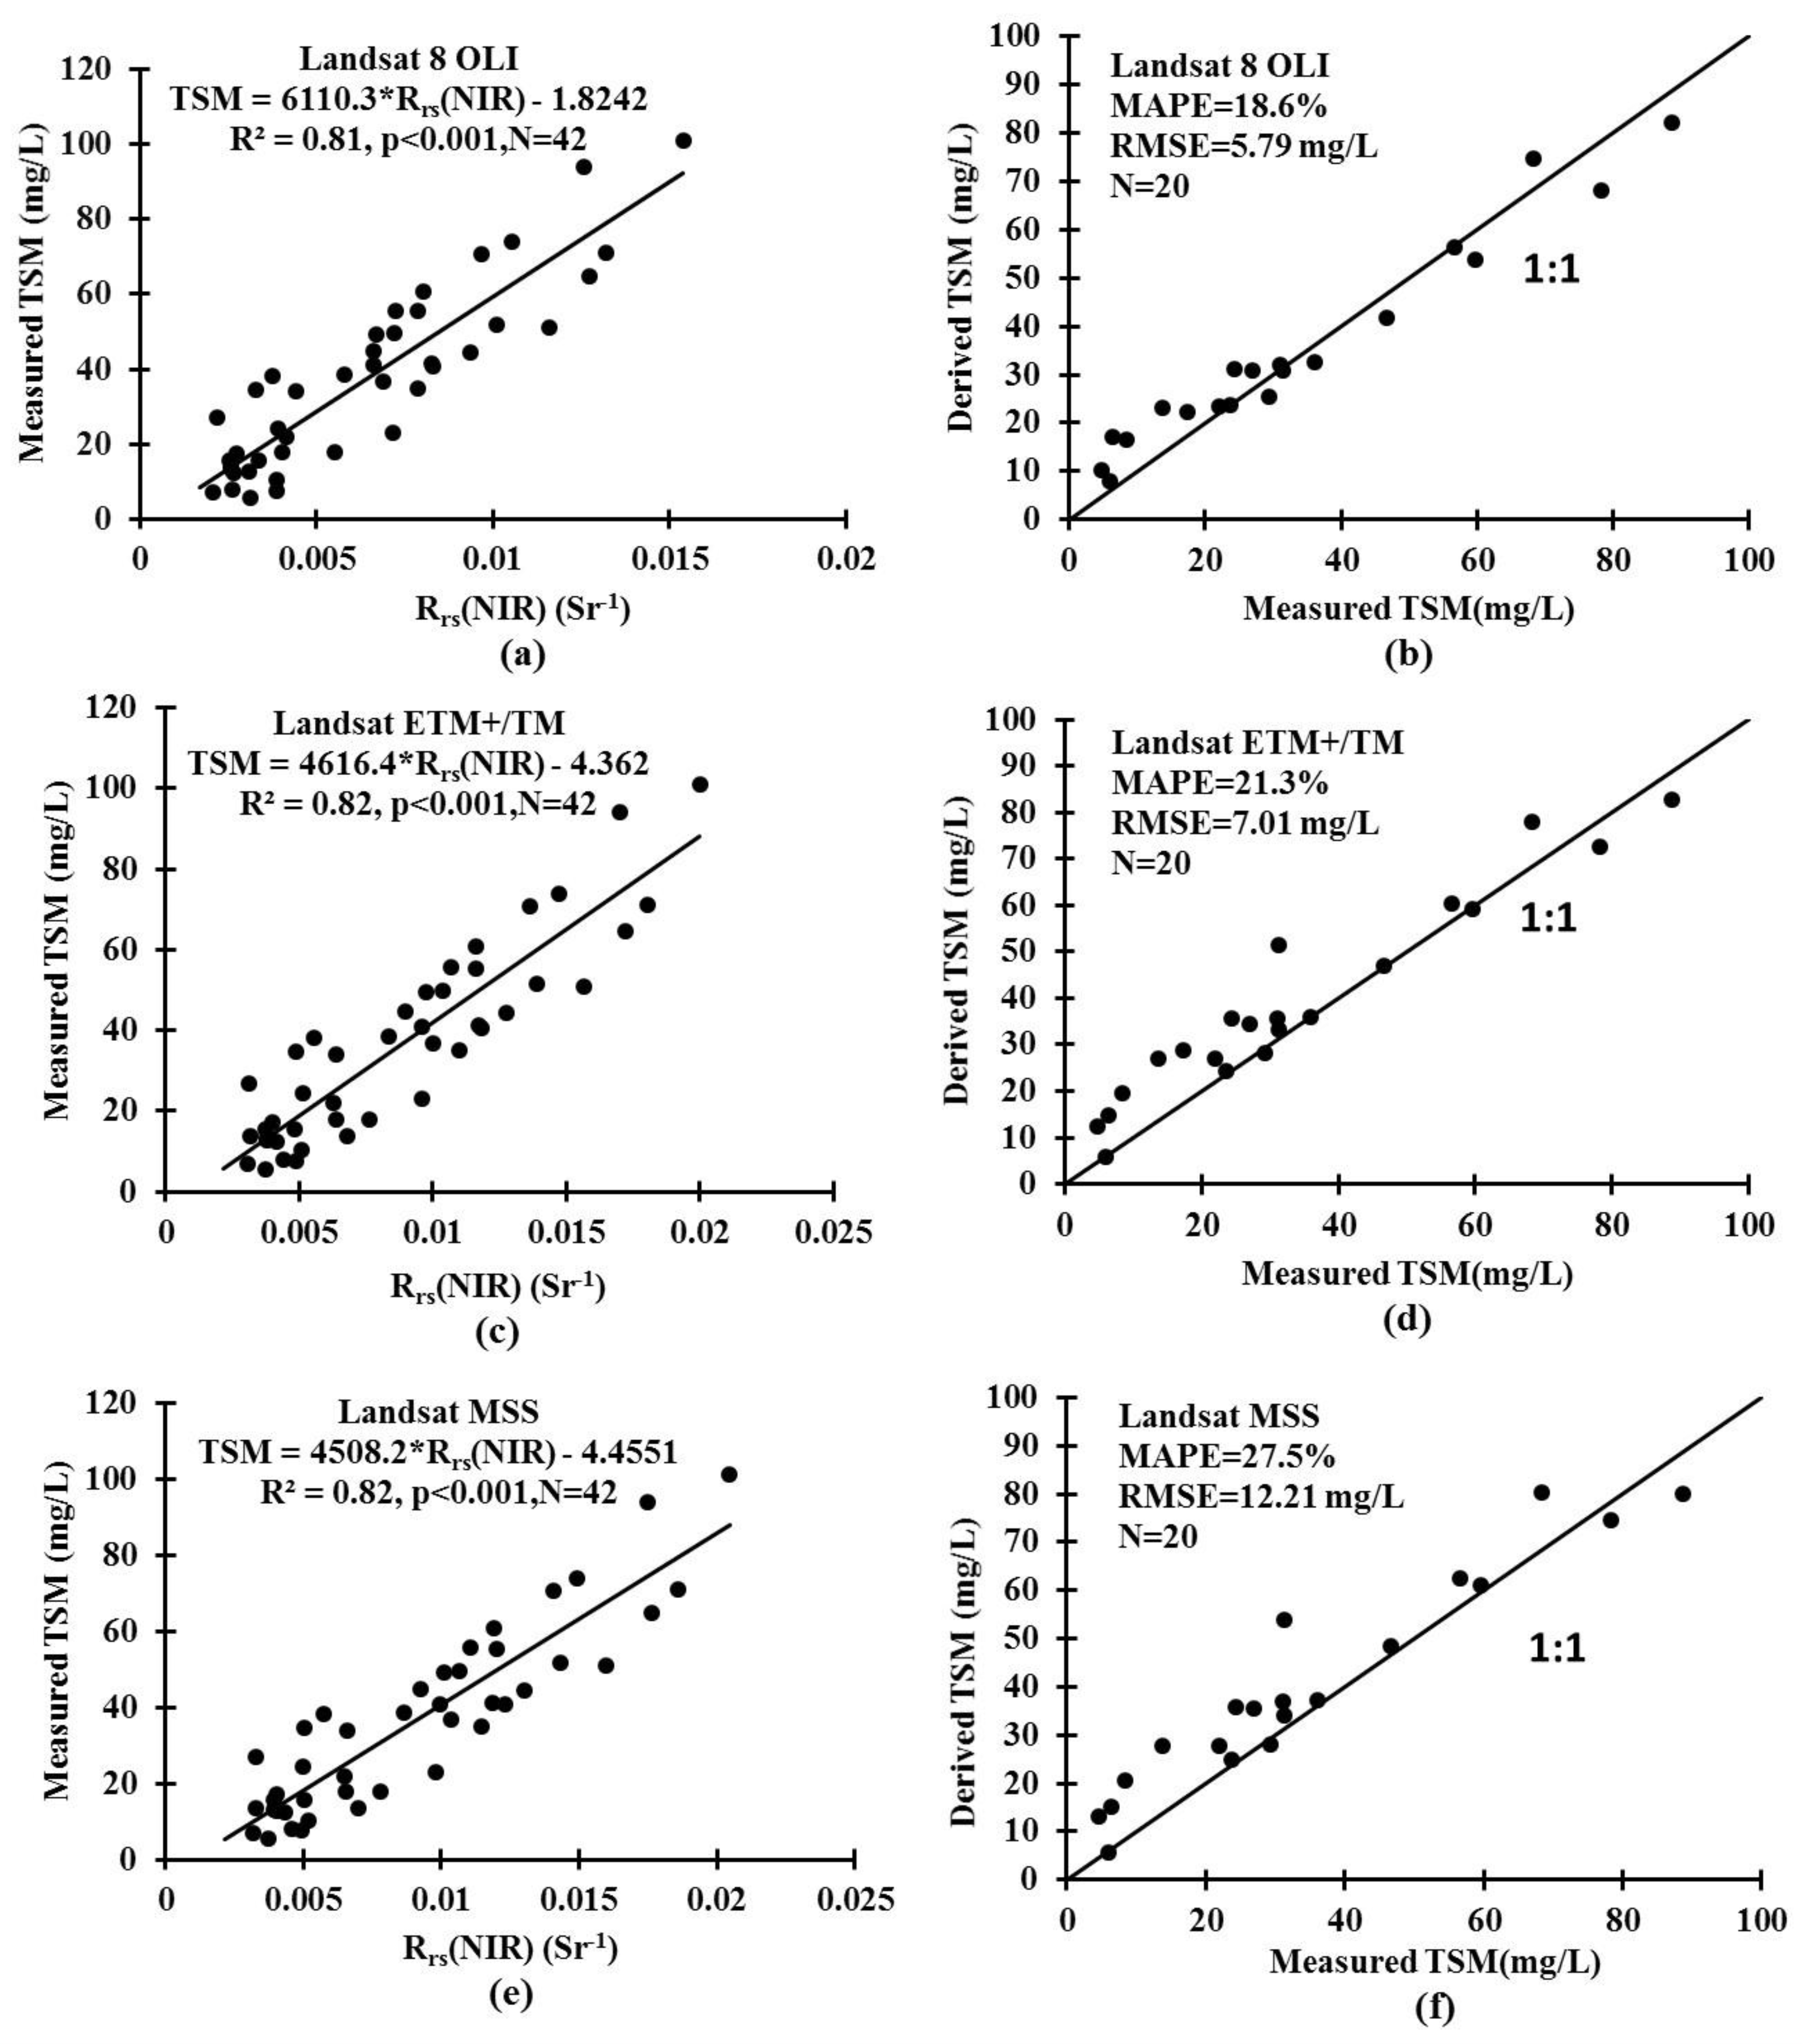
3.2. Algorithm Development and Validation for Landsat

A number of TSM-derived models have been proposed in previous studies. The empirical regression algorithms take advantage of the linear or exponential relations between TSM and reflectance in certain spectral band(s) [12,22,23,26,28]. To date, there has been no standardized TSM-derived model because of the high level of variation in particle size, density and other optical complexities of different water bodies [46]. A customized model is therefore needed to estimate TSM in the study region using Landsat images.
In order to use the Landsat data to estimate TSM concentrations, the field-measured Rrs(λ) were first aggregated to simulate Landsat-based derived Rrs(λ) using the spectral response functions (SRF) for OLI, ETM+/TM and MSS (Table 3), according to the following equation:
R r s ( b i ) = λ m λ n S R F ( λ ) * R r s _ m e a s ( λ ) d λ λ m λ n S R F ( λ ) d λ
where, Rrs(bi) denotes the simulated Rrs(sr−1) for the i-th band of Landsat, with integration from λm to λn for the i-th band.
Table 3. Spectral bands for the Landsat sensors, whose SRF functions were obtained from USGS and used to simulate Landsat-based derived Rrs using in situ measured Rrs through Equation (4).
Landsat SensorBlue Band (μm)Green Band (μm)Red Band (μm)NIR Band (μm)
OLI0.45–0.510.53–0.590.64–0.670.85–0.88
ETM+/TM0.45–0.520.52–0.600.63–0.690.77–0.90
MSS0.50–0.600.60–0.700.70–0.800.80–1.10
In order to determine the best band or band combination, correlation analysis between in situ TSM measurements and simulated Landsat-based derived Rrs (calculated by Equation [4] and using the visible and NIR Band values) was carried out, and the linear, quadratic, cubic, power, and exponential models of TSM against a single band or their combinations were then calibrated, respectively, with the least-squares technique. The determination coefficient (R2), MAPE and RMSE were employed to evaluate the derived model.
The correlation analysis showed that there was a significant positive correlation between the in situ measured TSM and the Landsat-based derived Rrs(λ). First, the OLI-based derived Rrs(NIR) exhibited a strong correlation with the in situ TSM measurements (R2 = 0.81; p < 0.001) (Figure 2a). The high correlation between the in situ measurement of TSM and the OLI-based derived Rrs(NIR) was similar to the findings of numerous previous studies [47,48,49,50,51,52,53]. Among the five types of mathematical functions (linear, logarithmic, exponential, power law, and quadratic) we used to establish the relationships between OLI-based derived Rrs(NIR) data and the in situ TSM calibration dataset, the linear function provided the best precision with the highest determination coefficient (R2 = 0.81; p < 0.001) and the lowest MAPE (18.6%) and RMSE (5.79 mg/L) (Figure 2b). Using the same method, we developed a model for ETM+/TM and MSS, with the highest R2 of 0.82 and 0.82 (p < 0.001), respectively (Figure 2c,e). The models are represented in the following equations:
T S M O L I ( m g / L )   = 6110.3 * R r s ( N I R ) 1.8242
T S M E T M + / T M ( m g / L )   = 4616.4 * R r s ( N I R ) 4.362
T S M M S S ( m g / L ) =   4508.2 * R r s ( N I R ) 4.4551
where, the Rrs(NIR) is the NIR band Rrs value, which is calculated using Equations (5–7), particularly as: Band 5 for Landsat OLI sensor; Band 4 for Landsat ETM+/TM/MSS sensor.
The proposed model performed well in the validation dataset (Figure 2b,d,f). The MAPE of the model for OLI, ETM+/TM and MSS validation dataset varied from 18.6% to 27.5%, and RMSE between 5.79 mg/L and 12.21 mg/L. Comparisons between the TSM measured in situ and the TSM estimated using the proposed model showed that these values were acceptable. The in situ and estimated TSM values were evenly distributed along the 1:1 line. These results indicate that the proposed model could be used with satisfactory performance to retrieve TSM in this inland waterbody.
Figure 2. Scatter-plots of TSM-model calibration (left) between in situ TSM-measurement data and simulated Landsat-based derived Rrs, and TSM-model validation (right) between measured and Rrs-based derived TSM using Equations (5–7). (a) & (b)based on Landsat 8 OLI sensor, (c) & (d)based on Landsat ETM+/TM sensor, (e) & (f)based on Landsat MSS sensor. TSM is the total suspended matter, OLI is the Operational Land Imager, ETM+ is the Enhanced Thematic Mapper Plus, TM is the Thematic Mapper, and MSS is the Multispectral Scanner.
Remotesensing 07 13975 g002

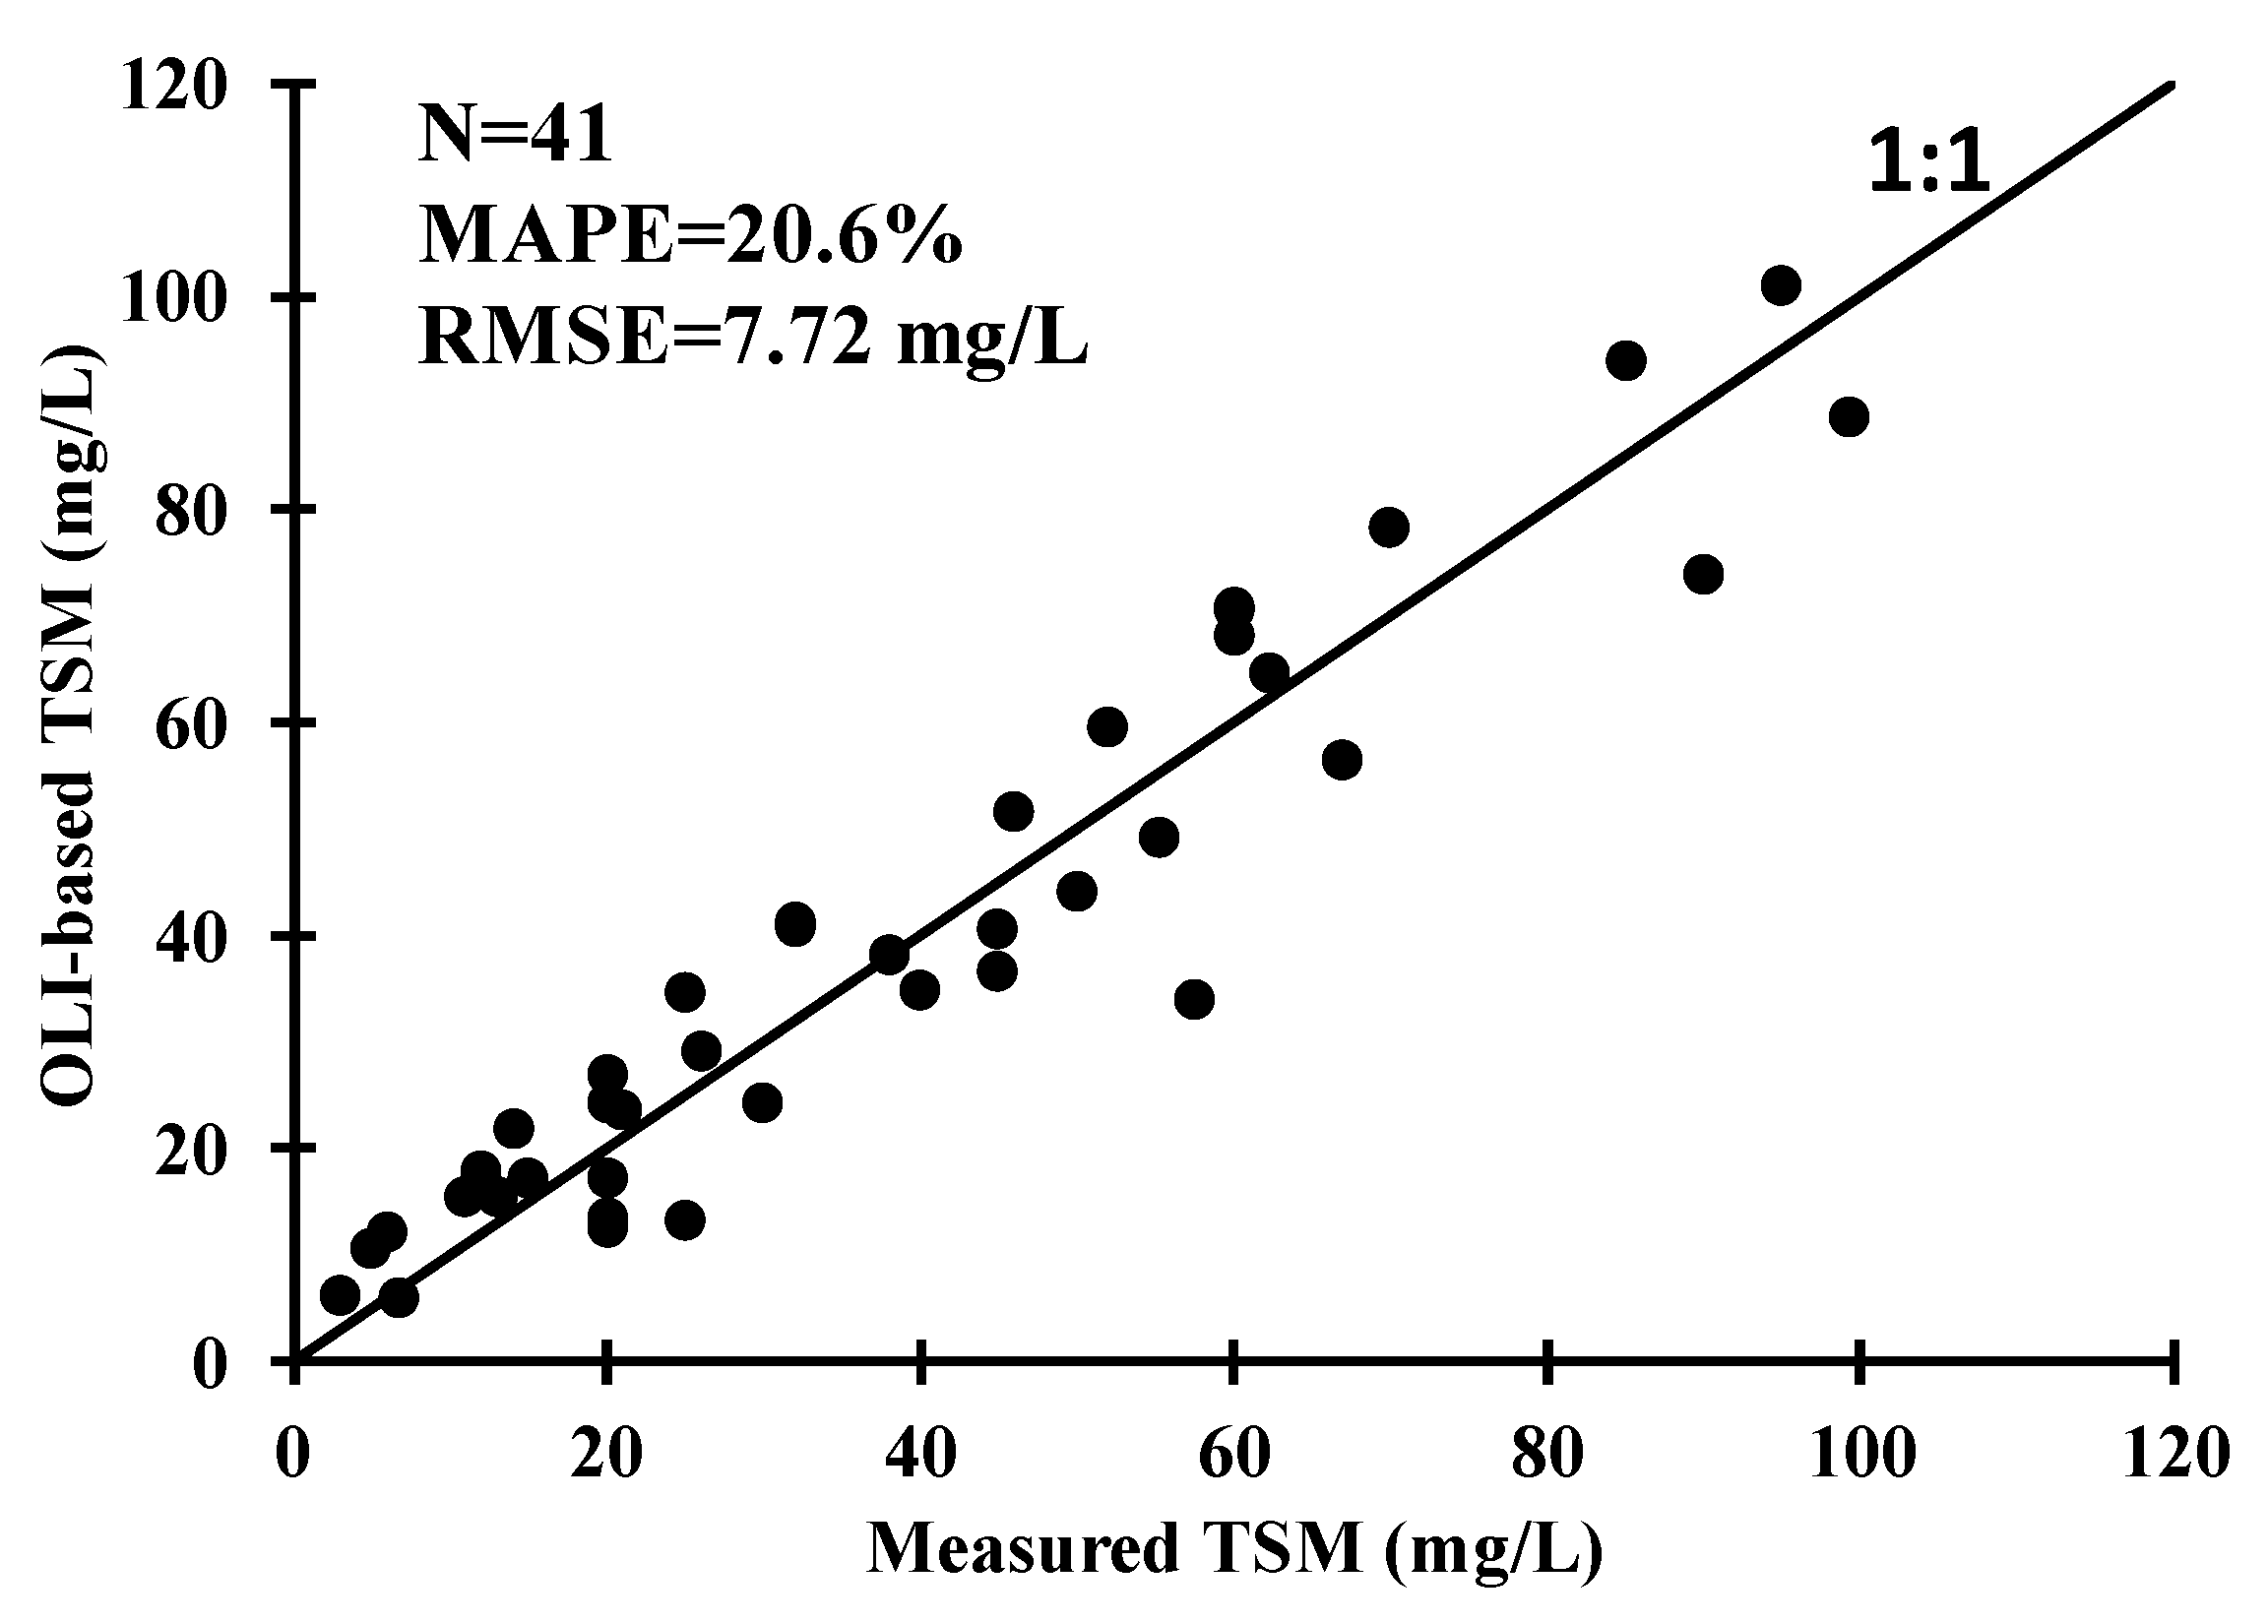
3.3. Landsat 8 OLI-Based Validation

One Landsat 8 OLI image (Path/Row: 124/40) collected on 7 August 2013 (Table 1) was used to validate the OLI-based model, and there are a total of 41 points in the OLI-based validation image. Figure 3 shows that there was a significant correlation between the measured TSM data and the OLI-based TSM values, at a significance level of p < 0.001, and shows the agreement between the measured TSM and the OLI-based TSM for OLI, where the uncertainties in the model include MAPE of 20.6%, and RMSE of 7.72 mg/L of their relative difference. These results clearly demonstrate the acceptable performance of the TSM-derived model for a large dynamic range (4–101 mg/L).
Figure 3. Comparison of measured TSM and OLI-based TSM for Landsat 8.
Remotesensing 07 13975 g003
Ideally, the Landsat-based derived-TSM model would be validated for all of the Landsat sensors, including OLI, ETM+/TM and MSS. However, as we know, Landsat 8 is currently the only operational Landsat satellite; the Landsat 7 ETM+ scan line corrector (SLC) in the ETM+ instrument has not functioned since 31 May 2003, and Landsat 5 TM stopped collecting data on 18 November 2011. It is thus impossible to obtain coincident ground in situ TSM measurements with retired or nonfunctional satellite images from Landsat 1-7. Thus, we can no longer do the validation between ETM+/TM and MSS-based images and in situ TSM measurements. We were able, however, to validate all of the Landsat sensors (OLI, ETM+/TM and MSS) using the simulated Landsat-based derived Rrs, and found them to have acceptable performance. Furthermore, the good performance of the OLI-based and TSM-model validations between measured and simulated OLI-based derived TSM suggest that the Landsat-based derived-TSM model has acceptable performance for all of the Landsat images. The performance of the model facilitates the study of TSM spatial and temporal pattern change in Dongting Lake from 1978 to 2013.

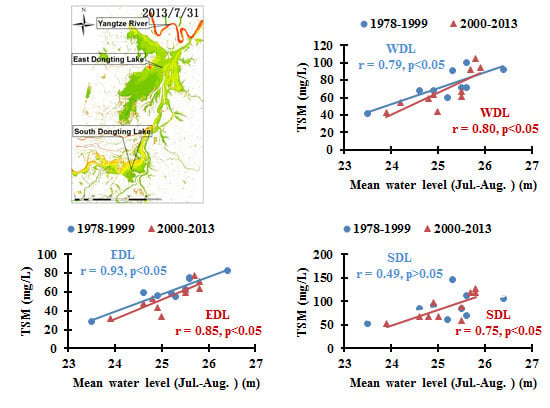
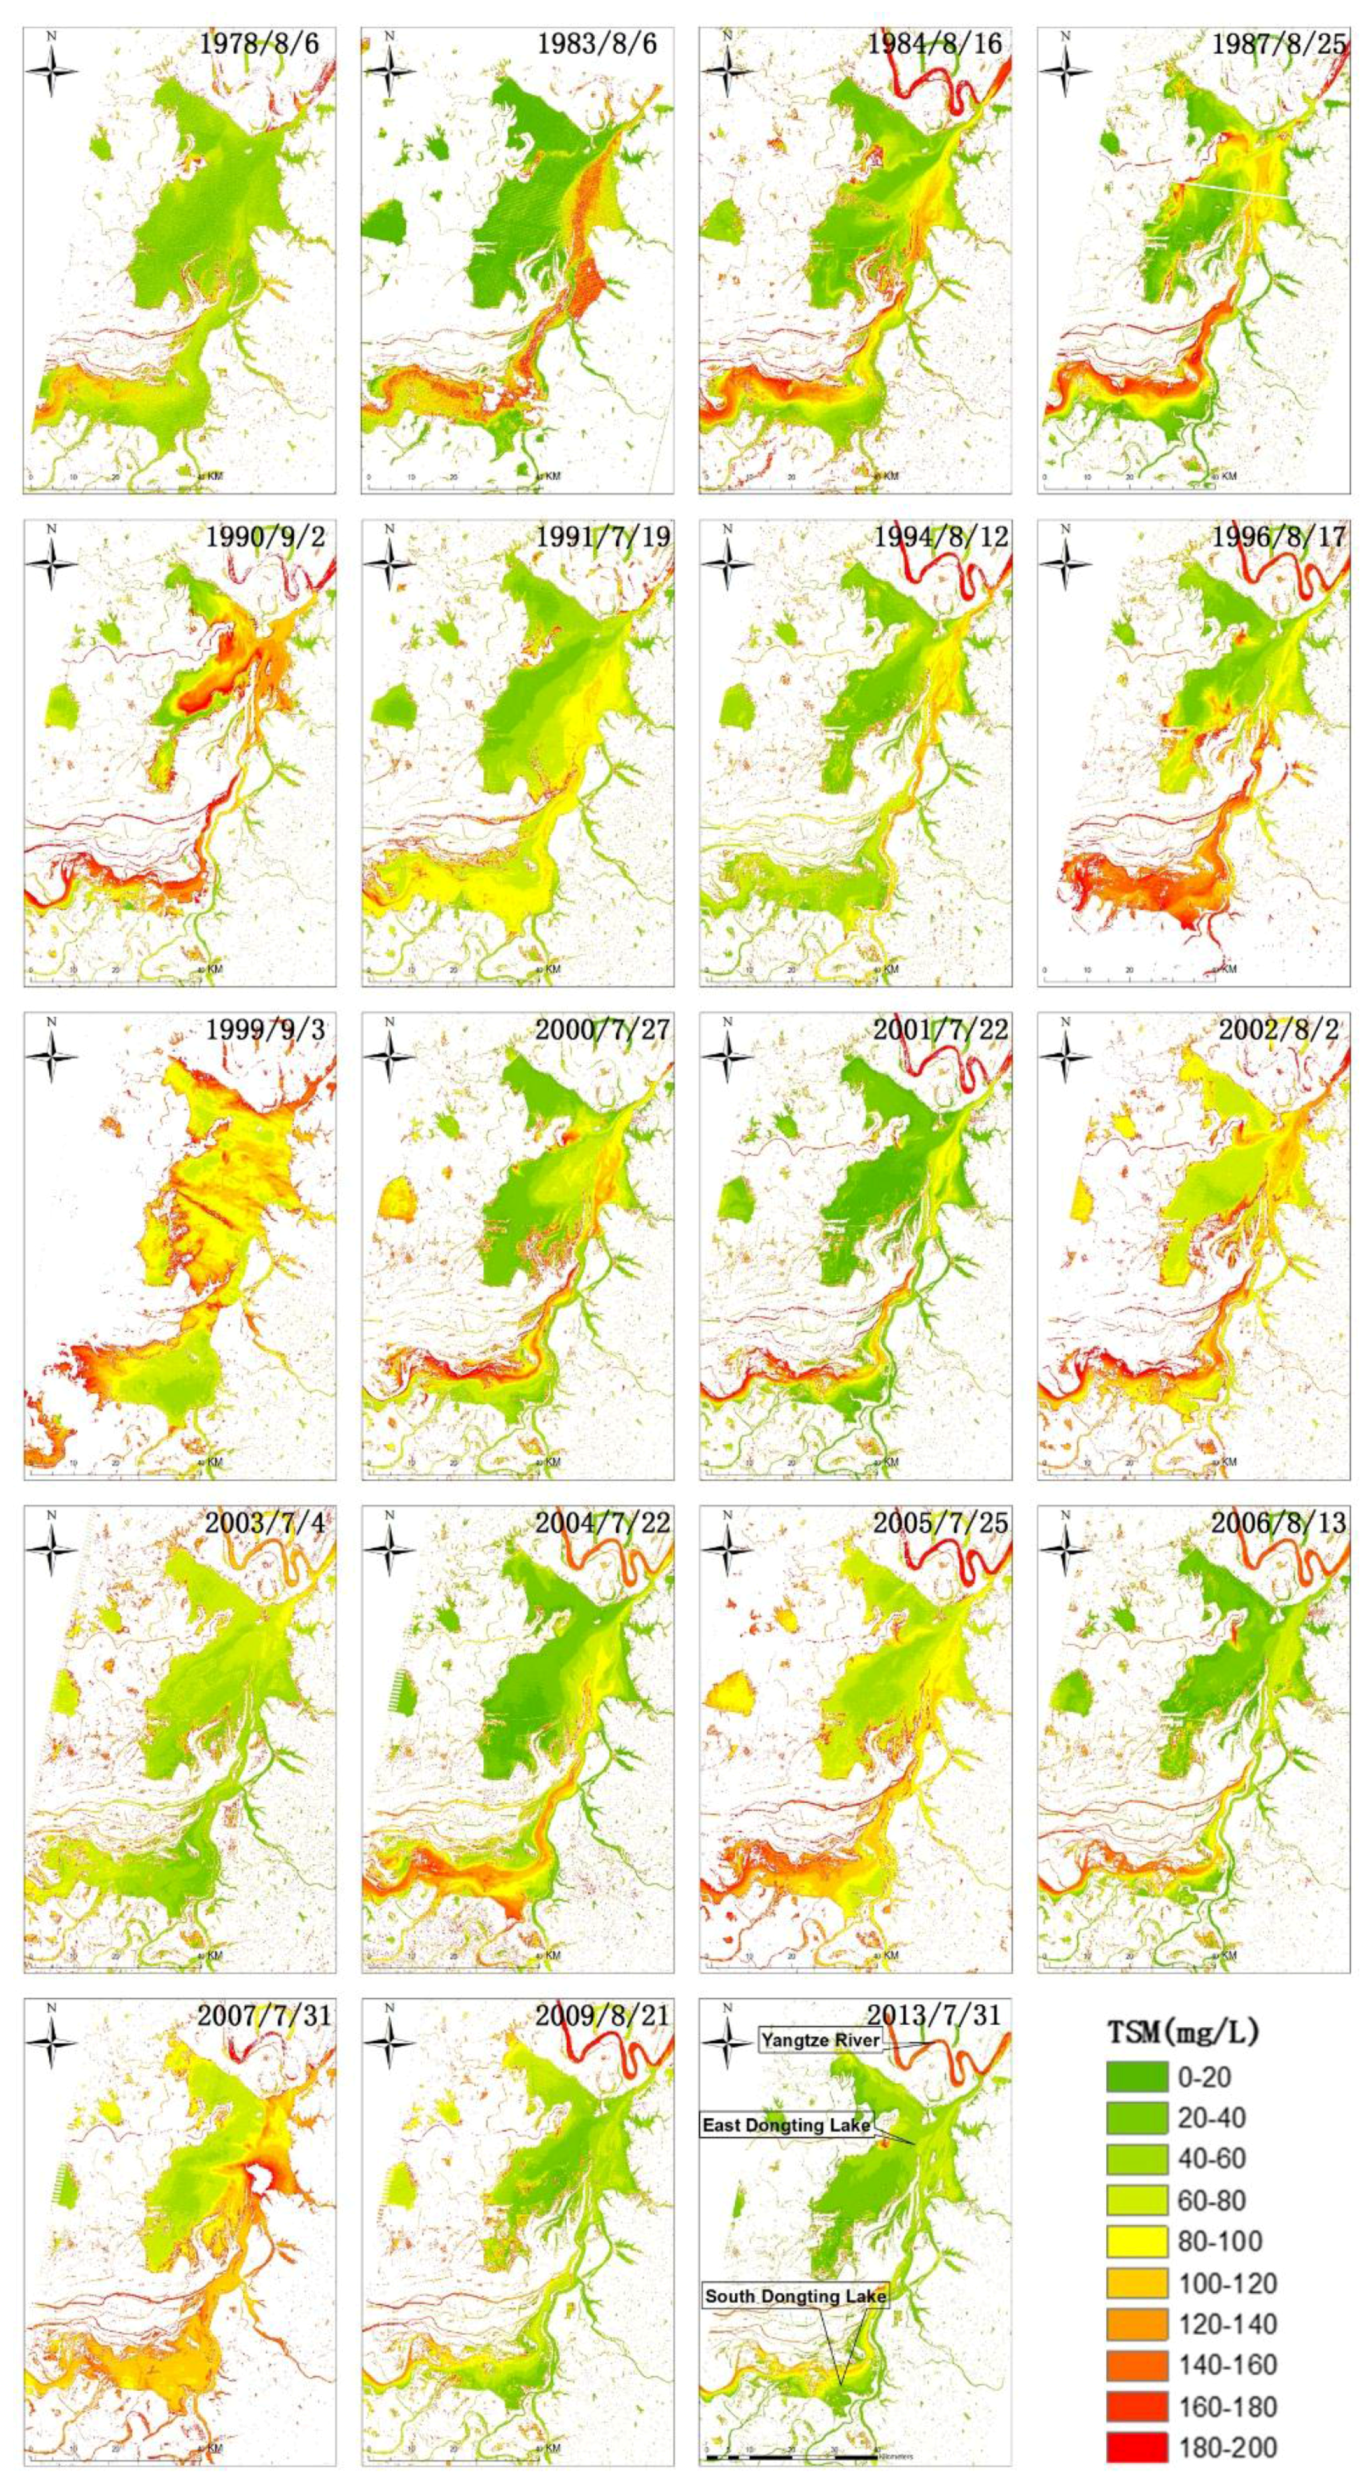
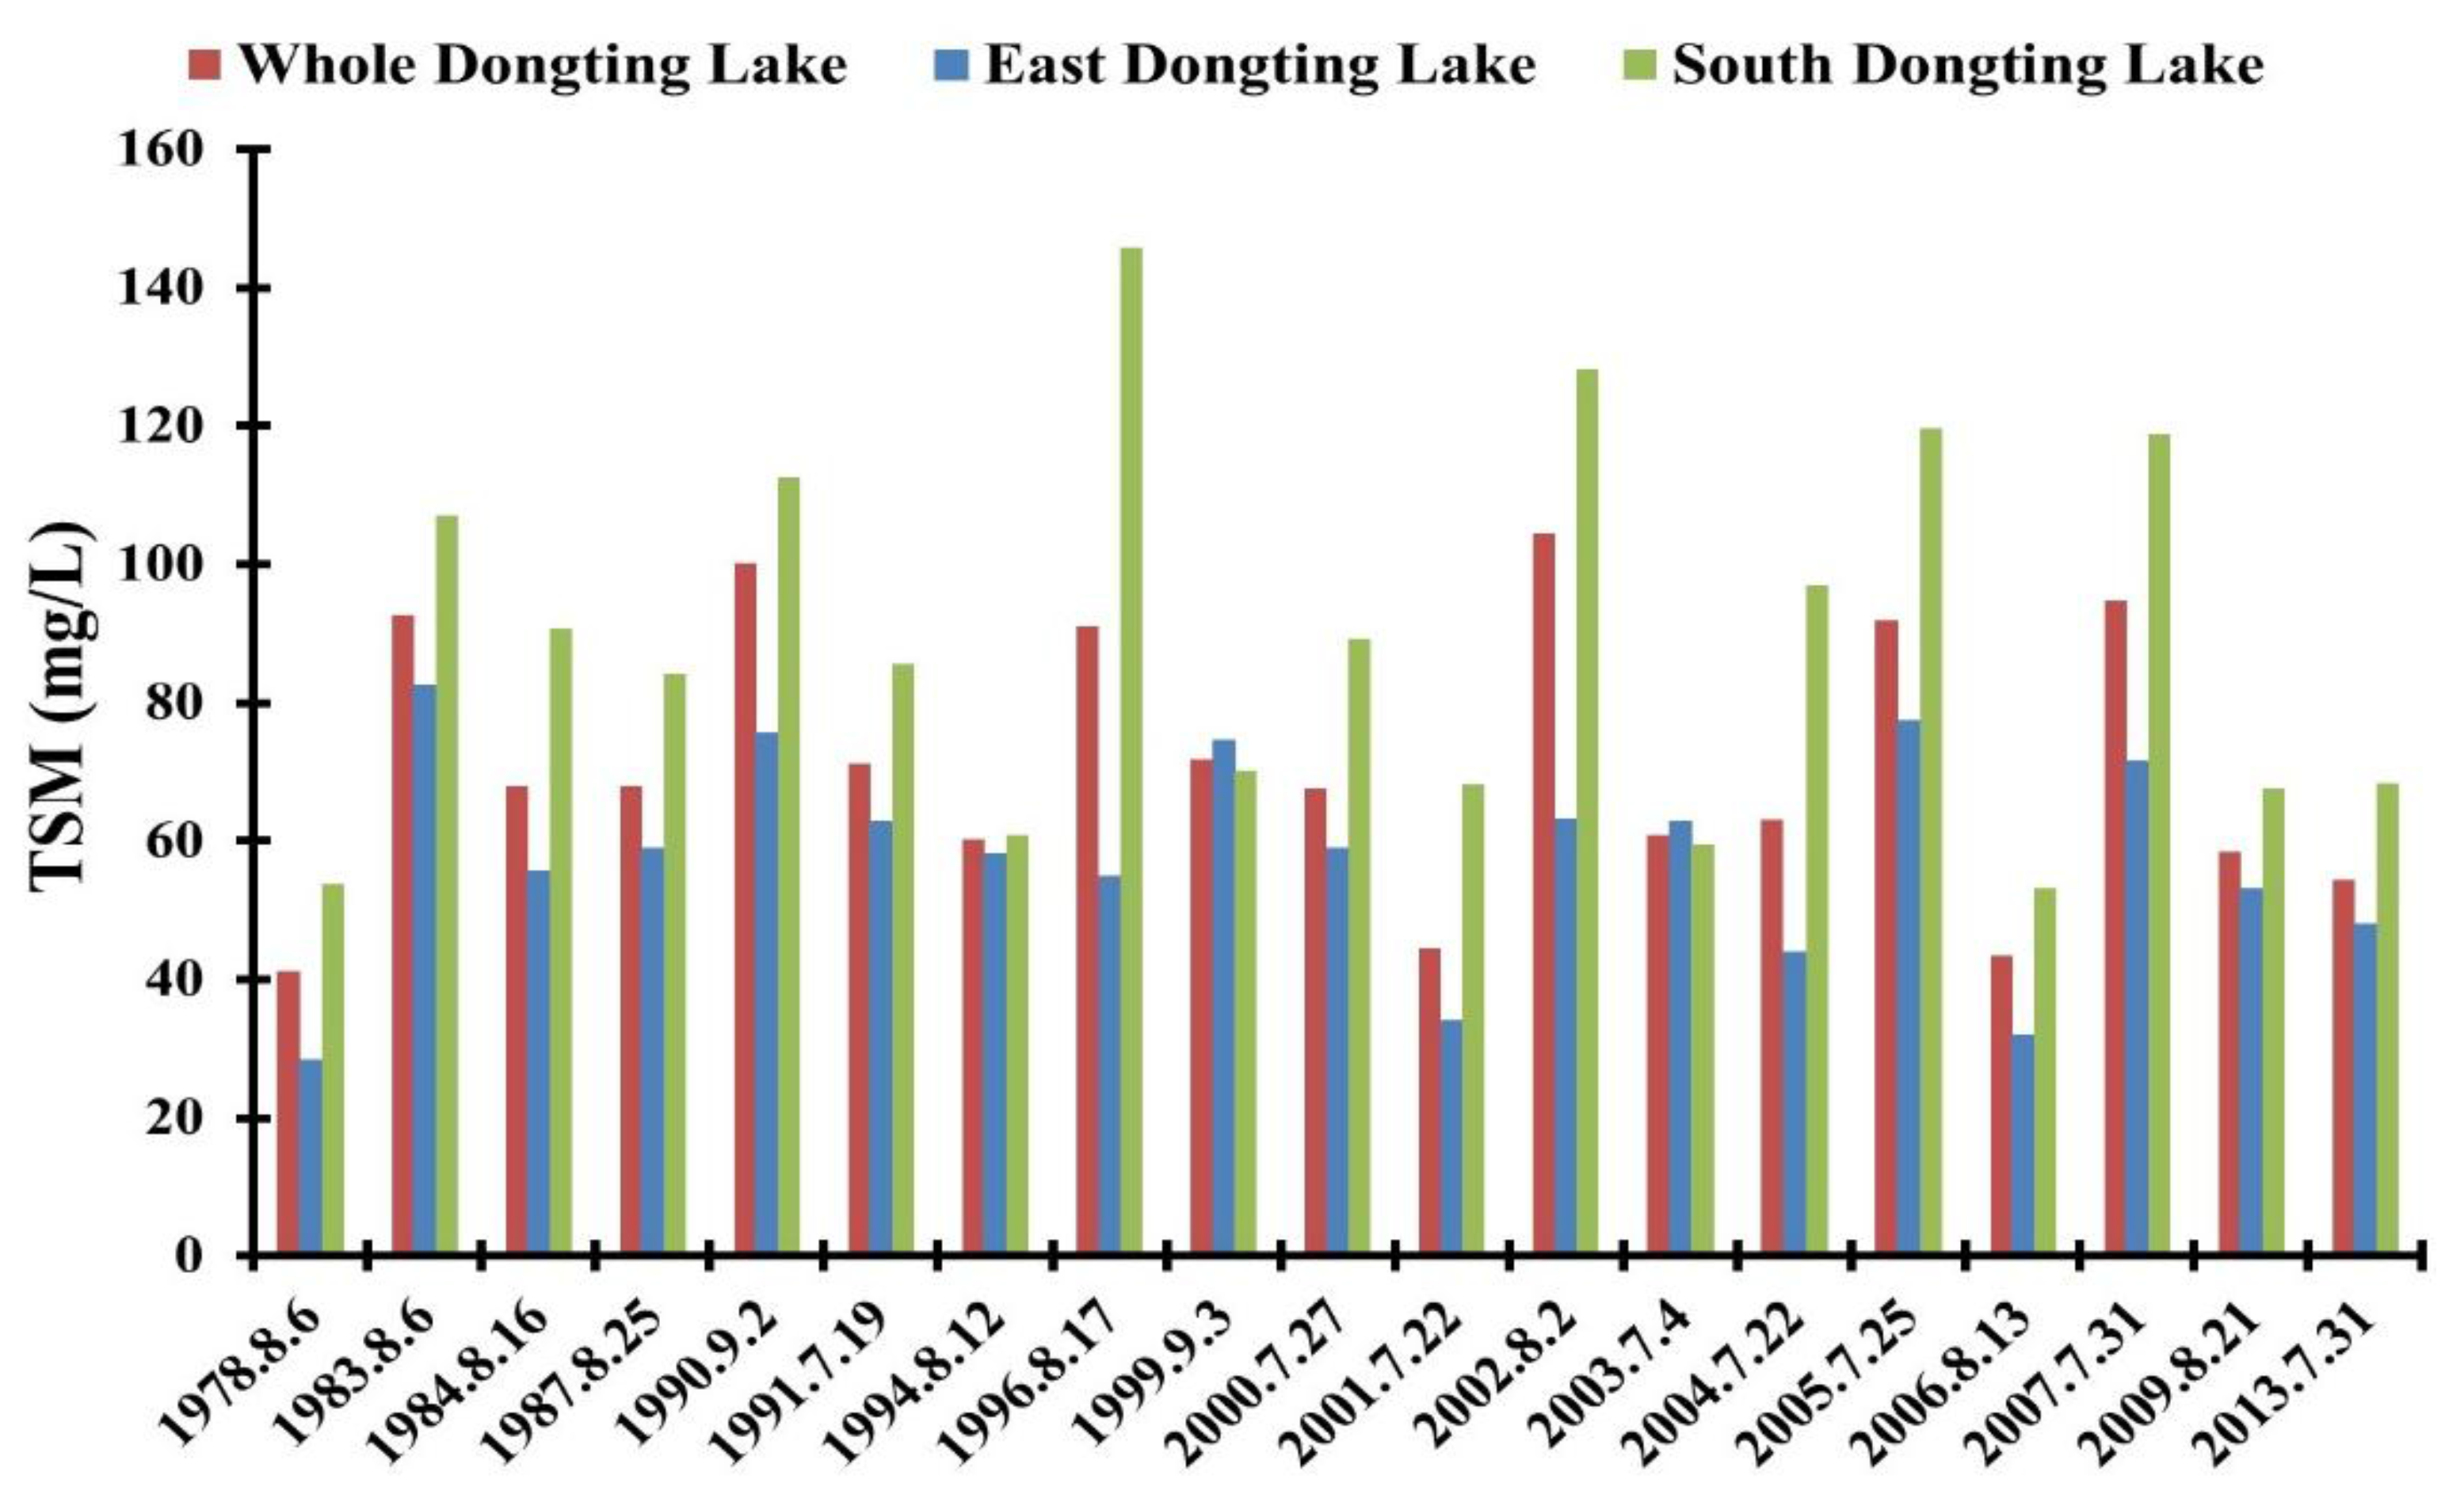
3.4. Spatial Pattern Distribution of TSM

The TSM-derived models in Equations (5)–(7) were applied to the 19 selected Landsat series wet-season images for OLI, ETM+/TM and MSS, respectively. The Landsat-derived TSM pattern snapshots for Dongting Lake are presented in Figure 4, which shows the pattern changes in TSM from 1978 to 2013. The lowest mean TSM value was 41.3 mg/L on 6 August 1978 and the highest was 104.5 mg/L on 2 August 2002, with the highest value almost three times greater than the lowest, which confirms that Dongting Lake experienced extremely high spatial variation in TSM.
Figure 4. Derived-TSM pattern distribution snapshot map in the wet season at Dongting Lake from 1978 to 2013.
Remotesensing 07 13975 g004
Note that Figure 4 is a snapshot of the TSM pattern for Dongting Lake, and so it cannot represent the mean TSM for each year in the wet season. The figure can, however, clearly show the spatial patterns in each derived-TSM snapshot, and the regional differences and changes in TSM patterns in WDL, EDL and SDL. Figure 5 shows that the TSM had significant spatial variability between 1978 and 2013. Overall, the mean TSM of each snapshot of WDL varied widely, from 41.3 mg/L on 6 August 1978 to 104.5 mg/L on 2 August 2002, with a long-term mean of 70.9 mg/L (S.D. = 33.1 mg/L and C.V. = 48%). The mean TSM in each snapshot in EDL was generally lower than in WDL between 1978 and 2013, with lowest and highest TSM values of 28.4 mg/L on 6 August 1978 and 82.5 mg/L on 6 August 1983, and a long-term mean of 57.7 mg/L (S.D. = 28.4 mg/L and C.V. = 51%). The mean TSM in each snapshot of the SDL area was consistently higher than it was for WDL and EDL, ranging from 53.2 mg/L on 13 August 2006 to 145.7 mg/L on 17 August 1996, with a long-term mean of 88.4 mg/L (S.D. = 35.3 mg/L and C.V. = 43%). However, it is clear from Figure 4 that the TSM in each snapshot of the eastern part of EDL was much higher than it was in other EDL areas. The northern part of SDL had the same scenario, with a much higher TSM than was present in other parts of SDL. Remember that most of the mining sites are distributed in the eastern part of EDL and the northern part of SDL. At the same time, most of the sand mining areas are typically associated with high TSM levels in the EDL and SDL. This leads to the question of whether sand mining has an impact on the TSM patterns change. If so, when did the influence start, and how did sand mining impact the TSM variation?
Figure 5. Derived mean TSM for WDL and two sub-regions of EDL and SDL in the wet season, from 1978 to 2013. WDL is the Whole Dongting Lake, EDL is the East Dongting Lake, and SDL is the South Dongting Lake.
Remotesensing 07 13975 g005

4. Discussion

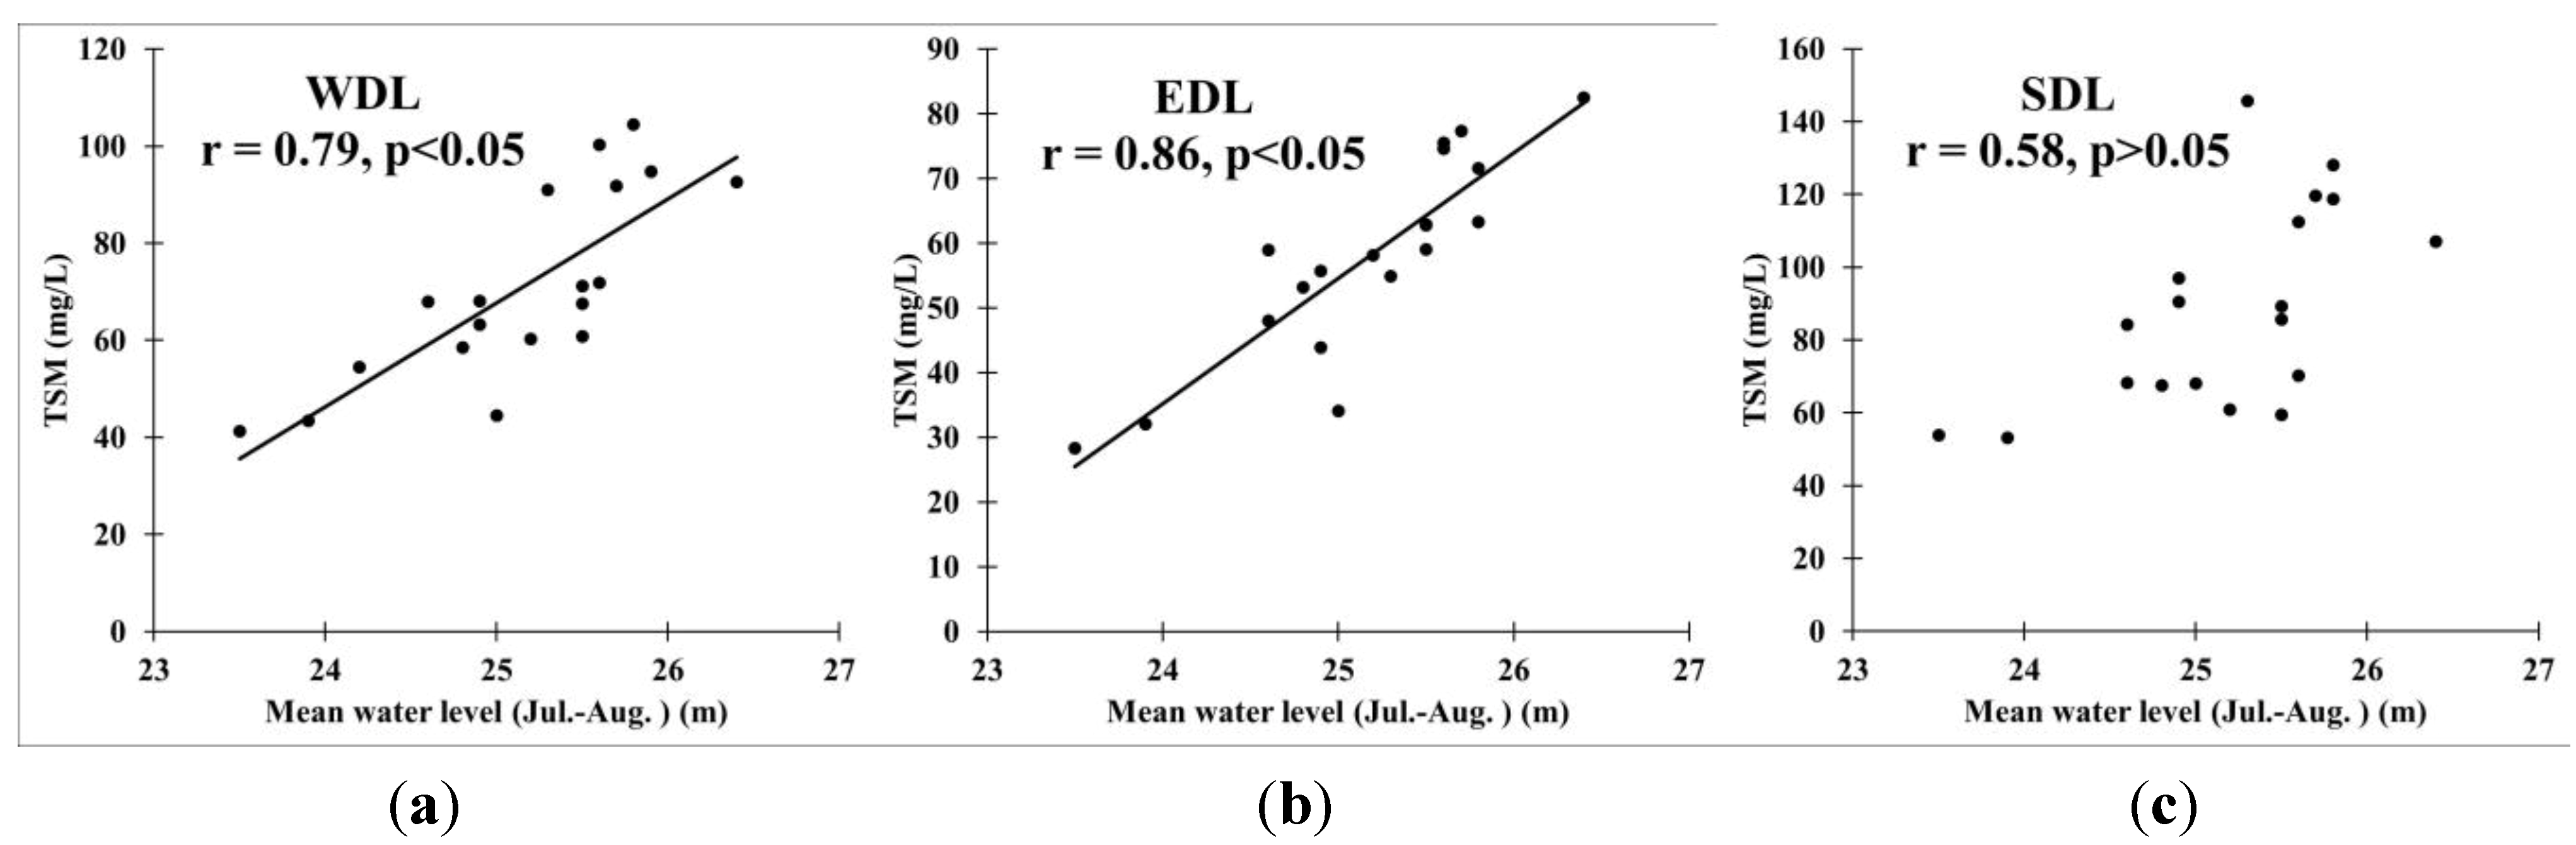
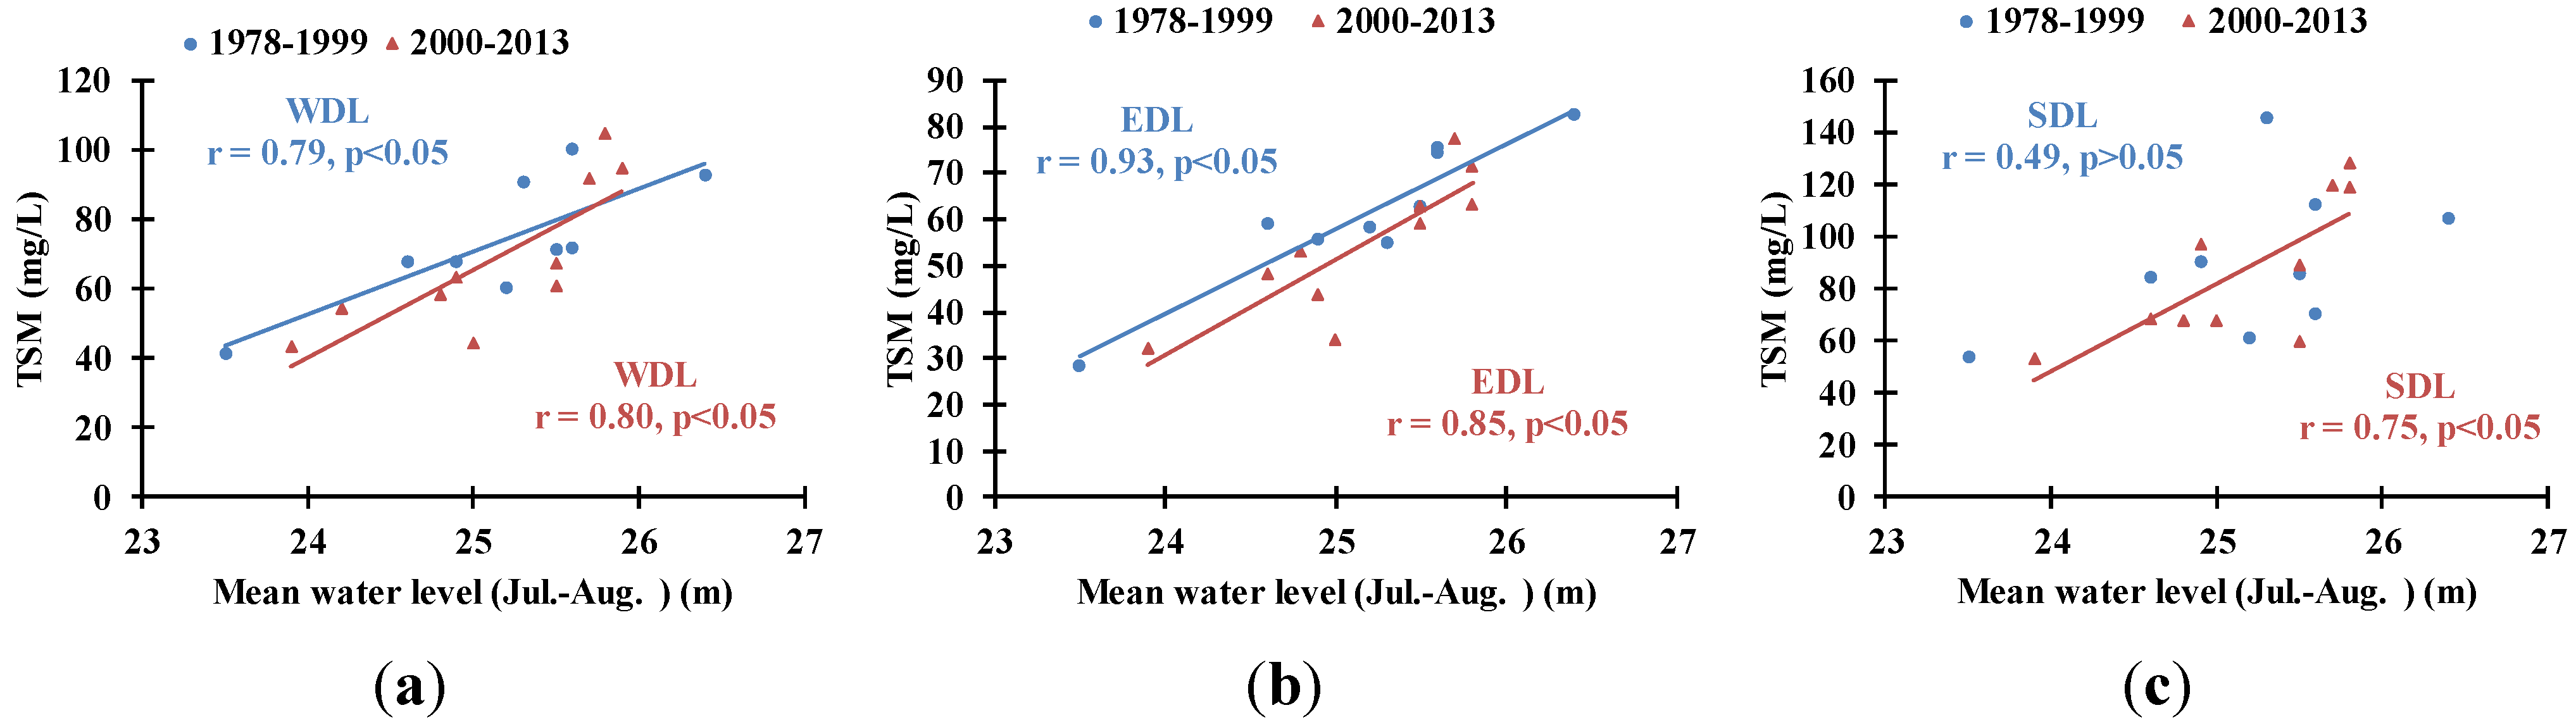
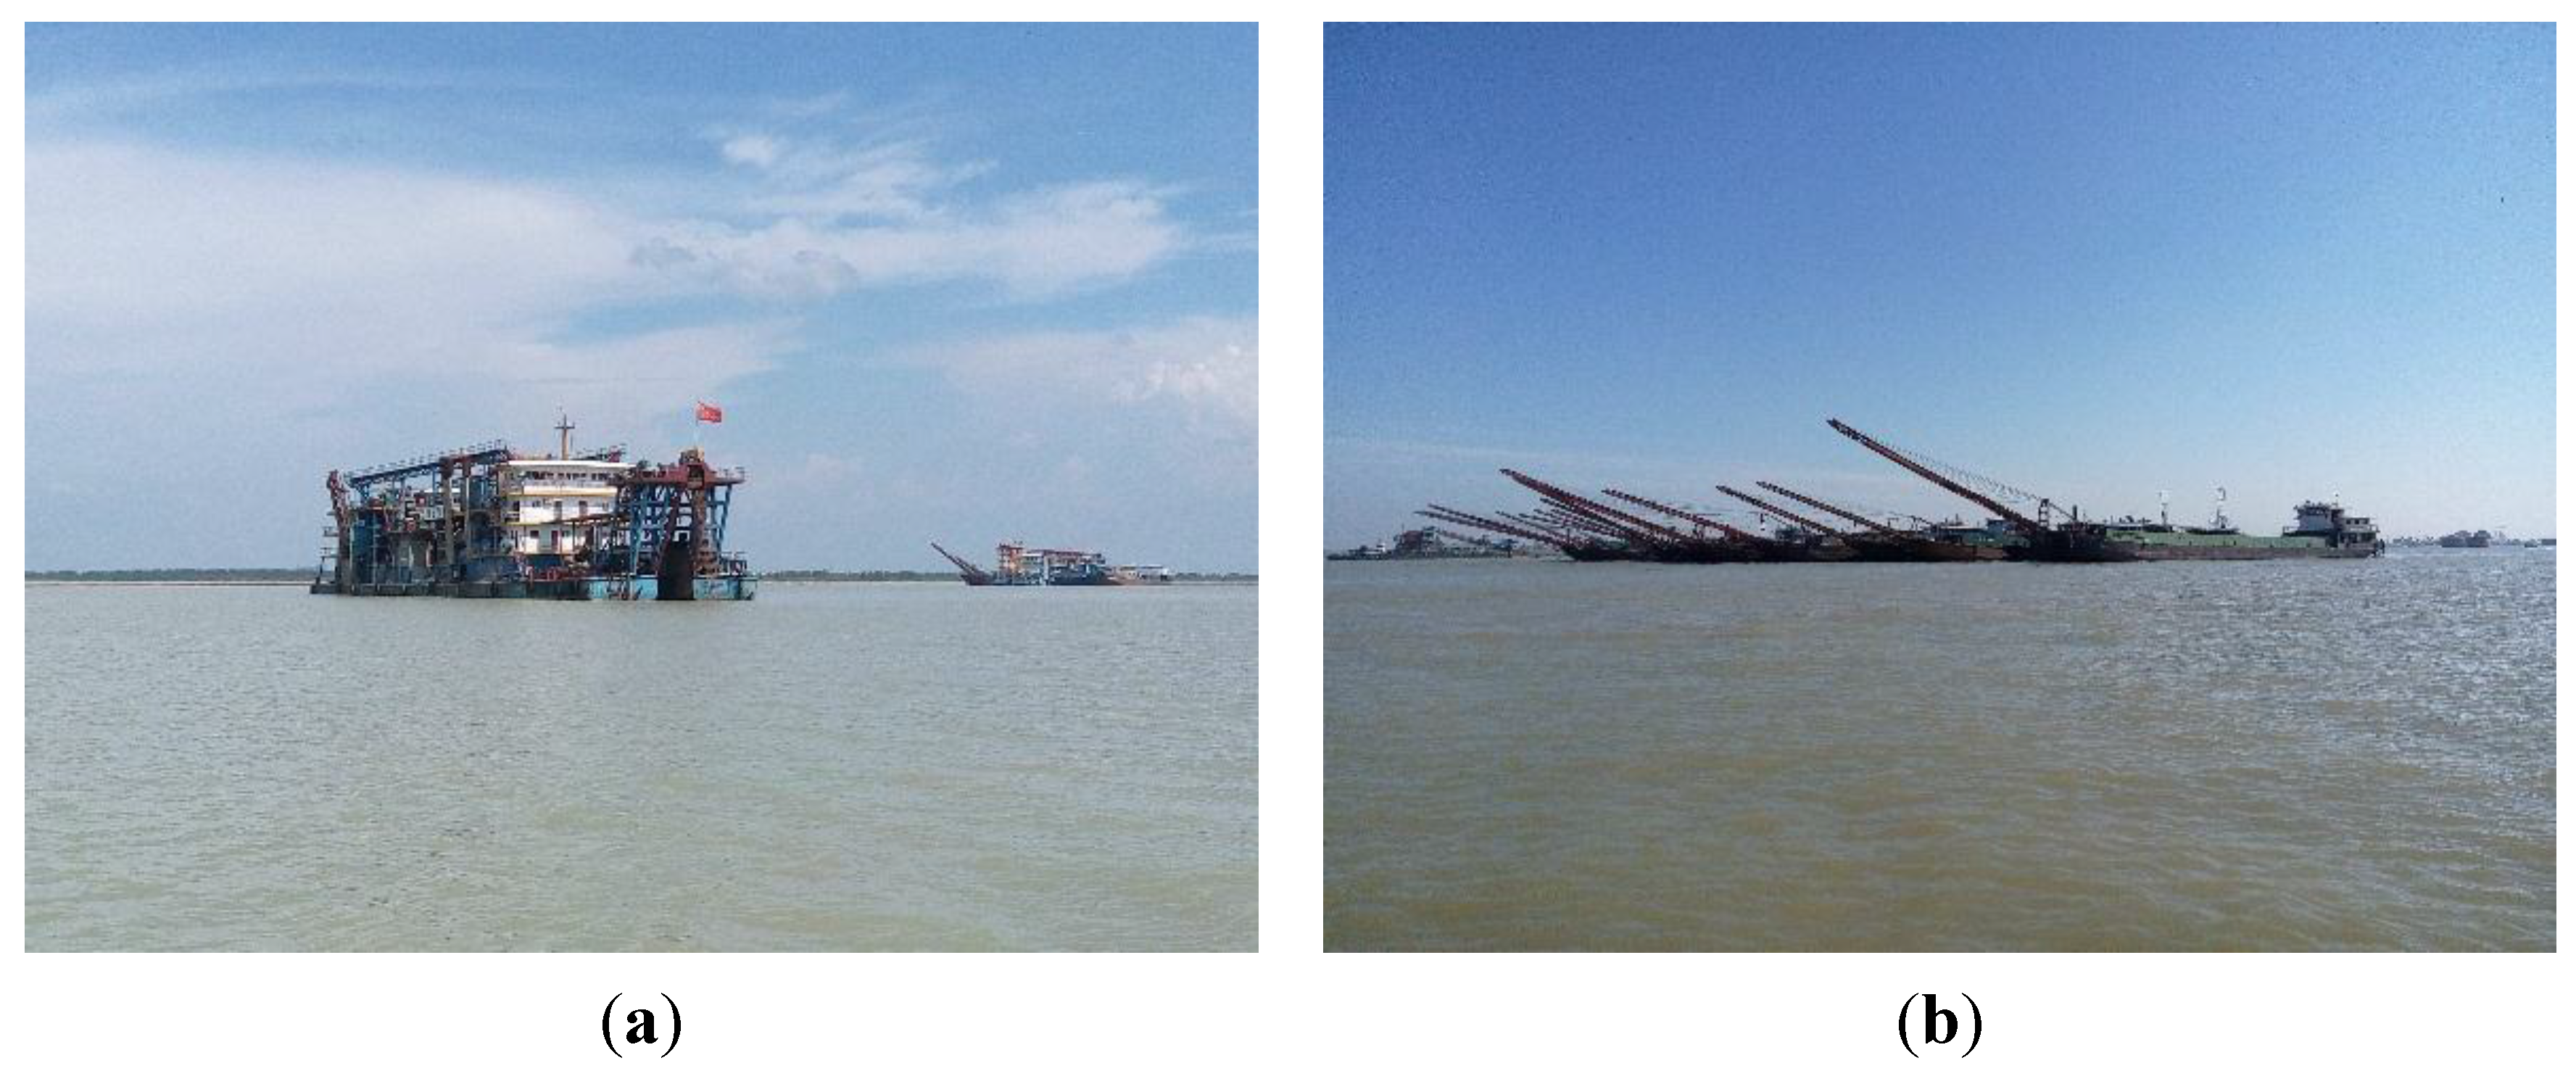
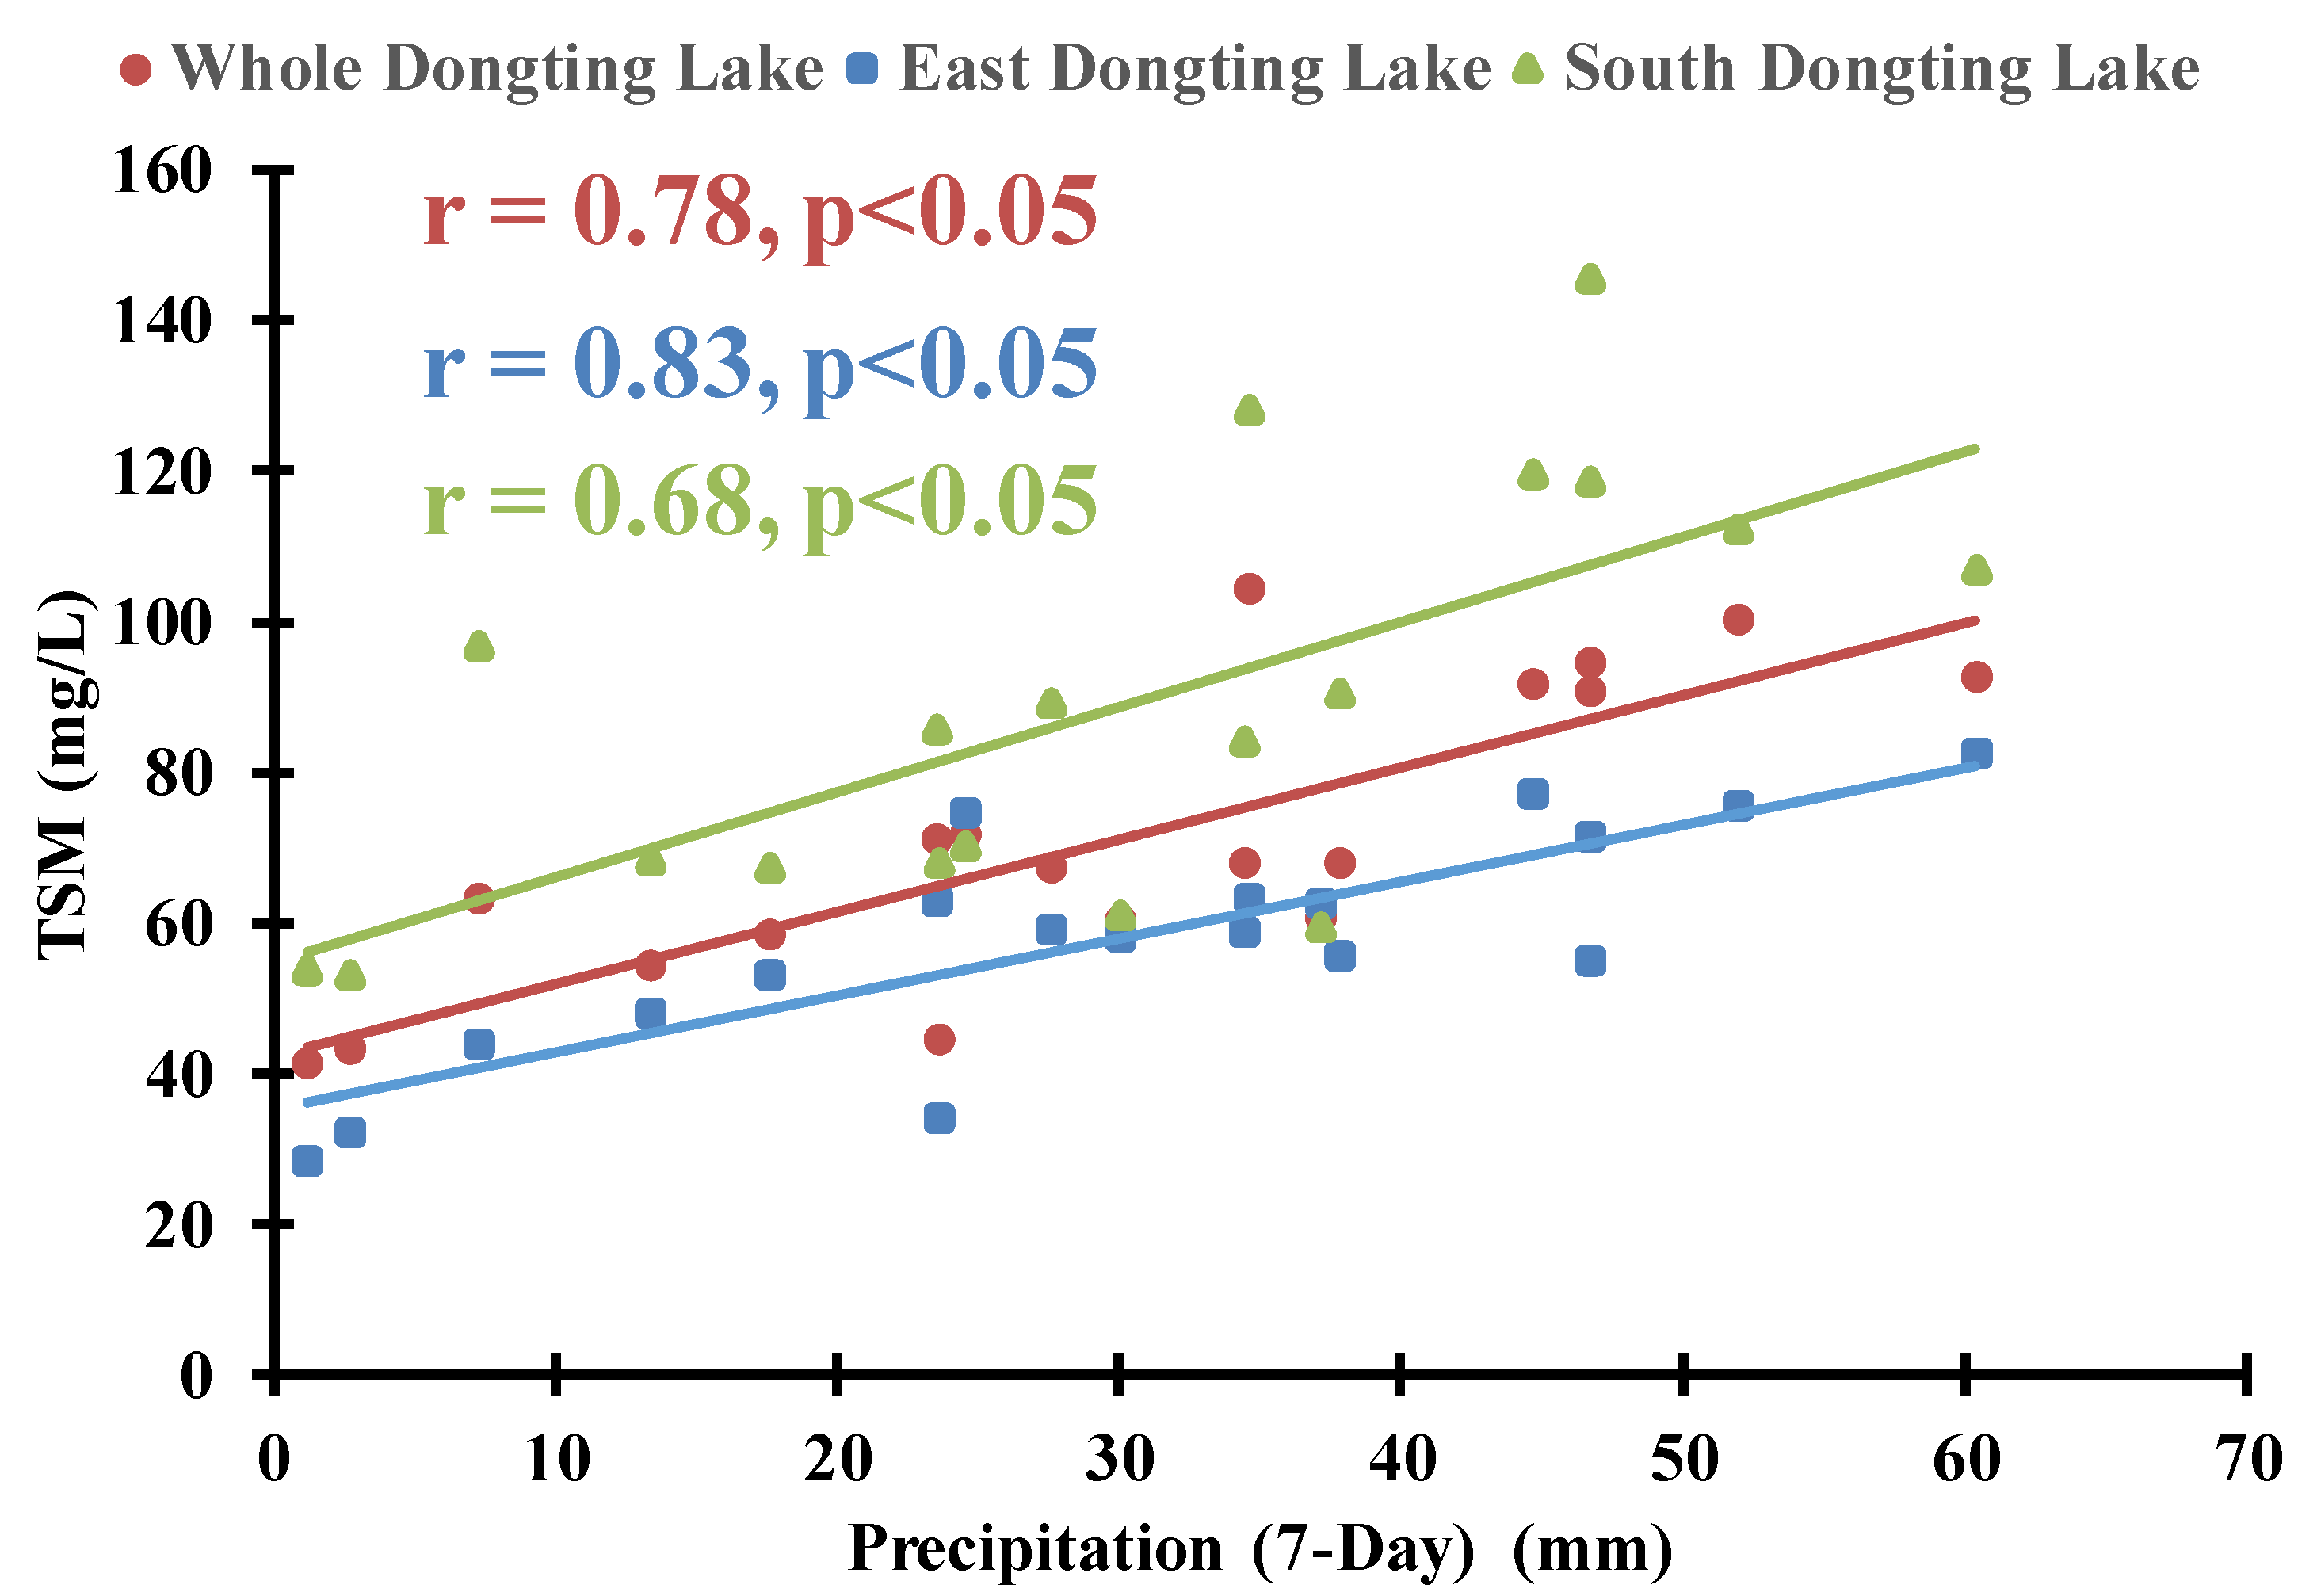
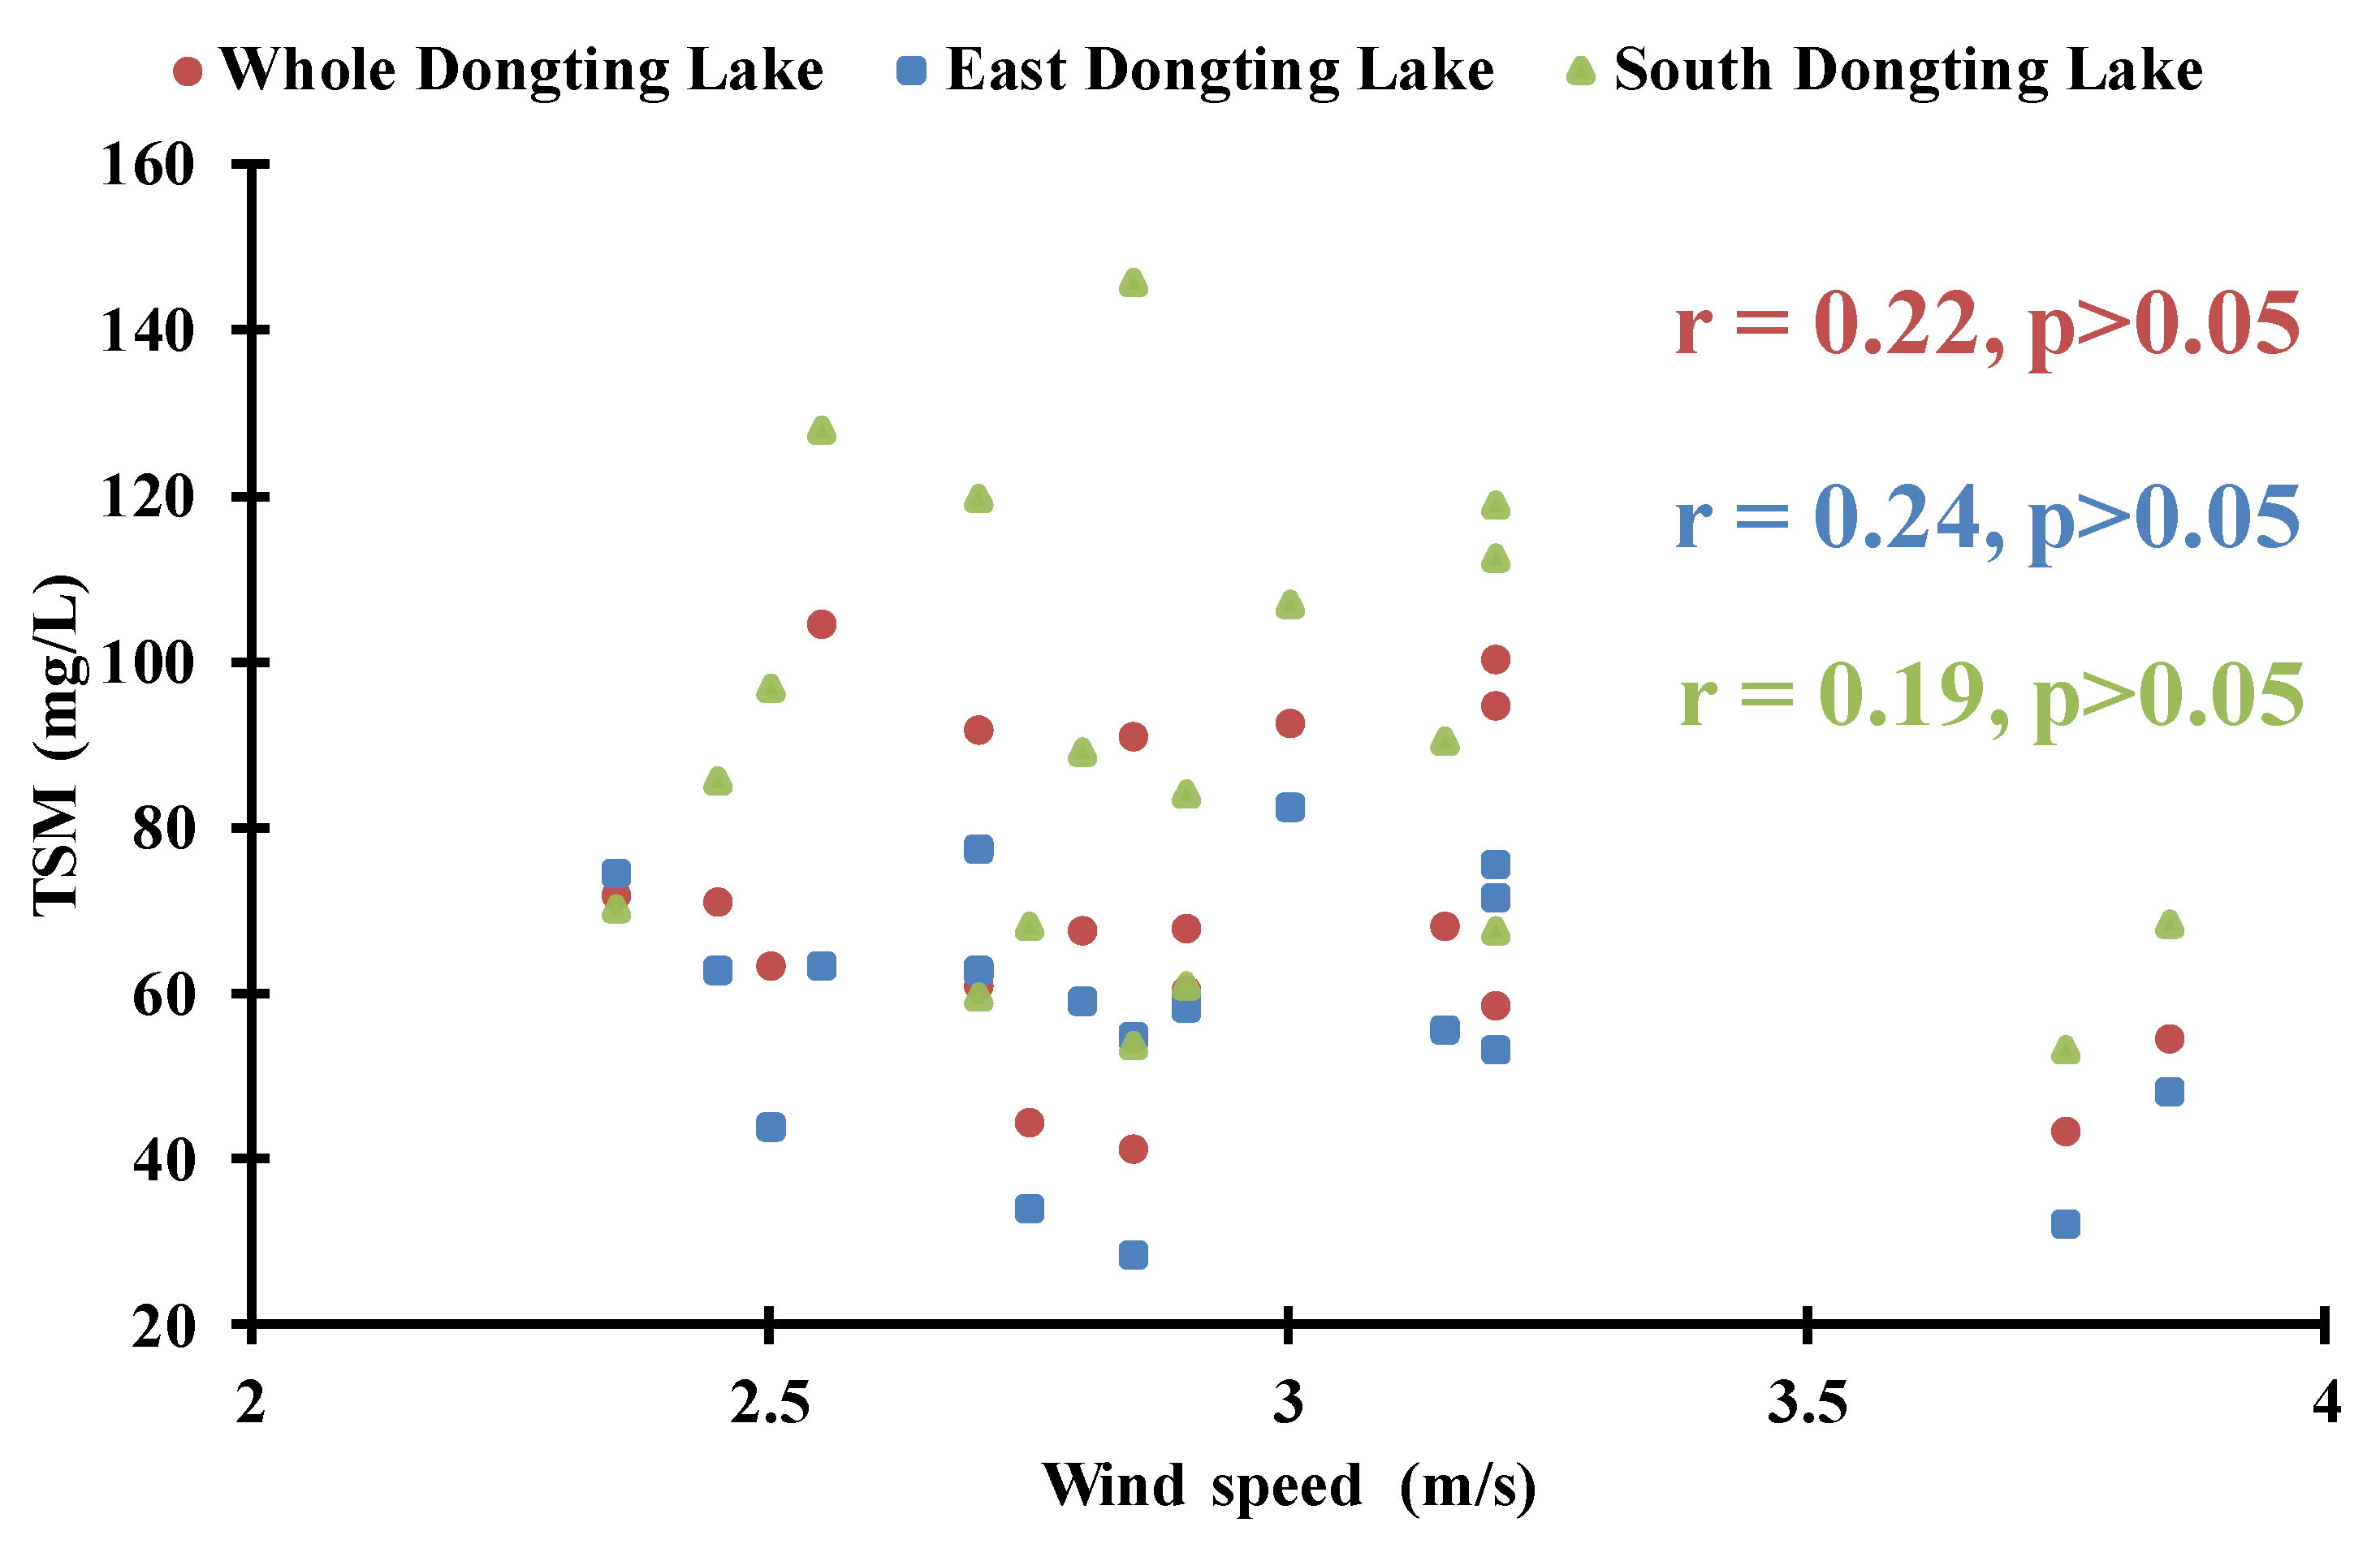
4.1. Factors Affecting the Spatial and Temporal Changes in TSM

To test whether the TSM variation was driven by water level, the relationship between mean TSM and the local water level measured at Chenglingji hydrological station was evaluated. A correlation analysis showed a statistically significant correlation between the mean water level from July to August and the mean TSM from 1978 to 2013, with a correlation coefficient (r) of 0.79, 0.86 and 0.58, respectively, for WDL, EDL and SDL (Figure 6). The result was similar to the findings of many previous studies [24,54,55,56] that have suggested that water level could affect lake area variation, sediment charge and other environmental conditions in Dongting Lake. The r for WDL was 0.79, which represents a significant correlation (p < 0.05, with t-test). The r of 0.86 for the EDL area is significant (p < 0.05, with t-test), which indicates that the TSM value in this area was affected most by water level. In comparison, the r for SDL was only 0.58, which indicates no significant correlation (p > 0.05, with t-test). However, this result might be explained by the extreme complexity of the river system network in this area, in which a number of rivers flow into SDL (Figure 1). Moreover, Chenglingji hydrological station, which is situated in EDL and far from SDL, might be another reason for the better correlation in EDL. The more important result indicates that water level has a significant correlation with TSM and is an important factor for TSM variation in Dongting Lake, particularly in EDL.
Figure 6. Relationship between mean TSM and mean water level from July to August. The r of the data pairs in WDL (a) and EDL (b) show statistically significant correlations. Correlation analysis showed no significant correlation of the paired data in SDL (c).
Remotesensing 07 13975 g006
Since 2000, mean TSM and mean water level have both been decreasing. As seen in Figure 7a, the correlation analysis shows a statistically significant correlation between mean TSM and mean water level from July to August beginning in 2000, with a correlation coefficient (r) of 0.80 for WDL, which is also statistically significant (p < 0.05, with t-test). Likewise, strong correlations were also found between mean TSM and mean water level from July to August beginning in 2000, both in EDL and SDL, with r of 0.85 and 0.75, respectively, which are also statistically significant (p < 0.05, with t-test). It should be noted that the r of 0.85 for EDL from 2000 to 2013 has been decreasing compared with the r of 0.93 (p < 0.05, with t-test) between 1978 and 1999 (Figure 7b). In contrast, the r of 0.75 for SDL from 2000 to 2013 has been increasing dramatically with a significant correlation (p < 0.05, with t-test), compared with the r of 0.49 between 1978 and 1999 (Figure 7c). This also begs the question of what may have caused these changes since 2000.
A management policy became effective in 1998, which prohibited sand mining in the Yangtze River [57]. Since then, numerous dredging vessels were deployed in Dongting Lake, as well as Poyang Lake [57,58], leading to excessive and often out-of-order mining in EDL and SDL. The sand mining vessels were distributed along the shore of WDL. A survey conducted in August 2013 revealed that there were hundreds of large sand mining vessels within more than 80 km from SDL northward to EDL, an example of which is provided in Figure 8a. Moreover, there are hundreds of other vessels called “automatic unloading vessels” (Figure 8b). They shuttle between sand mining vessels and giant sand carrier vessels and cause sediment resuspension from time to time. An illustration of sand mining activities can be seen in the numerous mining vessels and automatic unloading vessels that can be observed in the high-resolution images of Google Map (https://www.google.com/maps/). TSM variation has thus been deeply affected by human activities such as the disturbances and resuspension caused by an increasing level of sand mining, as well as land reclamation through the construction of dykes. Sand mining might in fact become the main factor of TSM variation in WDL after 2000.
Figure 7. Relationship between mean TSM and mean water level from July to August for WDL (a); EDL (b) and SDL (c). The blue line is the regression line for the years 1978 to 1999 and the red line is the regression line for the years 2000 and 2013.
Remotesensing 07 13975 g007
Figure 8. Digital photo taken at EDL on 7 August 2013 showing sand mining vessels (a) and automatic unloading vessels (b).
Remotesensing 07 13975 g008
The Three-Gorges Dam, the largest hydropower station in the world, is located in the upper Yangtze River. When the TGD was near completion in 2000, the intent was to trap a massive amount of water and sediment that would otherwise flow into the lower Yangtze River [29,59]. As shown in the Yangtze River Sediment bulletins (http://www.cjh.com.cn/pages/nsgb.html/), the water level declined significantly from 2000, directly affecting Dongting Lake and Poyang Lake [24,60,61], and creating a more variable lake boundary and water depth in Dongting Lake as a whole, especially in the shallow areas of SDL and EDL. Water level may affect water depth, which might in turn affect the resuspension of sediment; it might also affect the lake area, which would affect the resuspension of sediment through wave formation and intensity. The TSM variation in this area, especially after 2000, could thus be due to the impoundment of the TGD, although identifying the precise reason for the variation requires further investigation when additional hydrological and meteorological data become available.
The relationship between mean TSM and other potential affecting factors, such as precipitation data, is also illustrated in Figure 9, which shows a statistically significant positive correlation between seven-day precipitation and mean TSM from 1978 to 2013, with r of 0.78, 0.83 and 0.68 (p < 0.05, with t-test), respectively, for WDL, EDL and SDL. The noticeably high correlation is similar to the findings of many previous studies [62,63,64,65] that suggest that precipitation can affect the distribution of TSM. However, no significant correlation was found between daily precipitation and mean TSM or between 30-day precipitation and mean TSM. The lack of a significant correlation for daily precipitation might be explained by a delayed effect of precipitation on TSM variation. At the same time, 30-day precipitation also had no significant correlation because the period was along enough to cover or smooth the real precipitation effect, particularly for Dongting Lake as a river-communicating lake. We can thus conclude that TSM was likely affected by short-term precipitation (seven-day), and that it had a delayed effect on the distribution of TSM variation.
Figure 9. Relationship between precipitation data and mean TSM, 1978–2013. Precipitation data refers to total precipitation over seven days prior to the acquisition date of each Landsat image, measured at Yueyang meteorological station. Results show a statistically significant positive correlation for WDL, EDL and SDL.
Remotesensing 07 13975 g009
Mean TSM and daily wind speed were measured at the Yueyang meteorological station from 1978 to 2013, and the wind speed data were coincident with the acquisition date of each Landsat image. Figure 10 shows no significant relationship between wind speed and TSM in WDL, EDL and SDL. This result differs from the findings of some previous studies [66,67,68,69], which have suggested highly fluctuating TSM in large and shallow lakes and at the gulf end of the estuary, due to wind resuspension. Changes in other meteorological factors (e.g., temperature, air pressure and relative humidity) might influence TSM variation in the Dongting Lake region, but the correlation analysis for these meteorological factors and mean TSM showed no significant relationship, indicating that their impact on TSM variation is small when measured over such a long period. Note that the r value of WDL and EDL, which was measured not only between mean water level and TSM variation, but also between precipitation data and TSM variation, was relatively higher than it was for SDL. This might be because the hydrological and meteorological data for SDL were collected at the Chenglingji and Yueyang meteorological stations, both of which are a long distance from SDL. A more accurate correlation for SDL could be achieved if hydrological and meteorological data near the lake were available.
Figure 10. Relationship between mean TSM and wind speed, 1978–2013. No significant correlations were found for WDL, EDL or SDL.
Remotesensing 07 13975 g010
In summary, we have demonstrated that TSM in Dongting Lake has a clear spatial variation that can be explained by some environmental factors and meteorological conditions. Indeed, the occurrence of disturbances by sand mining and anthropogenic activities (e.g., TGD) could also lead to the TSM patterns change, and their potential linkages could be studied once additional socioeconomic and environmental data are available.

4.2. Suitability and Uncertainty of TSM-Derived Model

Long-term changes to the TSM pattern were first clearly identified and quantified via Landsat images, leading to several findings. The question as to whether the Landsat satellites are suitable for modeling derived TSM remains, however, and the uncertainty of the TSM-derived model is also not yet known.
Ideally, Dongting Lake’s TSM variation would be evaluated based on even higher temporal resolution data than are available from Landsat in order to account for the seasonal and inter-annual pattern changes for different cover types. The shortage of satellite image data due to the lower temporal resolution of Landsat data is thus a weakness of this study. We could find just one Landsat image per year in the wet season between 1978 and 2013 due to the heavy cloud cover in the subtropical area and the 16-day cycling period of Landsat Satellites. We therefore needed to rely on the snapshot map of Dongting Lake to retrieve the TSM patterns. However, considering its relatively high spatial resolution (30–60 m) and long-term data record (>30 years), Landsat appears to be most suitable for documenting long-term TSM in the lake and its changes over recent decades [70]. Although there are two MODIS instruments that provide daily global coverage, the 250 m-resolution data appear to have difficulty discriminating small amounts of TSM and its changes, especially in such an extremely variable area. In addition, MODIS data have only been available since 2000, so they do not allow for the documentation of historical TSM or other natural conditions that existed several decades ago. Moreover, the Landsat images used in this study were collected between July and September, so the environmental and hydrological conditions of the Dongting Lake region should be similar during each year for TSM-derived model.
A derived-TSM algorithm might introduce some uncertainties. The algorithm was developed from in situ Rrs data and then applied to Landsat-based derived Rrs data via rigorous analysis, with a spectral response function for each sensor. For the purpose of adopting the spectra for Landsat sensors, the derived-TSM model is simple, using just one NIR band available from the entire Landsat satellite. Furthermore, our validation of the accuracy of the Landsat 8 OLI image was coincident with the fieldwork period. The model exhibited acceptable performance, with uncertainties for the OLI-based model of 20.6% for MAPE and 7.72 mg/L for RMSE, which were slightly greater than the simulated OLI-based MAPE of 18.6% and RMSE of 5.79 mg/L. These results clearly indicate the acceptable performance of the TSM-derived model for a dynamic range (4–101 mg/L) in the Dongting Lake area. Ideally, the Landsat-based derived-TSM model would be valid for all of the Landsat sensors, including OLI, ETM+/TM and MSS. Due to the good performance of the OLI-based validation, the TSM-derived model would be expected exhibit acceptable performance for all of the Landsat images. We were therefore able to use the TSM-derived model to map long-term TSM distribution patterns in Dongting Lake using Landsat images.
The different spatial resolution for each type of Landsat satellite image might be another source of uncertainty. For the purpose of retrieving TSM and other data, the pixel size must be consistent. The spatial resolution of the NIR band for the MSS sensor is 78 m, which has been re-sampled to 60 m by the data provider (USGS). Thus, in order to reference a consistent spatial resolution for the NIR band for ETM+/TM and OLI, the MSS images were resampled to 30 m so that the derived TSM and data could be evaluated with the same spatial resolution as the ETM+/TM and OLI sensors. The uncertainty produced by different pixel sizes for the Landsat satellite images should therefore be minor.
Finally, the regression slope between in situ TSM measurements and Landsat-based derived Rrs(NIR) may contain some uncertainty, especially in the high TSM range. Our in situ data, which ranged from 4 to 101 mg/L, were obtained for all of Dongting Lake. Ideally, more in situ data could be used to increase the accuracy of the TSM algorithm when more resources are available in the future. Although some of the derived-TSM data were more than 100 mg/L, only the two-year mean TSM of SDL was greater than 100 mg/L, and most of the means were less than 70 mg/L. Meanwhile, changes in the regression slopes, even after adding more data for tuning the algorithm coefficients, would only change the absolute magnitude of the Landsat-derived TSM but not the long-term temporal patterns or trends observed here, especially when considering the similar sediment properties in different years in a relatively small region.

4.3. Long-Term Monitoring and Applications

Landsat-based observations were essential to our research findings, as they provided historical satellite images of relatively high spatial resolution over a period of more than three decades. However, Landsat satellites are land-resource satellites, so the temporal resolution might not be high enough for daily or weekly observations of inland water, since the data are repeatedly collected every 16 days for each position.
To form a long-term, non-interrupted TSM distribution for Dongting Lake and its adjacent Yangtze River, including TGD, other existing or planned satellite instruments are required. The Chinese government has approved the implementation of a high-definition earth observation system (HDEOS), and the first and second mission Gaofen-1 and Gaofen-2 satellites were successfully launched on 26 April 2013 and 19 August 2014, respectively [71,72], with spatial resolutions of 4 m and 1 m, respectively. “Gao fen” means “high resolution” in English. The main goal of the Gaofen series satellites is to provide high-resolution observations repeated every four days for climate change monitoring, geographical mapping, and environment and resource surveys [73]. Our findings could be used in research based on the next generation of satellite data, such as the Sentinel-3 Ocean Land Color Imager (OLCI) data, to derive TSM spatial and temporal distributions in Dongting Lake. The characteristics of the upcoming Sentinel-3 OLCI are similar to those of MERIS (e.g., spatial, full-resolution 300 m), with numerous improvements (21 bands, high Signal Noise Ratio). The satellite orbit provides a 27-day repeat for the topography package, with a four-day sub-cycle. The Sentinel-3 OLCI bands are optimized to measure water color over the open ocean, coastal zones, and inland waters [74]. Sentinel-3 would be appropriate for developing TSM estimation models, which could demonstrate new potential and challenges for assessing changes in the TSM patterns of Dongting Lake and other turbid inland waters.

5. Conclusions

A customized, Landsat NIR band-based algorithm was developed and validated in a rigorous analysis to retrieve the concentration of TSM in Dongting Lake. The model was then used to derive long-term changes in TSM patterns from 1978 to 2013, leading to several key findings. It was first clearly established that TSM variations in the wet season are highly correlated with water level. A correlation analysis showed a statistically significant correlation between mean TSM and mean water level from 1978 to 2013 in WDL and EDL. Since 2000, SDL has also had a significant correlation between mean TSM and mean water level. From 2000 to 2013, the r weakened in EDL compared with the period between 1978 and 1999, which could be a result of human activities such as an increased level of sand mining in response to the rapid economic growth occurring in the Dongting Lake area that has resulted in increased sediment resuspension. In contrast, the r significantly increased in SDL compared with the period from 1978 to 1999, which could be linked to the impoundment of the Three Gorges Dam after 2000. Furthermore, seven-day precipitation was also an important factor explaining TSM variation in Dongting Lake, but TSM has no significant relationship to wind speed and other meteorological factors.
The study provides a new TSM-derived algorithm and 35-year TSM data record for a turbid environment under the influence of both natural factors (water level and precipitation) and anthropogenic activities (sand mining and TGD). We attribute the outcome to the following factors: (1) access to over 35 years of continuous global observations from Landsat satellites; (2) an empirical method that applied a rigorous analysis to the derived-TSM variation between different Landsat sensors; (3) acceptable performance from a validation with a coincident OLI image; (4) a sufficient number of in situ measurements to allow for the successful development of TSM estimation; and (5) the availability of hydrological and meteorological data, such as water level data, precipitation and wind speed data.
The results could serve as a basis for future observations of TSM pattern change in Dongting Lake. In general, the approach demonstrated here could be extended to other similar environments and ecological locations, such as Poyang Lake, to document and explore their patterns change over recent decades.

Acknowledgments

This research was financially supported by National Natural Science Foundation of China (No. 41271343), the Priority Academic Program Development of Jiangsu Higher Education Institutions (No. 164320H101), and the High Resolution Earth Observation Systems of National Science and Technology Major Projects (No. 05-Y30B02-9001-13/15-6). We thank the USGS for providing Landsat images, the China Meteorological Data Sharing Service System for providing meteorological data, and Scientific Data Sharing Platform for Lake and Watershed for providing vector data. We are thankful for Rebecca for language editing, appreciate Lan Mu for the help and suggestion, and deeply grateful to four anonymous reviewers and academic editors who provided extensive comments and suggestions to improve the quality of this work.

Author Contributions

Zhubin Zheng had the original idea for the study and wrote the manuscript. Yunmei Li was responsible for recruitment and follow-up of study participants. Yulong Guo contributed to the research method and review of the manuscript, Yifan Xu acquired the hydrological data, and Ge Liu and Chenggong Du carried out the preprocessing of image data. All authors read and approved the final manuscript.

Conflicts of Interest

The authors declare no conflict of interest.

References

  1. Dihkan, M.; Karsli, F.; Guneroglu, A. Mapping total suspended matter concentrations in the Black Sea using Landsat TM multispectral satellite imagery. Fresenius Environ. Bull. 2011, 20, 262–269. [Google Scholar]
  2. Grove, M.K.; Bilotta, G.S.; Woockman, R.R.; Schwartz, J.S. Suspended sediment regimes in contrasting reference-condition freshwater ecosystems: Implications for water quality guidelines and management. Sci. Total Environ. 2015, 502, 481–492. [Google Scholar] [CrossRef]
  3. Cerco, C.F.; Kim, S.C.; Noel, M.R. Management modeling of suspended solids in the Chesapeake Bay, USA. Estuar. Coast. Shelf Sci. 2013, 116, 87–98. [Google Scholar] [CrossRef]
  4. Skarbovik, E.; Stalnacke, P.; Bogen, J.; Bonsnes, T.E. Impact of sampling frequency on mean concentrations and estimated loads of suspended sediment in a Norwegian river: Implications for water management. Sci. Total Environ. 2012, 433, 462–471. [Google Scholar] [CrossRef] [PubMed]
  5. Ma, R.; Duan, H.; Tang, J.; Chen, Z. Remote Sensing of Lake Water Environment; Science Press: Beijing, China, 2010. (In Chinese) [Google Scholar]
  6. Committee, I.L.E. Managing Lakes and Their Basins for Sustainable Use: A Report for Lake Managers and Stakeholders; International Lake Environment Committee Foundation: Otsu, Japan, 2005. [Google Scholar]
  7. Committee, W.L.V.; Government, S.P.; Centre, U.I.E.T.; Committee, I.L.E. World Lake Vision: A Call to Action; International Lake Environment Committee Foundation and United Nations Environment Programme: Otsu, Japan, 2003. [Google Scholar]
  8. Hu, C.; Deng, Z.M.; Xie, Y.H.; Chen, X.S.; Li, F. The risk assessment of sediment heavy metal pollution in the East Dongting Lake wetland. J. Chem. 2015, 2015. [Google Scholar] [CrossRef]
  9. Liang, J.; Liu, J.Y.; Yuan, X.Z.; Zeng, G.M.; Lai, X.; Li, X.D.; Wu, H.P.; Yuan, Y.J.; Li, F. Spatial and temporal variation of heavy metal risk and source in sediments of Dongting Lake wetland, Mid-South China. J. Environ. Sci. Health A 2015, 50, 100–108. [Google Scholar] [CrossRef] [PubMed]
  10. Zhao, X.; Sun, Z.; Gao, Y. Three Gorges Reservoir operation effects on water level and ecological function of Poyang Lake. China Three Gorges Trib. 2010, 5, 19–22. (In Chinese) [Google Scholar]
  11. Morel, A. Optical modeling of the upper ocean in relation to its biogenous matter content (Case I Waters). J. Geophys. Res. Oceans 1988, 93, 1074–10768. [Google Scholar] [CrossRef]
  12. Zhang, M.W.; Dong, Q.; Cui, T.W.; Xue, C.J.; Zhang, S.L. Suspended sediment monitoring and assessment for Yellow River estuary from Landsat TM and ETM plus imagery. Remote Sens. Environ. 2014, 146, 136–147. [Google Scholar] [CrossRef]
  13. Massicotte, P.; Gratton, D.; Frenette, J.J.; Assani, A.A. Spatial and temporal evolution of the St. Lawrence River spectral profile: A 25-year case study using Landsat 5 and 7 imagery. Remote Sens. Environ. 2013, 136, 433–441. [Google Scholar] [CrossRef]
  14. Nechad, B.; Ruddick, K.G.; Park, Y. Calibration and validation of a generic multisensor algorithm for mapping of total suspended matter in turbid waters. Remote Sens. Environ. 2010, 114, 854–866. [Google Scholar] [CrossRef]
  15. Miller, R.L.; McKee, B.A. Using MODIS-Terra 250 m imagery to map concentrations of total suspended matter in coastal waters. Remote Sens. Environ. 2004, 93, 259–266. [Google Scholar] [CrossRef]
  16. Loveland, T.R.; Dwyer, J.L. Landsat: Building a strong future. Remote Sens. Environ. 2012, 122, 22–29. [Google Scholar] [CrossRef]
  17. Palmer, S.C.J.; Kutser, T.; Hunter, P.D. Remote sensing of inland waters: Challenges, progress and future directions. Remote Sens. Environ. 2015, 157, 1–8. [Google Scholar] [CrossRef]
  18. Singh, K.; Ghosh, M.; Sharma, S.R.; Kumar, P. Blue-Red-NIR model for chlorophyll-a retrieval in Hypersaline-Alkaline water using Landsat ETM plus sensor. IEEE J. Sel. Top. Appl. Earth Obs. Remote Sens. 2014, 7, 3553–3559. [Google Scholar] [CrossRef]
  19. Olmanson, L.G.; Brezonik, P.L.; Bauer, M.E. Geospatial and temporal analysis of a 20-year record of Landsat-based water clarity in Minnesota’s 10,000 lakes. J. Am. Water Resour. Assoc. 2014, 50, 748–761. [Google Scholar] [CrossRef]
  20. Giardino, C.; Pepe, M.; Brivio, P.A.; Ghezzi, P.; Zilioli, E. Detecting Chlorophyll, secchi disk depth and surface temperature in a Sub-alpine Lake using Landsat imagery. Sci. Total Environ. 2001, 268, 19–29. [Google Scholar] [CrossRef]
  21. Dekker, A.G.; Hoogenboom, H.J.; Goddijn, L.M.; Malthus, T.J.M. The relation between inherent optical properties and reflectance spectra in turbid inland waters. Remote Sens. Rev. 1997, 15, 59–74. [Google Scholar] [CrossRef]
  22. Zhou, W.; Wang, S.; Zhou, Y.; Troy, A. Mapping the concentrations of total suspended matter in Lake Taihu, China, using Landsat-5 TM data. Int. J. Remote Sens. 2006, 27, 1177–1191. [Google Scholar] [CrossRef]
  23. Ma, R.H.; Dai, J.F. Investigation of chlorophyll-a and total suspended matter concentrations using Landsat ETM and field spectral measurement in Taihu Lake, China. Int. J. Remote Sens. 2005, 26, 2779–2795. [Google Scholar] [CrossRef]
  24. Ding, X.W.; Li, X.F. Monitoring of the water-area variations of Lake Dongting in China with Envisat ASAR images. Int. J. Appl. Earth Obs. Geoinf. 2011, 13, 894–901. [Google Scholar] [CrossRef]
  25. Deng, F.; Wang, X.L.; Cai, X.B.; Li, E.H.; Jiang, L.Z.; Li, H.; Yan, R.R. Analysis of the relationship between inundation frequency and wetland vegetation in Dongting Lake using remote sensing data. Ecohydrology 2014, 7, 717–726. [Google Scholar] [CrossRef]
  26. Wu, G.; Liu, L.; Chen, F.; Fei, T. Developing MODIS-based retrieval models of suspended particulate matter concentration in Dongting Lake, China. Int. J. Appl. Earth Obs. Geoinf. 2014, 32, 46–53. [Google Scholar] [CrossRef]
  27. Xu, M.; Zeng, G.M.; Xu, X.Y.; Huang, G.H.; Sun, W.; Jiang, X.Y. Application of Bayesian regularized BP Neural Network model for analysis of aquatic ecological data—A case study of chlorophyll-a prediction in Nanzui water area of Dongting Lake. J. Environ. Sci. China 2005, 17, 946–952. [Google Scholar] [PubMed]
  28. Wu, G.F.; Cui, L.J.; Liu, L.J.; Chen, F.Y.; Fei, T.; Liu, Y.L. Statistical model development and estimation of suspended particulate matter concentrations with Landsat 8 OLI images of Dongting Lake, China. Int. J. Remote Sens. 2015, 36, 343–360. [Google Scholar] [CrossRef]
  29. Chen, X.Q.; Yan, Y.X.; Fu, R.S.; Dou, X.P.; Zhang, E.F. Sediment transport from the Yangtze River, China, into the sea over the Post-Three Gorges Dam period: A discussion. Quat. Int. 2008, 186, 55–64. [Google Scholar] [CrossRef]
  30. Kaufman, Y.J.; Tanré, D.; Remer, L.A.; Vermote, E.F.; Chu, A.; Holben, B.N. Operational remote sensing of tropospheric aerosol over land from EOS Moderate Resolution Imaging Spectroradiometer. J. Geophys. Res. Atmos. 1997, 102, 17051–17067. [Google Scholar] [CrossRef]
  31. Yuan, J.G.; Niu, Z.; Wang, X.P. Atmospheric correction of Hyperion hyperspectral image based on FLAASH. Spectrosc. Spectr. Anal. 2009, 29, 1181–1185. [Google Scholar]
  32. Nazeer, M.; Nichol, J.E.; Yung, Y.K. Evaluation of atmospheric correction models and Landsat surface reflectance product in an urban coastal environment. Int. J. Remote Sens. 2014, 35, 6271–6291. [Google Scholar] [CrossRef]
  33. Wang, Y.; Li, Y.; Lv, H.; Wu, C.; Jin, X.; Yin, B.; Zhang, H. Suitability assessment of lake water quality monitoring on waterbody images acquired by HJ-1A hyperspectral imager: A case study of Lake Chaohu. J. Lake Sci. 2011, 23, 789–795. (In Chinese) [Google Scholar]
  34. Zeng, Q.; Zhao, Y.; Tian, L.Q.; Chen, X.L. Evaluation on the atmospheric correction methods for water color remote sensing by using HJ-1A/1B CCD image-taking Poyang Lake in China as a case. Spectrosc. Spectr. Anal. 2013, 33, 1320–1326. [Google Scholar]
  35. Yu, Z.F.; Chen, X.L.; Zhou, B.; Tian, L.Q.; Yuan, X.H.; Feng, L. Assessment of total suspended sediment concentrations in Poyang Lake using HJ-1A/1B CCD imagery. Chin. J. Oceanol. Limnol. 2012, 30, 295–304. [Google Scholar] [CrossRef]
  36. Tian, L.Q.; Lu, J.Z.; Chen, X.L.; Yu, Z.F.; Xiao, J.J.; Qiu, F.; Zhao, X. Atmospheric correction of HJ-1A/B CCD images over Chinese coastal waters using MODIS-Terra aerosol data. Sci. China Technol. Sci. 2010, 53, 191–195. [Google Scholar] [CrossRef]
  37. Moses, W.J.; Gitelson, A.A.; Perk, R.L.; Gurlin, D.; Rundquist, D.C.; Leavitt, B.C.; Barrow, T.M.; Brakhage, P. Estimation of chlorophyll-a concentration in turbid productive waters using airborne hyperspectral data. Water Res. 2012, 46, 993–1004. [Google Scholar] [CrossRef] [PubMed]
  38. Liu, D.; Pan, D.; Bai, Y.; He, X.; Wang, D.; Wei, J.-A.; Zhang, L. Remote sensing observation of particulate organic carbon in the Pearl River estuary. Remote Sens. 2015, 7, 8683–8704. [Google Scholar] [CrossRef]
  39. Morel, A.; Mueller, J.L. Normalized water-leaving radiance and remote sensing reflectance: Bidirectional reflectance and other factors. Available online: http://ntrs.nasa.gov/archive/nasa/casi.ntrs.nasa.gov/20020044099.pdf#page=54 (accessed on 25 April 2015).
  40. Tang, J.W.; Tian, G.L.; Wang, X.Y.; Wang, X.M.; Song, Q.J. The methods of water spectra measurement and analysis I: Above-water method. J. Remote Sens. Beijing 2004, 8, 37–44. [Google Scholar]
  41. Lorenzen, C.J. Determination of chlorophyll and Pheo-Pigments: Spectrophotometric equations1. Limnol. Oceanogr. 1967, 12, 343–346. [Google Scholar] [CrossRef]
  42. Chen, Y.W.; Chen, K.N.; Hu, Y.H. Discussion on possible error for phytoplankton chlorophyll-a concentration analysis using hot-ethanol extraction method. J. Lake Sci. 2006, 18, 550–552. (In Chinese) [Google Scholar]
  43. Huang, X. Eco-Investigation, Observation and Analysis of Lakes; Standard Press of China: Beijing, China, 1999. (In Chinese) [Google Scholar]
  44. Le, C.F.; Li, Y.M.; Zha, Y.; Sun, D.Y.; Huang, C.C.; Lu, H. A four-band semi-analytical model for estimating chlorophyll a in highly turbid lakes: The case of Taihu Lake, China. Remote Sens. Environ. 2009, 113, 1175–1182. [Google Scholar] [CrossRef]
  45. Sun, D.Y.; Li, Y.M.; Wang, Q.; Lv, H.; Le, C.F.; Huang, C.C.; Gong, S.Q. Detection of suspended-matter concentrations in the shallow subtropical Lake Taihu, China, using the SVR model based on DSFS. IEEE Geosci. Remote Sens. 2010, 7, 816–820. [Google Scholar] [CrossRef]
  46. Bowers, D.G.; Braithwaite, K.M.; Nimmo-Smith, W.A.M.; Graham, G.W. Light scattering by particles suspended in the sea: The role of particle size and density. Cont. Shelf Res. 2009, 29, 1748–1755. [Google Scholar] [CrossRef]
  47. Onderka, M.; Pekárová, P. Retrieval of suspended particulate matter concentrations in the Danube River from Landsat ETM plus data. Sci. Total Environ. 2008, 397, 238–243. [Google Scholar] [CrossRef] [PubMed]
  48. Doxaran, D.; Froidefond, J.-M.; Lavender, S.; Castaing, P. Spectral signature of highly turbid waters: Application with spot data to quantify suspended particulate matter concentrations. Remote Sens. Environ. 2002, 81, 149–161. [Google Scholar] [CrossRef]
  49. Zhang, B.; Li, J.; Shen, Q.; Chen, D. A bio-optical model based method of estimating total suspended matter of Lake Taihu from near-infrared remote sensing reflectance. Environ. Monit. Assess. 2008, 145, 339–347. [Google Scholar] [CrossRef] [PubMed]
  50. Xu, J.P.; Zhang, B.; Song, K.S.; Wang, Z.M.; Duan, H.T.; Chen, M.; Yang, F.; Li, F.X. Bio-optical model of total suspended matter based on reflectance in the Near-Infrared wave band for Case-II Waters. Spectrosc. Spectr. Anal. 2008, 28, 2273–2277. [Google Scholar]
  51. Song, K.S.; Lu, D.M.; Liu, D.W.; Wang, Z.M.; Li, L.; Zhang, B.; Wang, Y.D. Retrival of total suspended matter (TSM) using remotely sensed images in Shitoukoumen Reservior, northeast China. In Proceedings of the 2010 IEEE International Geoscience and Remote Sensing Symposium (IGARSS), Honolulu, HI, USA, 25–30 July 2010; pp. 405–408.
  52. Ma, W.; Xing, Q.; Chen, C.; Zhang, Y.; Yu, D.; Shi, P. Using the normalized peak area of remote sensing reflectance in the Near-Infrared region to estimate total suspended matter. Int. J. Remote Sens. 2011, 32, 7479–7486. [Google Scholar] [CrossRef]
  53. Teodoro, A.C.; Marcal, A.R.S.; Veloso-Gomes, F. Quantification of the total suspended matter concentration in the sea breaking zone from in situ measurements and remotely sensed data—Two empirical approaches. Available online: http://repositorio-aberto.up.pt/handle/10216/70171 (accessed on 20 June 2015).
  54. Bonacci, O.; Oskorus, D. The changes in the Lower Drava River water level, discharge and suspended sediment regime. Environ. Earth Sci. 2010, 59, 1661–1670. [Google Scholar]
  55. Dai, S.B.; Yang, S.L.; Zhu, J.; Gao, A.; Li, P. The role of Lake Dongting in regulating the sediment budget of the Yangtze River. Hydrol. Earth Syst. Sci. 2005, 9, 692–698. [Google Scholar]
  56. Peng, D.Z.; Xiong, L.H.; Guo, S.L.; Shu, N. Study of Dongting Lake area variation and its influence on water level using MODIS data. Hydrol. Sci. J. 2005, 50, 31–44. [Google Scholar]
  57. Wu, G.F.; de Leeuw, J.; Skidmore, A.K.; Prins, H.H.T.; Liu, Y.L. Concurrent monitoring of vessels and water turbidity enhances the strength of evidence in remotely sensed dredging impact assessment. Water Res. 2007, 41, 3271–3280. [Google Scholar]
  58. Lai, X.; Shankman, D.; Huber, C.; Yesou, H.; Huang, Q.; Jiang, J. Sand mining and increasing Poyang Lake’s discharge ability: A reassessment of causes for lake decline in China. J. Hydrol. 2014, 519, 1698–1706. [Google Scholar]
  59. Xu, K.; Milliman, J.D. Seasonal variations of sediment discharge from the Yangtze River before and after impoundment of the Three Gorges Dam. Geomorphology 2009, 104, 276–283. [Google Scholar]
  60. Hu, Y.-X.; Huang, J.-L.; Du, Y.; Han, P.-P.; Wang, J.-L.; Huang, W. Monitoring wetland vegetation pattern response to water-level change resulting from the Three Gorges Project in the two largest freshwater lakes of China. Ecol. Eng. 2015, 74, 274–285. [Google Scholar]
  61. Zhang, Z.; Chen, X.; Xu, C.-Y.; Hong, Y.; Hardy, J.; Sun, Z. Examining the influence of river-lake interaction on the drought and water resources in the Poyang Lake basin. J. Hydrol. 2015, 522, 510–521. [Google Scholar] [CrossRef]
  62. Lana-Renault, N.; Regues, D.; Marti-Bono, C.; Begueria, S.; Latron, J.; Nadal, E.; Serrano, P.; Garcia-Ruiz, J.M. Temporal variability in the relationships between precipitation, discharge and suspended sediment concentration in a small Mediterranean mountain catchment. Nord. Hydrol. 2007, 38, 139–150. [Google Scholar] [CrossRef]
  63. Li, Y.S.; Wang, G.X.; Qin, D.H.; Zhao, L.; Ding, Y.J. Study on the runoff and sediment-producing effects of precipitation in headwater areas of the Yangtze River and Yellow River, China. Environ. Geol. 2008, 56, 1–9. [Google Scholar]
  64. Zhang, J.C.; Peng, P.Z. A study on the relation between the variation of the precipitation in eastern Jianghuai watershed and sediment transport in Chihe River valley. Chin. Geogr. Sci. 2002, 12, 44–49. [Google Scholar] [CrossRef]
  65. Zhang, J.C.; Zhang, W.; Li, J.H.; Shi, Z.G.; Pu, S.Y. Relation between precipitation and sediment transport in the Dasha River watershed. Chin. Geogr. Sci. 2004, 14, 129–134. [Google Scholar] [CrossRef]
  66. Chen, Z.Q.; Hu, C.M.; Muller-Karger, F. Monitoring turbidity in Tampa Bay using MODIS/Aqua 250-m imagery. Remote Sens. Environ. 2007, 109, 207–220. [Google Scholar] [CrossRef]
  67. Feng, L.; Hu, C.M.; Chen, X.L.; Song, Q.J. Influence of the Three Gorges Dam on total suspended matters in the Yangtze Estuary and its adjacent coastal waters: Observations from MODIS. Remote Sens. Environ. 2014, 140, 779–788. [Google Scholar] [CrossRef]
  68. Lane, R.R.; Day, J.W.; Marx, B.D.; Reyes, E.; Hyfield, E.; Day, J.N. The effects of riverine discharge on temperature, salinity, suspended sediment and chlorophyll a in a Mississippi delta estuary measured using a flow-through system. Estuar. Coast. Shelf Sci. 2007, 74, 145–154. [Google Scholar] [CrossRef]
  69. Shi, K.; Zhang, Y.; Zhu, G.; Liu, X.; Zhou, Y.; Xu, H.; Qin, B.; Liu, G.; Li, Y. Long-term remote monitoring of total suspended matter concentration in Lake Taihu using 250 m MODIS-Aqua data. Remote Sens. Environ. 2015, 164, 43–56. [Google Scholar] [CrossRef]
  70. Han, X.; Chen, X.; Feng, L. Four decades of winter wetland changes in Poyang Lake based on Landsat observations between 1973 and 2013. Remote Sens. Environ. 2015, 156, 426–437. [Google Scholar] [CrossRef]
  71. Xinhuanet. China Launches High-Definition Earth Observation Satellite. Available online: http://news.xinhuanet.com/english/China/2013-04/26/c_132342607.htm (accessed on 25 April 2015).
  72. Nasaspaceflight. Chinese Long March 4B launches Gaofen-2 and BRITE-PL-2. Available online: http://www.nasaspaceflight.com/2014/08/chinese-long-march-4b-gaofen-2-brite-pl-2/ (accessed on 25 April 2015).
  73. EoPortal Directory. GF-1 (Gaofen-1) High-Resolution Imaging Satellite/CHEOS series of China. Available online: https://directory.eoportal.org/web/eoportal/satellite-missions/g/gaofen-1 (accessed on 25 April 2015).
  74. European Space Agency. Sentinel-3. Available online: http://www.esa.int/Our_Activities/Observing_the_Earth/Copernicus/Sentinel-3 (accessed on 28 September 2015).

