1. Introduction
Drought is considered to be a dry spell relative to normal local conditions [
1]. Drought can be classified into four types: meteorological, agricultural, hydrological, and socio-economic [
2]. The first three types are related to physical phenomena, while the last links drought to the supply and demand of social-economic systems. Increases in the frequency or intensity of severe droughts have been detected over the last several decades, worldwide, and in some cases have been attributed to global climate change [
3,
4,
5]. Extreme drought is a major environmental stress that affects the growth and development of vegetation, subsequently affects the energy balance on the earth’s surface and provides invaluable ecosystem services [
6]. It is quite important to monitor and assess the potential impacts of droughts on vegetation response [
7,
8].
For different drought types and purposes, several drought indices have been created and applied to drought monitoring and assessment. Percent of Normal Precipitation (PNP) is often used for a local area or a short period [
9]. Standardized Precipitation Index (SPI) shows abnormal information for the initial stage of drought [
10]. Standardized Precipitation Evapotranspiration Index (SPEI) has different timescales [
11] and can be used in time lag impacts of drought on vegetation [
12]. The Palmer Drought Severity Index (PDSI) is linked to abnormally dry or wet weather conditions obtained from temperature, soil moisture, and precipitation data [
13,
14]. Other drought indices used frequently include the Reclamation Drought Index [
15,
16], Drought Severity Index (DSI) [
17], U.S. Drought Monitor (USDM) [
18], Evaporative Drought Index (EDI) [
19], National Drought Atlas for the United States [
9], and Crop Moisture Index (CMI) [
20]. More drought indices and their performance can be found in reviews [
1,
17,
21].
The adverse effects of extreme droughts on vegetation have been widely studied using remote sensing data or drought indices [
22,
23,
24,
25,
26,
27,
28,
29]. The relationship between vegetation indices and drought indices, such as SPI [
23] or PDSI [
30], was found in different land cover or different seasons. Amazon droughts have been deeply studied using satellite data or vegetation index [
31,
32,
33,
34,
35]. These studies have given us insight into the relationship between vegetation and drought, and shown that satellite data or vegetation indices are sensitive to drought events [
36] or even a prolonged impact [
37]. However, little research has focused on exploring the regular patterns and differences of different stages of drought among vegetation parameters. It is known that drought is difficult to detect because of its slow onset. For a single drought event, vegetation may respond differentially during its different developing phases. During the autumn of 2009 to the spring of 2010, the region of Southwestern China experienced an extreme drought that provides us with a good case for the study of vegetation responses to drought in different phases. Therefore, the purposes of this research are to (i) find different impacts of drought; (ii) determine whether different types of vegetation have identical trends; and (iii) show whether the differences are related to vegetation types.
Based on NDVI, land cover type, and PDSI data, we detected the monthly anomalies of vegetation change and climate data and explore the differences of impacts on vegetation in different periods of the droughts.
2. Study Area
Southwestern China consists of the provinces of Guangxi, Guizhou, Yunnan, Sichuan, and the municipality of Chongqing. From 2009 to 2010, Southwestern China experienced a serious drought that affected extensive regions from Yunnan, Guangxi to Sichuan, Guizhou and Chongqing [
5,
38].
Figure 1 shows the unchanged land cover of Southwestern China, and the red square defines the study area. The red square area shows the severe condition of drought according to the research [
5]. There are some mountains in the study area and the mean altitude in the study area is 1520 m.
Figure 1.
Unchanged land cover types in the study area. The first layer of MODIS Land Cover data was used to create the land cover. Red square defines the study area.
Figure 1.
Unchanged land cover types in the study area. The first layer of MODIS Land Cover data was used to create the land cover. Red square defines the study area.
The climate types are primarily subtropical monsoon, low-latitude climate, and mountain climate. The special climatic conditions cause a diversity of natural geographic characteristics and vegetation types. The main characteristic of this area is high vegetation coverage. The long-term (1961–2010) mean annual temperature is 15.48 °C, the warmest temperature is in July (21.98 °C), and the coldest temperature (7.81 °C) is in January. The long-term mean annual precipitation and relative humidity are 831.06 mm and 72.41%, respectively.
The rainfall percentage anomaly in some regions was 60.4% less than in previous years [
5] and rainfall in February decreased by 49.5% compared to 2000–2009 average precipitation [
38]. The continuous drought in the autumn, winter, and spring in some regions of Yunnan and Guizhou provinces was the most serious since 1880, and the extent and severity of drought broke historical records [
5].
3. Material and Methods
3.1. Material
Several types of data, including vegetation parameters, land cover data, climate data, and drought index, were collected and analyzed in this research. One of the most important vegetation parameters, NDVI, was chosen to analyze the spatiotemporal changes of vegetation response during the extreme drought that occurred in Southwestern China. The NDVI data used in this research were from the MODIS vegetation indices product (MOD13A3), which were produced from surface reflectance from which atmospheric effects had been removed [
39,
40]. Cloudy pixels were not used, affording quality assurance to the provided information.
In addition to the vegetation parameter, the first layer of MODIS Land Cover data in MCD12Q1 [
41,
42] was used to analyze whether the differences of the drought effects were related to vegetation types. Pixels remained unchanged land cover type for ten years were extracted for analysis. The vegetation within the study area primarily consists of mixed forest, woody savannas, grassland, and cropland, which occupy 69.7%, 7.9%, 9.6%, and 9.0% of the total study area, respectively. The mixed forest is defined as ‘lands dominated by woody vegetation with a percent cover >60% and height exceeding 2 meters. Consists of mixtures of either broadleaf or needleleaf trees and in which neither component exceeds 60% of landscape’. Since this study primarily aims to reveal the responses of the natural vegetation to the extreme drought event, we did not analyze the crop responses because they are frequently influenced by human activities. Areas were chosen for this study if the land cover type was consistent during the past 10 years, based on the MCD12Q1 classification.
To describe the meteorological characteristics of the study area, we analyzed the precipitation, temperature, and solar radiation datasets. The precipitation and temperature data were acquired from the Climate Research Unit (CRU) TS3.21 climate datasets, with a spatial resolution of 0.5° [
43]. The same spatial resolution solar radiation data were obtained from the CRU-NCEP V5.2 dataset. All of these datasets have been well used in many studies [
43,
44,
45,
46,
47].
The drought index, PDSI, was used in this research to reveal the relationship between the change of vegetation and different stages of extreme drought. The dataset was calculated at 0.5 by 0.5 degree using monthly air temperature, precipitation, and soil water-holding capacity data [
48].
3.2. Analysis of Abnormal Data
To detect the monthly anomalies of vegetation change and climate data, we calculated the standardized ratio (Z-score) of the NDVI and climate data. The Z-score method has been used in the detection of anomalies [
17,
24]. The Z-score for a variable is calculated as follows:
where X is the analyzed variable, such as precipitation, temperature, solar radiation, and NDVI,
is the average value for normal month, and
is the standard deviation of
. In this research, X was calculated from 2009 to 2010 because the drought occurred during this period. We considered 2001 to 2008 to be the normal period and then calculated
and
in the year of 2001–2008.
3.3. Division of Droughts Stage
PDSI value defines wetness or dryness calculated from temperature and precipitation on a scale ranging from extreme drought (<−4) to extreme wetness (>4). From these values, seven categories of dry and wet conditions have been defined (
Table 1). Complete descriptions of the equations can be found in the original study by Palmer [
13] and Alley [
14].
Table 1.
Drought degree according to PDSI.
Table 1.
Drought degree according to PDSI.
| PDSI Value | Drought Degree |
|---|
| less than −4 | Extreme Drought |
| −4 to −3 | Severe Drought |
| −3 to −2 | Moderate Drought |
| −2 to 2 | Near Normal |
| 2.0 to 3 | Unusual Moist Spell |
| 3.0 to 4 | Very Moist Spell |
| 4.0 or above | Extremely Moist |
4. Results
4.1. Different Periods of the Drought
The drought in Southwestern China can be divided into some stages according to long term PDSI values.
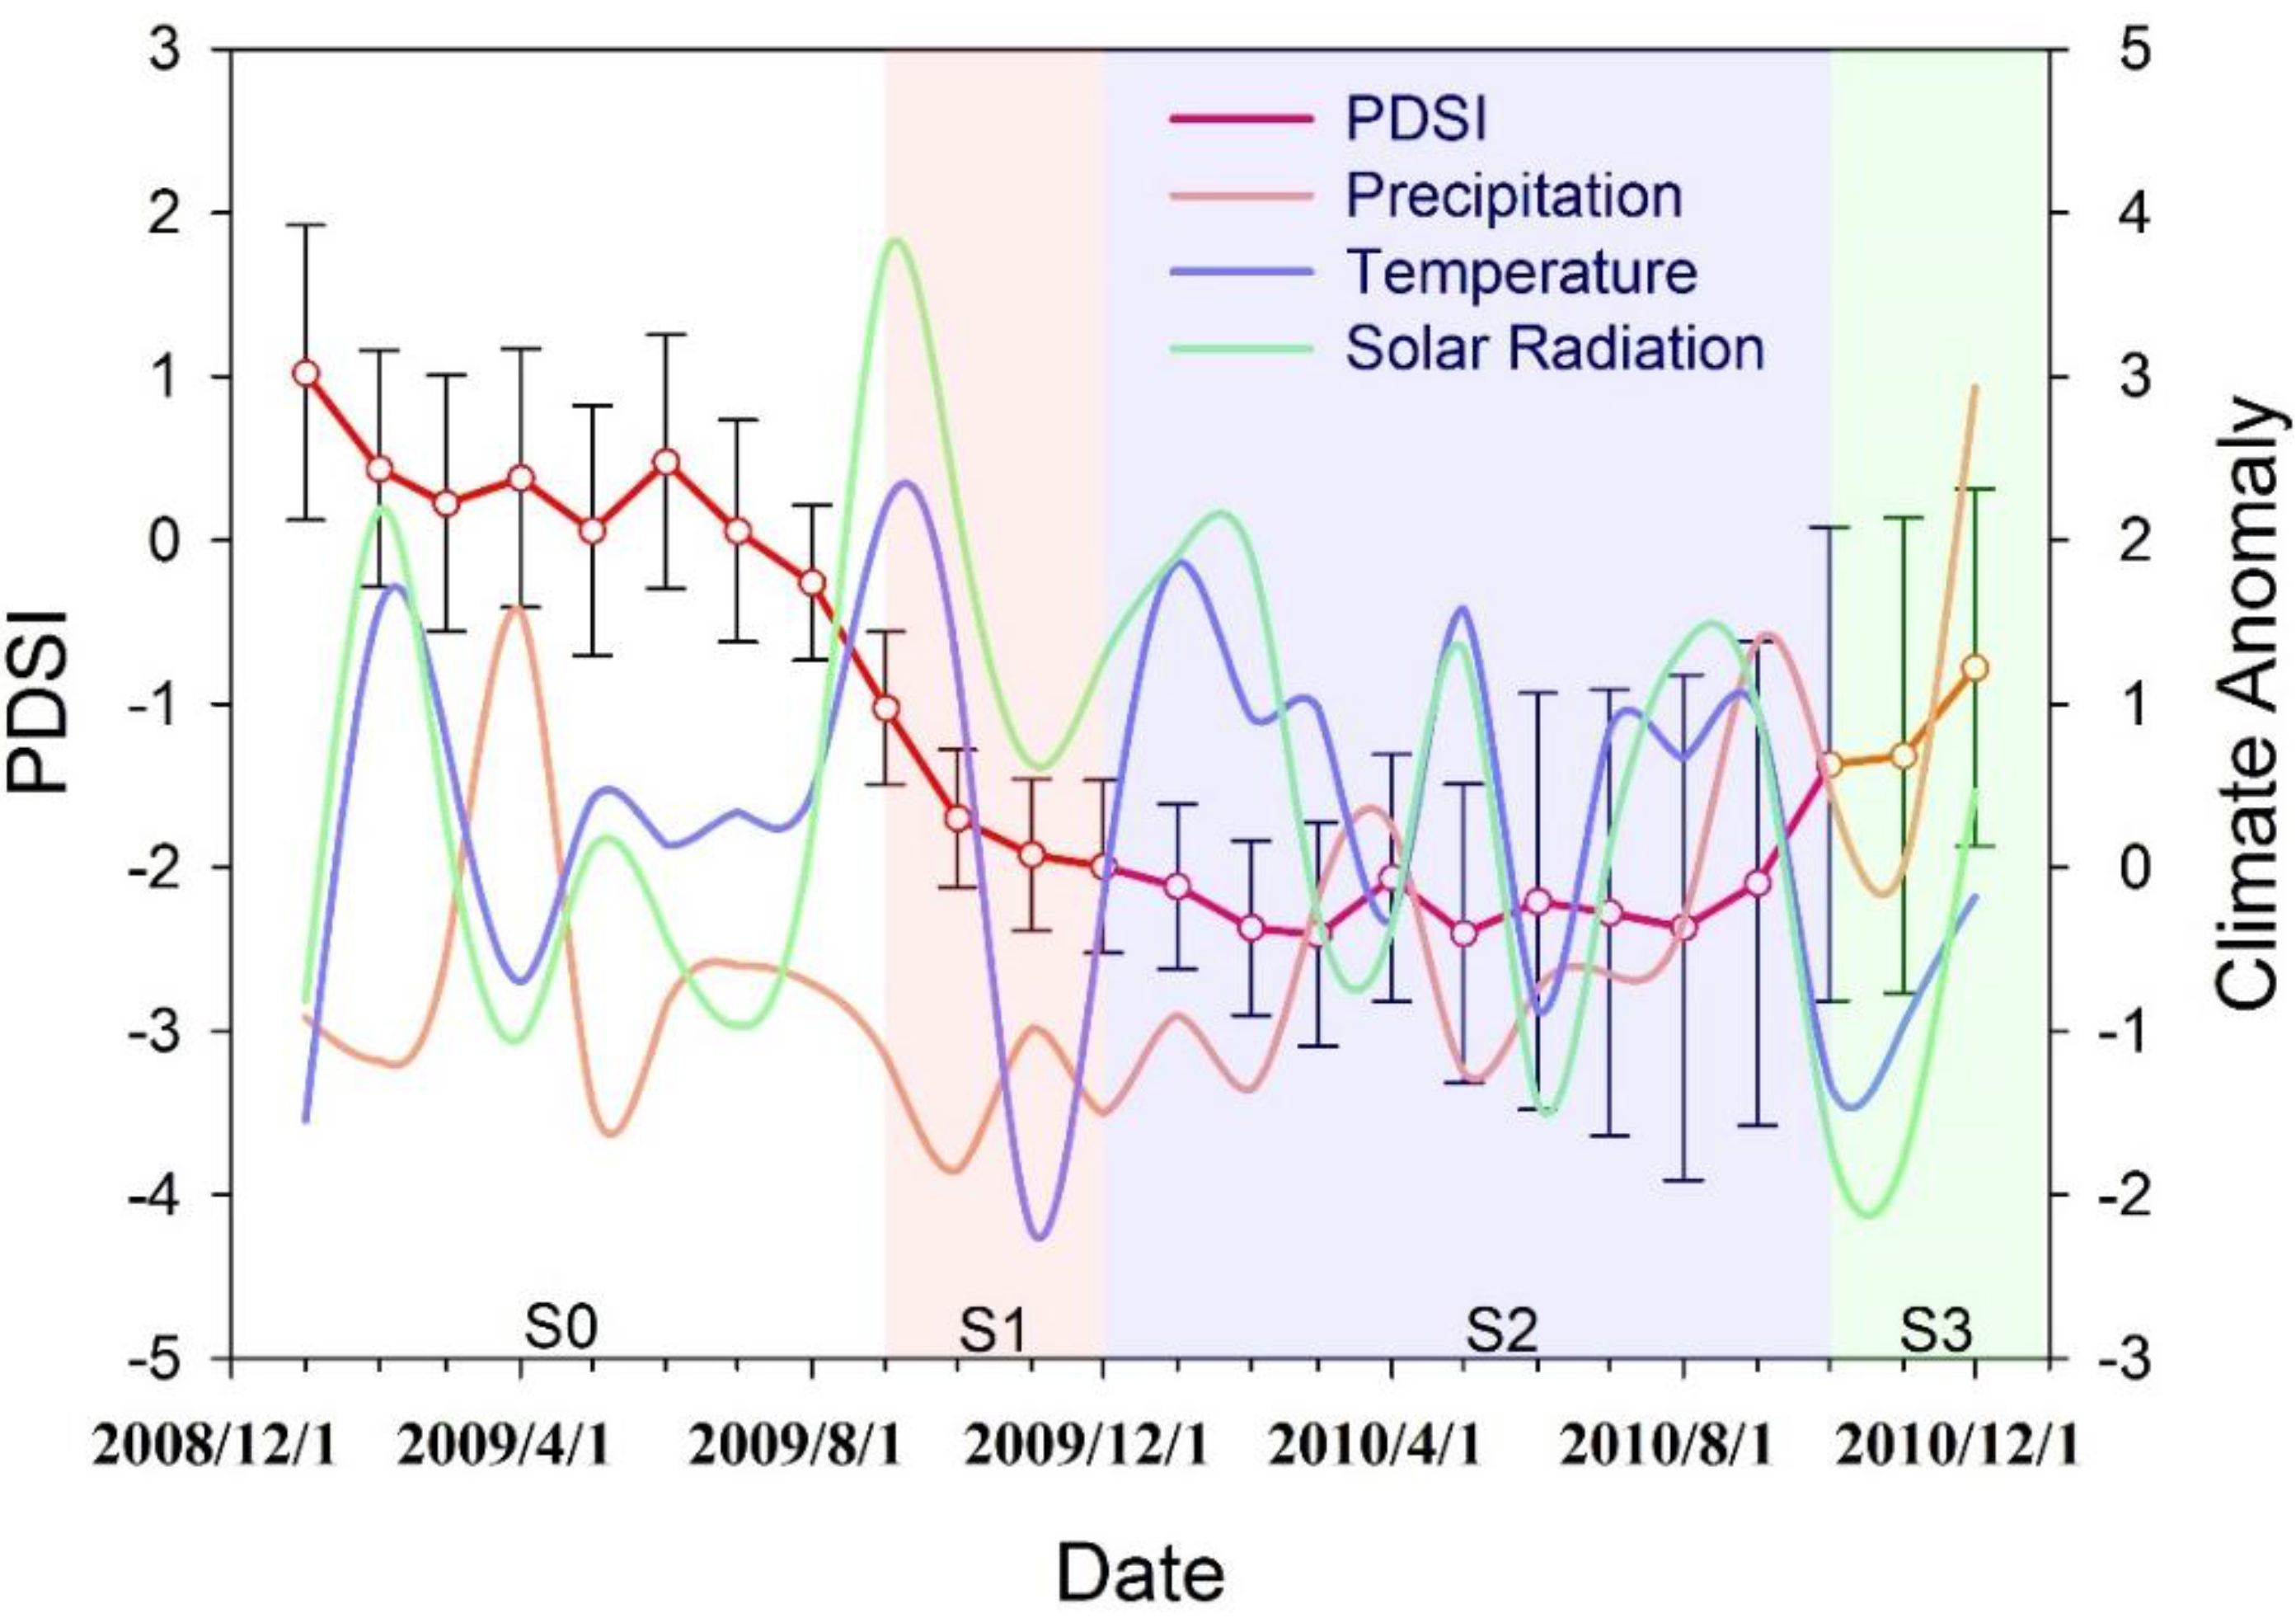
Figure 2 shows the changes of the variation of the PDSI, together with the Z-score of the temperature, precipitation, and radiation of every month from December 2008 to January 2011 in the study area. From the PDSI values in
Figure 2, it can be seen that the PDSI was normal from January 2009 to September 2009. After September 2009, it changed from −1 into −2. After October 2010, the PDSI returned to normal gradually. Based on the PDSI values in the study area, we can easily separate the drought in the area into three drought stages according to the PDSI values in
Table 1: initial stage, middle stage, and final stage, according to the severity degree. The drought’s initial stage (S1) was from September 2009 to November when PDSI values range mostly from −1 to −2. The persistent severe drought in the middle stage (S2) was from December 2009 to September 2010 when most PDSI values are less than −2. Drought recovery in the final stage (S3) was from October 2010 to December 2010 when most PDSI values are larger than −2.
The positive values of the temperature, rainfall, and radiation indicate that those parameters were higher than the normal year average values, while the negative values indicate that the parameters were lower than the normal year average values. As shown in
Figure 2, the rainfall of the study area had been less than the normal years since the beginning of 2009, and it had a short-term recovery in March 2010; afterwards, the rainfall recovered to normal until September 2010. The average temperature from December 2009 to September 2010 fluctuated and was often higher than in the normal years. From April 2009 to March 2010, the solar radiation was higher than in the normal years; afterwards, it fluctuated more.
Figure 2.
Monthly time series of PDSI, precipitation, temperature, and solar radiation based on the data averaged over all pixels in the study area. The vertical coordinate on the left side displays the PDSI value, and the vertical coordinate on the right side shows the Z-score of precipitation, temperature, and radiation. The standard error of PDSI is calculated by all pixels in the study area in the corresponding month. Based on the PDSI value in the study area, the drought in the study area can be separated into three stages: initial stage (S1), middle stage (S2), and final stage (S3). S0 represents normal condition before the drought.
4.2. Response of Vegetation to Different Periods of Extreme Drought
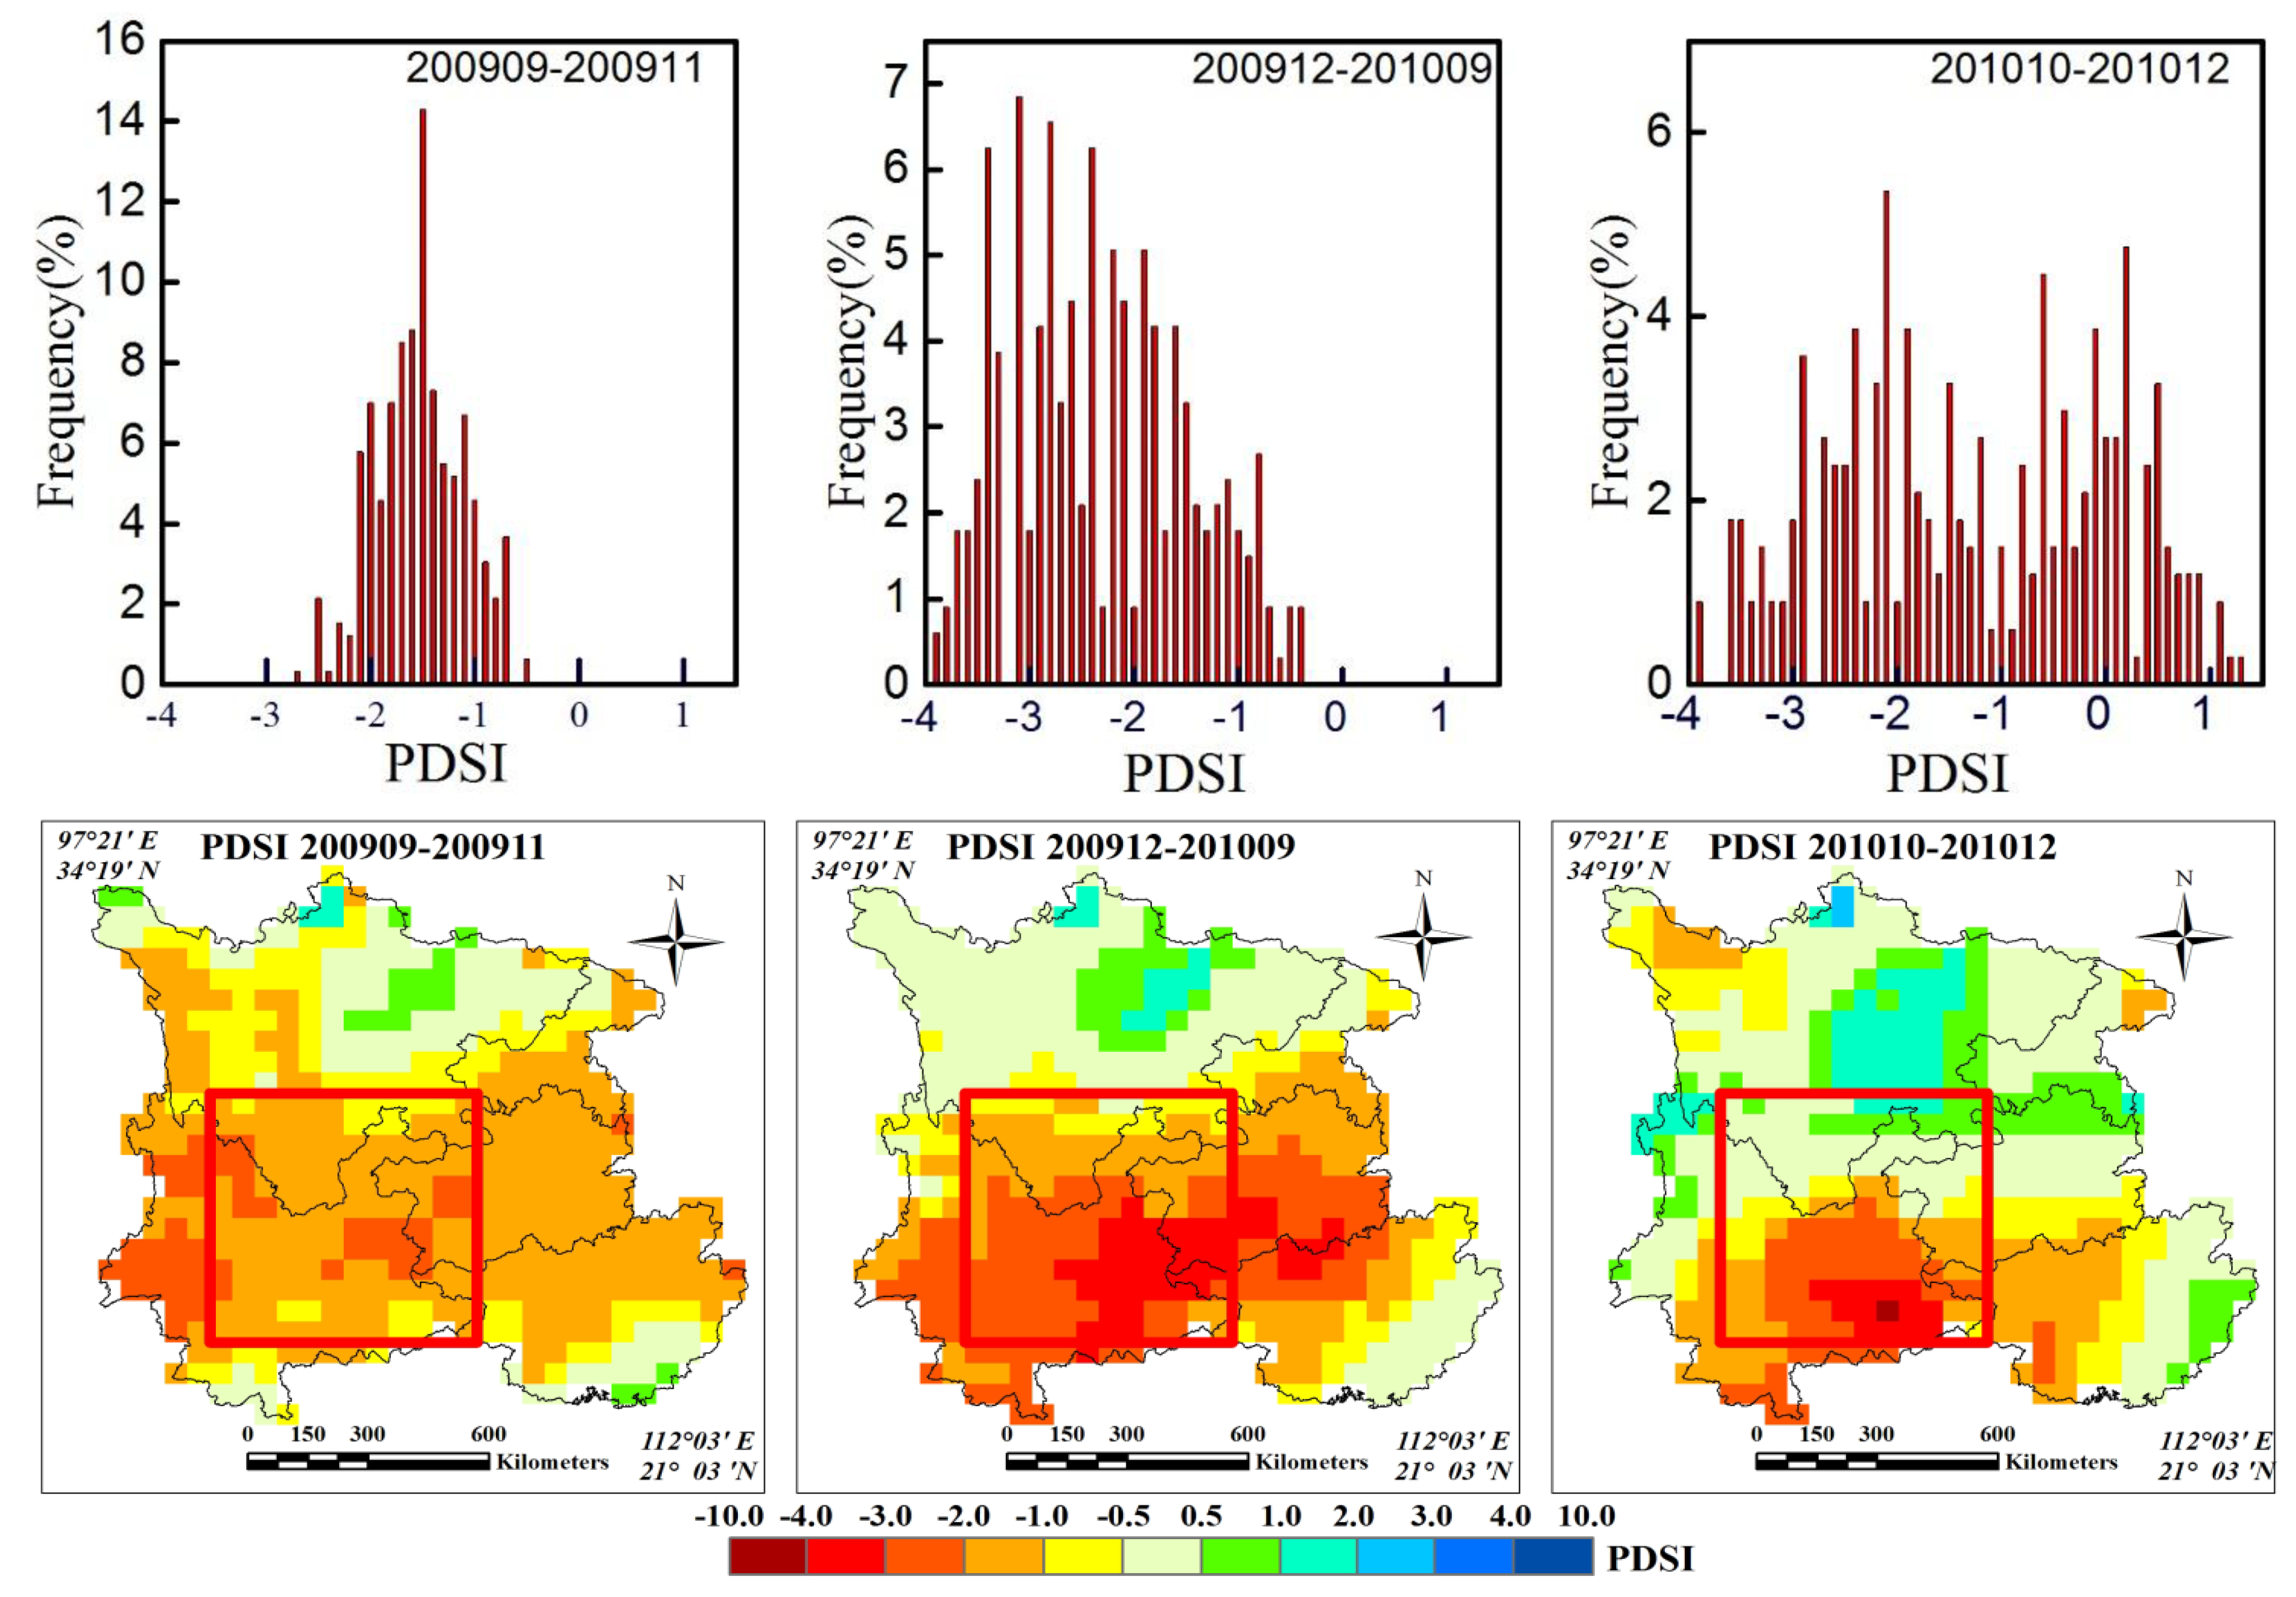
To analyze the vegetation response to the drought at the different stages, we calculated the PDSI average value (
Figure 3) and NDVI anomaly value (
Figure 4) for each stage. For each stage, the average values of PDSI anomalies were calculated from the pixels, and the NDVI variation anomaly values during this time period relative to all of the months from September to November from 2001 to 2008 were calculated.
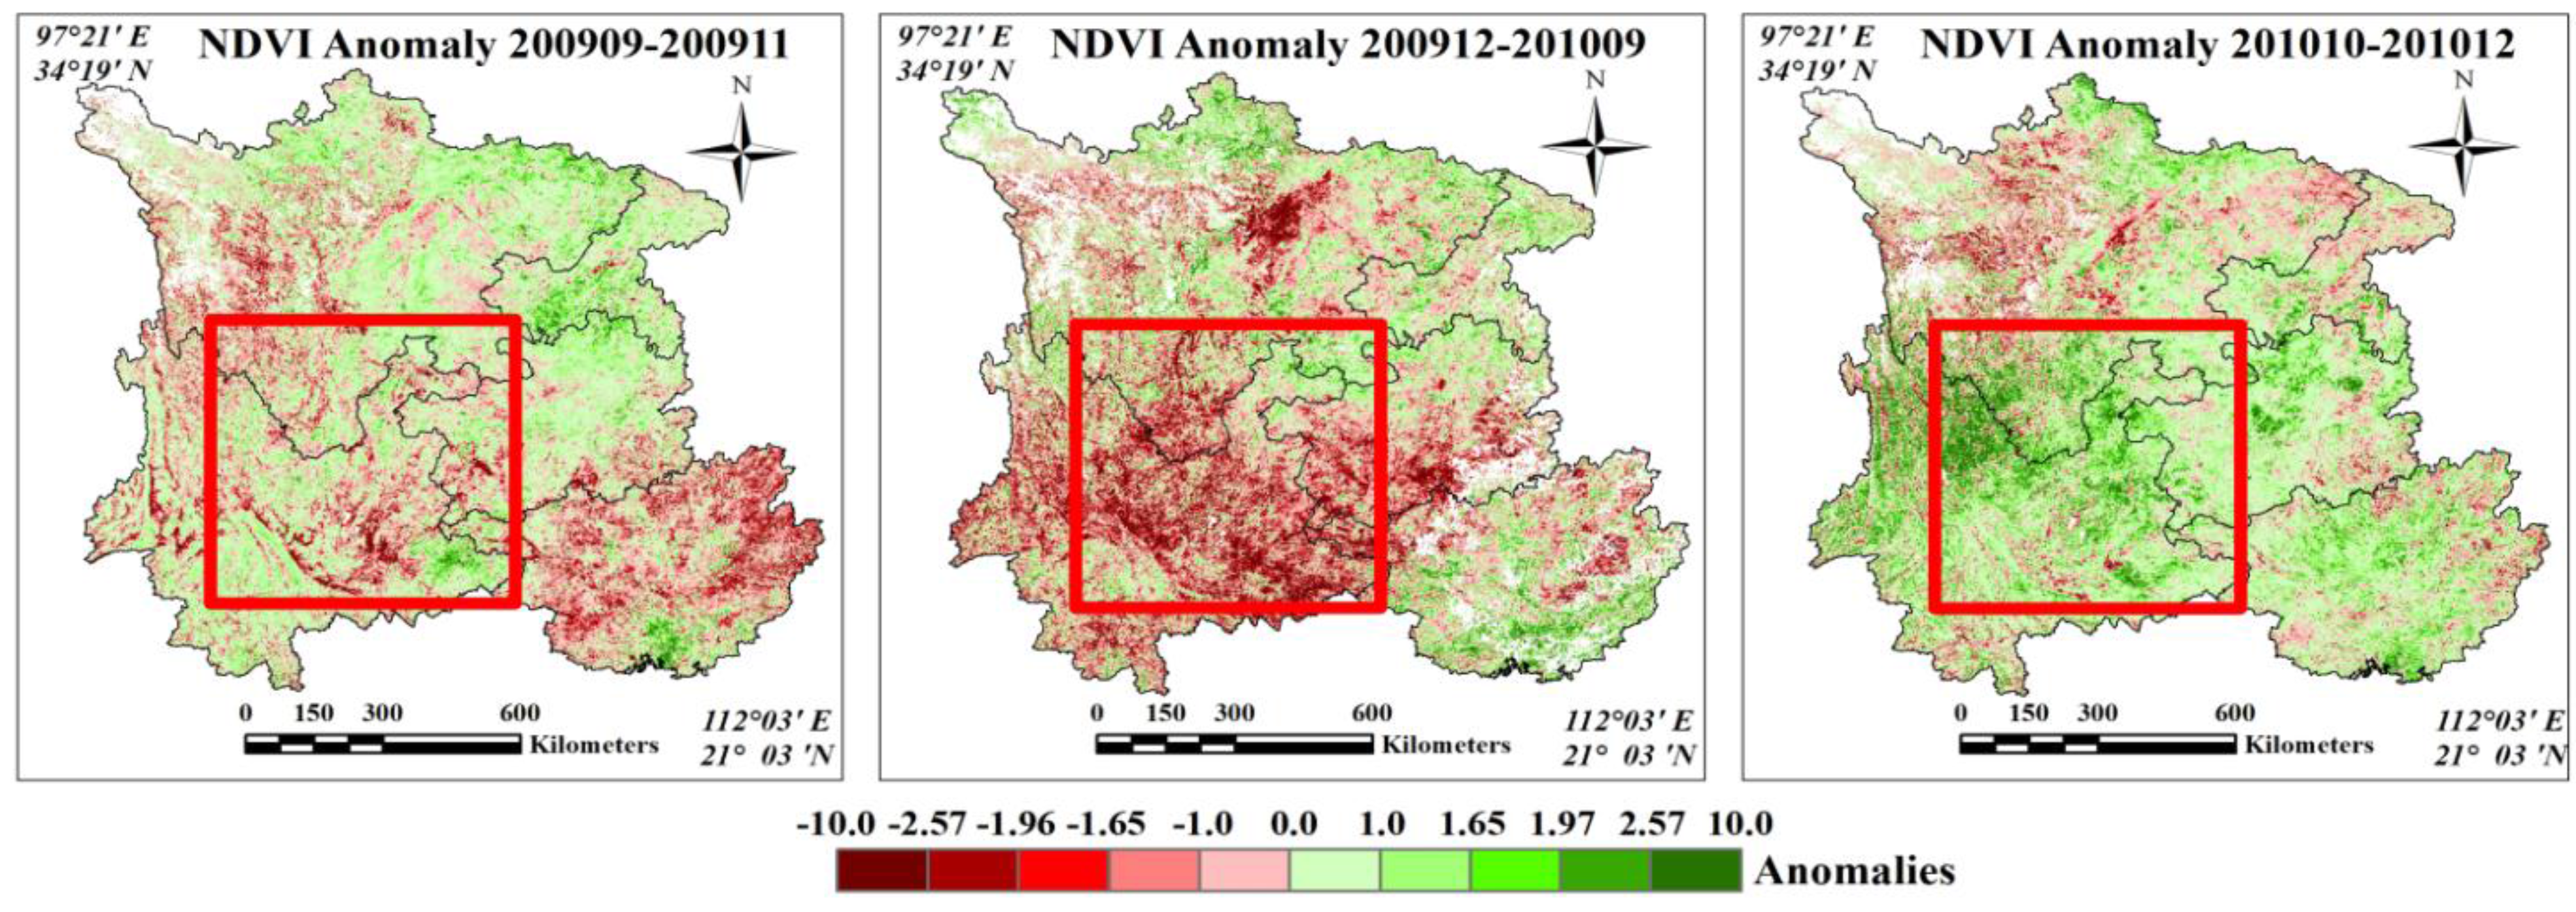
From the spatial data statistics, the overall response of vegetation in the different drought stages showed distinct differences. In S1 of the drought, PDSI was primarily distributed from −0.5 to −2.0. The corresponding NDVI anomaly does not show clear spatial regularity; some vegetation growth was increasing, while some regions’ vegetation trends were declining. It shows that there were spatial differences in the vegetation response to the initial stage of drought. In S2 of the drought, the PDSI of most regions as less than −2.0, and the NDVI of the corresponding region primarily was dramatically declining. This illustrates that when the drought severity reached a certain degree, most vegetation greenness declined because the water deficit was quite severe. In S3 of the drought, the rainfall recovered, the drought was relieved to some degree, and the NDVI of the corresponding region’s vegetation recovered, as well. We used EVI to reanalyze the drought condition with PDSI and also found the similar relationship with NDVI.
Figure 3.
PDSI distribution frequency (up) and spatial distribution (down) in the three time periods: initial stage (left), middle stage (middle), and final recovery stage (right). The red square area is our study area, and experienced serious drought during 2009 to 2010.
Figure 3.
PDSI distribution frequency (up) and spatial distribution (down) in the three time periods: initial stage (left), middle stage (middle), and final recovery stage (right). The red square area is our study area, and experienced serious drought during 2009 to 2010.
Figure 4.
Natural vegetation NDVI anomaly spatial distribution in the three time periods: initial stage (left), middle stage (middle), and final recovery stage (right).
Figure 4.
Natural vegetation NDVI anomaly spatial distribution in the three time periods: initial stage (left), middle stage (middle), and final recovery stage (right).
4.3. Response Difference among Different Types of Vegetation
Based on the analysis in the previous section, it was found that there were some differences in the responses of different vegetation in the different stages of drought. From
Figure 4, it can be seen that in stage S1 some vegetation’s NDVI increased, but there were declines in some pixels’ NDVI. To further understand the reasons for these NDVI variations and differences, this paper will extend the analysis of the variation in NDVI to different vegetation types. For the different stages of drought, we calculated the NDVI anomaly and conducted statistic studies on the response of different vegetation types (
Figure 5).
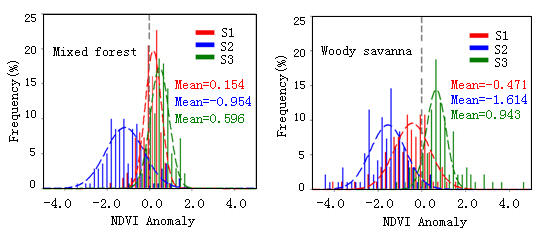
Figure 5.
Vegetation responses to drought under different drought stages. (a) NDVI anomalies frequency distribution; and (b) PDSI frequency distribution. The histograms of PDSI frequency distribution were calculated within the same area as the NDVI anomaly frequency distribution.
Figure 5.
Vegetation responses to drought under different drought stages. (a) NDVI anomalies frequency distribution; and (b) PDSI frequency distribution. The histograms of PDSI frequency distribution were calculated within the same area as the NDVI anomaly frequency distribution.
The main vegetation types in the study area include mixed forest, woody savanna, and grassland. We calculated an anomaly distribution histogram (
Figure 5a) of these three types of vegetation NDVI in the different periods. From
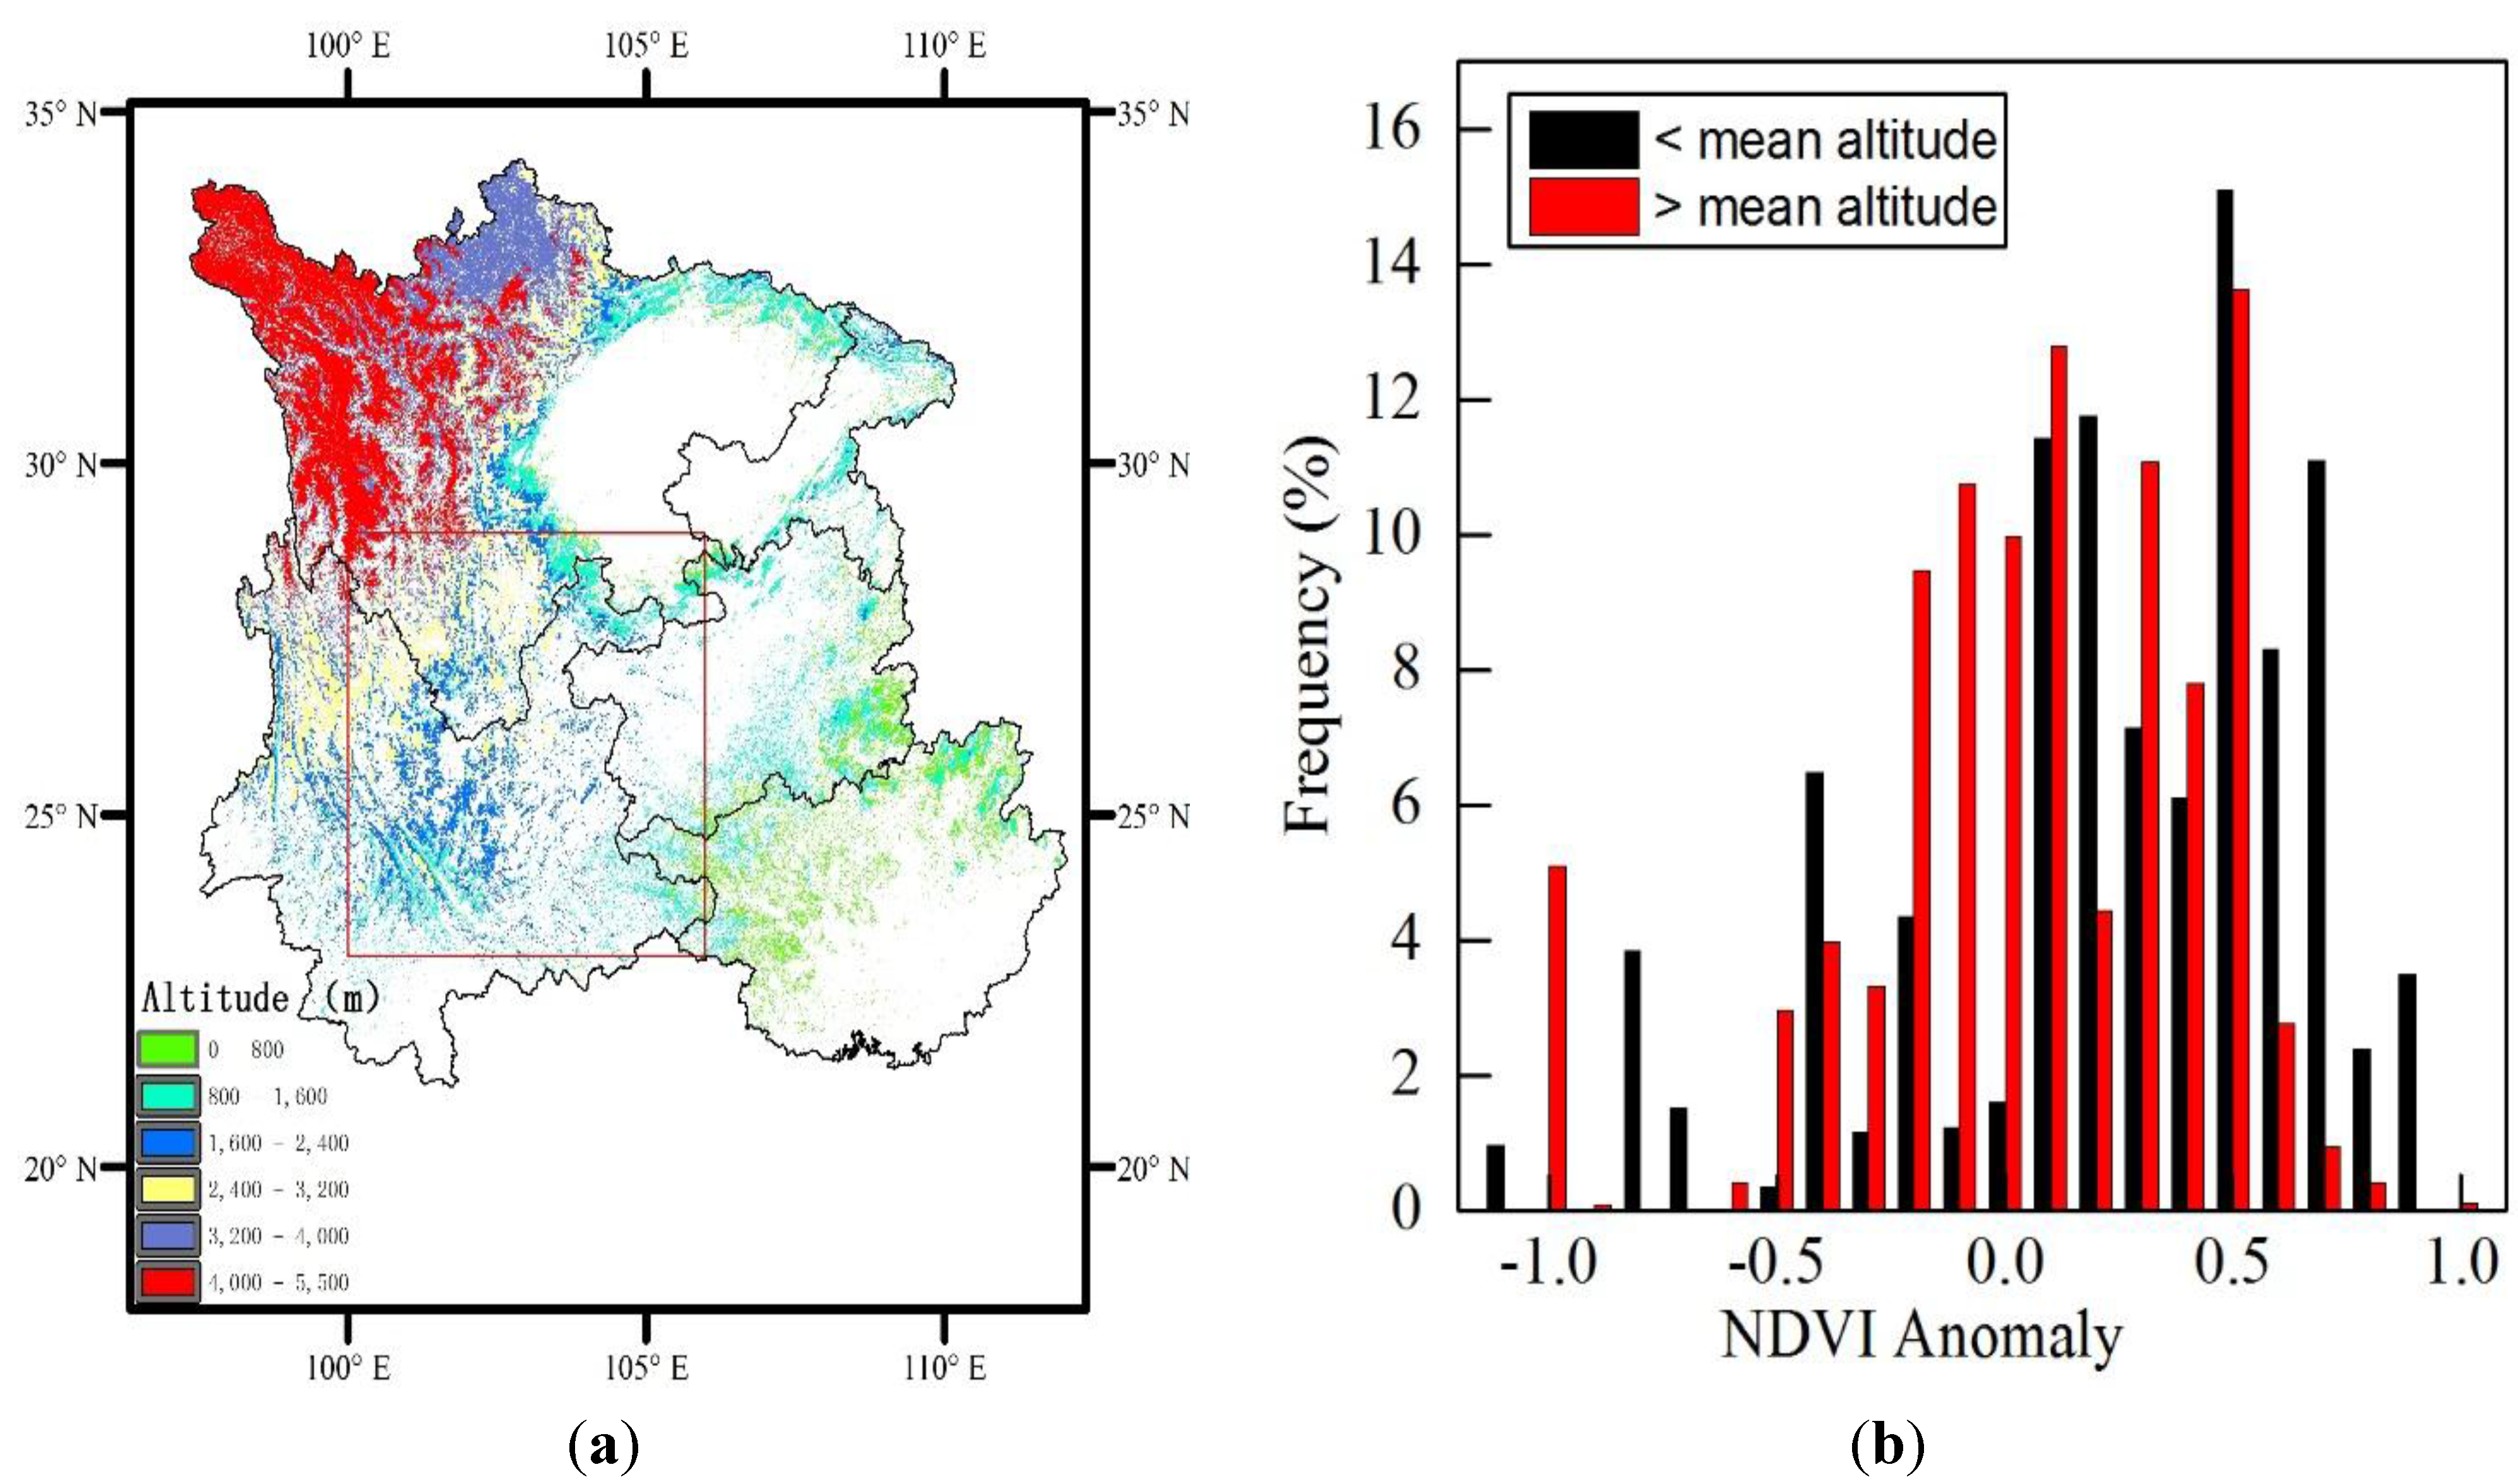
Figure 5a, it can be seen that the drought’s impact on the different types of vegetation caused remarkable differences. The results revealed that the drought during the initial stage inhibited the growth of grassland and woody savanna, however, forest growth did not decrease during the first stage of drought, and there was even a trend towards higher NDVI values. In the early drought stage, drought promoted tree growth in the mixed forests. The response of the other two vegetation types was negative, and the woody savanna was also very remarkable. In order to study the effect of elevation on vegetation growth, we checked the spatial distribution of altitude (
Figure 6a). The mean altitude in the study area is 1520 m and the mean altitude of mixed forest is 1896 m. As for mixed forest in the initial stage, we created two groups corresponding to lower than mean elevation and higher than mean elevation, and calculated the NDVI anomaly respectively (
Figure 6b). Independent sample T tests (sig > 0.05) indicate that there is no significant difference between the two groups. That is to say, elevation has no influence on the growth of vegetation.
Figure 6.
(a) Spatial distribution of altitude; and (b) NDVI anomaly distribution frequency of the mixed forest in the initial stage.
Figure 6.
(a) Spatial distribution of altitude; and (b) NDVI anomaly distribution frequency of the mixed forest in the initial stage.
In the middle stage of the drought, the drought restrained the growth of all of the vegetation types, among which the degree of damage to the woody savanna was the largest. In the final stage of the drought, the NDVI of every vegetation type began to recover, and the recovery of grassland was the strongest.
To examine the differences between the vegetation types and corresponding PDSI in the three stages of drought, we calculated the histogram of PDSI frequency distribution (
Figure 5b) of the different vegetation types at the same time. Using the two-sample Kolmogorov–Smirnov t-test, we found that the PDSI corresponding to the mixed forest, woody savanna, and grassland were not obviously different. For the different vegetation types in the region, the suffered drought severity degree was similar at the same stage of drought. The response difference from the vegetation NDVI to the drought primarily came from different types of vegetation, and different types of vegetation had different drought responses.
5. Discussion
This paper divides the drought degree of Southwestern China using PDSI values and consequently shows that the drought index had very good applicability in the region. Using PDSI, the different periods of this extreme weather were divided, and PDSI also reflected the different impact of drought on vegetation growth in different periods. Although PDSI is described as an index overestimating the magnitude of drought [
49], and the average over the region may hide strong sub-regional anomalies, this evaluation is useful to highlight general relationships. According to the results of the analysis, we can see that drought variously influenced different vegetation at different times. The changes of NDVI were rather large, which reflects the differential response of vegetation types with the degree of drought. The drought condition had direct impacts on the vegetation indices and chlorophyll fluorescence [
50]. When a plant’s water demand cannot be met, its leaves will become yellow and NDVI will decrease. The plant’s root system is a vital organ for the plant to absorb water, and the root system is of crucial importance to the plant’s drought tolerance [
51]. With limited water, the quantity of water absorption is a function of root depth. Strong, deep roots can help the plants store and use the water kept in the soil efficiently [
52].
In the first stage of drought, the mixed forest response to the drought was clearly positive; that is, the drought in its initial stage promoted the growth of mixed forest. The responses of the other two types of vegetation response were negative, and the woody savanna’s response was obvious. When the drought began, rainfall decreased, but the moist soil could still provide the needed water for the vegetation’s growth, and the vegetation absorbed the soil’s water through the root systems. The root systems of forest trees are generally deep [
53]. When the drought arrived initially, the trees could absorb deep phreatic water through their relatively long roots, to replenish the water. The enhanced radiation in the initial stage of drought promoted tree growth. At that time, the wood savanna or grasslands could not absorb deep phreatic water because their roots were short, and they had been influenced by the drought. In the middle stage of drought, the drought restrained all vegetation growth, and the response of the vegetation was dramatic. Upon reaching the drought middle stage, the radiation became stronger, there was a persistent lack of rainfall, and the water in the soil gradually decreased. When the soil was dry the plant could no longer absorb water through the roots, and then more moisture is lost from the plant. The whole plant would appear to be in an air-dried condition, and NDVI decreased gradually. In the middle stage, there was no rainfall to supply the underground water, which made the underground water level decline, and the deep roots of trees also were not able to absorb water; therefore, all of the vegetation, including the forest, was influenced by the drought, which restrained the growth of vegetation. In the final recovery stage of drought, all vegetation NDVI recovered, and the recovery of grassland was relatively strong. During this stage, rainfall recovered, underground water was resupplied, and all vegetation began to grow. The recovery of grassland was the fastest.
The NDVI in this work was used as an indicator to reveal the effects of droughts on vegetation and their differences. The NDVI data has been detected by the cloud identification and cloud-influenced pixels are removed. As for the pixels of poor atmospheric conditions, even if atmospheric correction was conducted, it might still have a certain impact on the NDVI values. It is not easy to identify these pixels, and some suitable filter technique [
54] will be needed if we want to remove it. However, there still have some uncertainties in this research. First of all, there are uncertainties in the interpretation of findings because of a lack of data or other limitations in identifying particular tree species' distributions and the lack of knowledge regarding the more specific climatic signals influencing forest tree species within the altitudinal range. Even when two different species grow next to each other, this does not necessarily mean that they will exhibit the same drought response [
55]. Second, the forest ecosystems investigated have a considerable range in altitude with about 30% distributed below 1400 m, about 50% between 1400–3000 m, and the remaining about 20% at other altitudes. This means that within such a wide range there are many different vegetation belts and forest species with different responses to climate, depending on whether they are at their drought tolerance margins, at their cold tolerance limits, or somewhere in between. The analysis may also include data from grasslands or savannas at e.g., 400 m compared with cold-limited forests at 4000 m. Another uncertainty is the limitation when relying only on PDSI. Using it alone without a separate evaluation of the effect of temperature and precipitation can hide important forest responses. For example within the distribution range of a particular tree species the cold limited part of its population could (at the initial stages of drought) benefit from a temperature increase, while another part of the population growing in very dry conditions or near the species drought tolerance limits would immediately suffer. Furthermore, light is a limiting resource usually for sub-canopy vegetation or heavily-shaded plants. The NDVI data are derived from canopy or non-shaded vegetation which is adequately exposed to sunlight. Thus, radiation is very likely not a limiting factor for growth. Therefore, additional information and not only NDVI data are required to interpret ecological responses of vegetation. In such cases further investigation beyond the general approach applied is further needed.
6. Conclusions
A severe and prolonged drought occurred in Southwestern China in 2009 and 2010. In this study, the impacts of drought on vegetation using climate and vegetation indices were examined. We first assessed the spatial extent, duration, and the severity of the drought based on temperature, relative humidity, and precipitation and then examined the effects of vegetation responses based on remote sensing-based NDVI data. The results indicated that the climatological data and remotely-sensed NDVI exhibited anomalous responses. In the beginning of the droughts, moderate drought inhibited grassland and woody savanna growth but did not inhibit forest growth. In the middle stage, severe and prolonged drought inhibited the growth of all vegetation types. However, in the final stage all of the vegetation types were restored, including grassland, which had endured the most severe drought. The observational evidence revealed that the response of vegetation to the extreme drought varied significantly in the different stages, which should receive more attention in future studies.
The vegetation types were differentially impacted by drought. In the initial stage of drought, the response of forest to the drought was positive, that is, in the initial stage of the Yunnan drought, forest growth did not decrease, and there was even a trend towards higher NDVI values for about 70% of forest growing from 400 m altitude to 4200 m altitude. In the middle stage of drought, the drought suppressed forest growth. In the final stage of drought, forest growth recovered. In the initial and middle stages of drought, the response for woody savanna and grassland were negative, and the degree of damage to the woody savanna was the largest. In the final stage, the woody savanna and grassland recovered, and the grassland recovery was the strongest.
We find that the drought during the initial stage inhibited the growth of grassland and woody savanna, however, it promoted forest growth. The results of this study suggest that the vegetation response to extreme drought disturbance significantly varies with vegetation type and parameter. This finding may be attributed to the coupling effects of precipitation and relative humidity or the individual effects of temperature or solar radiation associated with the vegetation conditions.
Acknowledgments
This work was supported by the High Technology Research and Development Program of China (Grant NO. 2013AA122801) and the Fundamental Research Funds for the Central Universities (Grant No. 2014KJJCB17).
Author Contributions
The analysis was performed by X.Z., D.W. and H.W. All authors contributed with ideas, writing and discussions.
Conflicts of Interest
The authors declare no conflict of interest.
References
- Dai, A. Drought under global warming: A review. Wiley Interdiscip. Rev.: Clim. Chang. 2011, 2, 45–65. [Google Scholar] [CrossRef]
- Wilhite, D.A.; Glantz, M.H. Understanding: The drought phenomenon: The role of definitions. Water Int. 1985, 10, 111–120. [Google Scholar] [CrossRef]
- Marengo, J.A.; Tomasella, J.; Alves, L.M.; Soares, W.R.; Rodriguez, D.A. The drought of 2010 in the context of historical droughts in the Amazon region. Geophys. Res. Lett. 2011, 38, L12703. [Google Scholar] [CrossRef]
- Kauffman, G.J.; Vonck, K.J. Frequency and intensity of extreme drought in the Delaware Basin, 1600–2002. Water Resour. Res. 2011, 47, W05521. [Google Scholar] [CrossRef]
- Yang, J.; Gong, D.; Wang, W.; Hu, M.; Mao, R. Extreme drought event of 2009/2010 over southwestern China. Meteorol. Atmos. Phys. 2012, 115, 173–184. [Google Scholar] [CrossRef]
- Costanza, R.; d’Arge, R.; de Groot, R.; Farber, S.; Grasso, M.; Hannon, B.; Limburg, K.; Naeem, S.; O’Neill, R.V.; Paruelo, J. The value of the world’s ecosystem services and natural capital. Ecol. Econ. 1998, 25, 3–15. [Google Scholar] [CrossRef]
- Dorman, M.; Svoray, T.; Perevolotsky, A.; Sarris, D. Forest performance during two consecutive drought periods: Diverging long-term trends and short-term responses along a climatic gradient. For. Ecol. Manag. 2013, 310, 1–9. [Google Scholar] [CrossRef]
- Dorman, M.; Perevolotsky, A.; Sarris, D.; Svoray, T. The effect of rainfall and competition intensity on forest response to drought: Lessons learned from a dry extreme. Oecologia 2015, 177, 1025–1038. [Google Scholar] [CrossRef] [PubMed]
- Werick, W.J.; Willeke, G.E.; Guttman, N.B.; Hosking, J.R.M.; Wallis, J.R. National drought atlas developed. Eos Trans. Am. Geophys. Union 1994, 75, 89–90. [Google Scholar] [CrossRef]
- McKee, T.B.; Doesken, N.J.; Kleist, J. The relationship of drought frequency and duration to time scales. In Proceedings of the Eighth Conference on Applied Climatology, Anaheim, CA, USA, 17–22 January 1993.
- Vicente-Serrano, S.M.; Beguería, S.; López-Moreno, J.I. A multiscalar drought index sensitive to global warming: The standardized precipitation evapotranspiration index. J. Clim. 2009, 23, 1696–1718. [Google Scholar] [CrossRef]
- Kaicheng, H.; Chuixiang, Y.; Donghai, W.; Tao, Z.; Xiang, Z.; William, J.B.; Suhua, W.; Hao, W.; Du, L.; Zheng, L. Tipping point of a conifer forest ecosystem under severe drought. Environ. Res. Lett. 2015, 10, 024011. [Google Scholar]
- Palmer, W.C. Meteorological Drought research paper No. 45; U.S. Weather Bureau: Washington, DC, USA, 1965.
- Alley, W.M. The palmer drought severity index: Limitations and assumptions. J. Clim. Appl. Meteorol. 1984, 23, 1100–1109. [Google Scholar] [CrossRef]
- Tsakiris, G.; Vangelis, H. Establishing a drought index incorporating evapotranspiration. Eur. Water 2005, 9, 3–11. [Google Scholar]
- Tsakiris, G.; Pangalou, D.; Vangelis, H. Regional drought assessment based on the Reconnaissance Drought Index (RDI). Water Resour. Manag. 2007, 21, 821–833. [Google Scholar] [CrossRef]
- Mu, Q.; Zhao, M.; Kimball, J.S.; McDowell, N.G.; Running, S.W. A remotely sensed global terrestrial drought severity index. Bull. Am. Meteorol. Soc. 2012, 94, 83–98. [Google Scholar] [CrossRef]
- Svoboda, M.; LeComte, D.; Hayes, M.; Heim, R.; Gleason, K.; Angel, J.; Rippey, B.; Tinker, R.; Palecki, M.; Stooksbury, D.; et al. The drought monitor. Bull. Am. Meteorol. Soc. 2002, 83, 1181–1190. [Google Scholar]
- Yao, Y.; Liang, S.; Qin, Q.; Wang, K. Monitoring drought over the conterminous United States using MODIS and NCEP Reanalysis-2 data. J. Appl. Meteorol. Climatol. 2010, 49, 1665–1680. [Google Scholar] [CrossRef]
- Palmer, W.C. Keeping track of crop moisture conditions, nationwide: The new crop moisture index. Weatherwise 1968, 21, 156–161. [Google Scholar] [CrossRef]
- Zargar, A.; Sadiq, R.; Naser, B.; Khan, F.I. A review of drought indices. Environ. Rev. 2011, 19, 333–349. [Google Scholar] [CrossRef]
- Caccamo, G.; Chisholm, L.A.; Bradstock, R.A.; Puotinen, M.L. Assessing the sensitivity of MODIS to monitor drought in high biomass ecosystems. Remote Sens. Environ. 2011, 115, 2626–2639. [Google Scholar] [CrossRef]
- Ji, L.; Peters, A.J. Assessing vegetation response to drought in the northern great plains using vegetation and drought indices. Remote Sens. Environ. 2003, 87, 85–98. [Google Scholar] [CrossRef]
- Anderson, L.O.; Malhi, Y.; Aragão, L.E.O.C.; Ladle, R.; Arai, E.; Barbier, N.; Phillips, O. Remote sensing detection of droughts in Amazonian forest canopies. New Phytol. 2010, 187, 733–750. [Google Scholar] [CrossRef] [PubMed]
- Unganai, L.S.; Kogan, F.N. Drought monitoring and corn yield estimation in Southern Africa from AVHRR data. Remote Sens. Environ. 1998, 63, 219–232. [Google Scholar] [CrossRef]
- Mänd, P.; Hallik, L.; Peñuelas, J.; Nilson, T.; Duce, P.; Emmett, B.A.; Beier, C.; Estiarte, M.; Garadnai, J.; Kalapos, T.; et al. Responses of the reflectance indices PRI and NDVI to experimental warming and drought in european shrublands along a north–south climatic gradient. Remote Sens. Environ. 2010, 114, 626–636. [Google Scholar] [CrossRef]
- Thomas, K.; Sabina, D.; Mario, M.-H. Extreme late-summer drought causes neutral annual carbon balance in southwestern ponderosa pine forests and grasslands. Environ. Res. Lett. 2013, 8, 015015. [Google Scholar]
- Xu, X.; Piao, S.; Wang, X.; Chen, A.; Ciais, P.; Myneni, R.B. Spatio-temporal patterns of the area experiencing negative vegetation growth anomalies in China over the last three decades. Environ. Res. Lett. 2012, 7, 035701. [Google Scholar] [CrossRef]
- John, R.; Chen, J.; Ou-Yang, Z.-T.; Xiao, J.; Becker, R.; Samanta, A.; Ganguly, S.; Yuan, W.; Batkhishig, O. Vegetation response to extreme climate events on the Mongolian Plateau from 2000 to 2010. Environ. Res. Lett. 2013, 8, 035033. [Google Scholar] [CrossRef]
- Liu, X.; Ren, L.; Yuan, F.; Xu, J.; Liu, W. Assessing vegetation response to drought in the Laohahe catchment, North China. Hydrol. Res. 2012, 43, 91–101. [Google Scholar] [CrossRef]
- Saleska, S.R.; Didan, K.; Huete, A.R.; Rocha, H.R.D. Amazon forests green-up during 2005 drought. Science 2007, 318, 612. [Google Scholar] [CrossRef] [PubMed]
- Ning, Z.; Jin-Ho, Y.; Jose, A.M.; Ajit, S.; Carlos, A.N.; Annarita, M.; Neelin, J.D. Causes and impacts of the 2005 Amazon drought. Environ. Res. Lett. 2008, 3, 014002. [Google Scholar]
- Samanta, A.; Ganguly, S.; Hashimoto, H.; Devadiga, S.; Vermote, E.; Knyazikhin, Y.; Nemani, R.R.; Myneni, R.B. Amazon forests did not green-up during the 2005 drought. Geophys. Res. Lett. 2010, 37, L05401. [Google Scholar] [CrossRef]
- Samanta, A.; Ganguly, S.; Myneni, R.B. MODIS enhanced vegetation index data do not show greening of Amazon forests during the 2005 drought. New Phytol. 2011, 189, 11–15. [Google Scholar] [CrossRef] [PubMed]
- Morton, D.C.; Nagol, J.; Carabajal, C.C.; Rosette, J.; Palace, M.; Cook, B.D. Amazon forests maintain consistent canopy structure and greenness during the dry season. Nature 2014, 506, 221–224. [Google Scholar] [CrossRef] [PubMed]
- Wagle, P.; Xiao, X.; Torn, M.S.; Cook, D.R.; Matamala, R.; Fischer, M.L.; Jin, C.; Dong, J.; Biradar, C. Sensitivity of vegetation indices and gross primary production of tallgrass prairie to severe drought. Remote Sens. Environ. 2014, 152, 1–14. [Google Scholar] [CrossRef]
- Zhang, X.; Susan Moran, M.; Zhao, X.; Liu, S.; Zhou, T.; Ponce-Campos, G.E.; Liu, F. Impact of prolonged drought on rainfall use efficiency using MODIS data across China in the early 21st century. Remote Sens. Environ. 2014, 150, 188–197. [Google Scholar] [CrossRef]
- Zhang, L.; Xiao, J.; Li, J.; Wang, K.; Lei, L.; Guo, H. The 2010 spring drought reduced primary productivity in southwestern China. Environ. Res. Lett. 2012, 7, 045706. [Google Scholar] [CrossRef]
- Solano, R.; Didan, K.; Jacobson, A.; Huete, A. MODIS vegetation indices (mod13) c5 user’s guide. Available online: http://www.ctahr.hawaii.edu/grem/mod13ug/index.html (accessed on 20 December 2014).
- Huete, A.; Justice, C.; Leeuwen, W. MODIS vegetation index (mod13): Algorithm theoretical basis document. Available online: http://modis.gsfc.nasa.gov/data/atbd/atbd_mod13.pdf (accessed on 27 June 2014).
- Friedl, M.A.; McIver, D.K.; Hodges, J.C.F.; Zhang, X.Y.; Muchoney, D.; Strahler, A.H.; Woodcock, C.E.; Gopal, S.; Schneider, A.; Cooper, A.; et al. Global land cover mapping from MODIS: Algorithms and early results. Remote Sens. Environ. 2002, 83, 287–302. [Google Scholar] [CrossRef]
- Friedl, M.A.; Sulla-Menashe, D.; Tan, B.; Schneider, A.; Ramankutty, N.; Sibley, A.; Huang, X. MODIS collection 5 global land cover: Algorithm refinements and characterization of new datasets. Remote Sens. Environ. 2010, 114, 168–182. [Google Scholar] [CrossRef]
- Harris, I.; Jones, P.D.; Osborn, T.J.; Lister, D.H. Updated high-resolution grids of monthly climatic observations-the CRU TS3.10 Dataset. Int. J. Climatol. 2013. [Google Scholar] [CrossRef] [Green Version]
- Jones, P.; Lister, D.; Osborn, T.; Harpham, C.; Salmon, M.; Morice, C. Hemispheric and large-scale land-surface air temperature variations: An extensive revision and an update to 2010. J. Geophys. Res.: Atmos. 2012, 117. [Google Scholar] [CrossRef] [Green Version]
- Wang, X.; Piao, S.; Ciais, P.; Li, J.; Friedlingstein, P.; Koven, C.; Chen, A. Spring temperature change and its implication in the change of vegetation growth in North America from 1982 to 2006. Proc. Natl. Acad. Sci. USA 2011, 108, 1240–1245. [Google Scholar] [CrossRef] [PubMed]
- Peng, S.; Piao, S.; Ciais, P.; Myneni, R.B.; Chen, A.; Chevallier, F.; Dolman, A.J.; Janssens, I.A.; Penuelas, J.; Zhang, G.; et al. Asymmetric effects of daytime and night-time warming on Northern Hemisphere vegetation. Nature 2013, 501, 88–92. [Google Scholar] [CrossRef] [PubMed]
- Jong, R.; Schaepman, M.E.; Furrer, R.; Bruin, S.; Verburg, P.H. Spatial relationship between climatologies and changes in global vegetation activity. Glob. Chang. Biol. 2013, 19, 1953–1964. [Google Scholar] [CrossRef] [PubMed]
- Zhao, M.; Running, S.W. Drought-induced reduction in global terrestrial net primary production from 2000 through 2009. Science 2010, 329, 940–943. [Google Scholar] [CrossRef] [PubMed]
- Sheffield, J.; Wood, E.F.; Roderick, M.L. Little change in global drought over the past 60 years. Nature 2012, 491, 435–438. [Google Scholar] [CrossRef] [PubMed]
- Yoshida, Y.; Joiner, J.; Tucker, C.; Berry, J.; Lee, J.E.; Walker, G.; Reichle, R.; Koster, R.; Lyapustin, A.; Wang, Y. The 2010 russian drought impact on satellite measurements of solar-induced chlorophyll fluorescence: Insights from modeling and comparisons with parameters derived from satellite reflectances. Remote Sens. Environ. 2015, 166, 163–177. [Google Scholar] [CrossRef]
- Smith, F.A. Plant roots. Growth, activity and interaction with soils. Ann. Bot. 2007, 100, 151–152. [Google Scholar] [CrossRef]
- Schulze, E.D.; Mooney, H.A.; Sala, O.E.; Jobbagy, E.; Buchmann, N.; Bauer, G.; Canadell, J.; Jackson, R.B.; Loreti, J.; Oesterheld, M.; et al. Rooting depth, water availability, and vegetation cover along an aridity gradient in Patagonia. Oecologia 1996, 108, 503–511. [Google Scholar] [CrossRef]
- Canadell, J.; Jackson, R.B.; Ehleringer, J.B.; Mooney, H.A.; Sala, O.E.; Schulze, E.D. Maximum rooting depth of vegetation types at the global scale. Oecologia 1996, 108, 583–595. [Google Scholar] [CrossRef]
- Rembold, F.; Meroni, M.; Urbano, F.; Royer, A.; Atzberger, C.; Lemoine, G.; Eerens, H.; Haesen, D. Remote sensing time series analysis for crop monitoring with the spirits software: New functionalities and use examples. Front. Environ. Sci. 2015, 3, 1–11. [Google Scholar] [CrossRef]
- Linares, J.C.; Delgado-Huertas, A.; Carreira, J.A. Climatic trends and different drought adaptive capacity and vulnerability in a mixed Abies pinsapo–Pinus halepensis forest. Clim. Chang. 2011, 105, 67–90. [Google Scholar] [CrossRef]
© 2015 by the authors; licensee MDPI, Basel, Switzerland. This article is an open access article distributed under the terms and conditions of the Creative Commons Attribution license (http://creativecommons.org/licenses/by/4.0/).


 ,
, 


