Article

An Unmanned Airship Thermal Infrared Remote Sensing System for Low-Altitude and High Spatial Resolution Monitoring of Urban Thermal Environments: Integration and an Experiment

1
State Key Laboratory of Subtropical Building Science, Department of Architecture, South China University of Technology, Guangzhou 510640, China
2
Guangzhou Design Institute, Guangzhou 510620, China
*
Author to whom correspondence should be addressed.
Remote Sens. 2015, 7(10), 14259-14275; https://0-doi-org.brum.beds.ac.uk/10.3390/rs71014259
Submission received: 9 August 2015 / Revised: 12 October 2015 / Accepted: 12 October 2015 / Published: 27 October 2015

Abstract

:
Satellite remote sensing data that lacks spatial resolution and timeliness is of limited ability to access urban thermal environment on a micro scale. This paper presents an unmanned airship low-altitude thermal infrared remote sensing system (UALTIRSS), which is composed of an unmanned airship, an onboard control and navigation subsystem, a task subsystem, a communication subsystem, and a ground-base station. Furthermore, an experimental method and an airborne-field experiment for collecting land surface temperature (LST) were designed and conducted. The LST pattern within 0.8-m spatial resolution and with root mean square error (RMSE) value of 2.63 °C was achieved and analyzed in the study region. Finally, the effects of surface types on the surrounding thermal environment were analyzed by LST profiles. Results show that the high thermal resolution imagery obtained from UALTIRSS can provide more detailed thermal information, which are conducive to classify fine urban material and assess surface urban heat island (SUHI). There is a significant positive correlation between the average LST of profiles and the percent impervious surface area (ISA%) with R2 around 0.917. Overall, UALTIRSS and the retrieval method were proved to be low-cost and feasible for studying micro urban thermal environments.

Graphical Abstract

1. Introduction

With accelerated urbanization processes, a tremendous amount of rural land is covered with buildings, roads, and other impervious surfaces, which generally has higher solar radiation absorption and a greater thermal capacity and conductivity [1,2]. Easily-stored solar radiation, in conjunction with waste heat released from urban houses, transportation, and industry, lead to deterioration of the urban thermal environment and development of urban heat islands (UHI) [3,4]. How can the urban thermal environment be assessed and improved? Thermal infrared (TIR) satellite remote sensing techniques have been increasingly applied in urban climate and environment studies and have made immense achievements, mainly for analyzing the land surface temperature (LST) patterns and their relationship with surface characteristics and for evaluating surface urban heat islands (SUHI) [5,6,7].
For example, Yuan, et al. [8] used four TM/ETM+ images in different seasons from 2000 to 2002 in Minnesota, USA to analyze the relationship among LST, the Normalized Difference Vegetation Index (NDVI), and impervious surface coverage. The results revealed a significant linear relationship between LST and impervious surface coverage in all seasons, as well as a relationship between LST and NDVI that changed with the seasons. Xu, et al. [9] analyzed the relationship between the Shanghai road system and heat fields with TM6 data and verified that some roads could divide larger thermal fields into smaller ones and reduce and weaken them. Feature profile analysis, as a practical method, was carried out to study UHI. Some studies have demonstrated that the correlation between temperature and vegetation on profiles was positively correlated to the diversity of underlying surface land use types [10,11,12].
Obviously, satellite remote sensing has been recognized as a powerful tool in investigating urban thermal environments and UHI on a macro and meso scale [13,14]. Nevertheless, the low spatial resolution imagery is inadequate to capture the complex LST changes and investigate the accurate relationships between LST and surface characteristics [15,16,17,18]. Occasionally, the scale and spatial resolution of observation and evaluation may even determine a study’s conclusions. For instance, Luan, et al. [19] analyzed some urban green land in Beijing with Landsat TM5 data with 90 m spatial resolution and showed that urban green land patches’ perimeter, area, shape index, and fractional vegetation cover had no significant correlation with their cooling range on their surroundings; Gao et al. [20] obtained completely different conclusions by aerial photos with 0.25 m spatial resolution. Thus, there is also a need to observe urban thermal environments with multi-scale remote sensing technologies [21,22].
Although an airborne platform with a thermal infrared multispectral scanner, such as with a thermal airborne spectrographic imager (TASI), can provide better spatial resolution than satellites, the exorbitant price, operational technicality, and high maintainance costs limit its application widely [23,24,25,26]. In this case, this paper developed UALTIRSS and its experimental method for observing micro-scale thermal environments with high-resolution data. By conducting an airborne-field experiment, an LST map with 0.8–m spatial resolution was obtained, and then the surface thermal pattern was analyzed and discussed by the LST map and its profiles.

2. Integration of UALTIRSS

UALTIRSS is composed of an unmanned airship, an onboard control and navigation subsystem, a task subsystem, a communication subsystem, and a ground base station, as presented in Figure 1.
Figure 1. Unmanned airship low-altitude thermal infrared remote sensing system (UALTIRSS).
Remotesensing 07 14259 g001

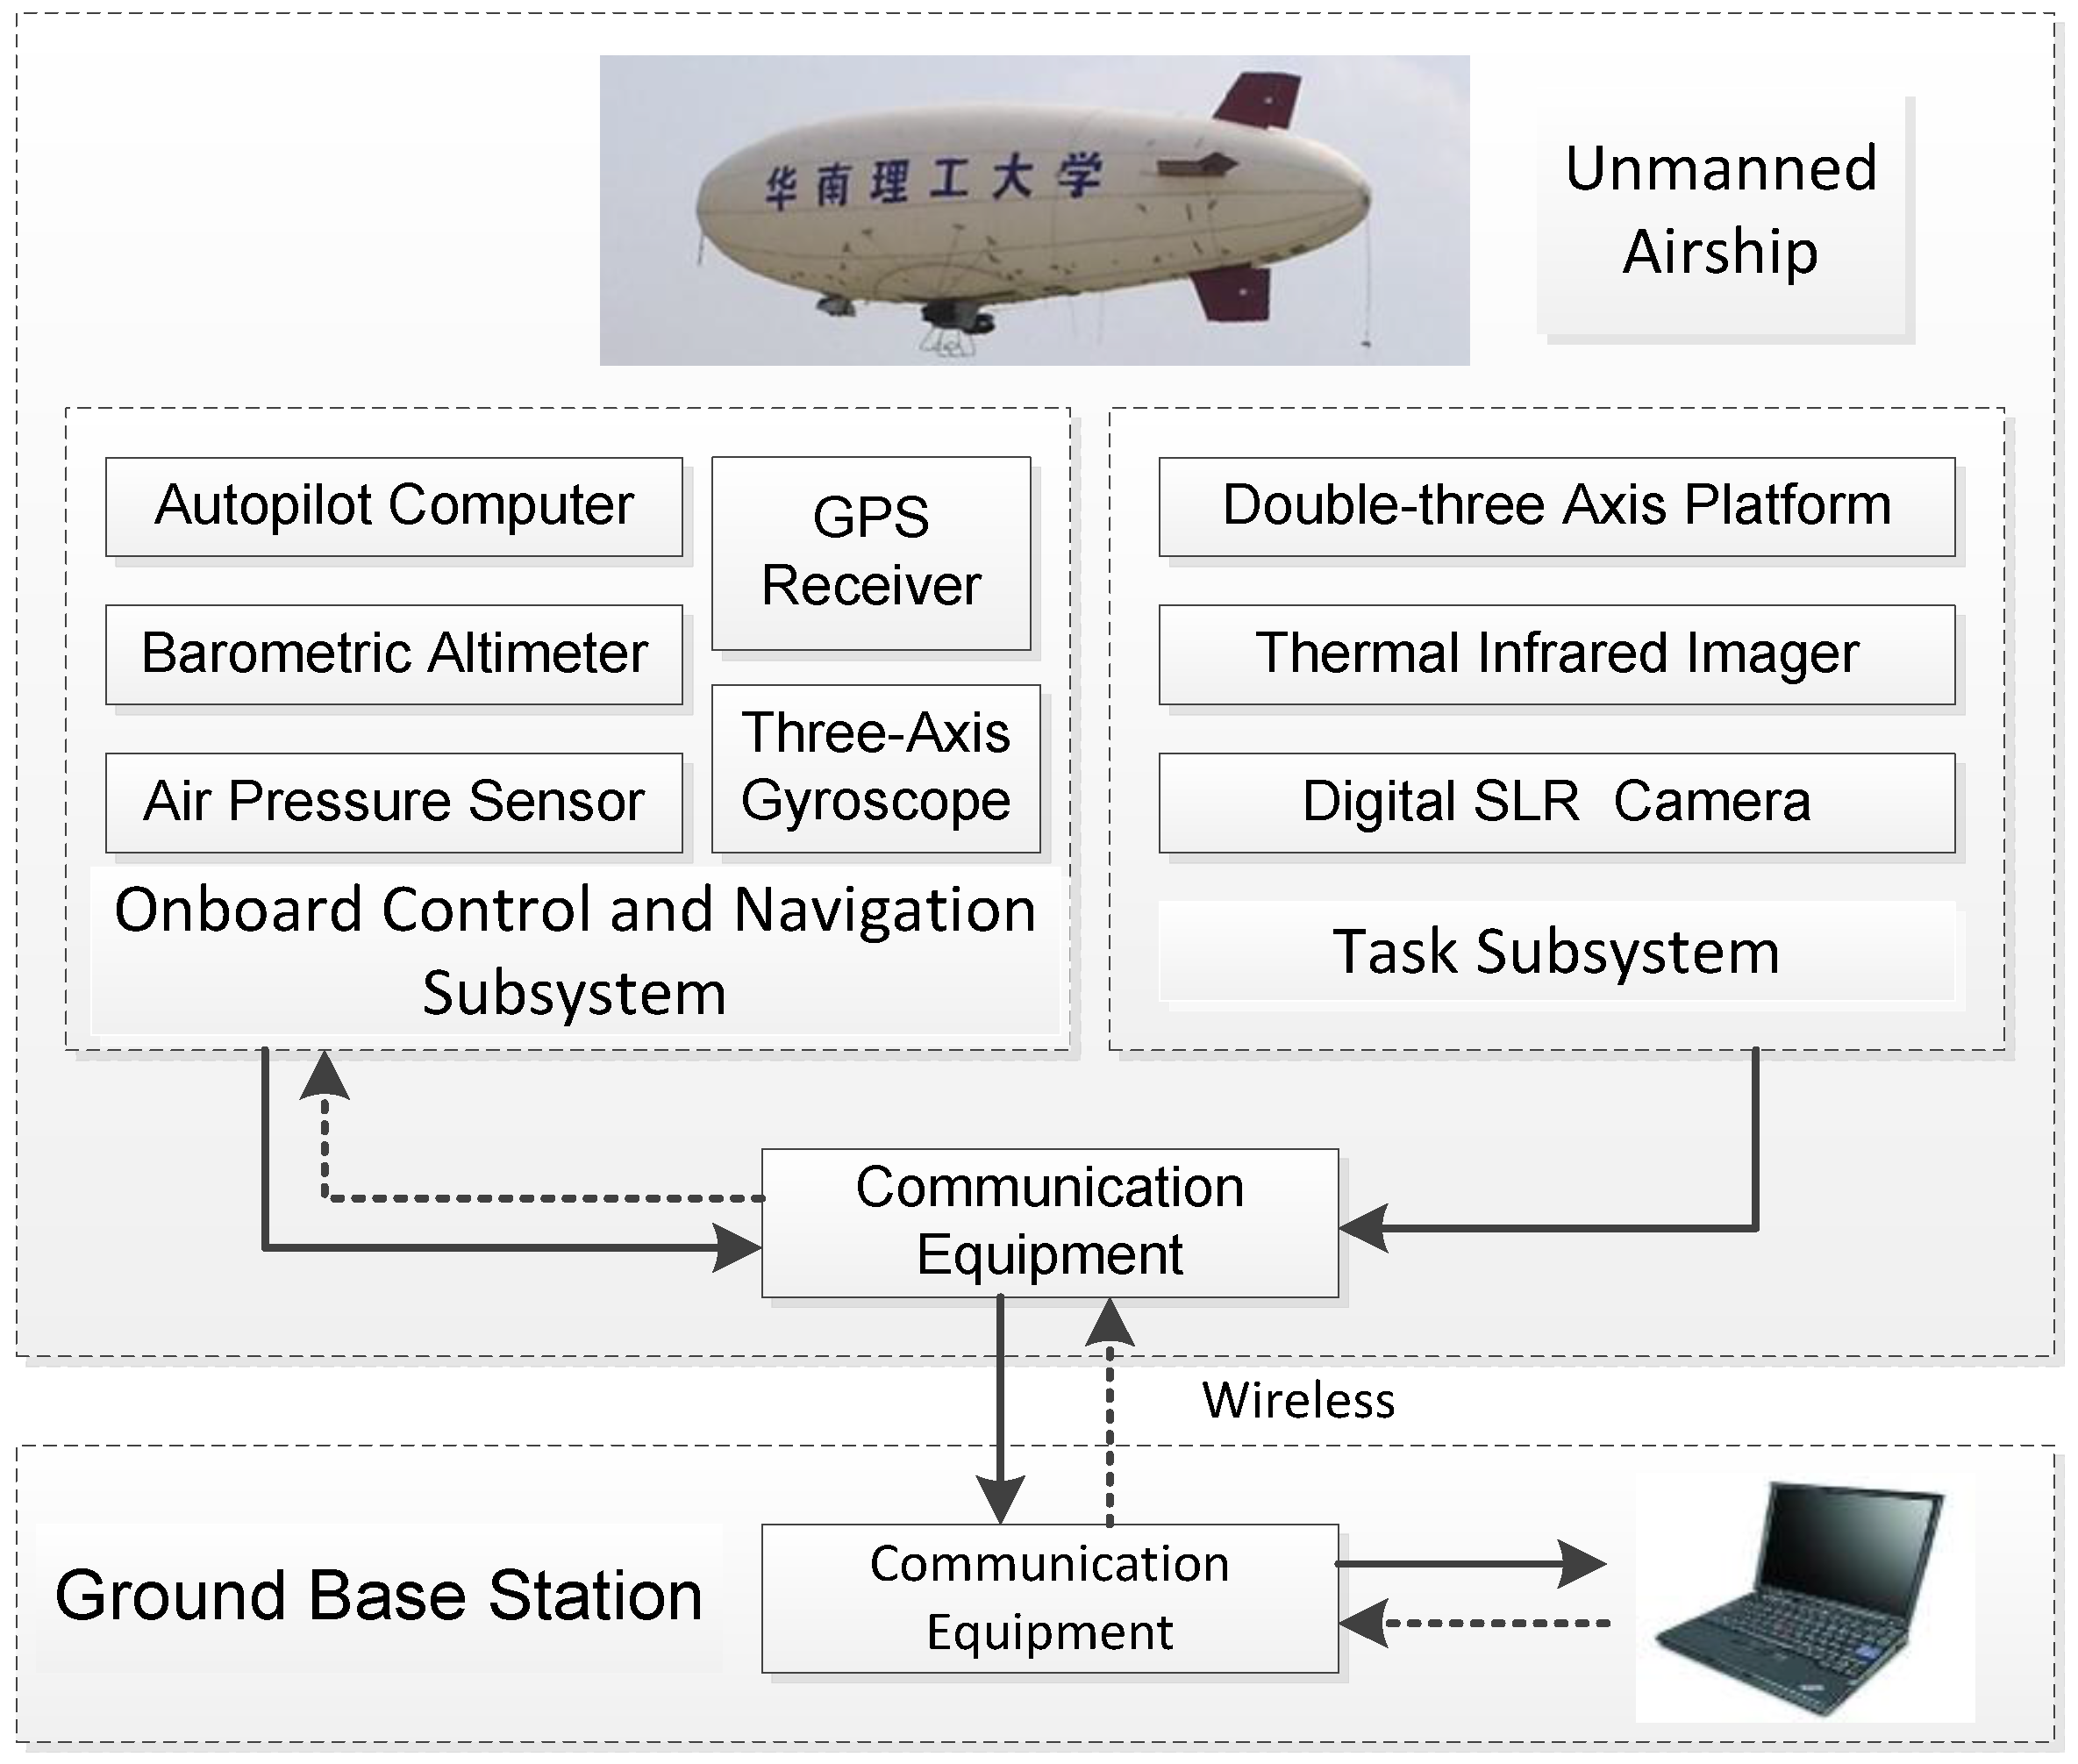
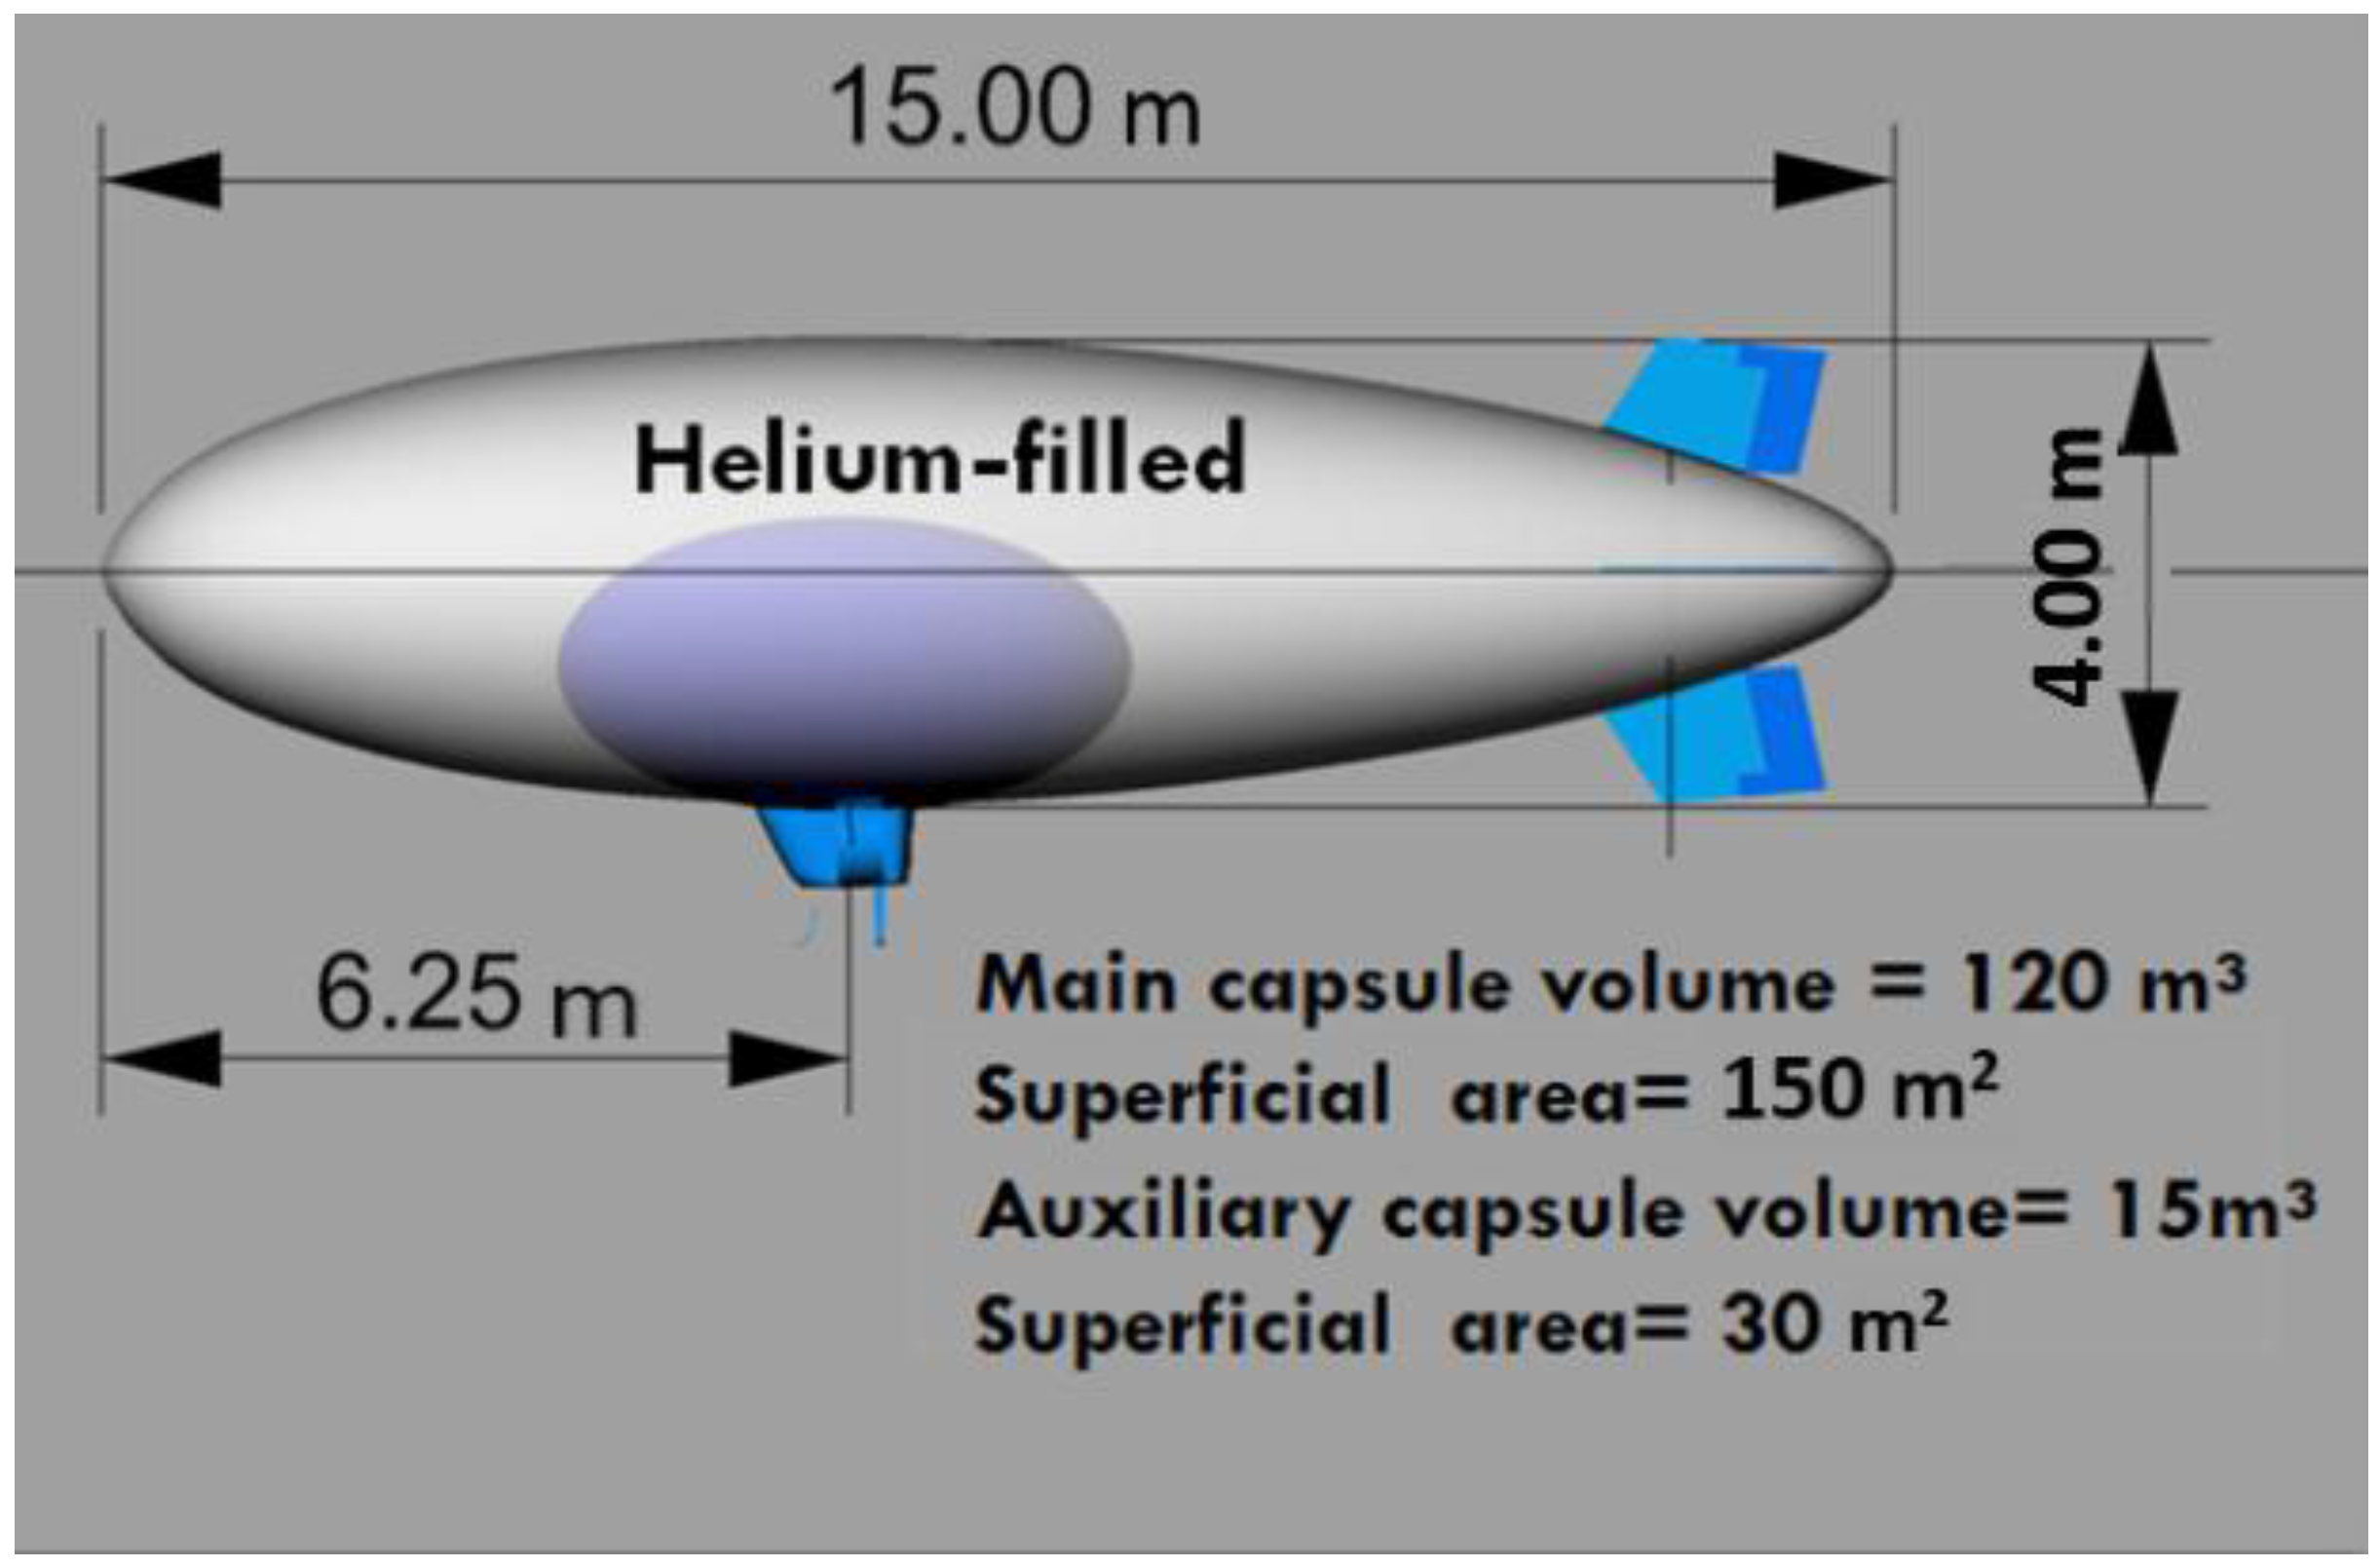
2.1. Unmanned Airship

The unmanned airship is a helium-filled, non-rigid, 15 m long, 4 m diameter, 120 m3 volume airship equipped with two 100 HP engines under the capsule. Four control surfaces are at the stern, arranged in a “plus” configuration, as shown in Figure 2. The capsule can maintain a constant internal pressure automatically by adjusting the atmospheric content in the 15 m3 lung. Its useful payload capacity is approximately 10 kg at sea level.
The airship is designed to resist less than a fresh breeze and is capable of a cruising speed between 20 km∙h−1 and 60 km∙h−1 and a cruising altitude between 100 m and 1500 m. It cruises according to GPS navigation and predefined routes and is controlled by remote control during take-off and landing.
Figure 2. Airship capsule diagram.
Remotesensing 07 14259 g002

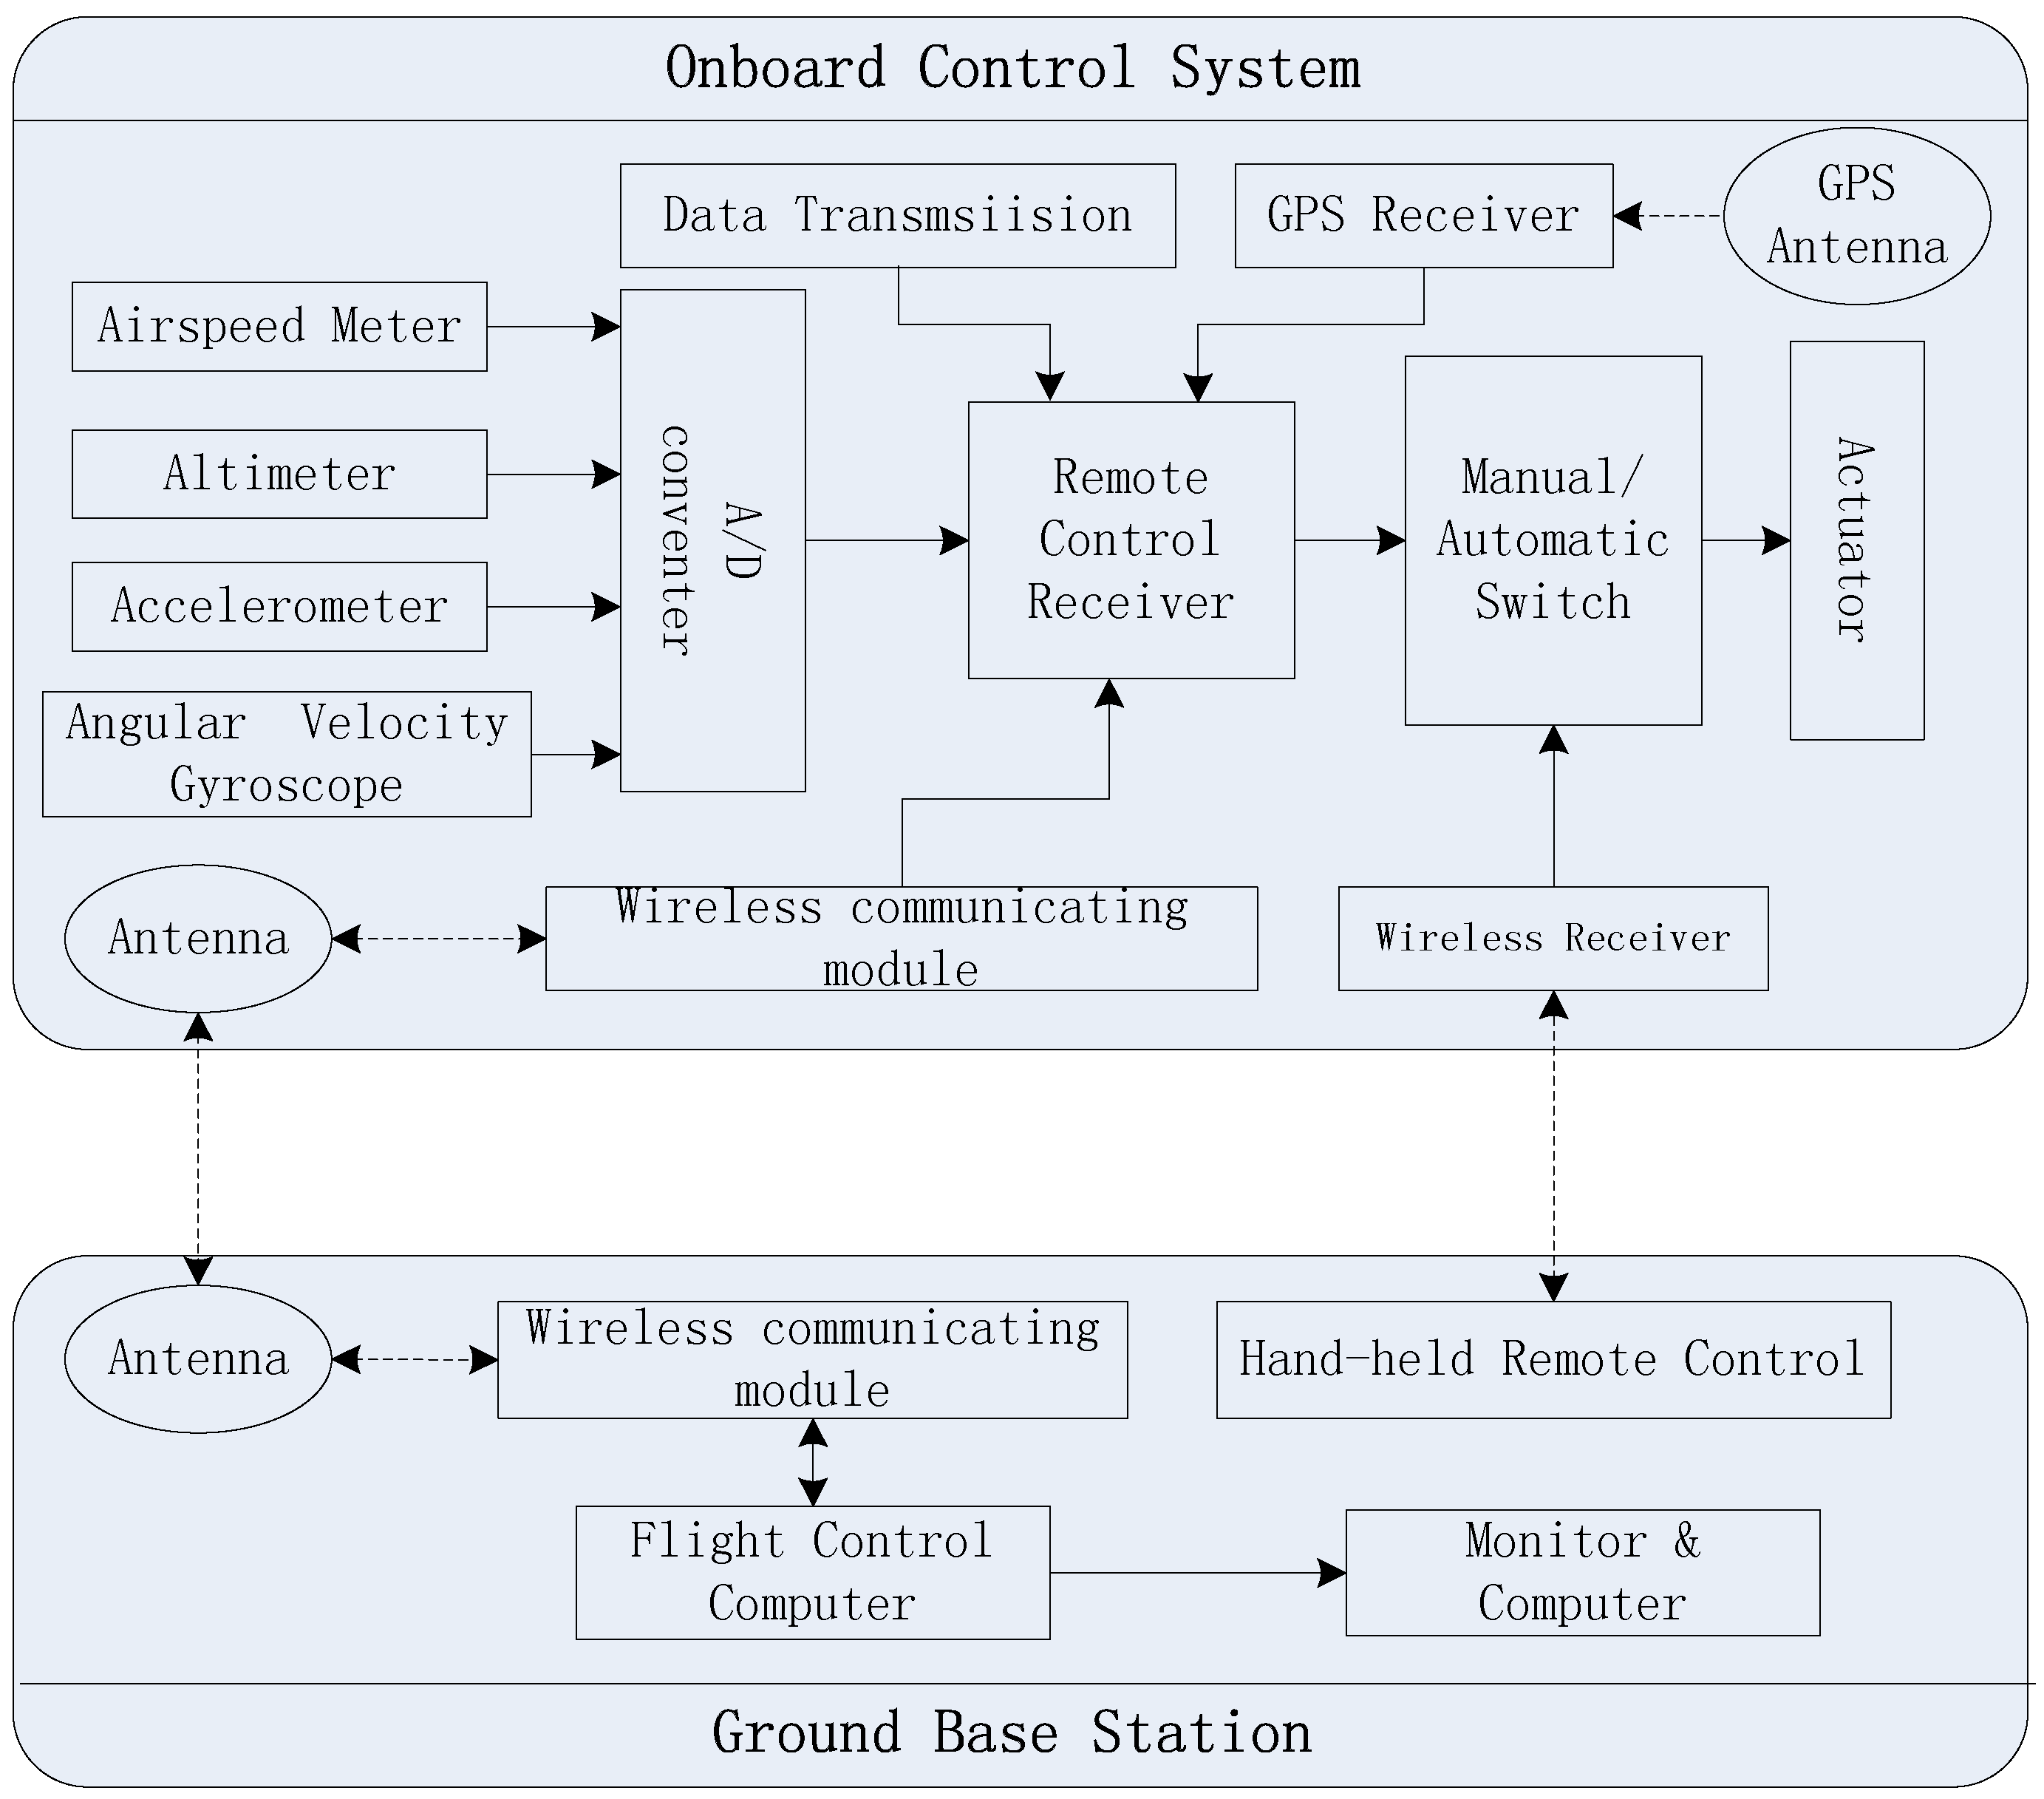
2.2. Onboard Control and Navigation Subsystem

The onboard control and navigation subsystem is responsible for flight data acquisition and autopilot control. Its structure and communication with the ground base station is shown in Figure 3. This subsystem collects the real-time information of the airship, such as its position, speed, height, and atmospheric pressure, to feed back into the ground base station. Then, the controls correct the airship’s flight route automatically according to the predefined flight route and corresponding feedback command.
Figure 3. Onboard control and navigation subsystem.
Remotesensing 07 14259 g003

2.3. Task Subsystem

The task subsystem consists of a double three-axes platform, a TIR imaging camera, and a digital SLR camera, as shown in Figure 4. The double three-axes platform can keep the shooting orientation of both cameras synchronized and vertical to the ground. The TIR imaging camera (TH9260), with a field of view of approximately 33.7° × 45.2°, is used to detect long-wave infrared radiation from 8 to 13 μm, and produces thermal infrared images. The spatial resolution of the TIR image depends on the flight altitude. The digital SLR camera mounted on the same platform provides visible-light images for reference purposes (assisting object identification) in the TIR image mosaic.
Figure 4. Task subsystem.
Remotesensing 07 14259 g004

2.4. Communication subsystem

The communication subsystem is composed of radio links and video links. The radio links are in charge of transmitting the data and commands in regard to the position and route between the airship and the ground base station. The video links are responsible for checking the operating condition of both onboard cameras with the transmission of the real time images taken. The remote control distance is up to approximately 1.5 km, and both autopilot and video links have a top distance of approximately 30 km.

2.5. Ground Base Station

The ground base station consists of a microwave data radio, a GPS receiver, a radio transmitter, and a human-machine interface system (HMI). When the airship is working, the ground base station is responsible for receiving all diagnostic signals of the onboard sensors (e.g., the airship’s engine speed, altitude, position, accelerometers, angle of pitch, and pressure in the capsule) and sending commands to the airship. The HMI is a communication and visualization system between the operators and the airship. All flight data acquired onboard is displayed on the HMI, as shown in Figure 5. The HMI is also used to operate the airship.
Figure 5. The human-machine interface system (HMI) and the airship’s predefined (red lines) and practical (blue lines) cruising route.
Remotesensing 07 14259 g005

3. Experimental Method

The general strategy of monitoring the urban thermal environment with UALTIRSS consists of outdoor data acquisition, indoor image matching, mosaic, atmospheric correction, and LST retrieval.

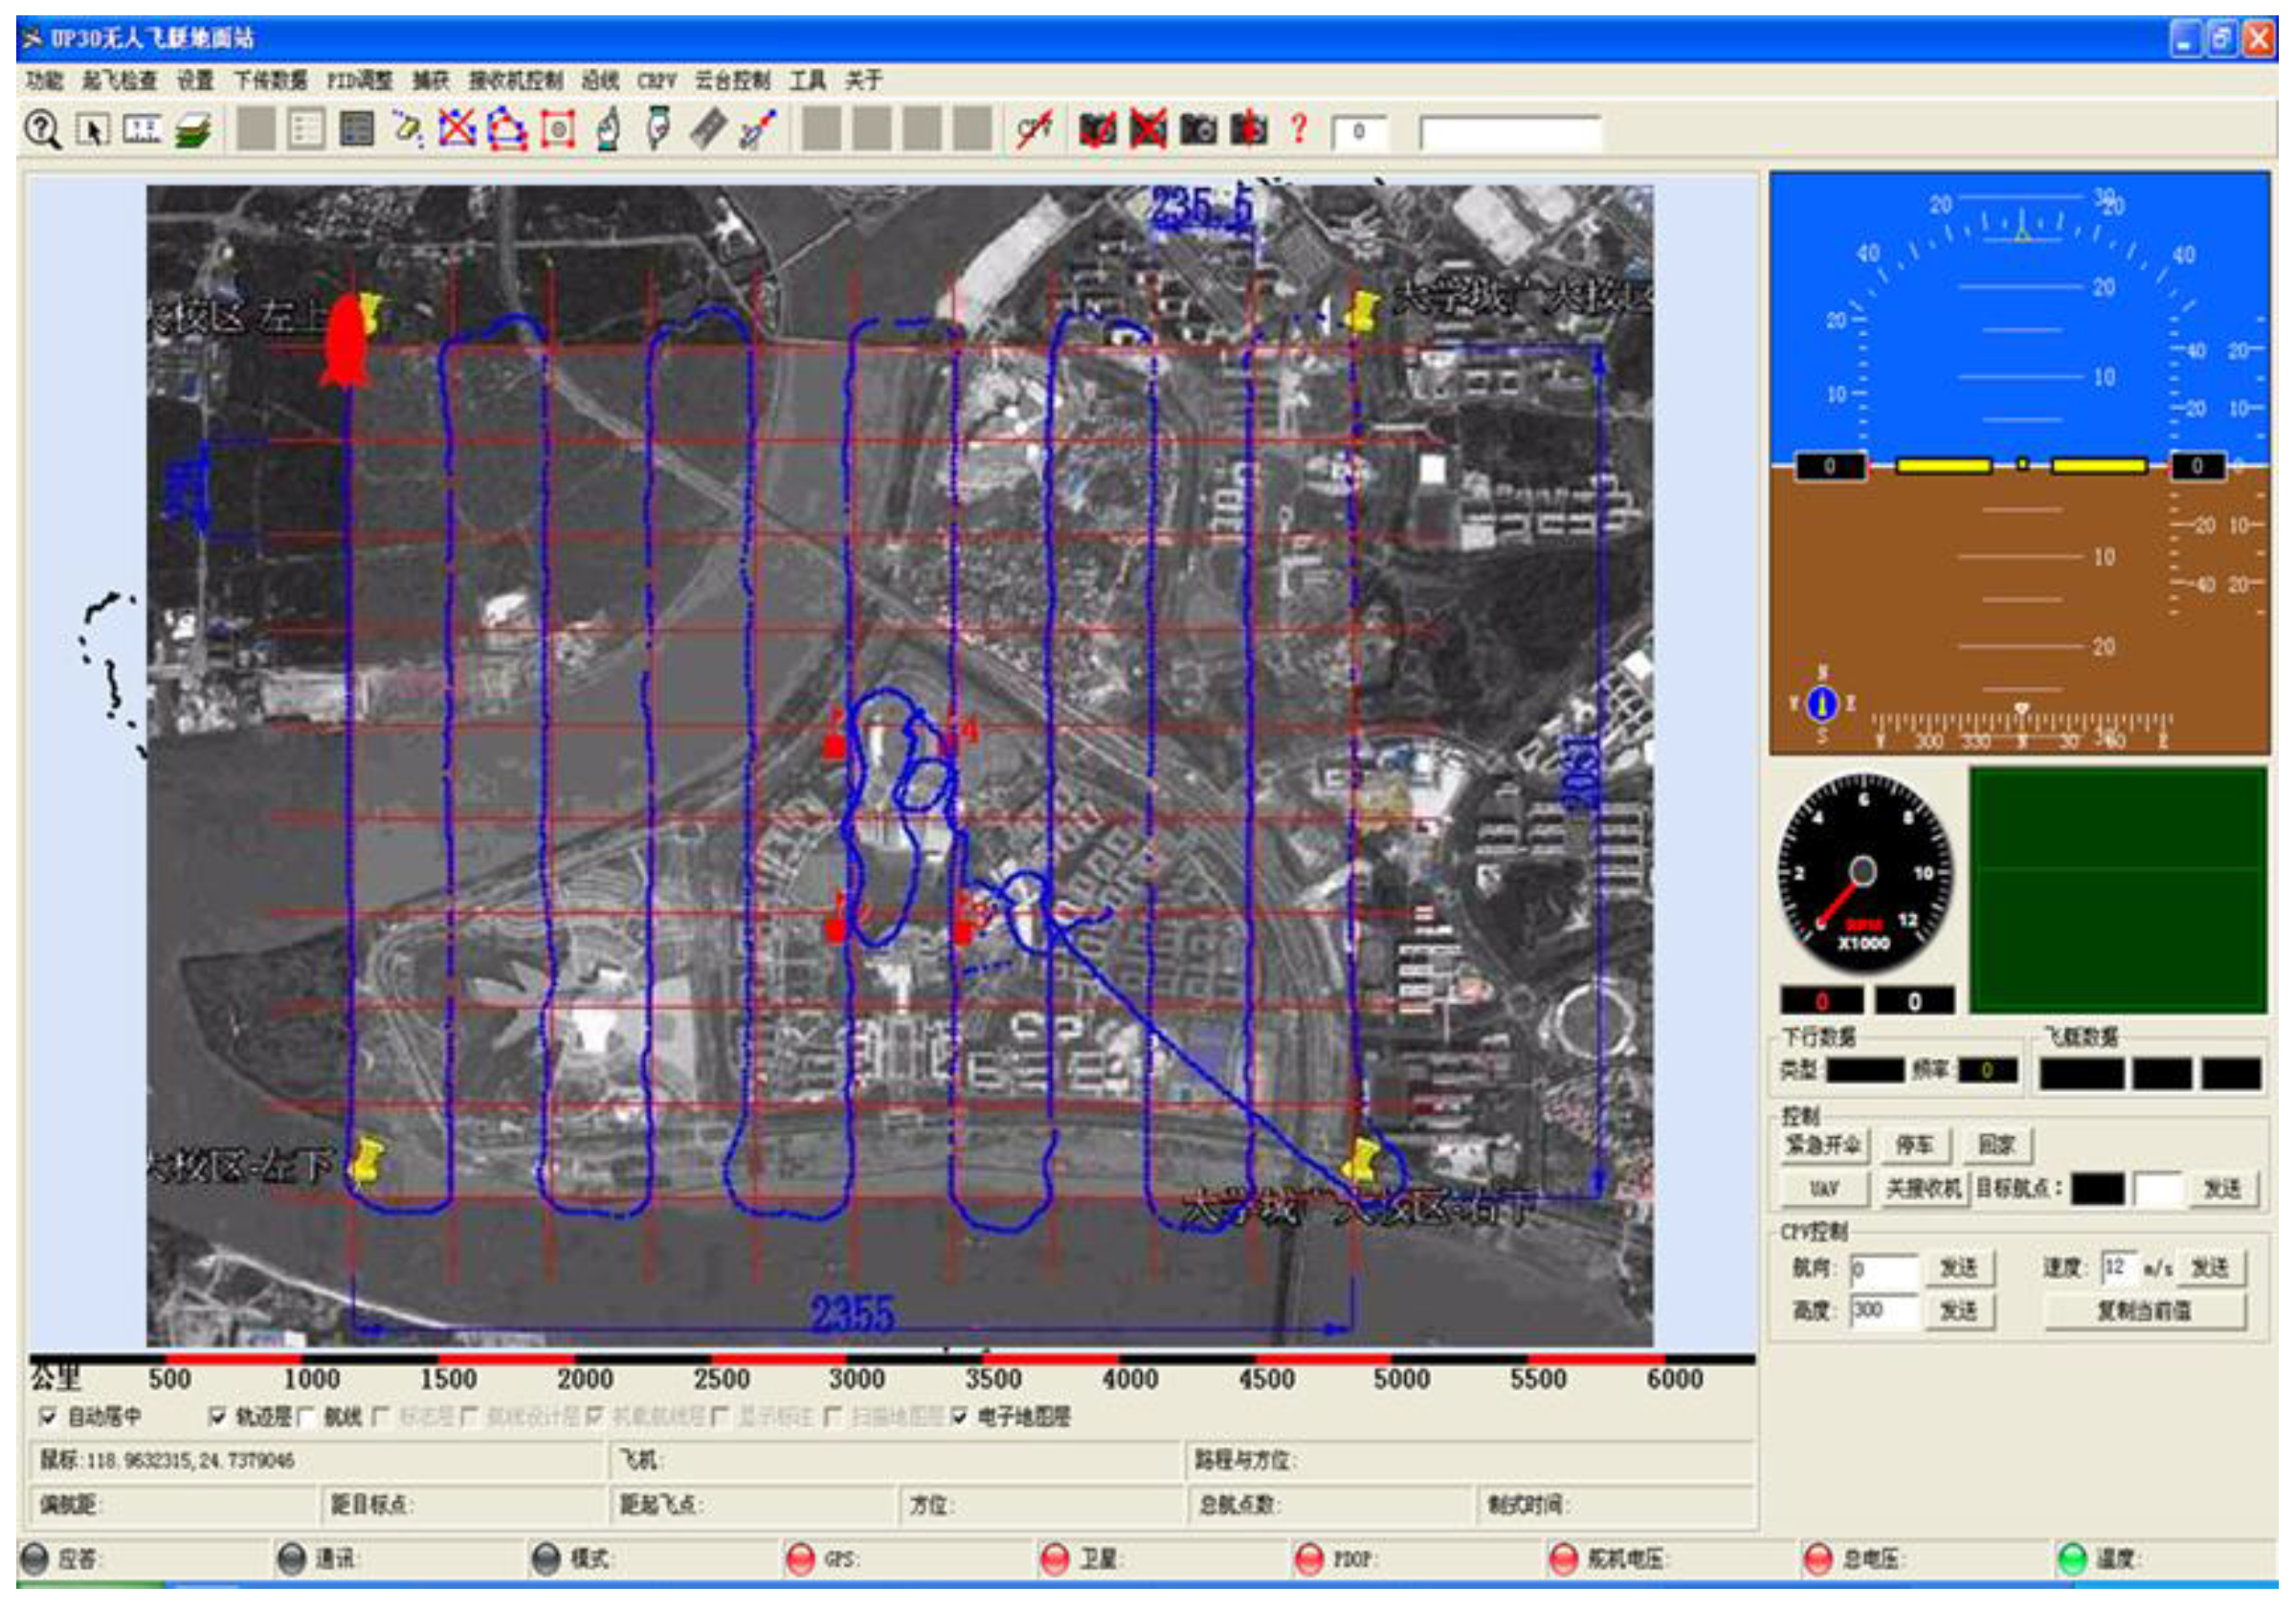
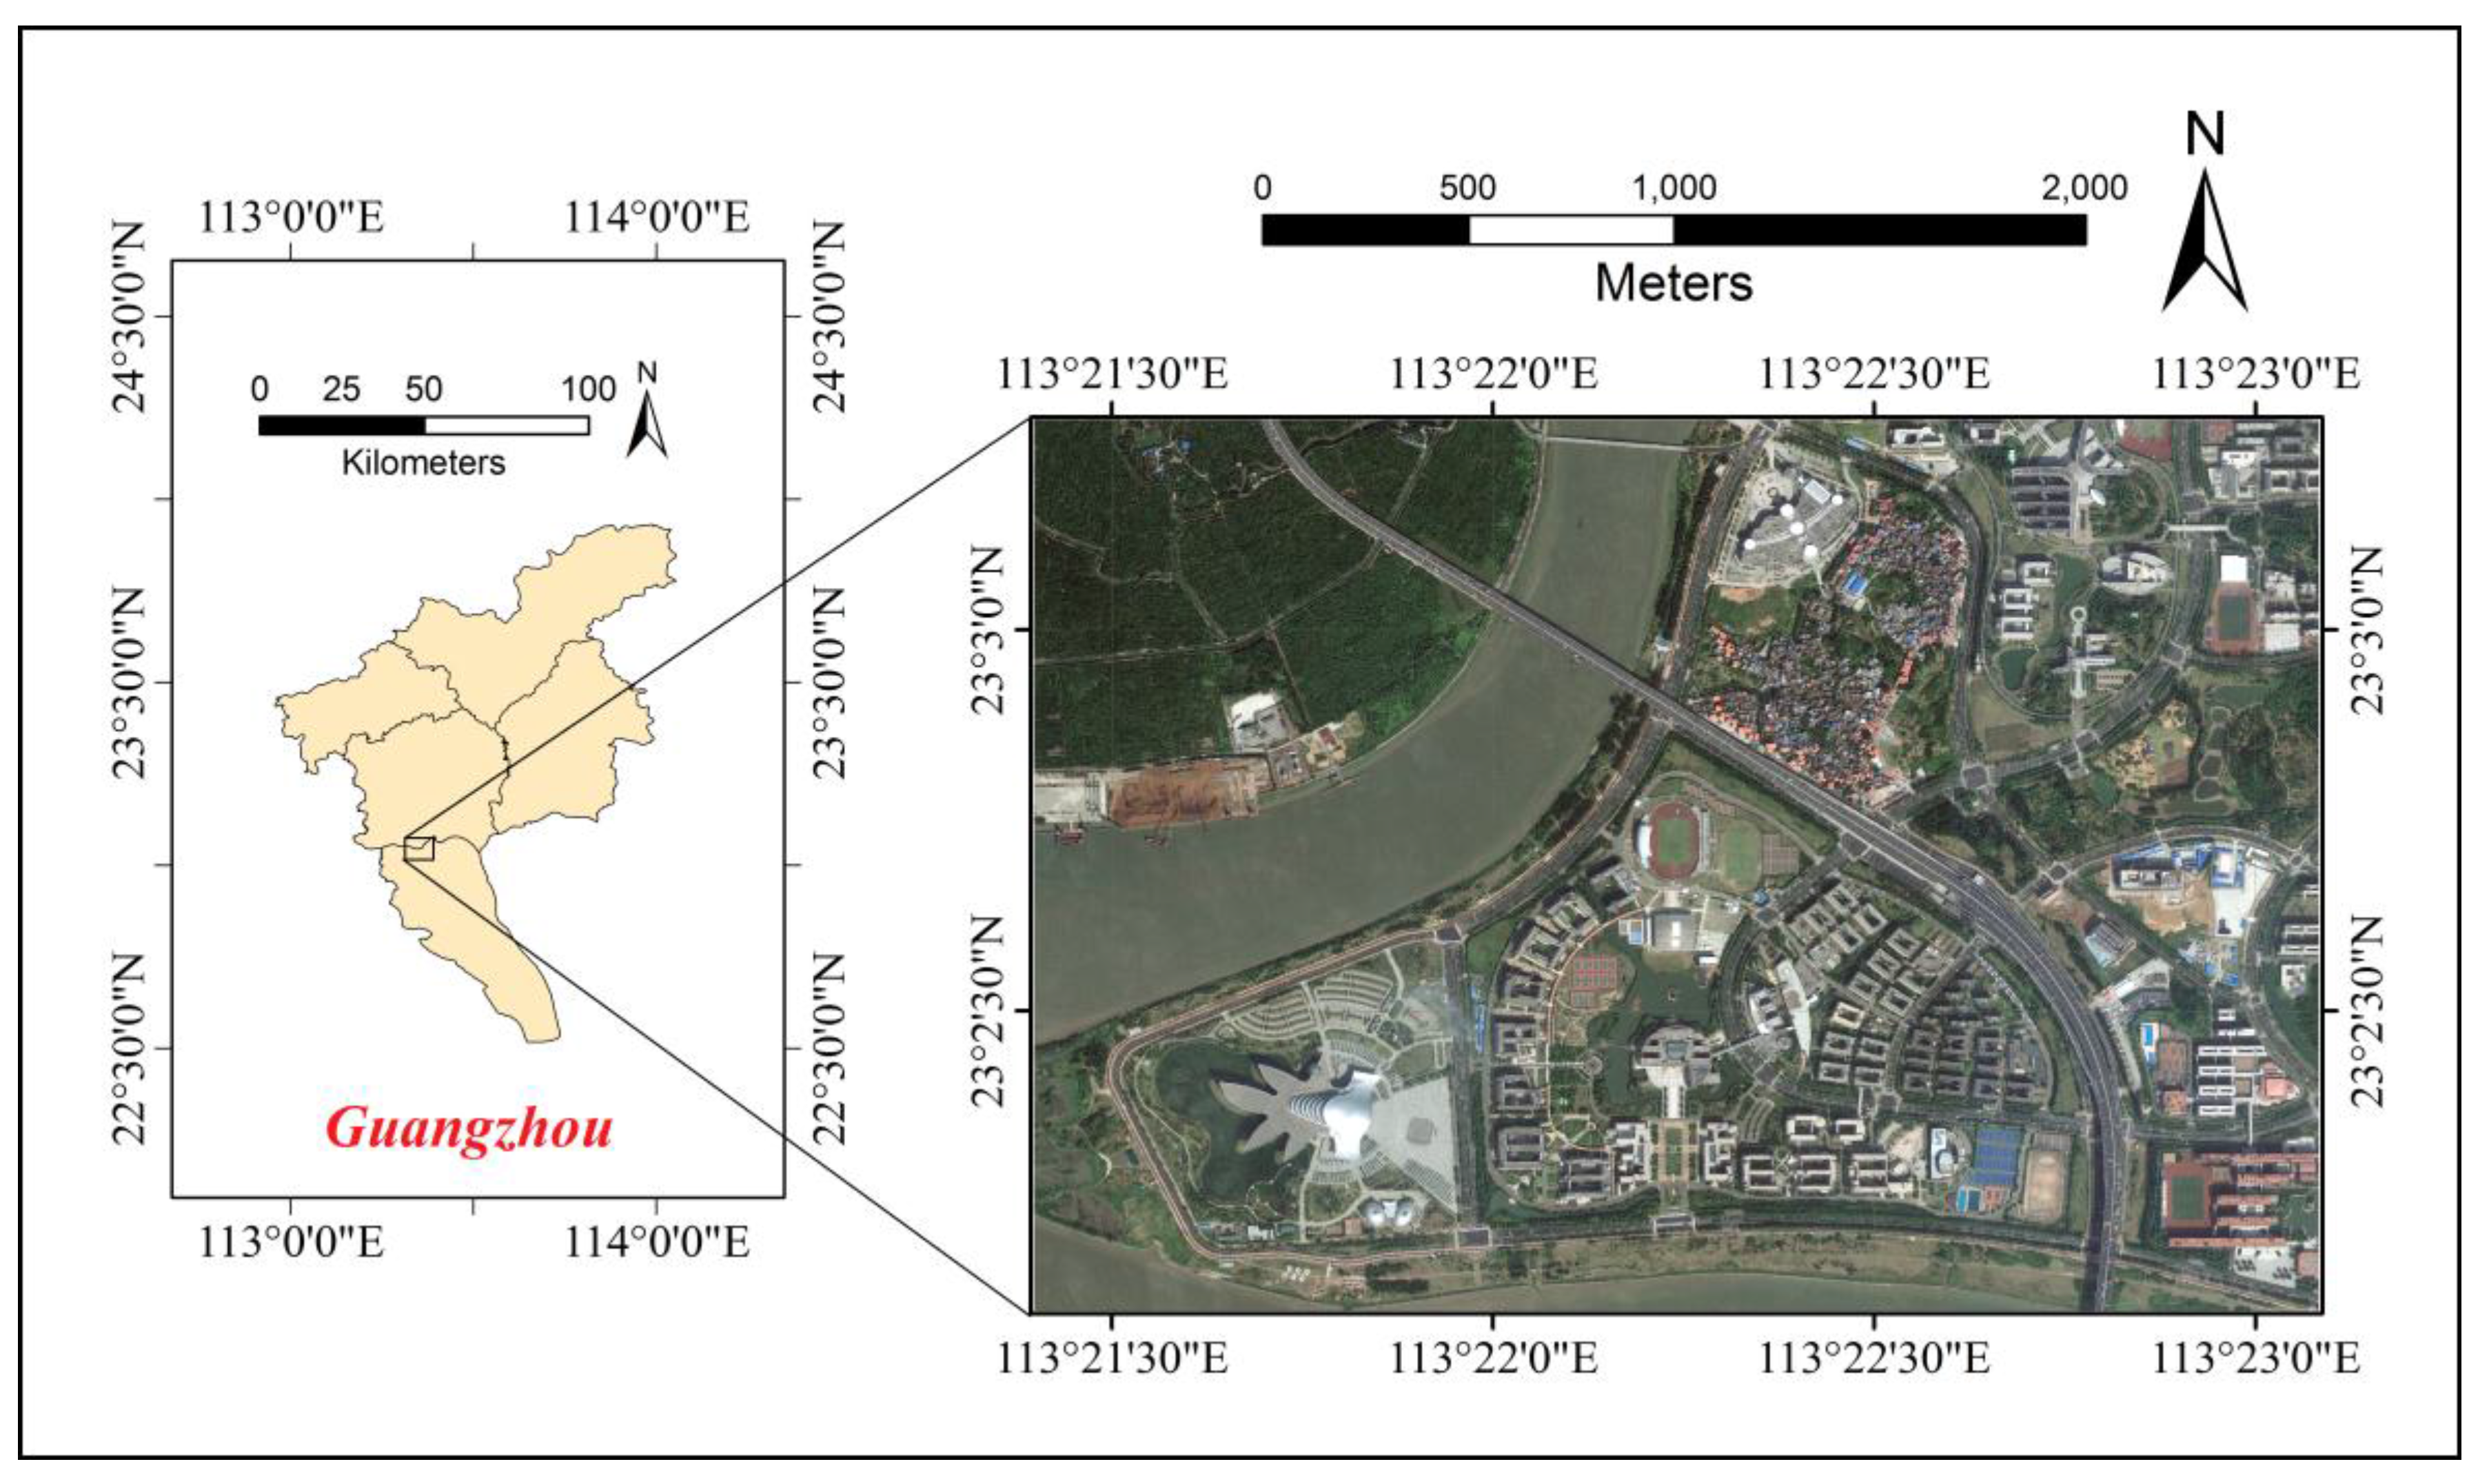
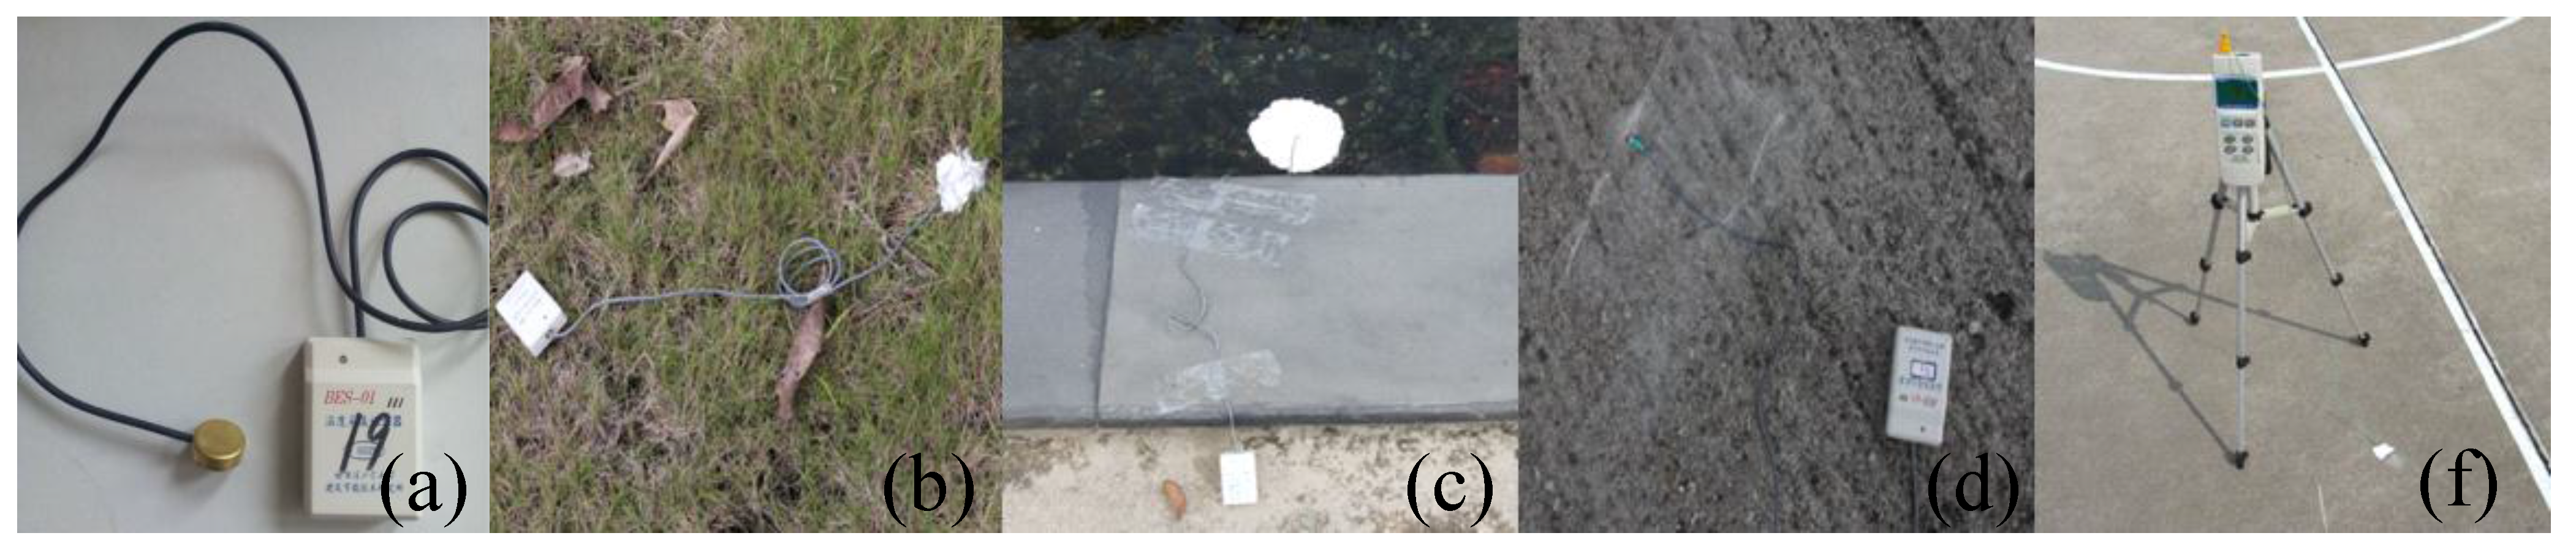
3.1. Outdoor Data Acquisition

Outdoor data acquisition includes the airborne observation and synchronous field measurement. Airborne observation for the TIR images is supposed to follow these principles: (1) no tall trees or constructions around the take-off venue; (2) relative flight height is no less than four times the terrain elevation difference; (3) the forward overlap and the side overlap are between 60%–65% and 30%–35%, respectively.
The airship observing campaign in this paper was conducted between 14:00–14:30 on 20 August 2012. The observation region, the Guangzhou university campus in Guangzhou Higher Education Mega Center, is located at 23°2′16″–23°3′23″N,113°21′8″–113°22′31″E, and covering an area of approximately 2355 × 2081 m2, as shown in Figure 6. The flight route was predefined according to local wind directions, the overlap rate between adjacent images, the camera view field, and the desired spatial resolution. In this experiment, the predefined forward overlap, side overlap, shooting interval (the time interval between two consecutive shootings), ground speed, and altitude were set to 65%, 56%, 10 s, 10 m/s, and 600 m, respectively, corresponding to within an 0.8 m spatial resolution of the images with 235 m distance between two strips. Figure 5 shows the practical cruising route in HMI. Caused by wind sensitivity characteristics, the maximum bias from the predefined flight strip was within ±10 m, and the maximum cruise height accuracy compared to the predefined flying height was better than ±3 m.
Figure 6. Study area: the Guangzhou university campus in Guangzhou Higher Education Mega Center, Guangzhou, China. The imagery is from Google Earth Map.
Remotesensing 07 14259 g006
To retrieve LST and verify its accuracy, the typical surface temperatures were measured synchronized with the airship observing campaign. In this field campaign, the contact temperature logger (BES-1) possessed a circular planar contact sensor with accuracy of 0.5 °C were used to measure the surface temperatures of lawns, water bodies, cement concrete pavements, and asphalt pavements every 10 seconds, as shown in Figure 7. Two temperature values for every underlying surface type were measured at two different places. For the accuracy of surface temperature data, some measures in different environment were advanced: a thin layer of thermal grease was applied to make contact and help heat transfer between the sensor and the cement concrete pavement or the asphalt pavement; sensors in water were fixed under polystyrene boards to prevent direct solar radiation; sensors placed in lawns were packed up with tinfoil and kept ventilation inside tinfoil rolls. For each sample point, an average value of five minutes around the overpass time was calculated to represent the true temperature. And the coordinate of every measuring site was recorded to locate the position in the TIR map for evaluating retrieval accuracy.
Figure 7. Synchronous field temperature measurement: (a) BES-1; (b) lawns; (c) water bodies; (d) asphalt pavements; and (f) concrete pavements.
Remotesensing 07 14259 g007

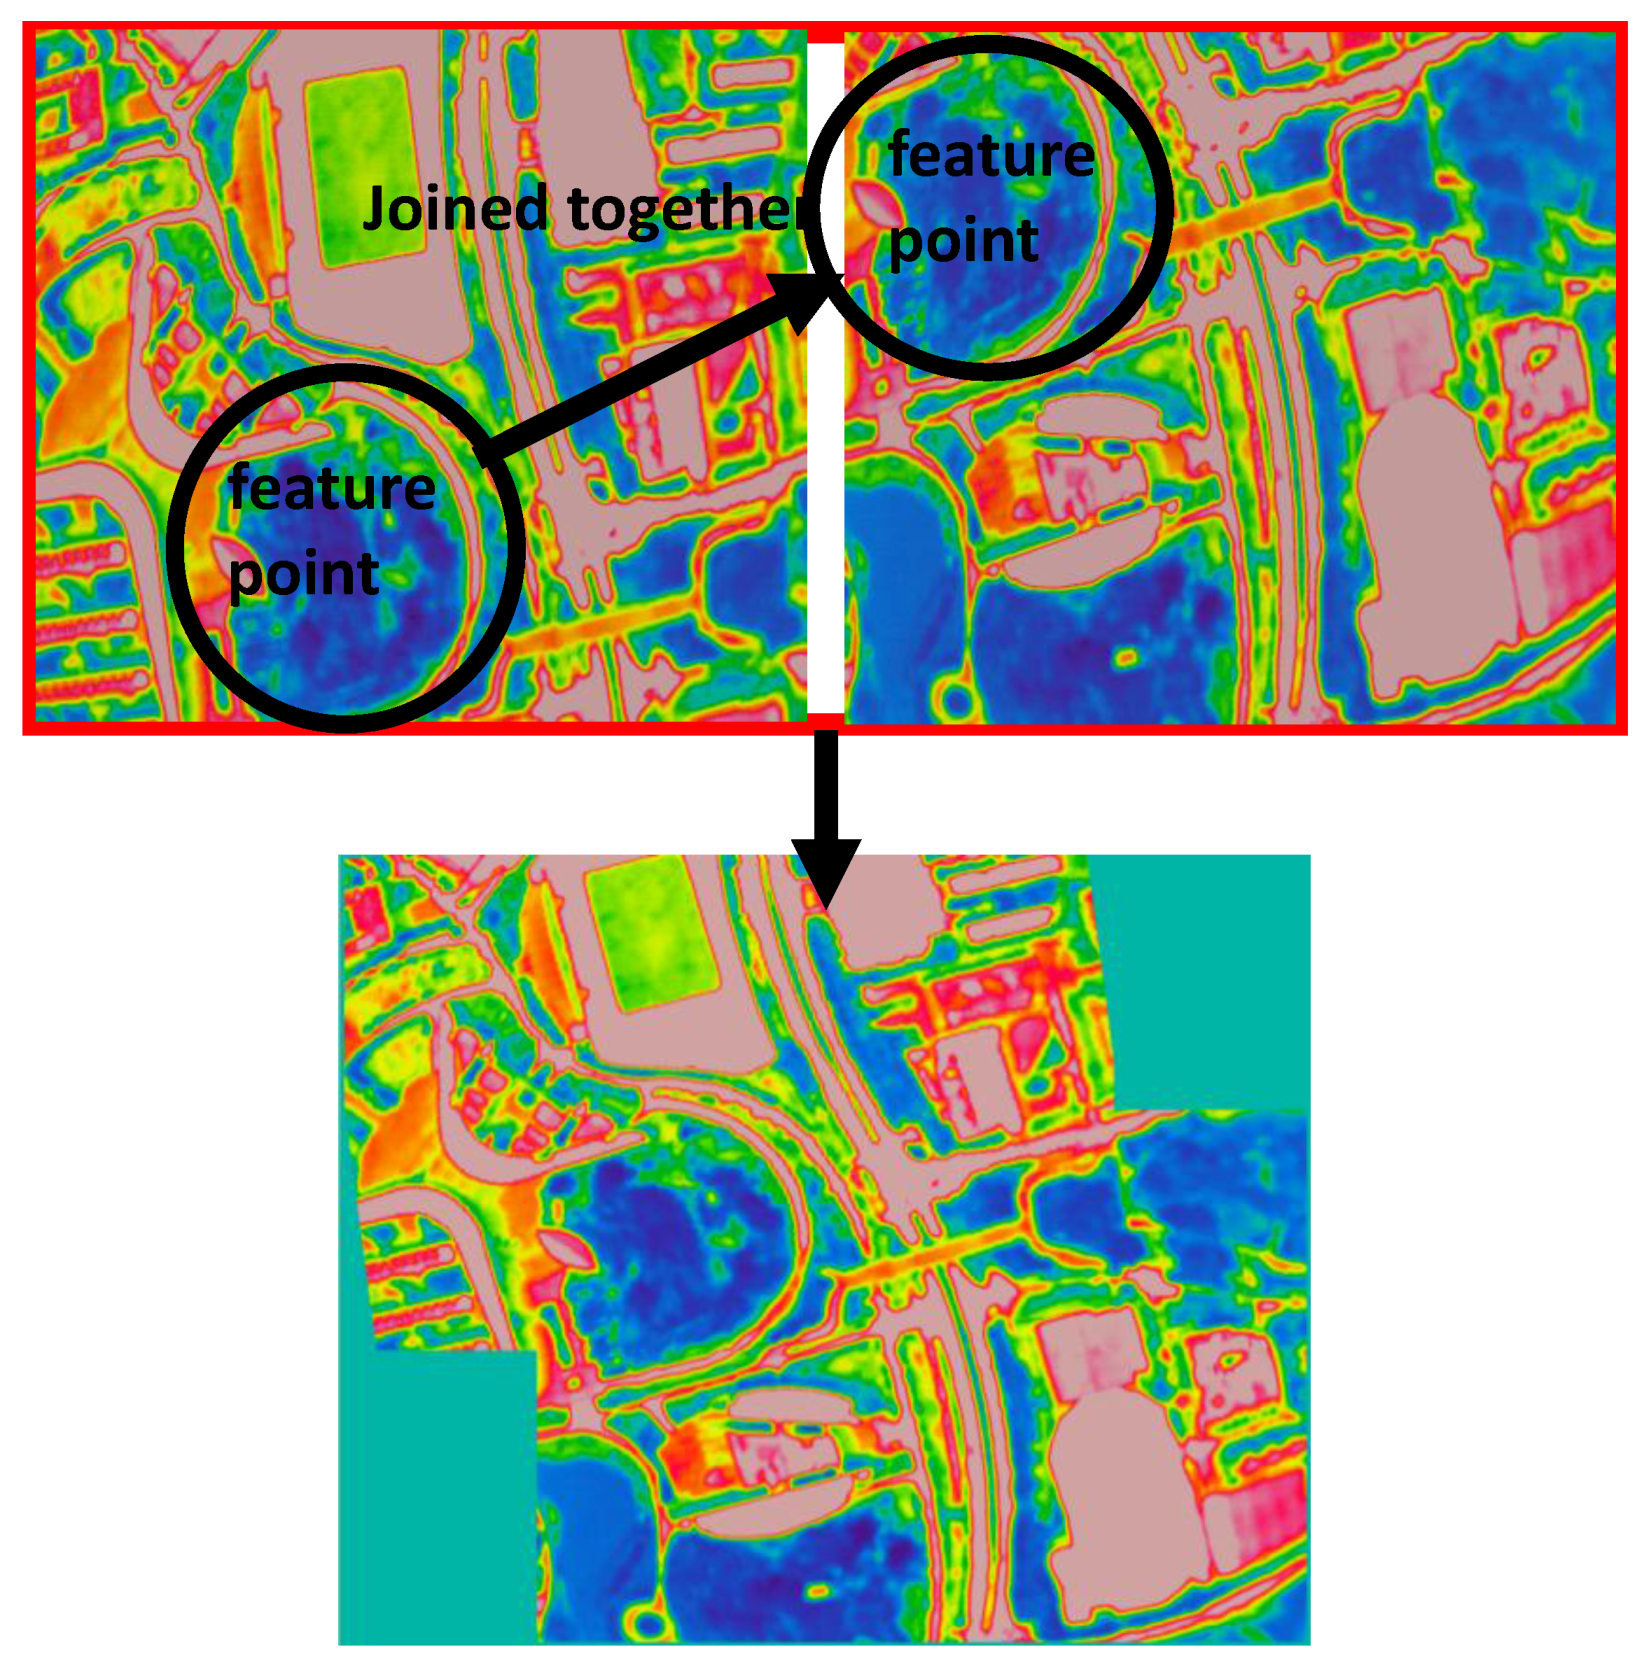
3.2. Image Matching and Mosaic

After outdoor data acquisition, hundreds of individual TIR images were obtained. The “Image Processor Pro II” with functions of rotation, correction, and mosaic, a specially developed software for TH9260, was used to stitch them into one large image. First, a reference image with one or two feature points were determined as the beginning. Then, two adjacent images were stitched together with reference to the feature points, as shown in Figure 8. Finally, all images were spliced into a mosaic representing brightness temperature (BT). Sometimes, image orientations had to be adjusted referring to the last adjacent image and cut into distorted margins in the matching process. Due to the pitch and roll angle variations of the cruising airship, the stabilizing platform of UALTIRSS cannot possibly have completely accurate posturing (keep shooting exactly vertical to the ground at any time), which may cause the shooting orientations to differ among adjacent images. In addition, distortion occurs on every image margin due to the optical properties of the TIR wide lens influencing the image’s quality, and must be removed.
Figure 8. Adjacent images matching process.
Remotesensing 07 14259 g008

3.3. LST Retrieval

In our study, the retrieval algorithm of LST was accomplished by two steps: atmospheric correction and emissivity correction.
Atmospheric correction transforms the radiance acquired by the TIR imaging camera onto ground-leaving radiance. The “Image Processor Pro II” software offered two methods of ambient compensation based on the calculated value of “MODTRAN” for the temperature data from TH9260. One method is inputting the atmospheric temperature, the relative humidity, and the observation distance to calculate the surface temperature directly; the other is by setting the atmospheric temperature and the transmittance. The first method was not suitable for our study, so the transmittance method was chosen in this study.
Assuming the land surface was Lambertian, the MODTRAN4 software was used to calculate the atmospheric transmittance. In this paper, model atmosphere was selected as tropical [27]; the atmospheric path was the slant path between two altitudes. The aerosol model was set to Urban Extinction; default VIS = 5 km; seasonal aerosol profile was set to Spring–Summer; the weather was fine, and no cloud or rain. The range of wavelengths was from 8 μm to 13 μm, and the wavelength space was set to 0.1 μm. The atmospheric temperature at the first boundary was based on the observed average value simultaneously at the near-surface. Assuming the spectral response functions on one broad spectral band of TH9260 according with a normal distribution, the average atmospheric transmittance between 8 μm and 13 μm was 0.78.
Emissivity is not only controlled by the types of surfaces but is also linked to such factors as the water content, chemical composition, structure, and roughness. Hence, there was a convenient way that all surfaces in the study area were classified into several elementary types supposed to have the same emissivity. Based on our field campaign, four elementary types (water bodies, lawns, asphalt pavement, and concrete pavements) were chosen.
In the absence of in situ measurement of the surface emissivity, the reference values in other sources were used to retrieve LST. Due to the significant variation in published values of surface emissivity for vegetated and man-made surfaces in other references and with no mixed pixels existing in our study, some of data from the emissivity database released by MODIS UCSB Emissivity Library was used [28,29]. Mean values of emissivity for water bodies, lawns, asphalt pavements, and concrete pavements, respectively, were set to 0.99, 0.97, 0.95, and 0.92. After classifying and extracting every surface type manually, LST was retrieved by inputting corresponding emissivity, atmospheric temperature, and transmission in “Image Processor Pro II” software. The parameter settings are shown in Table 1. Figure 9 shows the retrieved LST map with a high enough resolution to identify the main objects.
Table 1. Accuracy and deviation of the retrieved LSTs and ground surface temperatures.
Surface TypesAmbient T (°C)TransmissionEmissivityTrue T (°C)Retrieved T (°C)Deviation (°C)
Water body 1 0.9935.7837.71.92
Water body 2 0.9933.132.8−0.3
Lawn 1 0.9739.6840.00.32
Lawn 2 0.9734.835.70.9
Asphalt pavement 1 360.780.9557.4158.91.49
Asphalt pavement 2 0.956668.12.1
Concrete pavement 1 0.9255.4257.31.88
Concrete pavement 2 0.9248.151.73.6
Mean of T deviation 1.56
RMSE 2.63
Figure 9. LST distribution in Guangzhou university campus.
Remotesensing 07 14259 g009

4. Results and Discussion

4.1. Analysis of LST Retrieval Accuracy

An evaluation of retrieval accuracy on this map is important for practical applications. In this paper, the eight field data was used to analyze the retrieval accuracy. The root mean square error (RMSE) and temperature biases (ΔT) were selected as indicators of accuracy. From Table 1, it can be seen that ΔT varies from 0.3 °C to 3.6 °C,and the mean of absolute deviation and RMSE between ground-based observations of LST and corresponding retrieved temperatures is 1.56 °C and 2.63 °C, respectively. Water bodies and lawns have higher temperature accuracy than asphalt pavements and concrete pavements. This is because water bodies and lawns have relative stable emissivity and their temperature ranges are similar with ambient temperature. The temperature deviations of concrete pavements are 1.88 °C and 3.6 °C mainly due to similar tiles and concrete material were set to the same emissivity in this study. Actually, the broad emissivity of some bricks or tiles made by concrete varied from 0.85 to 0.96 in the database published by the MODIS UCSB Emissivity Library. As shown in Figure 10, the correlation between the retrieved surface temperatures and ground true temperatures is positive with the coefficients of determination (R2) greater than 0.99. This suggests that the retrieval method is feasible for the imagery within 0.8 m resolution.
Figure 10. Correlation between retrieved LSTs and ground true temperatures.
Remotesensing 07 14259 g010

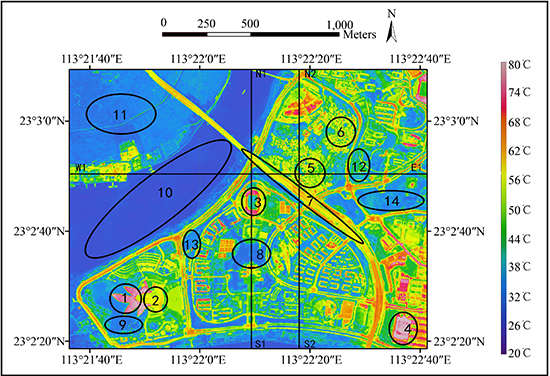
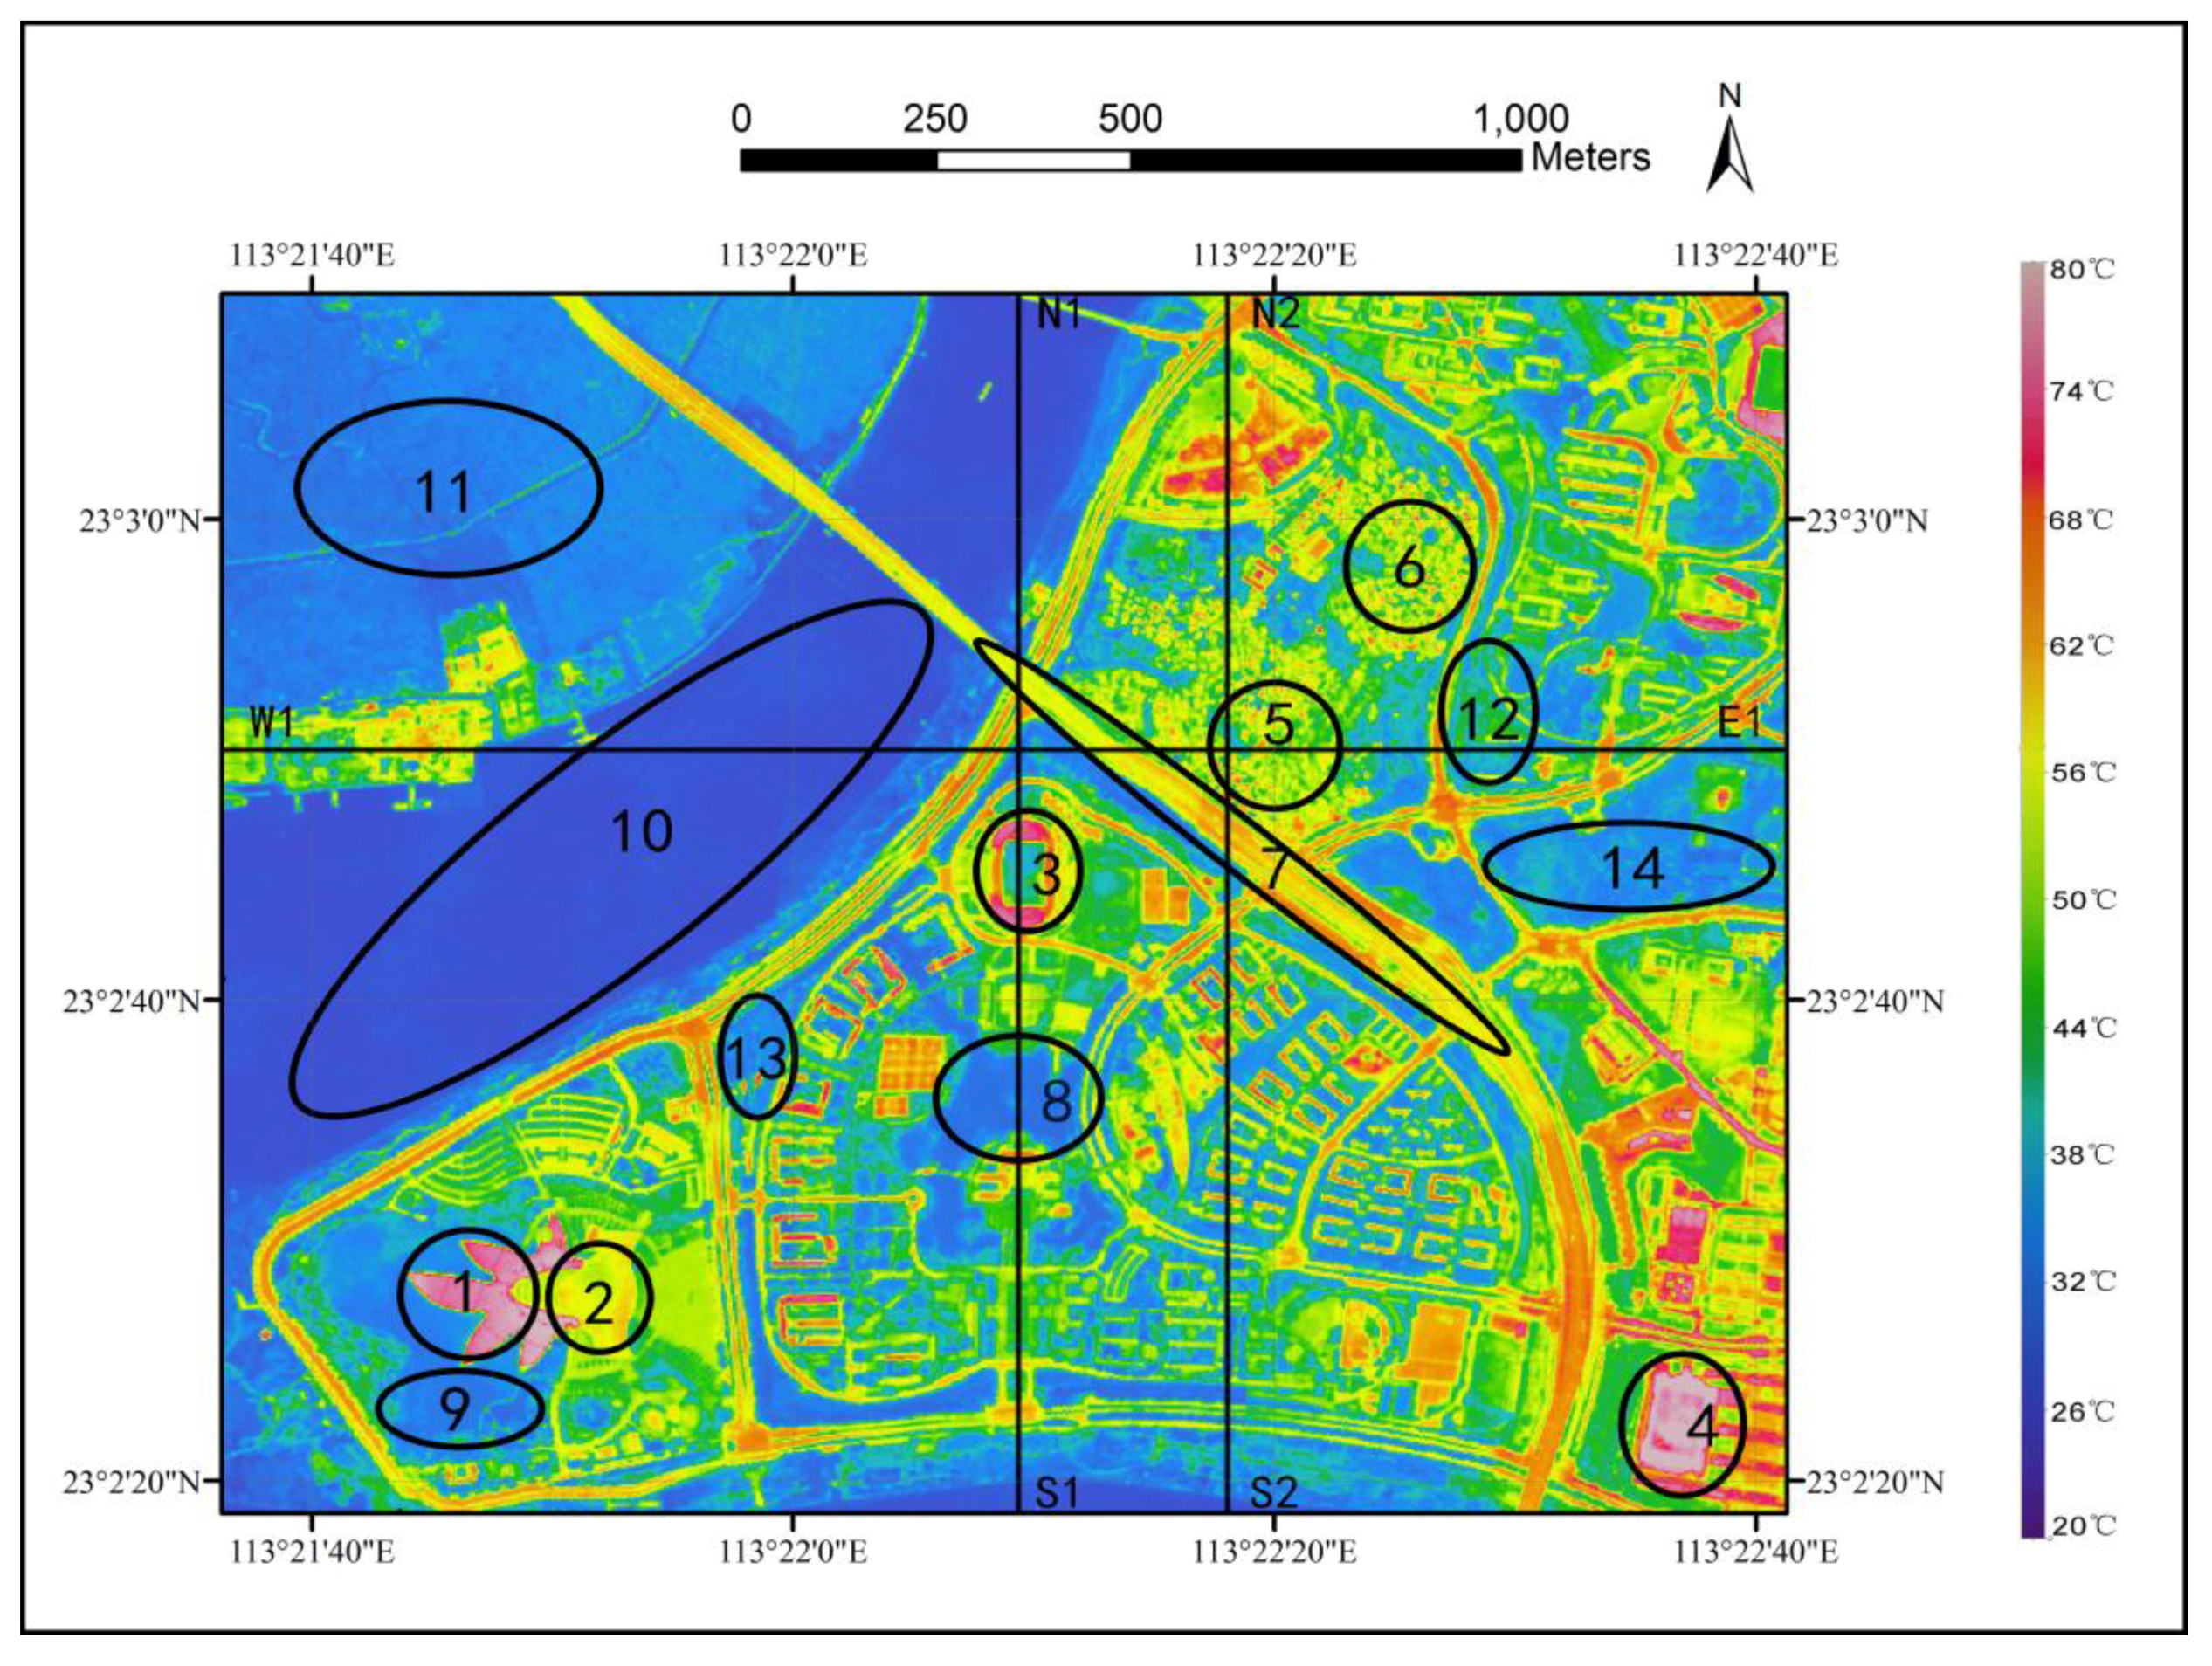
4.2. Analysis of LST Distribution

There were seven temperature areas (the Nos. 1–7 sites) circled in Figure 9. The No.1 site was part of the roof of the Guangdong Science Center, a large public building. Its dark color and weak thermal inertia caused the surface temperature to be over 80 °C in strong solar radiation for a long period, while the average value of another roof type (No. 2) made of silvery metal on the same building was just 55.8 °C, mainly due to the higher reflectivity at the same solar radiation conditions. The surface temperatures of plastic tracks were high at both football grounds (Nos. 3 and 4), while there was a significant temperature difference between their central natural lawns and artificial lawns, indicating their different evaporative cooling effects. In the residential area (Nos. 5 and 6), high construction density, low greening rate, large man-made heat, poor ventilation, and a dark roof led to the average LST to reach up to 59.5 °C, and the surface temperature of roofs exposed in the sun was higher than those impervious surfaces in alleys. Similar to rooftops, the average LST of asphalt pavement, the most used road surface property in the Guangzhou university campus, was higher than 58.9 °C (No. 7) owing to the lack of effective shading and absorbing incoming solar radiation through its black impervious surface.
At the same time, there were several low LST regions in the map, such as lakes (Nos. 8 and 9), the Zhujiang River (No. 10), farmland (No. 11), lawns (Nos. 12 and 13), and woods (No. 14). How much to improve the urban thermal environment depended on their thermal inertia, area, evaporative cooling power per unit area, and even their region shapes. LSTs of the water body were lower than that of the vegetation, which was primarily because of the water’s high thermal inertia. The Zhujiang River (28.4 °C) registered a much lower temperature than both lakes (32.9 °C, 34.8 °C).

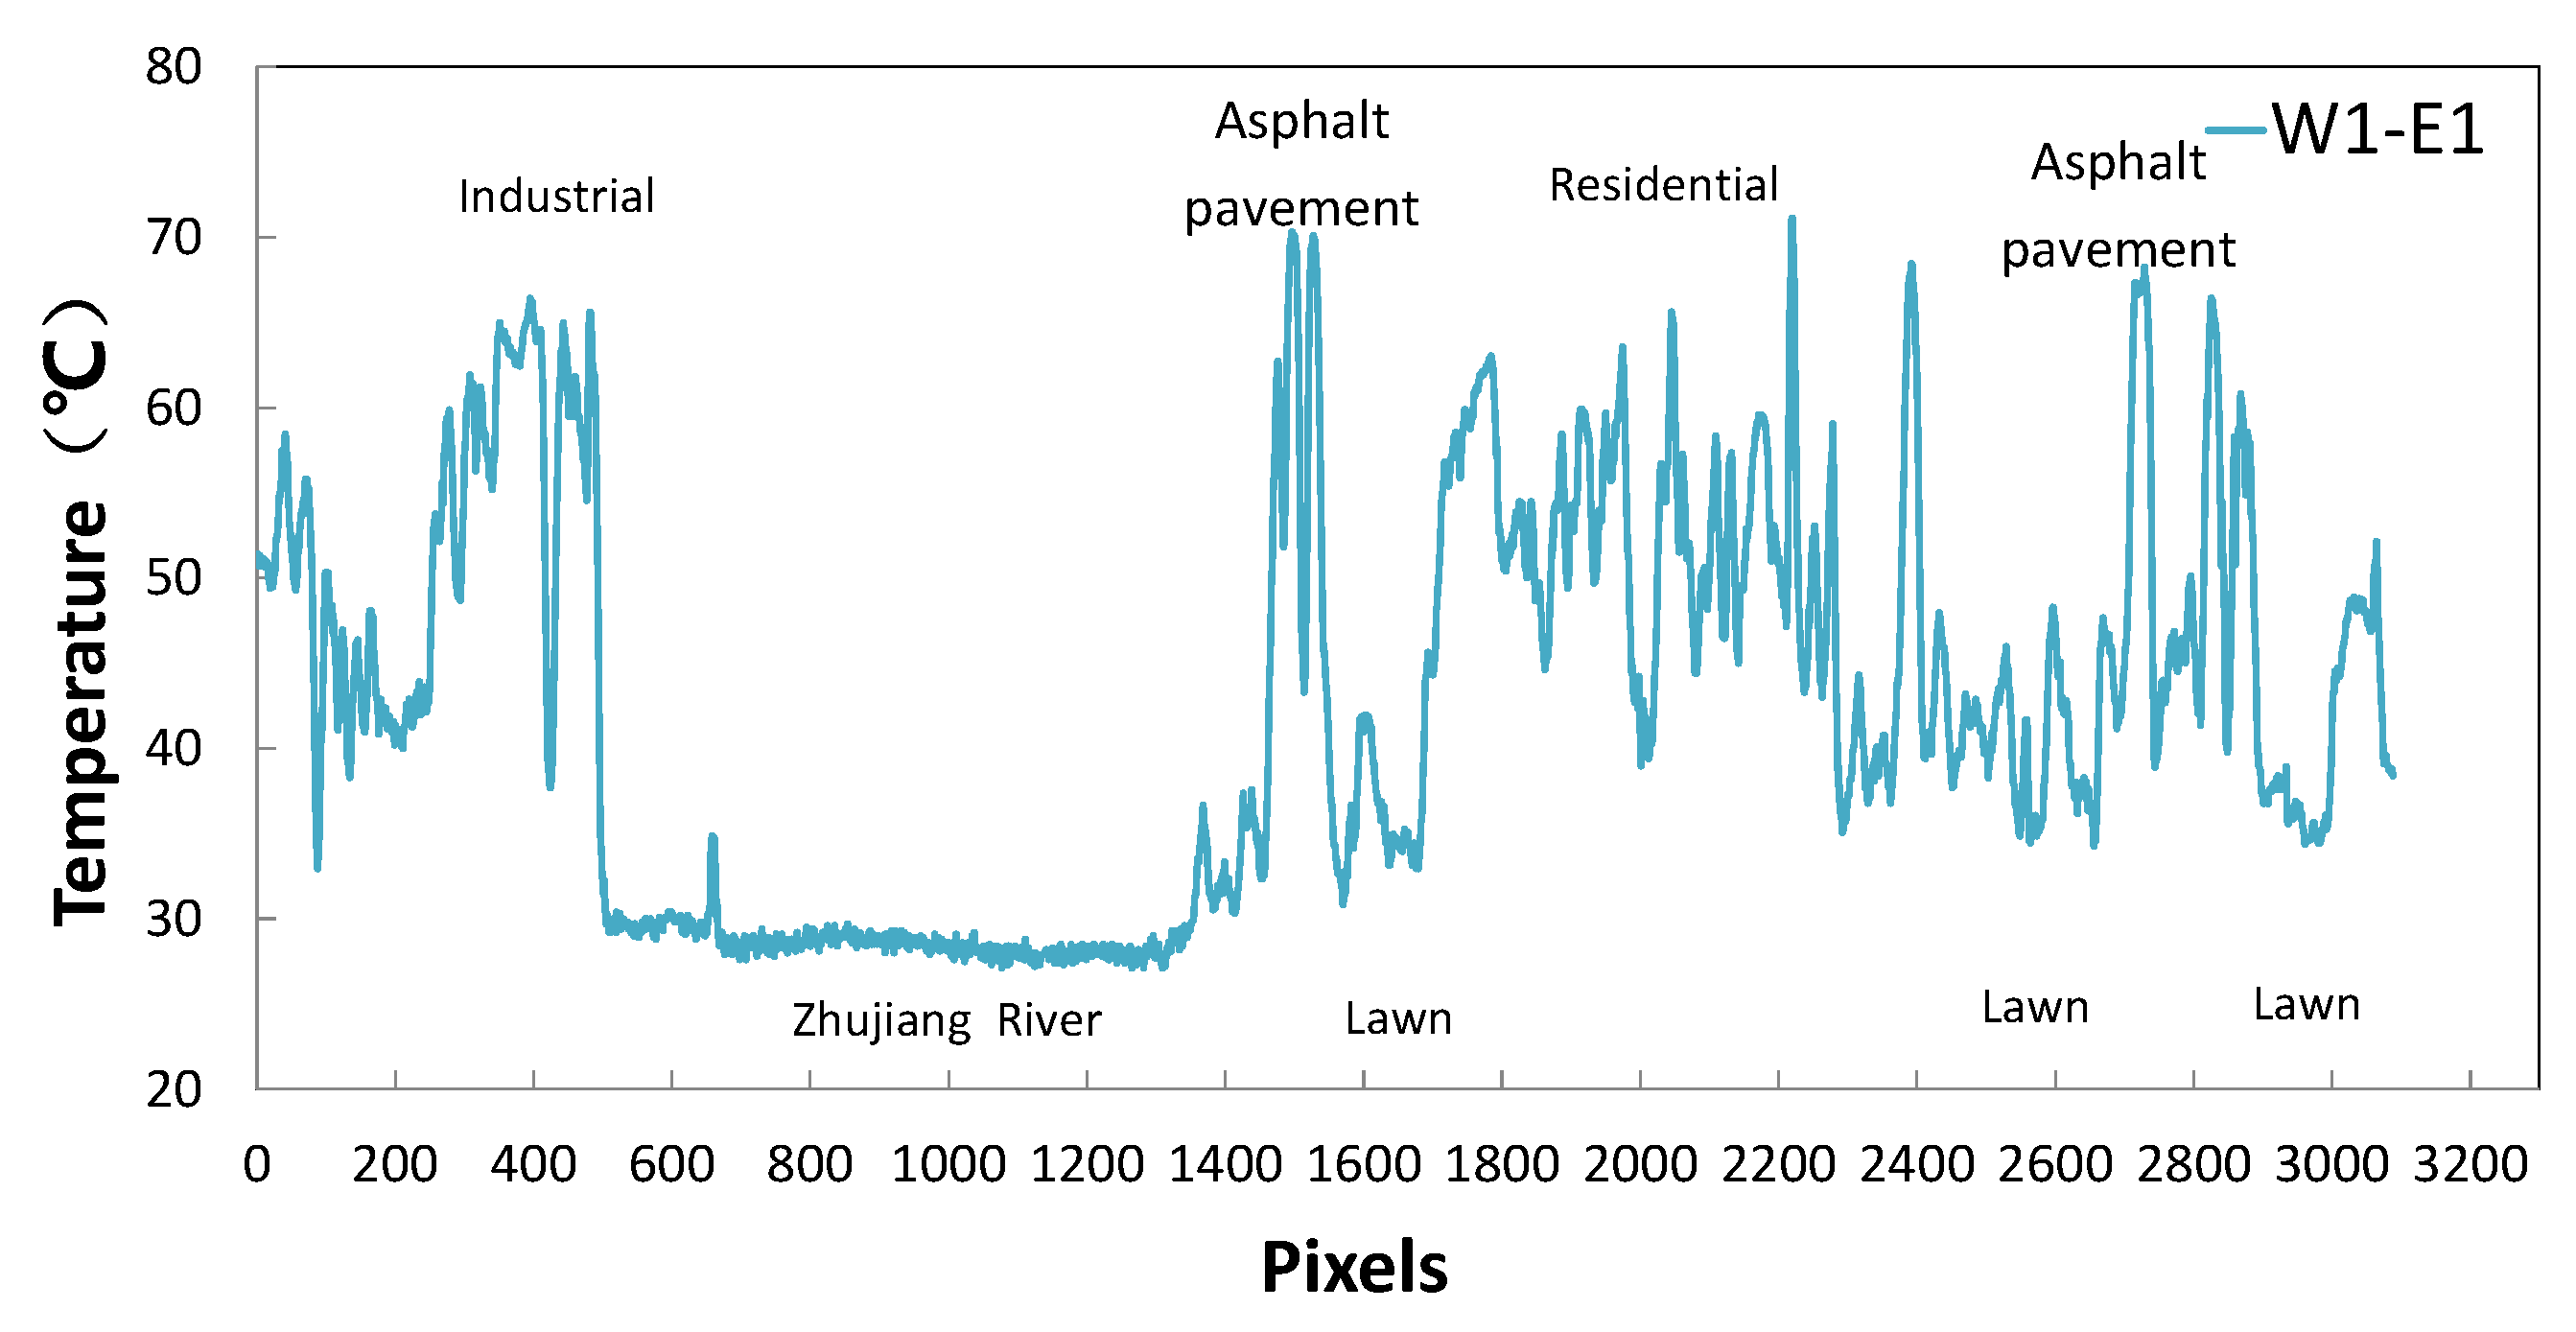
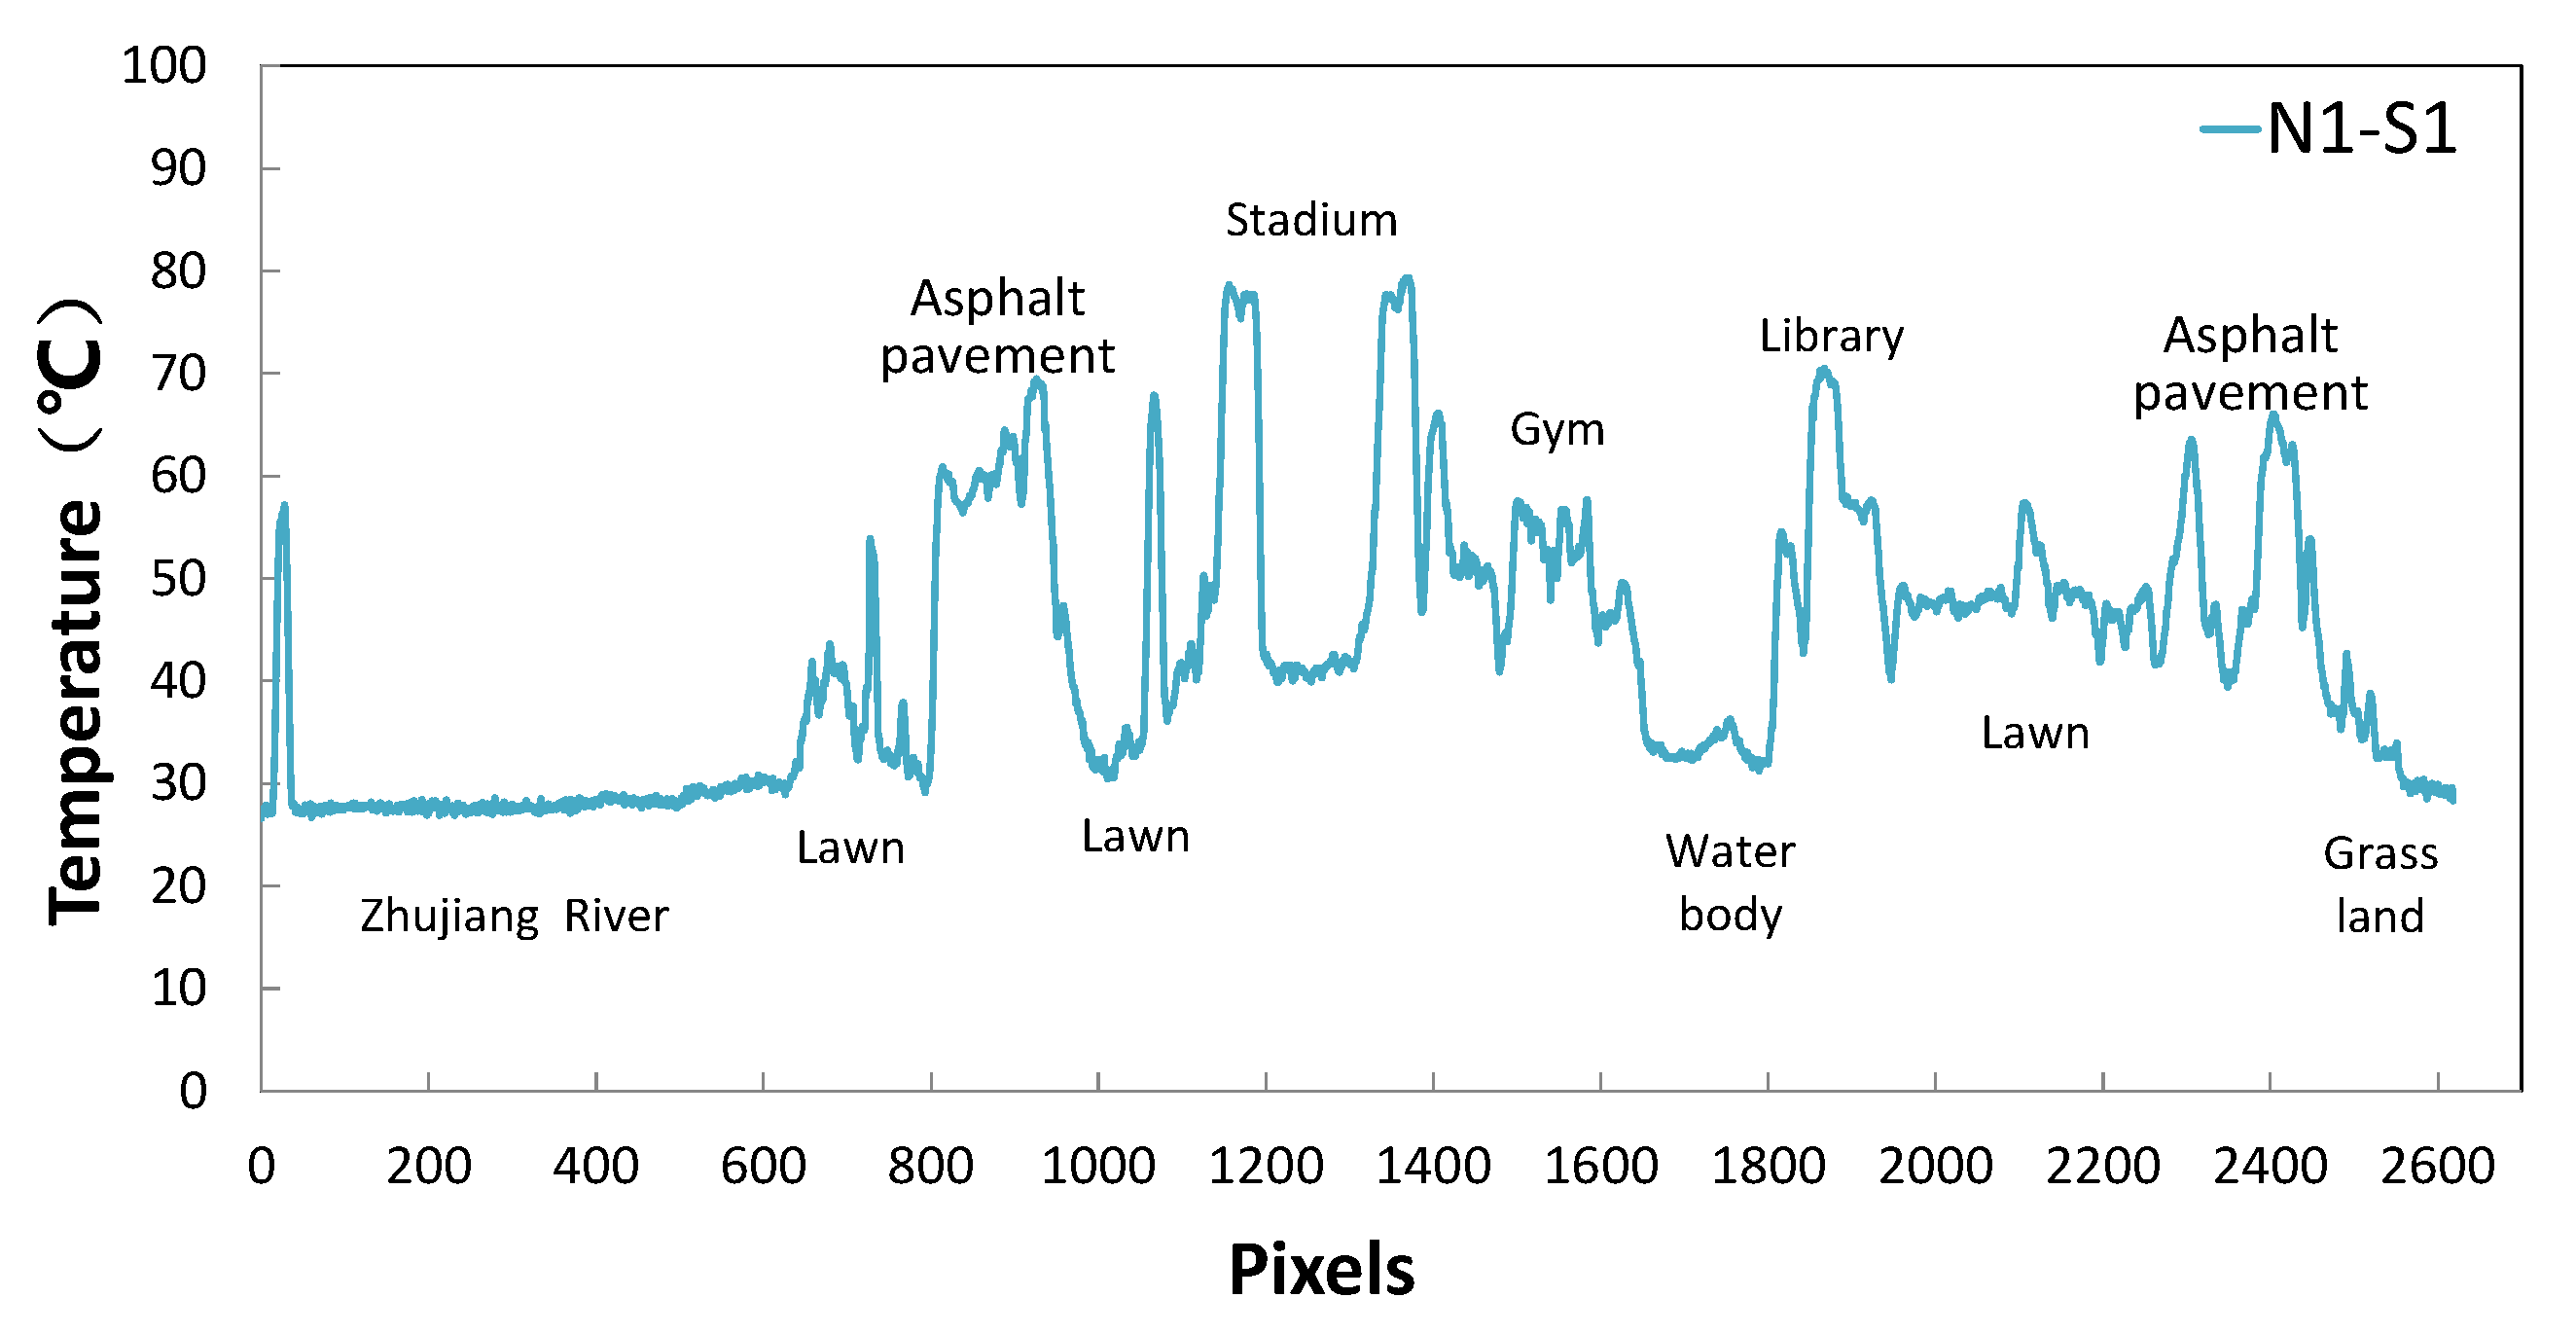
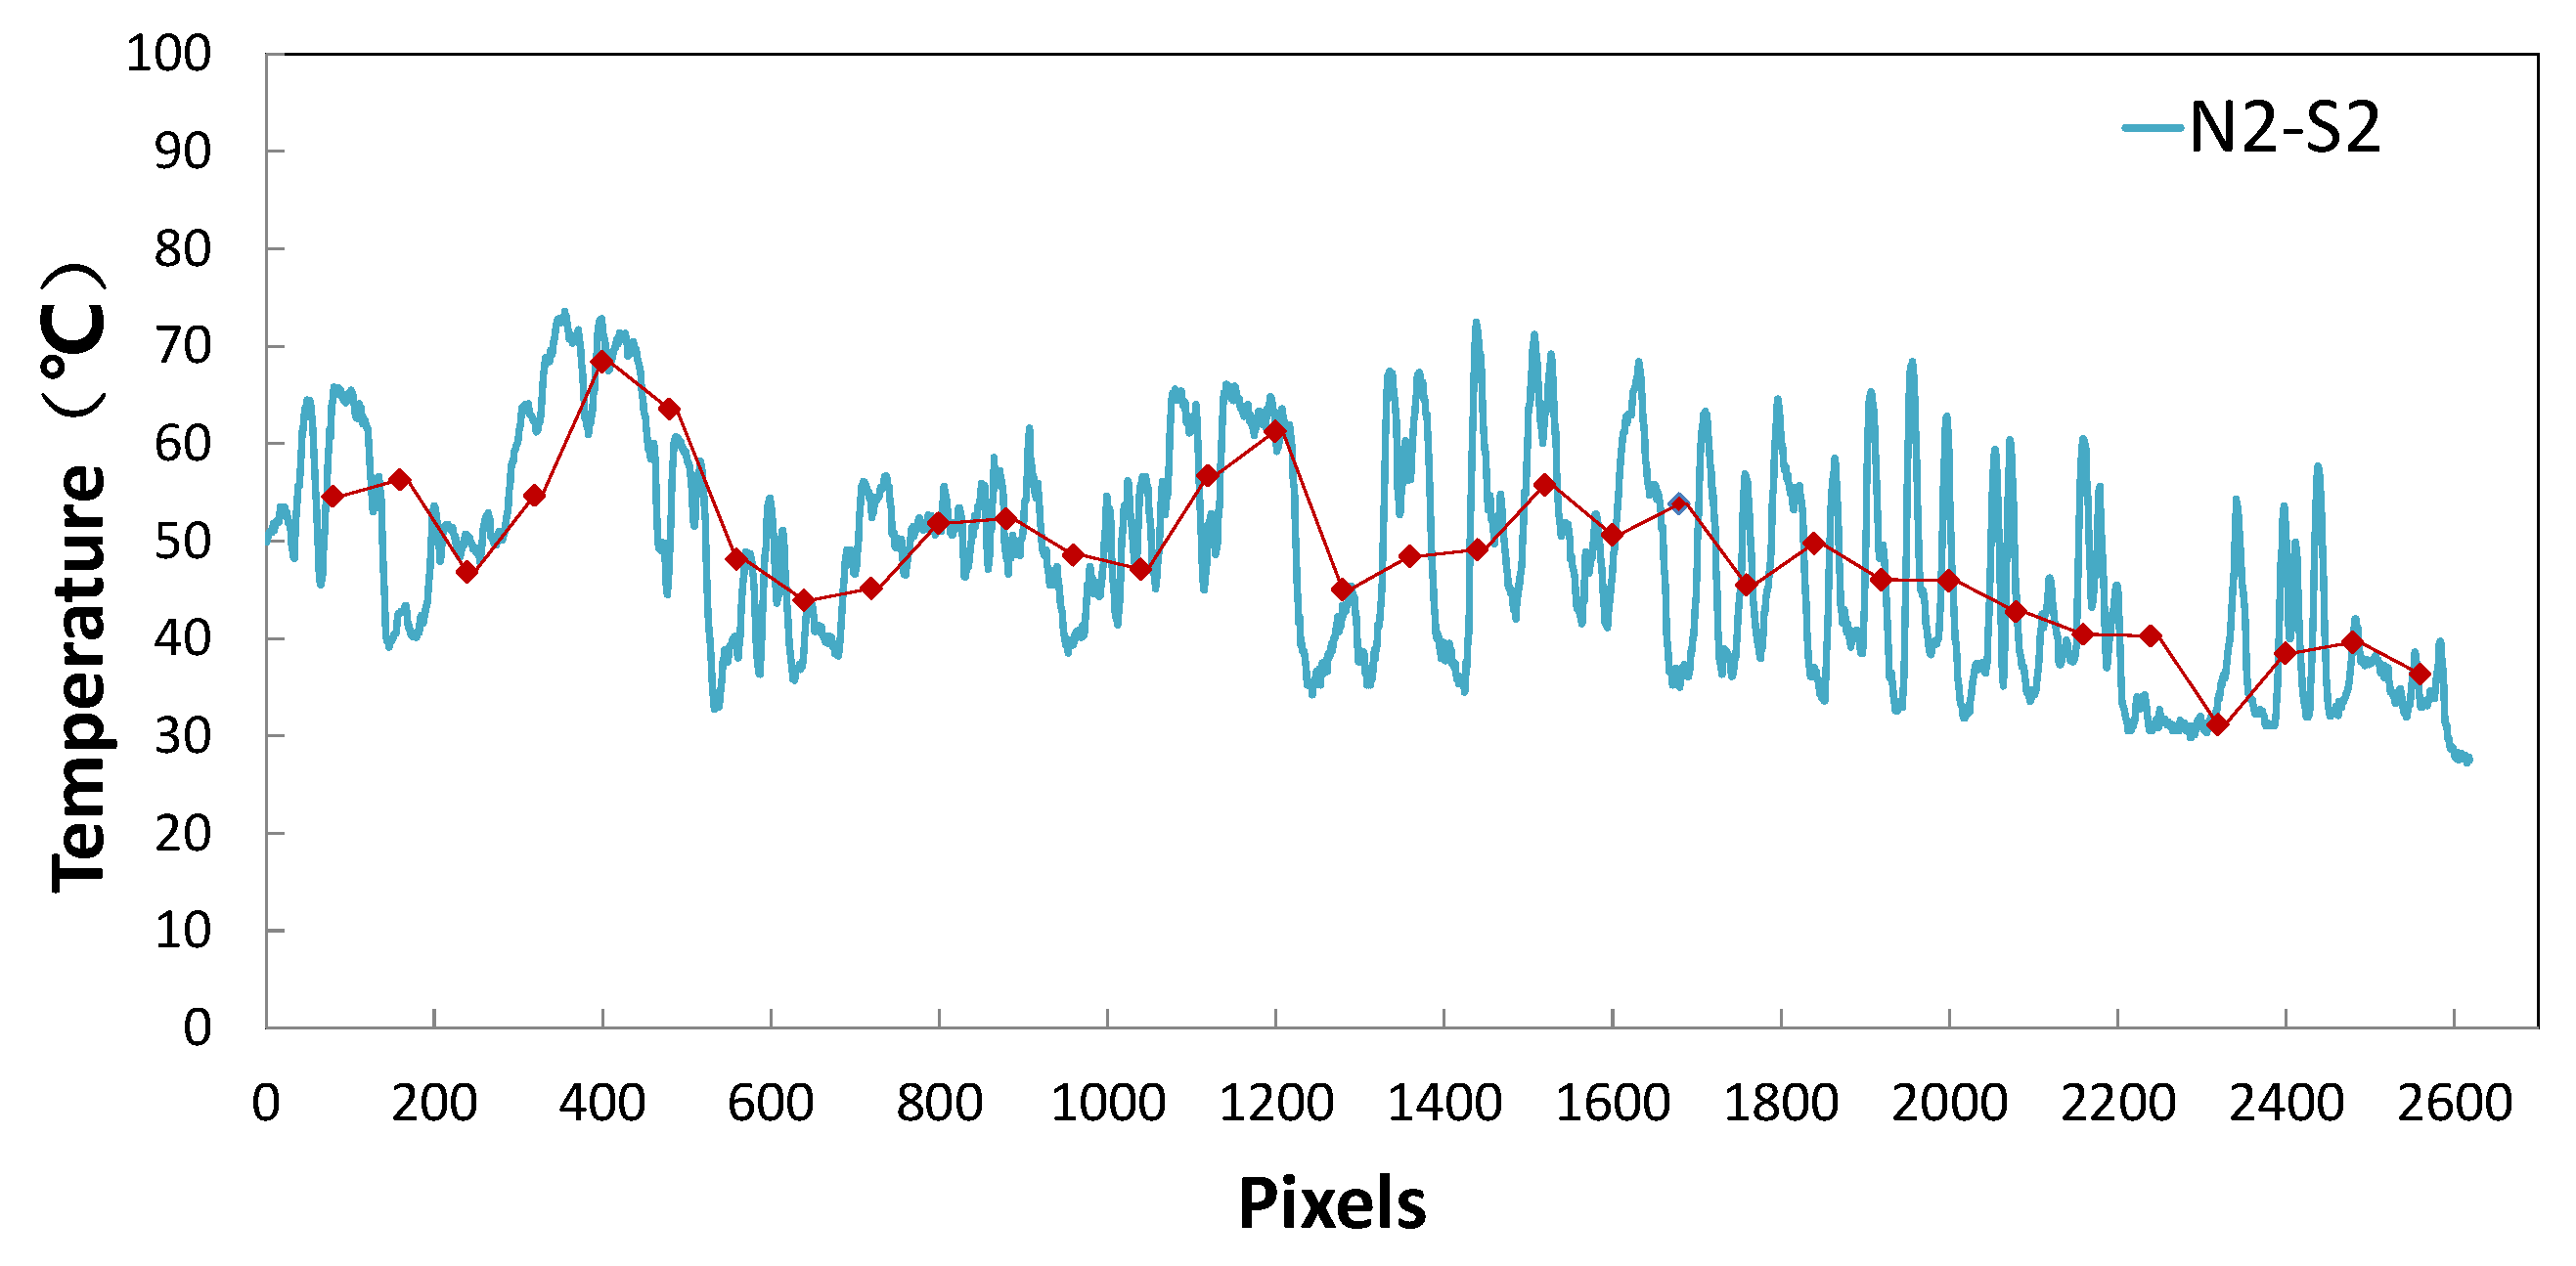
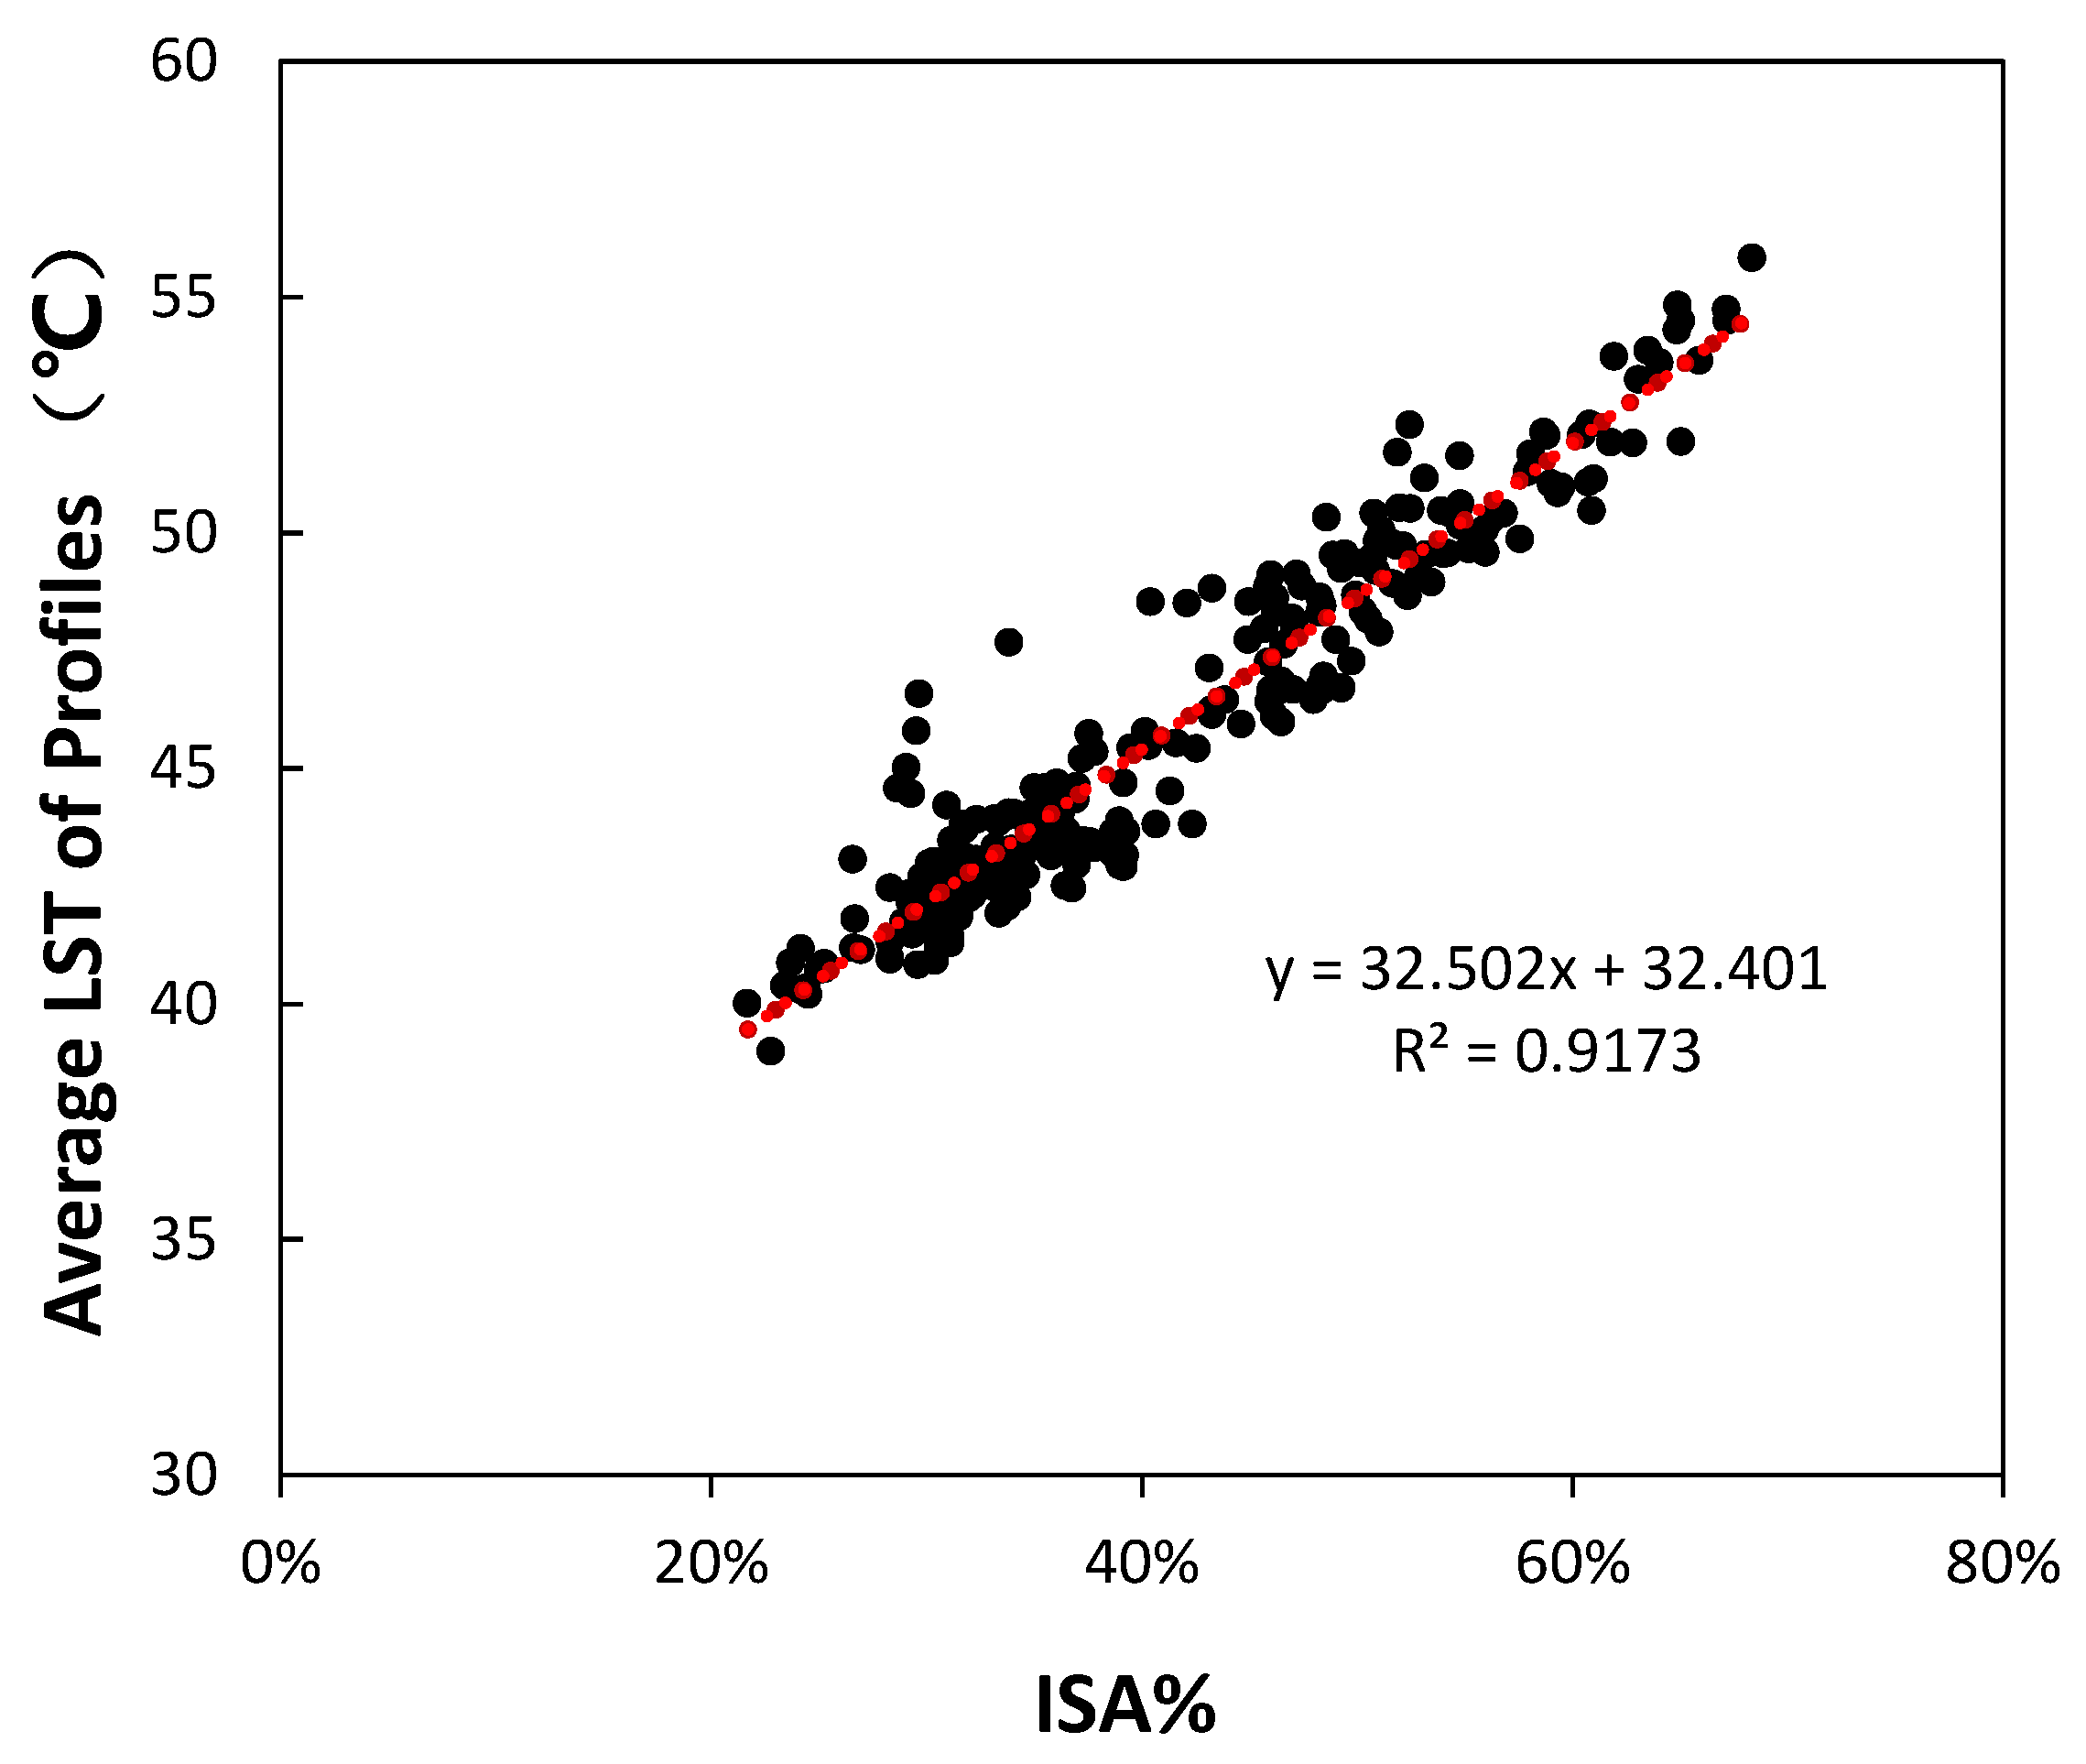
4.3. Analysis of LST Profile

Based on the land use types and the underlying surface properties, three profiles were selected to further analyze the LST characteristics in the E–W and the N–S directions in Figure 9.
Profile W1–E1 went through an industrial area, the Zhujiang River, residential areas, lawns, and woods, as shown in Figure 11. The impervious surfaces presented higher LST, including the asphalt pavement, the square paved with rigid material, the cement/concrete roofs, and the paths in the industrial and residential areas, while the underlying surfaces with evaporative cooling effects showed a lower LST, such as the Zhujiang River, farmland, lawns, and woods. The lowest LST through this profile was 28.4 °C in the Zhujiang River, while the highest LST of 71.1 °C was located on an asphalt road. The industrial zone exhibited the second highest LST of over 60 °C due to the large areas of rooftops and roads with minimal and vegetation cover. The average LST of more than 50 °C in the residential area also exceeded the overall average LST of 38.6 °C. It is observed that the profile can illustrate more detailed thermal characterizations than the complex LST map directly.
Figure 11. LST on profile W1-E1 (Lines marked in Figure 9).
Remotesensing 07 14259 g011
Profile N1–S1 covered several large public construction areas, such as the stadium, the gym, and the library. Figure 12 shows that the LST peaks alternated with the valleys. The constructions (impervious surface) were distributed between the water body and the green landscapes, as islands were visually located on the sea, indicating that the evaporation cooling effect played a significant role in regulating the urban thermal environment. More specifically, the maximum mean LST was recorded for the plastic track of the stadium, followed by the library, asphalt, and gym. This reveals that impervious surface temperature is not only controlled by material types but also linked to such factors as surface color, structure, and roughness. Grass land (around 2600 pixels) exhibited clear temperature gradients along with the distance from Zhujiang River, suggesting that soil water content might be affecting the vegetation’s surface temperature.
In addition, the “steep walls” between impervious surfaces and adjacent evaporating underlying surfaces reveal that their interaction effects on LST is intimately related to distance. That is, the cooling effect of evaporating underlying surfaces to their surroundings exists in a limited range.
Figure 12. LST on profile N1–S1 (Lines marked in Figure 9).
Remotesensing 07 14259 g012
To understand the influence of spatial variability, the profile N2–S2 data was resampled to 60 m resolution in Figure 13. The line of LST-AVG 60 was drawn by connecting the average values of every 80 points. The overall trends of LST in both resolutions were decreasing gradually from the left-hand side to the right-hand side. This is associated with the fact that vegetation covers were mostly localized in the right-hand side and impervious surfaces had a larger proportion in in the left-hand side. Compare N2–S2 with LST-AVG 60, however, high-resolution data can present much greater temperature fluctuations. Especially for the intensive built up area and a blend of impervious surfaces and vegetated covers such as residential zone (600–800 pixels) and teaching area (1600–2200 pixels), N2–S2 data illustrated the more detailed thermal information of different surfaces, whereas they looked similar in LST-AVG 60. This result indicates that high thermal resolution might be used to classify fine urban material and facilitate in discriminating urban land cover.
Figure 13. LST on profiles N2–S2 (Lines marked in Figure 9): The resolution of N2–S2 and LST-AVG 60 are 0.8 m and 60 m, respectively.
Remotesensing 07 14259 g013
As shown in Figure 9, almost all of surface temperatures of impervious surface areas (ISA) are over 45 °C, while that of water bodies and vegetation do not exceed 45 °C. Based on this, the percentage of ISA (ISA%) in the above-mentioned three profiles are 29.6%, 43.4%, and 59.6%, respectively, while the corresponding average surface temperatures are 40.8 °C, 42.8 °C, and 49.1 °C, respectively. It reveals that the increase of ISA leads to the increase of LST and aggravates UHI phenomena.
To further explore the relationship between LST and ISA%, a total of 268 profiles every ten pixels at east–west direction were chosen. As illustrated in Figure 14, the average LST of profiles is strongly positively correlated with ISA%. The linear regression analysis with coefficient of determination (R2) of 0.917 and the slope amounts to 0.325 °C per ISA%, indicating that LST is sensitive to ISA%.
Figure 14. Scatterplot of average LST of profiles and ISA%.
Remotesensing 07 14259 g014

5. Conclusions and Outlook

Satellite remote sensing is applicable for investigation of SUHI effect at a macro or meso scale rather than at a micro scale. This paper presents UALTIRSS and a convenient method for capturing and retrieving a high spatial resolution LST. Meanwhile, detailed characterization of urban thermal environment is examined realistically. Several conclusions were drawn from our research:
  • UALTIRSS possesses some excellent features, such as low-cost, flexibility, and high spatial resolution. Particularly, its thermal infrared spatial resolution of up to 0.8 m in this experiment is an important supplement to satellite data for multi-scale urban thermal environment evaluations.
  • Since there are no mixed pixels involved, it is a convenient way to retrieve LST using reliable emissivity sources. Considering the difference of reference and actual emissivity, the deviation between the retrieved temperatures and the ground measured temperatures is within an acceptable scope in this study.
  • The LST map can reveal overall trends and characteristics of urban thermal environment. A decrease of surface temperature was recorded with impervious surfaces, and followed by vegetation and water bodies. This result indicates that impervious surfaces contribute most to SUHI, whereas water bodies and vegetation cover cools urban thermal environments significantly.
  • Profiles can illustrate the detailed thermal patterns on specific directions more visually, and profiles with high thermal resolution can show more details and temperature fluctuations, which are conducive to classify fine urban material and discriminate urban land cover.
  • A significant positive relationship between the average LST of profiles and ISA% with R2 of 0.917 and the slope amounts to 0.325 °C per ISA% proves that LST is sensitive to ISA%.
In this study, the types of classical underlying surfaces were insufficient for LST retrieval, which caused a relatively large LST deviations in some areas. Therefore, more detailed classification and optimization should be conducted. UHI is more direct and effective for assessing the urban thermal environment than SUHI. Accordingly, the next necessary aim is to retrieve the near-ground air temperature from brightness temperature and develop a UHI map.

Acknowledgments

This study was supported by the China Postdoctoral Science Foundation funded project (2014M562178), the Fundamental Research Funds for the Central Universities (2014ZB0024), the State Key Lab of Subtropical Building Science, South China University of Technology (2015ZB23), and the Science and Technology Program of Guangzhou, China (201510010244).

Author Contributions

Peng Ren proposed and developed the research design, manuscript writing and results interpretation. Qinglin Meng, Lihua Zhao and Yufeng Zhang supervised all the work that has been done by the first author and revised manuscript. Xu Yuan and Xiaoheng Feng coordinated the data acquisition. Jie Xiao offered many helps on manuscript revision.

Conflicts of Interest

The authors declare no conflict of interest.

References

  1. Weng, Q. A remote sensing-GIS evaluation of urban expansion and its impact on surface temperature in the Zhujiang Delta, China. Int. J. Remote. Sens. 2001, 22, 1999–2014. [Google Scholar]
  2. Xiong, Y.; Huang, S.; Chen, F.; Ye, H.; Wang, C.; Zhu, C. The impacts of rapid urbanization on the thermal environment: A remote sensing study of Guangzhou, South China. Remote Sens. 2012, 4, 2033–2056. [Google Scholar] [CrossRef]
  3. Priyadarsini, R.; Hien, W.N.; David, C.K.W. Microclimatic modeling of the urban thermal environment of Singapore to mitigate urban heat island. Sol. Energy 2008, 82, 727–745. [Google Scholar] [CrossRef]
  4. Peng, S.; Piao, S.; Ciais, P.; Friedlingstein, P.; Ottle, C.; Bréon, M. B.; Nan, H.; Zhou, L.; Myneni, R.B. Surface urban heat island across 419 global big cities. Environ. Sci. Technol. 2012, 46, 696–703. [Google Scholar] [CrossRef] [PubMed]
  5. Weng, Q. Thermal infrared remote sensing for urban climate and environmental studies: Methods, applications, and trends. ISPRS J. Photogramm. Remote Sens. 2009, 64, 335–344. [Google Scholar] [CrossRef]
  6. Weng, Q. Fractal analysis of satellite-detected urban heat island effect. Photogramm. Eng. Remote Sens. 2003, 69, 555–566. [Google Scholar] [CrossRef]
  7. Xiao, R.; Weng, Q.; Ouyang, Z.; Li, W.; Schienke, E.W.; Zhang, Z. Land surface temperature variation and major factors in Beijing, China. Photogramm. Eng. Remote Sens. 2008, 74, 451–461. [Google Scholar] [CrossRef]
  8. Yuan, F.; Bauer, M.E. Comparison of impervious surface area and normalized difference vegetation index as indicators of surface urban heat island effects in Landsat imagery. Remote Sens. Environ. 2007, 106, 375–386. [Google Scholar] [CrossRef]
  9. Xu, J.; Zhou, J.; Li, X. Analysis of heat field influenced by the structure of road system based on thermal infrared remote sensing. Remote Sens. Inf. 2003, 3, 31–34. [Google Scholar]
  10. Pan, J.; Feng, Z.; Xiang, D.; Zhang, Q. Analysis on thermal environment effect of land use type and pattern in valley city—A case study of Lanzhou city. Remote Sens. Technol. Appl. 2008, 23, 202–207. [Google Scholar]
  11. Zhang, X.; Wu, P.; Chen, B. Relationship between vegetation greenness and urban heat island effect in Beijing city of China. Procedia Environ. Sci. 2010, 2, 1438–1450. [Google Scholar] [CrossRef]
  12. Berni, J.A.J.; Zarco-Tejada, P.J.; Suárez, L.; Fereres, E. Thermal and narrowband multispectral remote sensing for vegetation monitoring from an unmanned aerial vehicle. IEEE Trans. Geosci. Remote Sens. 2009, 47, 722–738. [Google Scholar] [CrossRef]
  13. Voogt, J.A.; Oke, T.R. Thermal remote sensing of urban climates. Remote Sens. Environ. 2003, 86, 370–384. [Google Scholar] [CrossRef]
  14. Cai, G.; Du, M.; Xue, Y. Monitoring of urban heat island effect in Beijing combining ASTER and TM data. Int. J. Remote. Sens. 2011, 32, 1213–1232. [Google Scholar] [CrossRef]
  15. Clinton, N.; Peng, G. MODIS detected surface urban heat islands and sinks: Global locations and controls. Remote Sens. Environ. 2013, 134, 294–304. [Google Scholar] [CrossRef]
  16. Schwarz, N.; Lautenbach, S.; Seppelt, R. Exploring indicators for quantifying surface urban heat islands of european cities with MODIS land surface temperatures. Remote Sens. Environ. 2011, 115, 3175–3186. [Google Scholar] [CrossRef]
  17. Stathopoulou, M.; Cartalis, C. Daytime urban heat islands from Landsat ETM+ and Corine land cover data: An application to major cities in Greece. Sol. Energy 2007, 81, 358–368. [Google Scholar] [CrossRef]
  18. Su, Y.; Foody, G.M.; Cheng, K. Spatial non-stationarity in the relationships between land cover and surface temperature in an urban heat island and its impacts on thermally sensitive populations. Landsc. Urban Plann. 2012, 107, 172–180. [Google Scholar] [CrossRef]
  19. Luan, Q.; Ye, C.; Liu, Y.; Li, S.; Gao, Y. Effect of urban green land on thermal environment of surroundings based on remote sensing: A case study in Beijing, China. Ecol. Environ. Sci. 2014, 23, 252–261. [Google Scholar]
  20. Gao, K.; Qin, J.; Hu, Y. Plant landscape patterns improvement of the thermal environment based on remote sensing in the urban residential areas. Ecol. Environ. Sci. 2012, 21, 464–469. [Google Scholar]
  21. Gluch, R.; Quattrochi, D.A.; Luvall, J.C. A multi-scale approach to urban thermal analysis. Remote Sens. Environ. 2006, 104, 123–132. [Google Scholar] [CrossRef]
  22. Sobrino, J.A.; Oltra-Carrió, R.; .Sòria, G.; Bianchi, R.; Paganini, M. Impact of spatial resolution and satellite overpass time on evaluation of the surface urban heat island effects. Remote Sens. Environ. 2012, 117, 50–56. [Google Scholar] [CrossRef]
  23. Watts, A.; Ambrosia, V.; Hinkley, E. Unmanned aircraft systems in remote sensing and scientific research: Classification and considerations of use. Remote Sens. 2012, 4, 1671–1692. [Google Scholar] [CrossRef]
  24. Liu, K.; Su, H.; Zhang, L.; Yang, H.; Zhang, R.; Li, X. Analysis of the urban heat island effect in Shijiazhuang, China using satellite and airborne data. Remote Sens. 2015, 7, 4804–4833. [Google Scholar] [CrossRef]
  25. Zhao, E.; Qian, Y.; Gao, C.; Huo, H.; Jiang, X.; Kong, X. Land surface temperature retrieval using airborne hyperspectral scanner daytime mid-infrared data. Remote Sens. 2014, 6, 12667–12685. [Google Scholar] [CrossRef]
  26. Cui, J.; Yan, B.; Dong, X.; Zhang, S.; Zhang, J.; Tian, F.; Wang, R. Temperature and emissivity separation and mineral mapping based on airborne TASI hyperspectral thermal infrared data. Int. J. Appl. Earth Obs. Geoinf. 2015, 40, 19–28. [Google Scholar] [CrossRef]
  27. Deng, S. ENVI Remote Sensing Image Processing Method; Science Press: Beijing, China, 2010; p. 305. [Google Scholar]
  28. Hulley, G.C.; Hook, S.J.; Baldridge, A.M. ASTER land surface emissivity database of California and Nevada. Geophys. Res. Lett. 2008, 35, 165–174. [Google Scholar] [CrossRef]
  29. MODIS UCSB Emissivity Library. Available online: http://www.icess.ucsb.edu/modis/EMIS/html/em.html (accessed on 10 November 1999).

