1. Introduction
The Advanced Spaceborne Thermal Emission and Reflection Radiometer (ASTER), developed by the Ministry of International Trade and Industry (METI), Japan [
1], has been operated aboard the U.S. National Aeronautics and Space Administration (NASA) Earth Observation System (EOS) Terra platform for 15 years, far beyond its designed lifetime of five years. The ASTER archive contains over 2.8 million scenes [
2] and has provided several global products (e.g., the ASTER Global Digital Elevation Model (GDEM)) [
3] and applications, for example lithological and mineral mapping [
4,
5] and volcanic activity monitoring [
6]. ASTER delivers 60-km swath data with resolutions of 15 m over visible and near-infrared (VNIR) bands (0.52–0.86
μm), 30 m over the shortwave infrared (SWIR) band (1.60–2.43
μm) and 90 m over the thermal infrared (TIR) band (8.125–11.65
μm). The VNIR, SWIR and TIR bands have three, six and five spectral bands, respectively. The sensor also observes backward pointing in the NIR band with a spatial resolution of 15 m for the generation of digital elevation models. Unfortunately, the temperature of the SWIR detectors began to rise due to the degradation of the detector cooler system since September 2004, and thus, the SWIR data obtained after April 2008 are invalid [
7].
The radiometric calibration of ASTER, especially for the VNIR bands, including Bands 1 (green), 2 (red) and 3N (near-infrared (NIR) for nadir-looking), was implemented pre-launch, and in-flight calibration has been performed using onboard calibrators, vicarious calibration and cross-calibration. The pre-launch calibration of the bands was conducted using an integrating sphere, in which the radiance level was traceable to a primary standard copper-point blackbody [
8,
9,
10]. The calibration was transferred to onboard calibration lamps and their monitoring photodiodes [
10]. After launch, in-flight calibration was performed by the onboard calibrator every 33 days (originally 17 days; currently 49 days) [
11]. The vicarious calibration based on a reflectance-based approach [
12,
13,
14,
15,
16] has been conducted jointly by Saga University, the University of Arizona and the National Institute of Advanced Industrial Science and Technology, Japan (AIST), over dry lakes in Nevada, U.S.A., such as Railroad Valley Playa and Ivanpah Playa [
17]. The cross-calibration with the Moderate Resolution Imaging Spectroradiometer (MODIS) onboard Terra was performed over the vicarious calibration sites [
18]. The latest version of the radiometric database (DB) is ver. 4, which has been used since February 2014 for Level 1A processing [
19]. A brief explanation of the calibration is provided below describing the problems addressed in this study.
The in-flight radiometric calibration of ASTER VNIR bands was achieved by onboard calibration. The radiometric calibration of Bands 1 and 2, however, was switched from onboard calibration to a coupled vicarious calibration and cross-calibration in February 2014, which is reflected in the current radiometric DB. The reason for this change was a reported discrepancy among decreasing sensor sensitivity trends with respect to the onboard calibration and the other two calibrations after approximately the 1500th day since launch [
20], as well as a series of discussions in the ASTER Science Team Meeting of 2012–2014. Band 3N is primarily calibrated through onboard calibration results, in which the calibration coefficient after the 4876th day since launch is set to a constant based on the results of vicarious calibration, which exhibit a flat trend with time [
19,
20]. Note that the accuracy of onboard calibration would be less than that of pre-flight calibration, because the pre-flight calibration source was used to calibrate the onboard calibrators with the sensor as a transfer radiometer, and the harsh environment of space increases the uncertainty with time of the calibrators [
17,
21]. Moreover, the calibrators may fail or malfunction in a space environment [
17].
The present study clarifies the inter-band radiometric consistency. The ASTER Bands 1 and 2 are calibrated by vicarious calibration and cross-calibration, whereas Band 3N is primarily calibrated by onboard calibration, as mentioned above. The discrepancy in the calibration strategy would cause an inconsistency in radiometric calibration and subsequent computations of radiances across bands, because independent calibration methods may provide different values of systematic and random errors. In such a case, spectral bands output different values of radiances, even if they sense identical radiances. Specifically, the inconsistency in radiances between Bands 2 and 3N due to the use of an independent calibration strategy can impose systematic errors in computing vegetation indices (VIs) using the red and NIR bands (e.g., the normalized difference vegetation index (NDVI)) [
22], and the errors can propagate into remote sensing applications, including the detection of vegetation amount and land cover classification. The evaluations of inter-band (intra-sensor) radiometric consistency and inter-band calibration are therefore a prerequisite. Inter-band radiometric calibration using a well-calibrated reference band is one calibration technique; for example, numerous studies have used deep convective clouds (DCC) as a target for the calibration, which exhibits nearly flat spectra in the VNIR band [
23,
24,
25,
26]. The inter-band calibration technique can provide relative radiometric consistency across the reference and all inter-calibrated bands, which cannot be examined/provided by other calibration methods. However, the calibration target showing flat spectra is required or we need to obtain the hyperspectral reflectances from the surface of the target for compensating the effects of the sensor’s relative spectral responses (RSRs) during inter-band comparison/calibration.
The objective of the present study is to evaluate inter-band radiometric consistency on ASTER VNIR bands and to develop an algorithm for radiometric calibration of ASTER Bands 2 and 3N with reference to Band 1 in order to improve relative radiometric accuracy. The reason for selecting Band 1 as a reference is that the sensor sensitivity degradation curves for Band 1 from the three in-flight calibration methods exhibited good agreement in the early stage (from launch day to approximately the 700th day), during which onboard calibration likely worked properly. The calibration target was selected to be a dry lake in Nevada, U.S.A. (Railroad Valley Playa), because information regarding the spectral profile of the surface reflectance factor is available. The Railroad Valley Playa is one of the instrumented and reference test sites for in-flight radiometric calibration endorsed by the Committee on Earth Observation Satellites (CEOS), which is appropriate for inter-band radiometric comparison/calibration. The details of the site and data information are first introduced in
Section 2, and the algorithms used for inter-band radiometric comparison and calibration for ASTER VNIR bands are presented in
Section 3.
Section 4 describes the results of the inter-band radiometric comparison and calibration. The uncertainty analysis of inter-band calibration is provided in
Section 5, followed by the discussion and the conclusion in
Section 6 and
Section 7, respectively.
3. Inter-Band Comparison and Calibration Method
The inter-band comparison and calibration in the present study are conducted in terms of the unit of spectral radiance (watts per square meter per steradian per micrometer (W/m2/sr/μm)). The comparison algorithm consists of two parts: (1) band translation; and (2) radiometric comparison across a destination and a reference band. Similarly, the calibration algorithm consists of two parts: (1) band translation; and (2) derivation of the radiometric calibration coefficient (RCC) for the sensor sensitivity degradation of the destination band using the reference band. In band translation, the radiances of the reference band are translated into those of the destination band. The translation enables consistent comparison of “radiance outputs” among spectral bands, and spectral bands providing consistent radiances will output identical values of radiances if they sense spectrally-flat radiances.
In the present study, Bands 2 and 3N are destination bands to be compared/calibrated with reference to Band 1. The pairs of reference and destination bands are “Bands 1 and 2” and “Bands 1 and 3N”. For a direct comparison between Bands 2 and 3N, we define an additional pair, “Bands 2 and 3N”, in which Bands 2 and 3N are the reference and destination bands, respectively.
3.1. Band Translation
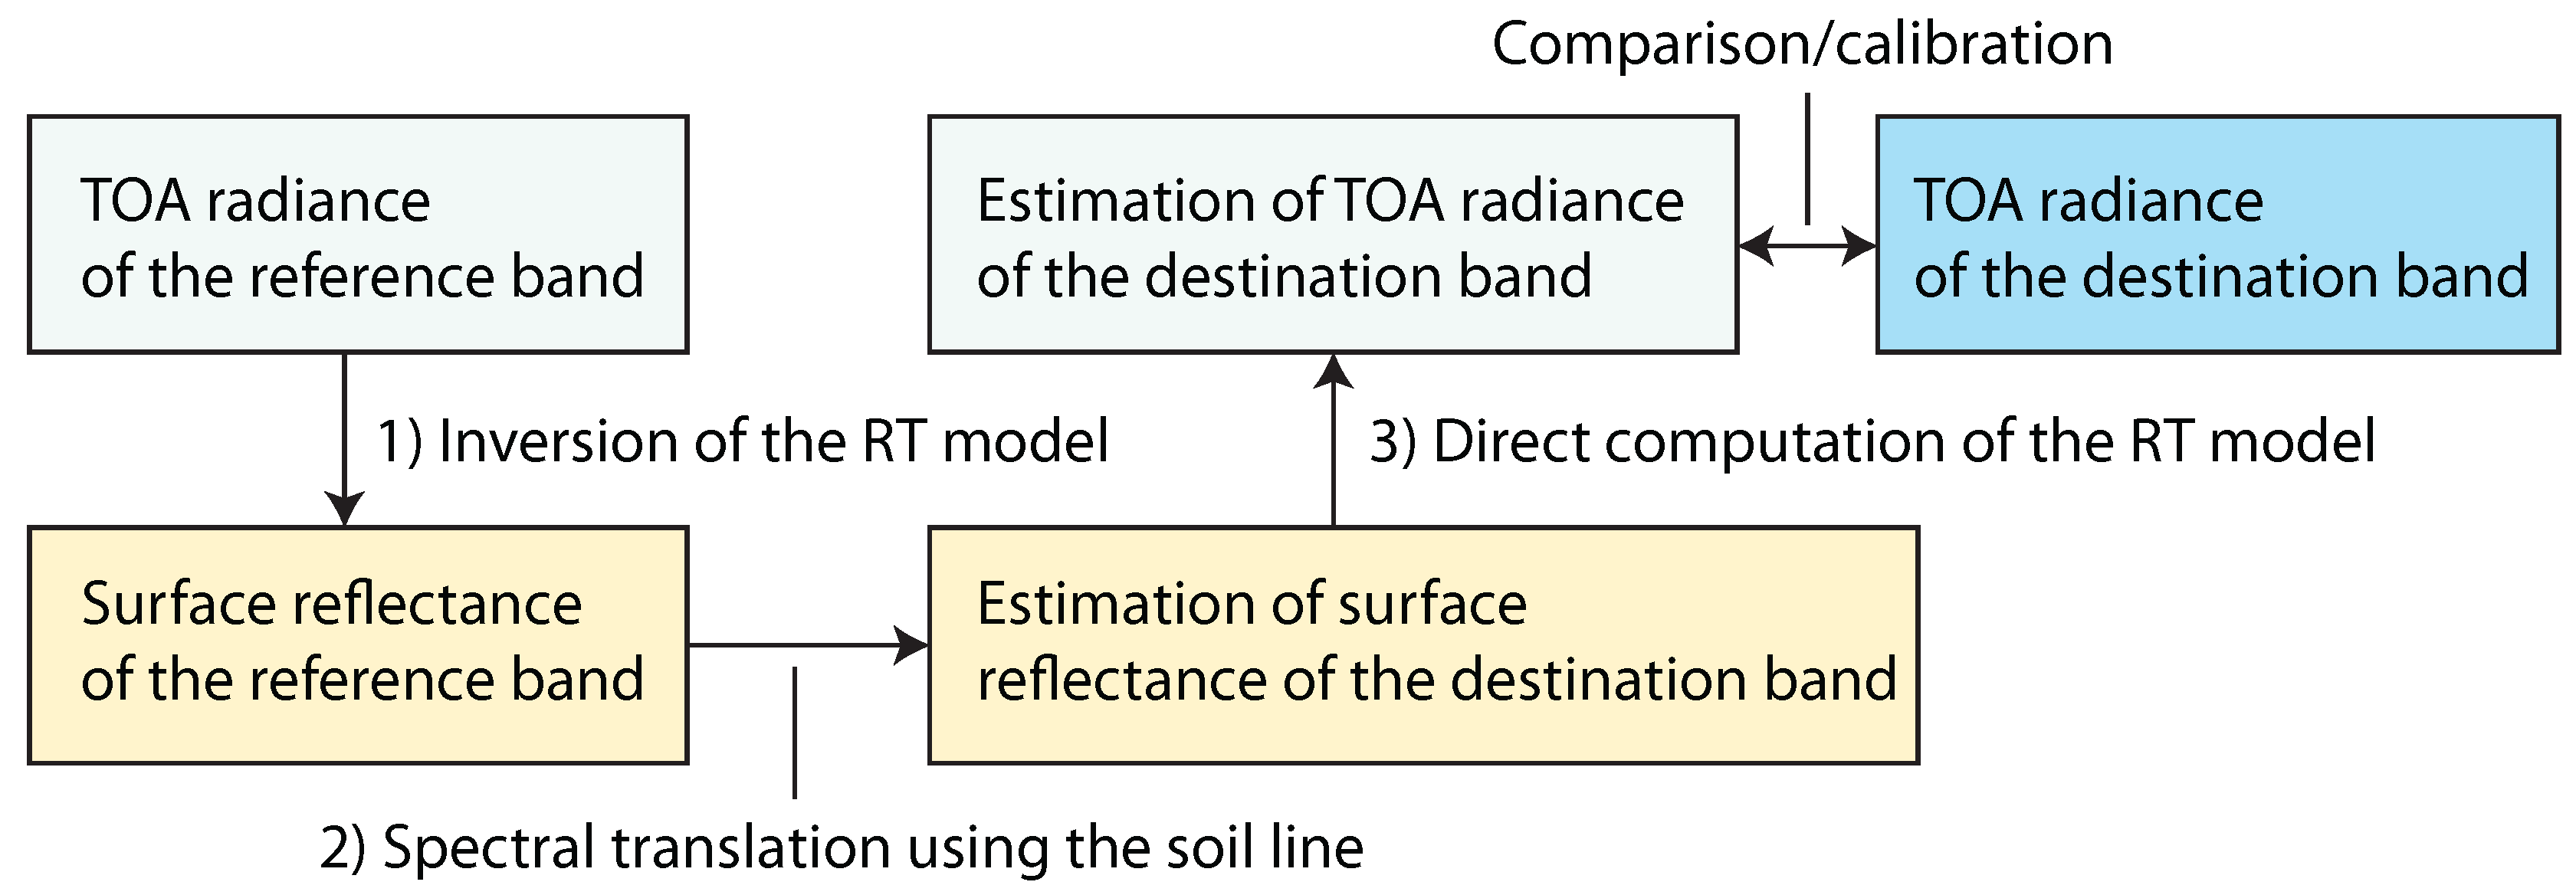
Band translation is inevitable for compensating the influences of differences in spectral responses in an effort to compare radiance outputs consistently. Band translation involves three steps: (1) the top-of-atmosphere (TOA) radiances of the reference band are first atmospherically corrected to retrieve surface reflectances by inverting a radiative transfer model; (2) the retrieved reflectance for the reference band is then translated to that of the destination band using the soil line (explained in the next paragraph); and (3) the translated surface reflectances are used as the input for the radiative transfer model to simulate the TOA radiances of the destination band. The above steps are described in
Figure 2. This approach is similar to that used for cross-sensor radiometric calibration [
29], especially for radiometric cross-calibration between spectrally-matching bands of satellite sensors [
32,
33,
34,
35,
36,
37].
Figure 2.
Band translation procedure for inter-band radiometric comparison and calibration.
Figure 2.
Band translation procedure for inter-band radiometric comparison and calibration.
Vermote and Saleous [
38] used a linear relationship between the retrieved surface reflectances for a site in the Sahara Desert for converting reflectances across MODIS onboard Terra and the Advanced Very High Resolution Radiometer (AVHRR) onboard NOAA 16 in cross-calibrating the AVHRR using MODIS. In the present study, the soil line [
39] refers to the linear relationship between soil reflectances of any bands in the solar-reflective range, and we used the soil line obtained from ground-measured data for translating ASTER VNIR bands.
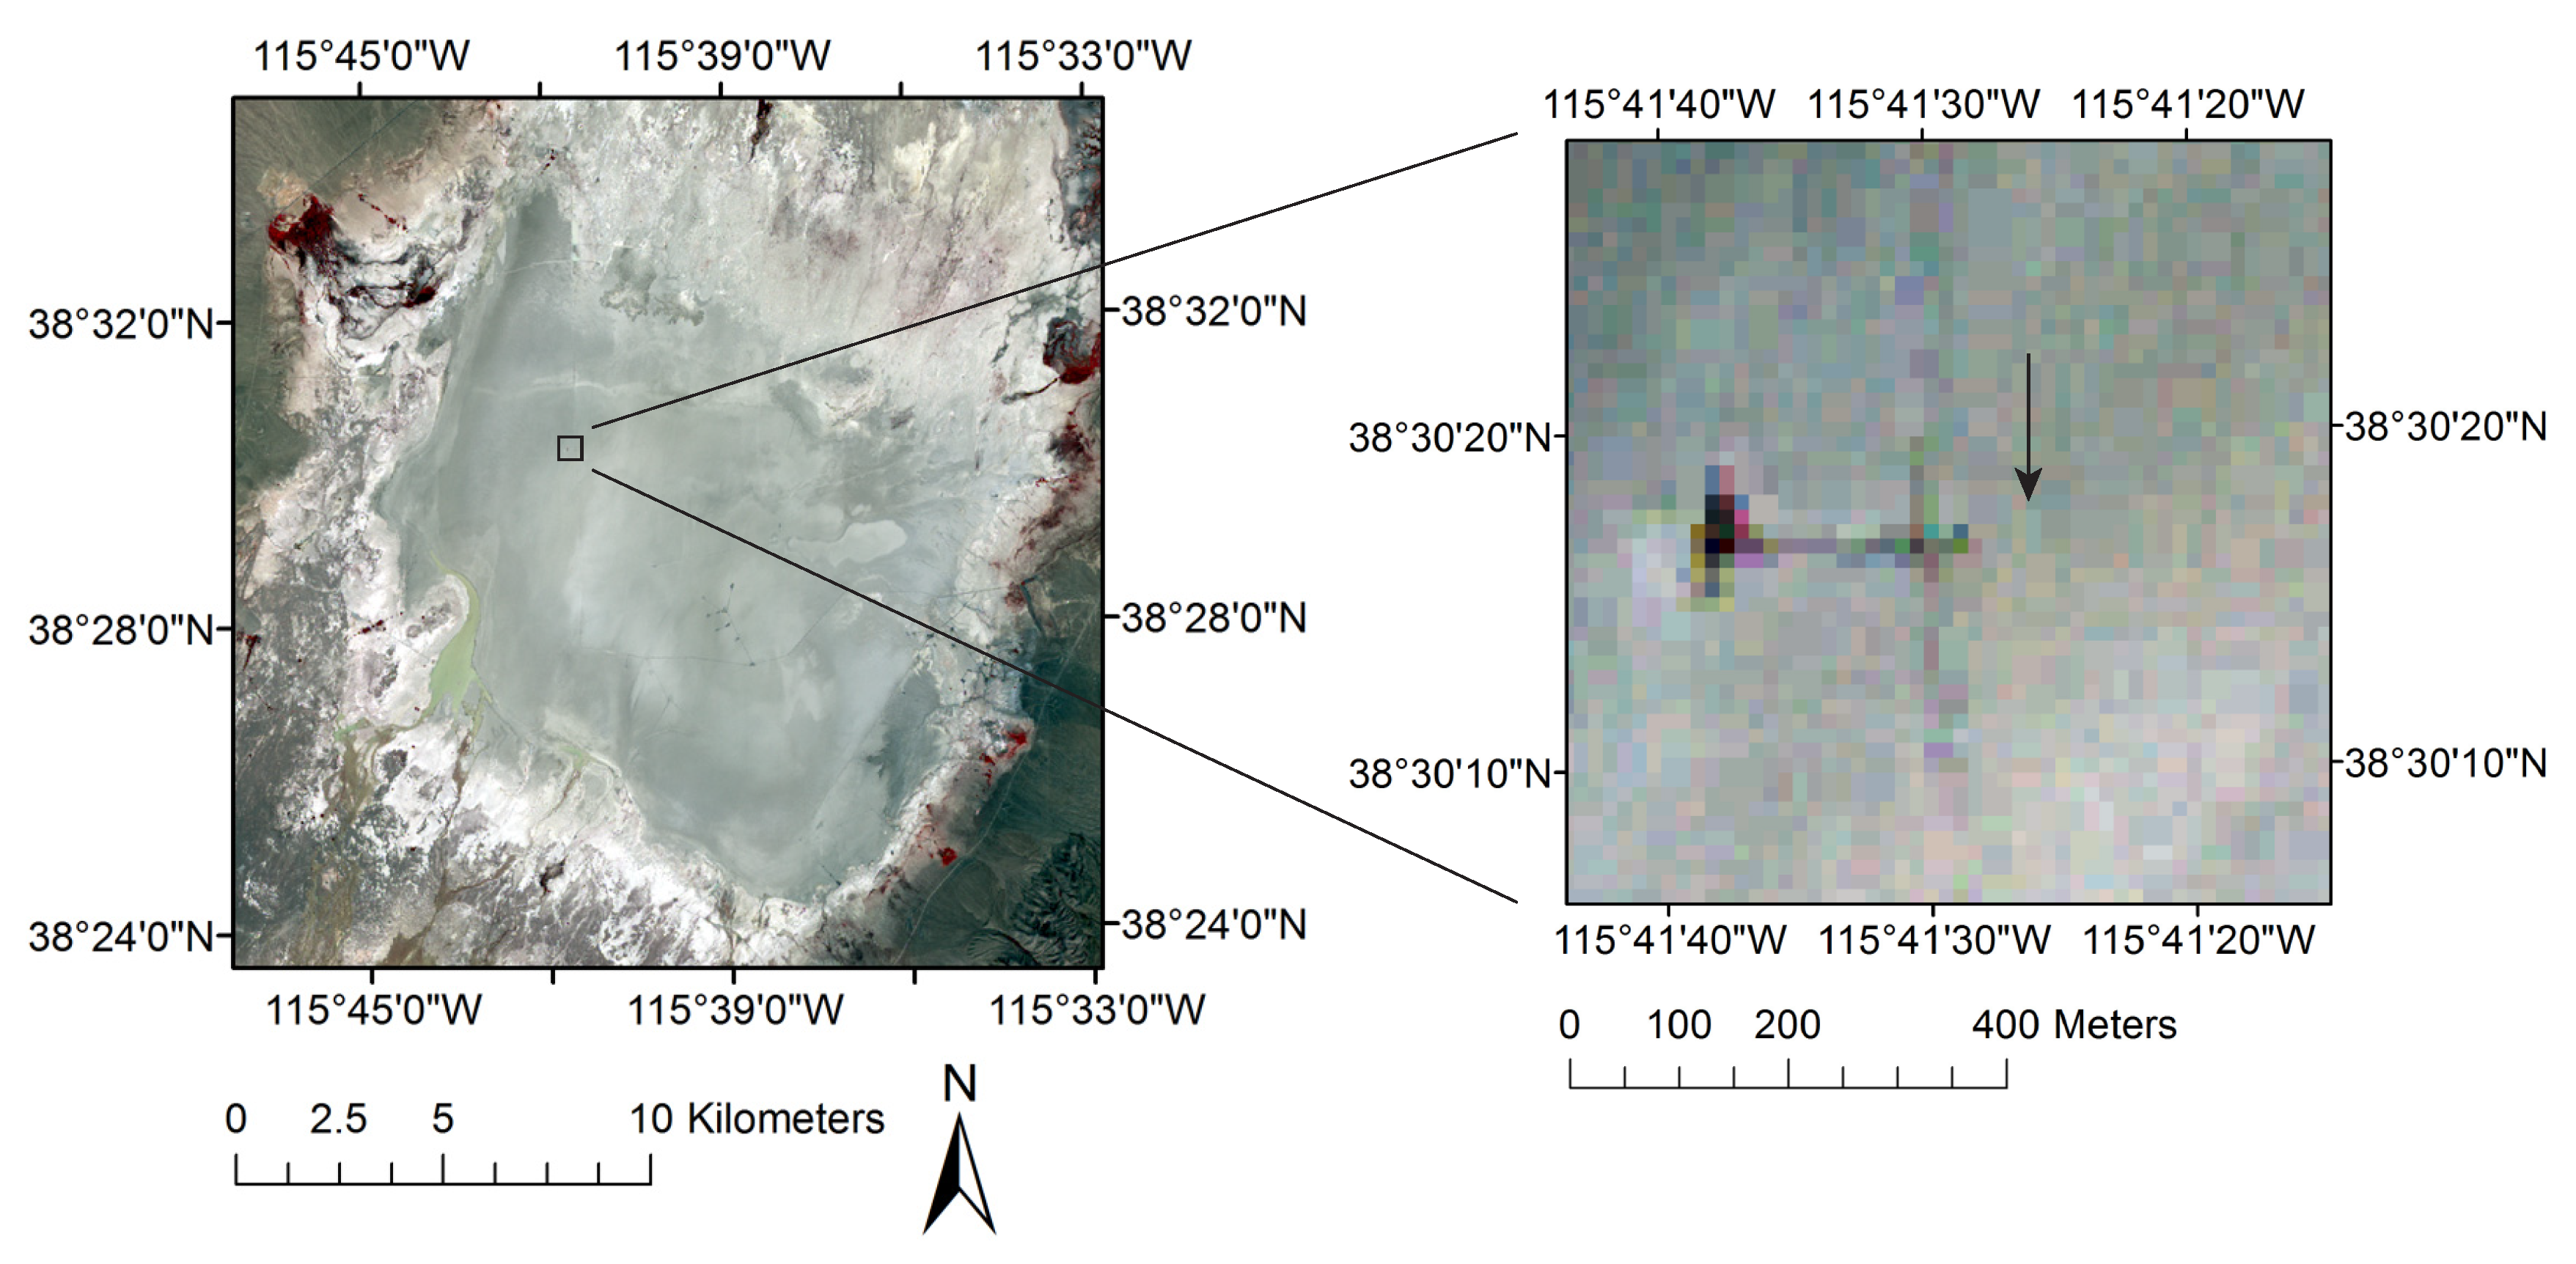
The soil line parameters (the slope and offset) for the reference and destination bands can be derived from historical data for hyperspectral surface reflectance obtained at the past field campaigns of AIST for the ASTER vicarious calibration over the Railroad Valley Playa. The FieldSpec spectroradiometers have been used to measure reflectances of the full range in VNIR and SWIR (350 nm–2500 nm). In the field campaign, an 8° attachment is used, and the instrument is transported across the site using a 1.5-m handheld boom arm that extends the foreoptic of the instrument away from the body of the user [
17]. The measurement height above the surface is approximately 1 m. The surface reflectance factor is calculated by rationing the measurements of the site to those of a reference panel. The rectangular test site is 90 m by 80 m in size, where the shorter side is perpendicular to the along-track of the Terra platform [
17]. We calculated the average of the soil reflectances from the single campaign using approximately 900 measurements. The present study employs 10 average spectra of the soil reflectances obtained by performing the campaign 10 times on different dates.
In general, the soil line parameter is computed as follows: (1) The reflectances for the reference and destination bands are computed by integrating the soil spectra with the spectral response function of two bands; and (2) the reflectances for the destination band are linearly regressed using the reflectances for the reference band to provide a soil line slope and offset.
Figure 3a shows 10 spectra of surface reflectance factors over the Railroad Valley Playa.
Figure 3b shows a scatter plot of soil reflectances and soil lines for the reference and destination bands. The three “reference and destination” band pairs are Bands 1 and 2 (denoted by plus symbols), Bands 1 and 3N (denoted by circles) and Bands 2 and 3N (denoted by triangles). Note that the soil reflectances are assumed to describe the soil line over the reference and destination band reflectance space when the soil brightness changes (by variations in the solar zenith angle), and so, constant values of these parameters are used elsewhere in the present study for band translation.
Figure 3.
(a) Reflectance factors for the Railroad Valley Playa with the normalized relative spectral responses of ASTER Bands 1, 2 and 3N (A1, A2 and A3N). (b) Scatter plot of simulated surface reflectances for Band 2 vs. Band 1, Band 3N vs. Band 1 and Band 3N vs. Band 2, where the first band corresponds to the destination band (vertical axis) and the second band corresponds to the reference band (horizontal axis). The slope and offset of the soil lines for each band pair are shown in the legend.
The Second Simulation of a Satellite Signal in the Solar Spectrum, Vector (6SV) 1.0 Beta [
40,
41], is used to invert TOA radiances to the surface reflectances and to simulate TOA radiances from the surface reflectances. The exoatmospheric solar irradiance spectrum for 250–2397.5 nm stored in the original code is switched to that based on the Thuillier model of 2002 [
42], which is interpolated to have an interval of 2.5 nm. The Thuillier model was recommended by CEOS for Earth Observation applications [
43]. A power law distribution is chosen for representing the aerosol size distribution, which requires a parameter referred to as the Junge parameter [
44]. The input parameters for 6SV are fixed, because we found that the sensitivity of the input for a radiative transfer model on band translation across ASTER VNIR bands is small enough, as reported in
Section 6. This assumption is advantageous, because, in general, the real-time measurements of the atmospheric parameters for the input have not always been available over the calibration site.
The constant (average) values for the input to 6SV over the calibration site can be obtained/estimated by ground-measured data from the Aerosol Robotic Network (AERONET) [
45] and satellite measurements by the Earth-Probe Total Ozone Mapping Sensor (TOMS) and Aura Ozone Monitoring Instrument (OMI). The data used to compute the constant values are based on observations made nearly simultaneously with the Terra overpass time for AERONET measurements and within a few hours of the overpass time for TOMS or OMI measurements under clear sky conditions over the test site. The average aerosol optical thickness (AOT) at 550 nm, the Junge parameter, the water vapor amount (g/cm
2) and the total column ozone in Dobson units (DUs) are 0.064, 3.16, 0.82 and 297.7, respectively. The real and imaginary parts of the refractive index are assumed to be 1.44 and 0.005, respectively, which are empirically determined and would be appropriate for the test site [
46].
3.2. Inter-Band Radiometric Comparison
The radiances for the destination band are intercompared with those for the reference band translated into the destination band using the band translation technique. The three band pairs of reference and destination, Bands 1 and 2, Bands 1 and 3N and Bands 2 and 3N, are used in the comparison.
The following statistics are computed in order to evaluate errors between the reference and destination bands. One such error is the average percentage relative difference between the radiances for the destination band (
) and the radiances for the reference band translated into the destination band (
), which is denoted by
ϵ. The subscript
i identifies the data item. Another error is the root mean square error (RMSE) between
and
divided by the mean of
as a percentage, %RMSE,
where
N is the number of data specific to the band pair of the reference and destination.
3.3. Inter-Band Radiometric Calibration
ASTER Band 1, corrected by vicarious calibration and cross-calibration, is used as the reference band for inter-band radiometric calibration, meaning that Bands 2 and 3N are radiometrically calibrated with reference to Band 1. The degradation curves for deriving the RCCs of Bands 2 and 3N are fitted using the following function, which is used to derive the RCC for ASTER vicarious calibration and cross-calibration data [
19] and was presented in a study on degradation models of the ASTER VNIR sensor [
47],
where
is the number of days since launch,
is a scaled calibration coefficient at launch day (
t = 0),
is a coefficient for the minimum transmittances of the contamination/corrosion layer and
is a coefficient for the degradation rate. The subscript
D represents the destination band, and the subscript
A1 in parenthesis corresponds to the reference band (ASTER Band 1). A curve is fitted using a merit function, which is the sum of the squares of the difference between the fitted curve and
where
is the date for the
i-th data,
j identifies the coefficients (
) and
can be derived as a ratio of the radiances for the destination band, which are restored to radiances without radiometric calibration for sensor sensitivity degradation using the current RCC for the destination band (
), to the radiances for the reference band, which are translated into the destination band (
),
The
(for Band 2) is derived using the current RCC, using an equation having the same form as Equation (
3), whereas
(for Band 3N) is derived using the current RCC, which is not represented by a mathematical function, but rather discrete values that vary with the specific term. The coefficients
,
and
obtained by the fitting (the subscript
D corresponds to either
A2 or
A3
N) are used to calibrate ASTER Bands 2 and 3N.
5. Uncertainty in Inter-Band Calibration for ASTER VNIR Bands
The source of uncertainty for intra-sensor band-to-band radiometric calibration was divided into four categories: (1) soil line influence; (2) variability in atmospheric condition; (3) accuracy of exoatmospheric solar irradiance; and (4) inherent code accuracy of a radiative transfer model. Note that the calibration uncertainty of the reference band, i.e., Band 1, is not included, as inter-band calibration is performed to improve relative radiometric consistency. A sensitivity analysis is conducted in order to estimate the band pair-dependent total uncertainties calculated by combining the four sources of uncertainty.
As mentioned in the previous section, the variability in the shape of the soil spectrum with time imposes differences between the soil line and actual soil reflectance spectra, referred to as the soil line influence. We simulated 10 TOA radiances for the destination bands (
) using the 10 soil spectra shown in
Figure 3a, which does not overlap soil lines that are used for band translation, via 6SV with the average atmospheric condition. Moreover, we simulated 10 spectra of soil reflectances for the reference band, which were converted to that of the destination band using soil lines. The converted spectra were used to obtain TOA radiances for the destination band (
), and the relative differences between
and
were computed in order to evaluate the soil line influence. The total number of differences is therefore 10. The uncertainties in the soil line influences were quantified by the standard deviation (SD) of the difference, resulting in 1.2%, 1.9% and 1.0% for Bands 1 and 2, Bands 1 and 3N and Bands 2 and 3N (reference and destination), respectively. The correlation between the soil reflectances for Bands 1 and 3N was less than those between the other band pairs, providing relatively large uncertainties for the pair of Bands 1 and 3N. The average difference (reference minus destination) was close to zero, namely, 0.07%, 0.03% and 0.06%, for each band pair.
The atmospheric condition used in our experiments was fixed. Strictly speaking, however, the atmospheric condition should be varied for each datum. Such influences for cross-calibrating spectrally-matching bands of sensors (e.g., ASTER Band 1 and MODIS Band 4 [
36]) have been small, but have yet to be evaluated for cross-calibrating spectral bands in different wavelength regions (e.g., ASTER Bands 1 and 3N). We therefore conducted a sensitivity analysis in order to infer the uncertainty due to fixing the atmospheric conditions for inter-band calibration. The data for AOT at 550 nm, the Junge parameter, the water vapor amount and the ozone column content used in
Section 3.1 were used again to compute the “perturbed” input for 6SV. Three variations of four inputs, namely mean minus one sigma, mean and mean plus one sigma of the input parameters, were prepared (the statistics are shown in
Table 2), and the band translation was performed using the input of 3
4 − 1 = 80 variations (“−1” indicates the case in which neither perturbed input was excluded.) Both
and
were computed using the averaged atmospheric condition, in which the surface reflectance spectrum was the average of 10 spectra shown in
Figure 3a. Afterwards, the values of
were computed using 80 combinations of perturbed inputs with
based on the band translation technique. The relative difference between 80 values of
’s and
were calculated in order to evaluate the effects of atmospheric variability. The resultant uncertainties (SD) were 0.3%, 0.8% and 0.6% for Bands 1 and 2, Bands 1 and 3N and Bands 2 and 3N, respectively. The average differences (reference minus destination) were 0.01%, 0.08% and 0.07% for Bands 1 and 2, Bands 1 and 3N and Bands 2 and 3N, respectively.
Table 2.
Mean and standard deviation of atmospheric parameters used as the input for the radiative transfer model in the sensitivity analysis. DUs, Dobson units, and, AOT, aerosol optical thickness.
Table 2.
Mean and standard deviation of atmospheric parameters used as the input for the radiative transfer model in the sensitivity analysis. DUs, Dobson units, and, AOT, aerosol optical thickness.
| Mean | SD |
|---|
| AOTat 550 nm | 0.064 | 0.042 |
| Junge parameter | 3.16 | 0.58 |
| Water vapor (g/cm2) | 0.82 | 0.44 |
| Ozone (DUs) | 297.7 | 28.0 |
Errors in exoatmospheric solar irradiance would influence the result of band translation [
48]. The uncertainty in the solar irradiance in the Thuillier model of 2002 was assumed to be <1.5% over green to the NIR band based on the uncertainty analysis of the model [
42]. The solar irradiances for the reference and destination bands were perturbed either −1.5% or +1.5%, or were not perturbed, and the total number of combinations of perturbations, except for the case in which neither band is perturbed, was eight. Both
and
were then computed using the average atmospheric and soil conditions. The eight values of
were computed using the perturbed solar irradiance and
, and the relative differences between the eight values of
and
were computed for each band pair. The uncertainties (SD) were 2.0%, 2.0% and 2.0%, respectively. The average differences (reference minus destination) were −0.06%, −0.07% and 0.16% for Bands 1 and 2, Bands 1 and 3N and Bands 2 and 3N, respectively.
The gap between the actual radiative transfer of a photon in the atmosphere and its model provides additional errors on the translation. The present study assumed an uncertainty of 1.0% or less. The inherent code accuracy of the radiative transfer code, for example the Moderate Resolution Atmospheric Transmission (MODTRAN) code (MODTRAN5) [
49], is approximately ±2.0% in computing radiances [
50], although the value may include a certain amount of errors of the solar irradiance. The value of 2.0% is used to estimate the inherent code accuracy of 6SV. In the band translation, however, the influence of the intrinsic uncertainty in the radiative transfer model is expected to be small, because the errors in modeling TOA radiances are prone to cancellation when the radiance of the reference band is compared to those of destination bands. Therefore, in the present study, an uncertainty of 1.0% or less is assumed to be large enough.
The total uncertainties of ASTER VNIR band translation calculated by the root sum of squares were 2.6, 3.0 and 2.5, respectively, for Bands 1 and 2, Bands 1 and 3N and Bands 2 and 3N, as shown in
Table 3. The influence of accuracy on solar irradiance is relatively large. The higher value of 3.0 for the pair of Bands 1 and 3N is attributed to soil line influences. The influences of variability in atmospheric conditions are smaller than the soil line and solar irradiance influences.
Table 3.
Uncertainties in inter-band radiometric calibration for three band pairs of reference and destination bands. The values are percentages.
Table 3.
Uncertainties in inter-band radiometric calibration for three band pairs of reference and destination bands. The values are percentages.
| Source of Uncertainty | A1 and A2 | A1 and A3N | A2 and A3N |
|---|
| Soil line influence | 1.2 | 1.9 | 1.0 |
| Variability in atmospheric conditions | 0.3 | 0.8 | 0.6 |
| Solar irradiance accuracy | 2.0 | 2.0 | 2.0 |
| Inherent code accuracy | <1.0 | <1.0 | <1.0 |
| Root sum of squares | 2.6 | 3.0 | 2.5 |
6. Discussion
The radiometric inter-band consistency for a single sensor, which is a focus of the present study, is crucial for remote sensing applications using the relationship between spectral bands, such as spectral vegetation indices (VIs). Currently, ASTER Bands 1 and 2 are calibrated by vicarious calibration and cross-calibration, whereas Band 3N is calibrated by onboard calibration. Specifically, the inconsistency in radiances between Bands 2 and 3N due to the use of an independent calibration strategy can impose systematic errors in computing VIs using the red and NIR bands (e.g., NDVI) [
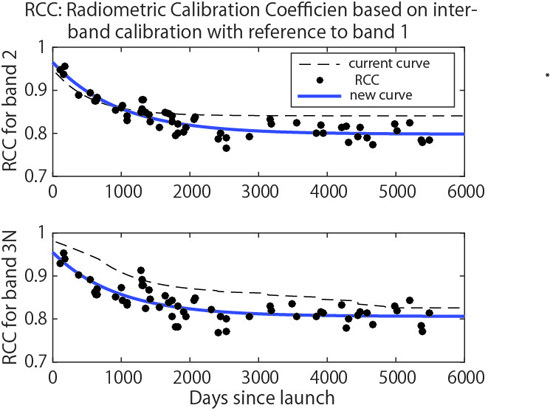
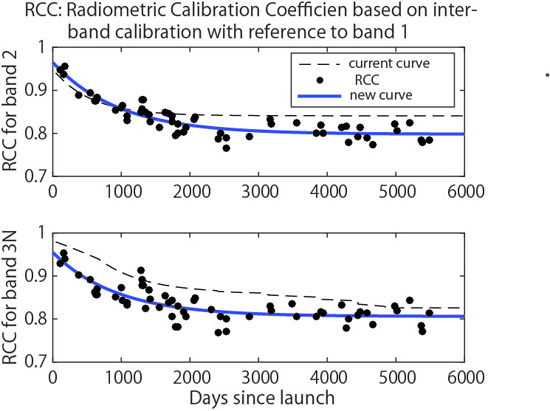
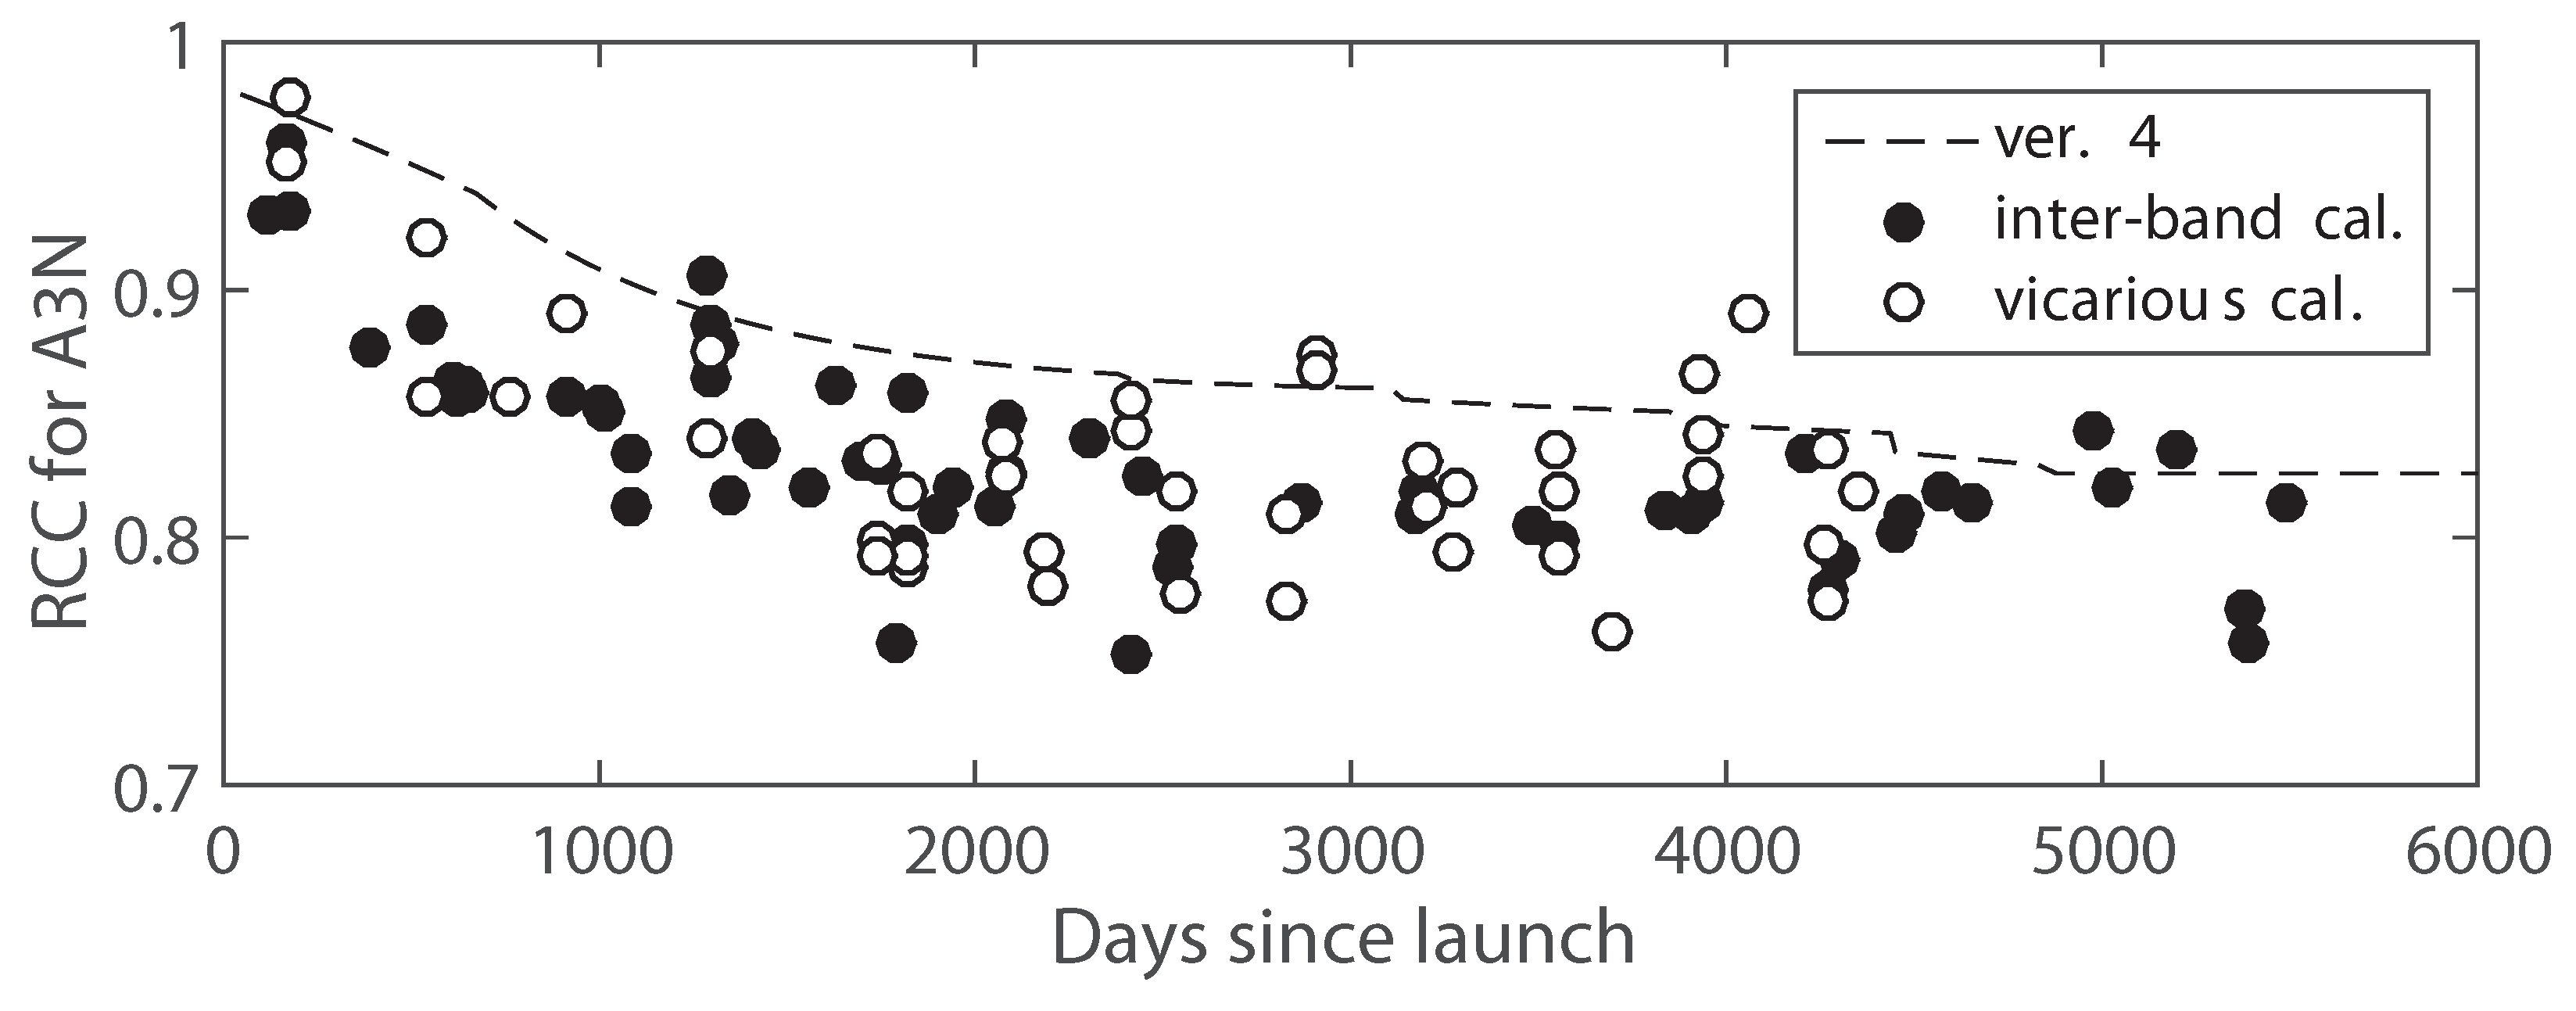
22]. The present study revealed that the same radiometric calibration strategy should be used for different spectral bands in order to increase radiometric consistency. This conclusion is based on the following: (1) the 5.7 and 4.5 %RMSE between the radiances for Bands 1 and 3N or Bands 2 and 3N obtained by inter-band radiometric comparison exceeded the uncertainty in band translation (3.0% and 2.5%), due primarily to the use of an independent calibration strategy; and (2) the distribution of points used to derive the RCC curve for Band 3N is similar to that obtained from vicarious calibration of Band 3N based on the reflectance-based method, as shown in
Figure 6, which is, however, not used to derive the RCC curve for Band 3N [
20].
There was a 4.2% error between the Band 2 RCCs on the 6000th day from current radiometric DB and the inter-band calibration results obtained using Band 1 as the reference, as shown in
Figure 5b. The 4.2% error exceeded the intrinsic uncertainty in band translation for the pair of Bands 1 and 2 (2.6%). The dominant source of the 4.2% error is likely attributed to the high-gain-related issue for Band 1, which is briefly summarized in
Appendix A. Thus, the degradation curve for Band 1 is influenced by the 2% negative error in data measured by the high-gain mode used for vicarious calibration and cross-calibration [
51], and the curve will increase if the correction is applied. Therefore, the correction will subsequently shift the degradation curves derived by inter-band radiometric calibration of Band 2 (and Band 3N) upwards (
Figure 5b (and
Figure 5c)), which may reduce the 4.2% error to the range of the intrinsic uncertainty in band translation (2.6%) and further reduce the %RMSE between Bands 1 and 2 (and between Bands 1 and 3N). Correction of the Band 1 RCC for the high gain-related issue is thus recommended for more accurate absolute radiometric calibration of Band 1 and for comprehensive understanding of the results of inter-band radiometric calibration if Band 1 is used as the reference band.
Figure 6.
Comparison between the results of inter-band radiometric calibration for Band 3N with reference to Band 1 (denoted by filled circles) and the results of the vicarious calibration for Band 3N using the reflectance-based method (denoted by empty circles). The dashed line corresponds to the current RCC curve based primarily on the onboard calibration.
The uncertainties in band translation by fixing the atmospheric conditions were approximately 0.3%–0.8% (
Table 3). The absolute average errors were, however, close to zero (less than 0.1%). This implies that fitted RCC curves would be reasonably less sensitive to atmospheric conditions with an increasing number of data if the input errors are normally distributed. Therefore, it is valid to say that inter-band radiometric calibration only requires the average atmospheric condition and historical data for surface reflectance measured on the ground over a dry lake, such as the Railroad Valley Playa, where the spectral shape of the surface reflectance is nearly time invariant. This is similar to findings reported in studies of cross-calibration of satellite sensors over the site [
29,
34,
36].
The Railroad Valley Playa is preferred as the site for inter-band calibration, where the surface is highly homogeneous, flat and bright, and the percentage of aerosol loading under the clear sky condition is usually low. The spectral shape of the surface reflectance is nearly time invariant. These characteristics reduce the uncertainty in the inter-band calibration. The high expectancy of clear weather increases the opportunity of the calibration. The site for the calibration is not limited to the Railroad Valley Playa, and thus, the other calibration sites satisfying the conditions described above can be used for the inter-band calibration if the data of spectral reflectances from ground measurements are available.
7. Conclusions
ASTER Bands 1 and 2 are calibrated by vicarious calibration and cross-calibration, whereas Band 3N is calibrated by onboard calibration by the current version of the radiometric DB, ver. 4. Such a difference can cause radiometric inconsistency across bands. Inter-band radiometric comparison of ASTER VNIR bands (Bands 1, 2 and 3N) was performed in order to evaluate the influences of using independent calibration methods across bands over the Railroad Valley Playa. Moreover, an algorithm for radiometric calibration of Bands 2 and 3N with reference to Band 1 was developed in order to improve the radiometric consistency. Prior to the comparison and calibration, band translation was performed in order to compensate the effects of RSR differences, which requires the average atmospheric condition and historical data for hyperspectral surface reflectances.
The results of inter-band comparison indicate that the radiance output was not consistent across bands, and the relationship between radiance outputs becomes Band 1 > Band 2 > Band 3N. The radiometric performance for Band 3N was different from that for Band 1 due primarily to uncertainties in the independent calibration methods. The %RMSE between the radiances for these bands was 5.7. The 3.8 %RMSE was identified between Bands 1 and 2, which is likely influenced by the 2% error in Band 1 due to the high gain-related issue. The radiometric calibration of ASTER Bands 2 and 3N was performed using an algorithm developed in the present study with reference to Band 1, which is assumed to be more reliable. The systematic errors in radiance outputs among bands were mitigated using new RCCs, and thus, 3.8–5.7 %RMSE between radiances across bands was reduced to 2.2–2.9 %RMSE after inter-band radiometric calibration. The uncertainty in the band translation was identified to be 2.5%–3.0% in the sensitivity analysis, and residual errors computed by %RMSE (2.2–2.9) were similar to or smaller than these values for every band pair.
An improvement in the absolute radiometric accuracy for the reference band, which is Band 1 in the present study, is recommended for accurate radiometric calibration with inter-band radiometric consistency. This improvement can be achieved by solving the issue regarding the high gain mode, providing approximately a 2% error in Band 1 data.
The results in the present study revealed that the same radiometric calibration strategy should be used for different spectral bands in order to increase radiometric consistency. The algorithm based on the band translation can provide a baseline for further investigation of the intra-sensor radiometric consistency of the other sensors. We can perform inter-band radiometric comparison/calibration and its validation over other test sites by applying the historical data of the surface reflectances, including Ivanpah Playa and Alkali lake in Nevada, U.S.A, obtained in the past field campaign of AIST. Furthermore, the technique of band translation developed in this study can be applied to the spectral correction across the spectrally-matching bands in cross-calibration using different sensors.


