Technical Note

Energy Analysis of Road Accidents Based on Close-Range Photogrammetry

by
Alejandro Morales
1,
Diego Gonzalez-Aguilera
2,*,
Miguel A. Gutiérrez
3 and
Alfonso I. López
3
1
Department of Computer Engineering and Automation, University of Salamanca, Plaza de los Caídos s/n, Salamanca 37008, Spain
2
Department of Land and Cartographic Engineering, High Polytechnic School of Avila, University of Salamanca, Hornos Caleros, 50, Ávila 05003, Spain
3
Departamento Tecnológico, Universidad Católica de Ávila, C\ Canteros s/n, Ávila 05005, Spain
*
Author to whom correspondence should be addressed.
Remote Sens. 2015, 7(11), 15161-15178; https://0-doi-org.brum.beds.ac.uk/10.3390/rs71115161
Submission received: 18 September 2015 / Revised: 5 November 2015 / Accepted: 9 November 2015 / Published: 12 November 2015

Abstract

:
This paper presents an efficient and low-cost approach for energy analysis of road accidents using images obtained using consumer-grade digital cameras and smartphones. The developed method could be used by security forces in order to improve the qualitative and quantitative analysis of traffic accidents. This role of the security forces is crucial to settle arguments; consequently, the remote and non-invasive collection of accident related data before the scene is modified proves to be essential. These data, taken in situ, are the basis to perform the necessary calculations, basically the energy analysis of the road accident, for the corresponding expert reports and the reconstruction of the accident itself, especially in those accidents with important damages and consequences. Therefore, the method presented in this paper provides the security forces with an accurate, three-dimensional, and scaled reconstruction of a road accident, so that it may be considered as a support tool for the energy analysis. This method has been validated and tested with a real crash scene simulated by the local police in the Academy of Public Safety of Extremadura, Spain.

Graphical Abstract

1. Introduction

Traffic accidents are one of the leading causes of mortality in developed countries, especially in Spain, constituting a concern for the National Department of Traffic, the Road Transport Ministry, and other administrative agencies involved in its management. Road accidents have represented a considerable cost (between 105,000 and 144,000 million euros) to the Spanish society in the last 10 years. In fact, the cost associated with the victims of road accidents account for 2% of GDP (Gross Domestic Product) or, in other words, roughly equivalent to a third of the wealth generated in Spain throughout the automotive industry, one of the most important in our country.
The investigation of road accidents is often a complex task due to the high number of factors involved (such as regulatory, technical, medical-legal, and physiological). These factors hamper the correct evaluation of road accidents [1]. According to this, accurate and reliable strategies to investigate the causes and conditions of the accidents are required, since these properties are important for the different groups involved: (i) persons concerned, who need to know the causes and circumstances of the road accident; (ii) the security forces, who analyze the road accident and control the traffic, (iii) the Justice Department, in order to evaluate responsibilities (civil or penal); and (iv) the administration to improve road and vehicle safety.
In most of the road accidents the main cause was the vehicle’s speed, sometimes excessive (considering the type of road), and other times in adequate to the characteristic of the road (e.g. poor state of maintenance, lack of barriers, traffic signs, etc.). For this reason, in the reconstruction of road accidents, one of the most critical factors is the speed of the vehicles implied. This variable allows the evaluation of the driver’s responsibilities. However, the presence of safety systems such as the ABS (anti-lock braking system), almost prevents the skid marks on the road, thus making the analysis of the impact velocity more difficult. In order to solve this drawback, security forces use an analysis technique based on the deformations and spatial displacements suffered by the different vehicles involved [2]. This analysis requires the acquisition of accurate measurements on both the scene and the vehicles. Additionally, when the gravity of the road accident is important, these measurements are the basis to provide evidence in a subsequent court case.
Nowadays, the acquisition method for these measurements is based on rudimentary procedures using measuring tape [3]; this depends highly on the user’s skills resulting in lesser accuracy and reliability. It should be noted that these measurements cannot be double-checked since the geometrical characteristics of the road accident changes when all the required procedures are finished. Deriving from this, it is required to develop procedures which allow an accurate metric reconstruction of the road accident with the aim of its analysis at any moment. Furthermore, this reconstruction has to enable an energy analysis of the accident in order to analyze the dynamics of the collision event.
Regarding the photogrammetric field, Luhmann et al. 2006 [4] and González-Aguilera et al. 2013 [5] try to estimate the deformation of the vehicles for expert purposes. Nevertheless, its correct application requires the use of sophisticated sensors, which need to be calibrated, cumbersome target systems [6], and photogrammetric knowledge by the agents. Other authors [7,8] deal with robust methods for orientation and camera self-calibration but they required coded targets which support the photogrammetric orientation process. Although some authors have developed new algorithms for coded target detection [9], these targets require optimal exposure to ensure success, so they work properly only in indoor industrial environments. More recently, some authors have tried to determine the collision speed of a vehicle from evaluation of the crush volume using photographs [10].Concerning the field of laser scanners, this sensor provides a real-time 3D point cloud in complete darkness or direct sunlight and without the needed of a photogrammetric knowledge. Some authors [11] have used laser scanner data for a 3D modeling of accident scenes offering new ways to simulate the accident, but lacking a direct computation of the dynamics of the collision event. Other authors [12,13] have dealt with photogrammetry and laser scanning methods for traffic accident analysis and virtual scene reconstruction. The results obtained in terms of 3D models quality are outstanding since external and internal body examinations are possible. Furthermore, one of the main drawbacks is the sensor’s cost and availability for all road officers, as well as its slow handling in situations where the time is a priority.
The following table (Table 1) tries to provide a comparative framework about these two main geotechnologies applied to road accidents.
Table 1. Comparison of the main geotechnologies applied to road accidents reconstruction.
PhotogrammetryLaser Scanning
Automation of spatial data retrievalSemi-automatedAutomated
Spatial data accuracyAccurateMost accurate
Spatial data resolutionMedium-HighHigh
Equipment costLow (hundreds)High (thousands)
Equipment portabilityLightweightNon-portable
Data acquisition timeLow (seconds per image)High (minutes per scan)
Range distanceMediumLong range
Operation timeSensitive to lightOperates day and night but sensitive to rain
All the approaches remarked above exhibit their differences between the extent of their use and measurement accuracy. The pros and cons of these techniques (Table 1) affect the required number of experts, portability, measurement range, applicability depending on the amount of light and weather conditions, time required for data acquisition and processing and the accuracy of the data acquired. Anyway, it seems clear than modern photogrammetry is facing new challenges and changes and the scientific community is replying with new algorithms and methodologies for the automated processing of imagery. However, non-expert users outside the field of photogrammetry have difficulties accessing these solutions and applying them to their specific applications to support their problem solving and decision-making.
To this end, this paper presents a method that tries to connect the photogrammetric workflow, using any image acquired with consumer-grade digital cameras by non-expert users, with the energetic analysis of road accidents, so that the results provided by this approach can respond to the demand required in the expert reports. In particular, this paper proposes a new energy analysis of the road accidents, based on the evaluation of the photogrammetric 3D point clouds which enclose: (i) automatism (in the pass from 2D-images to 3D-point clouds) ; (ii) simplicity, operating with non-metric standard cameras such as smartphones or amateur digital cameras; (iii) quality, providing metric 3D point clouds with an acceptable resolution and accuracy; and (iv) efficiency, allowing for a quick data acquisition in comparison to traditional procedures.
The research presented in this article, is intended to complement those accident reconstruction tools (e.g. VCrash, ARAS360, etc.) with dense and accurate 3D point clouds of the scenes, obtained by the photogrammetric procedure shown, which allows the extraction of features needed by this software for the reconstruction and simulation of road accidents.
Taking all of this into account, this article attempts to demonstrate the viability of the 3D point clouds and their derived products, such as deformation maps, in the energy evaluation of road accidents that are analyzed by the computation of impact speeds.
The paper is organized as follows: after this introduction Section 2 describes the different sensors and the proposed methodology for the energy analysis of road accidents; Section 3 shows the numerical results obtained in the simulated accident; and, finally, in Section 4, the conclusions and further investigations are drawn.

2. Materials and Methods

2.1. Photographic Sensors

Two sensors were used for the image acquisition process: (i) a high-resolution Olympus EMP-2 consumer-grade digital camera, equipped with a 14 mm lens; and (ii) a Nokia-Lumia 1020 smartphone. The technical specifications are described in the following table (Table 2).
Table 2. Technical specifications of the sensors used.
CameraSensor TypeSensor SizeEffective PixelsImage SizeShutter SpeedWeight
OLYMPUS EPM-24/3 CMOS17.3 × 13 mm17.2 Mp4608 × 34562–1/4000 s269 gr
NOKIA LUMIA 1020BSI CMOS8.8 × 6.6 mm40.1 Mp7136 × 5360 158 gr
EPM-2 LensFocal lengthCrop factorField of viewMaximum openingMinimum openingWeight
M.ZUIKO DIGITAL 14–42 mm f3.5-5.6 II R14–42 mmX275º–29ºF3.5 : f5.6F22113 gr

2.2. Additional Equipment
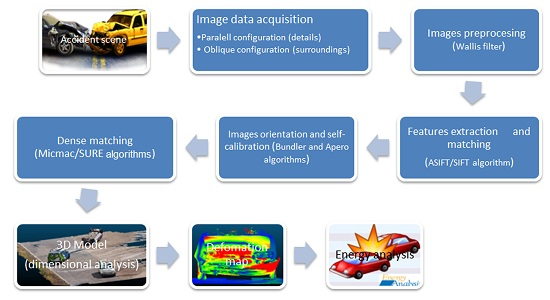
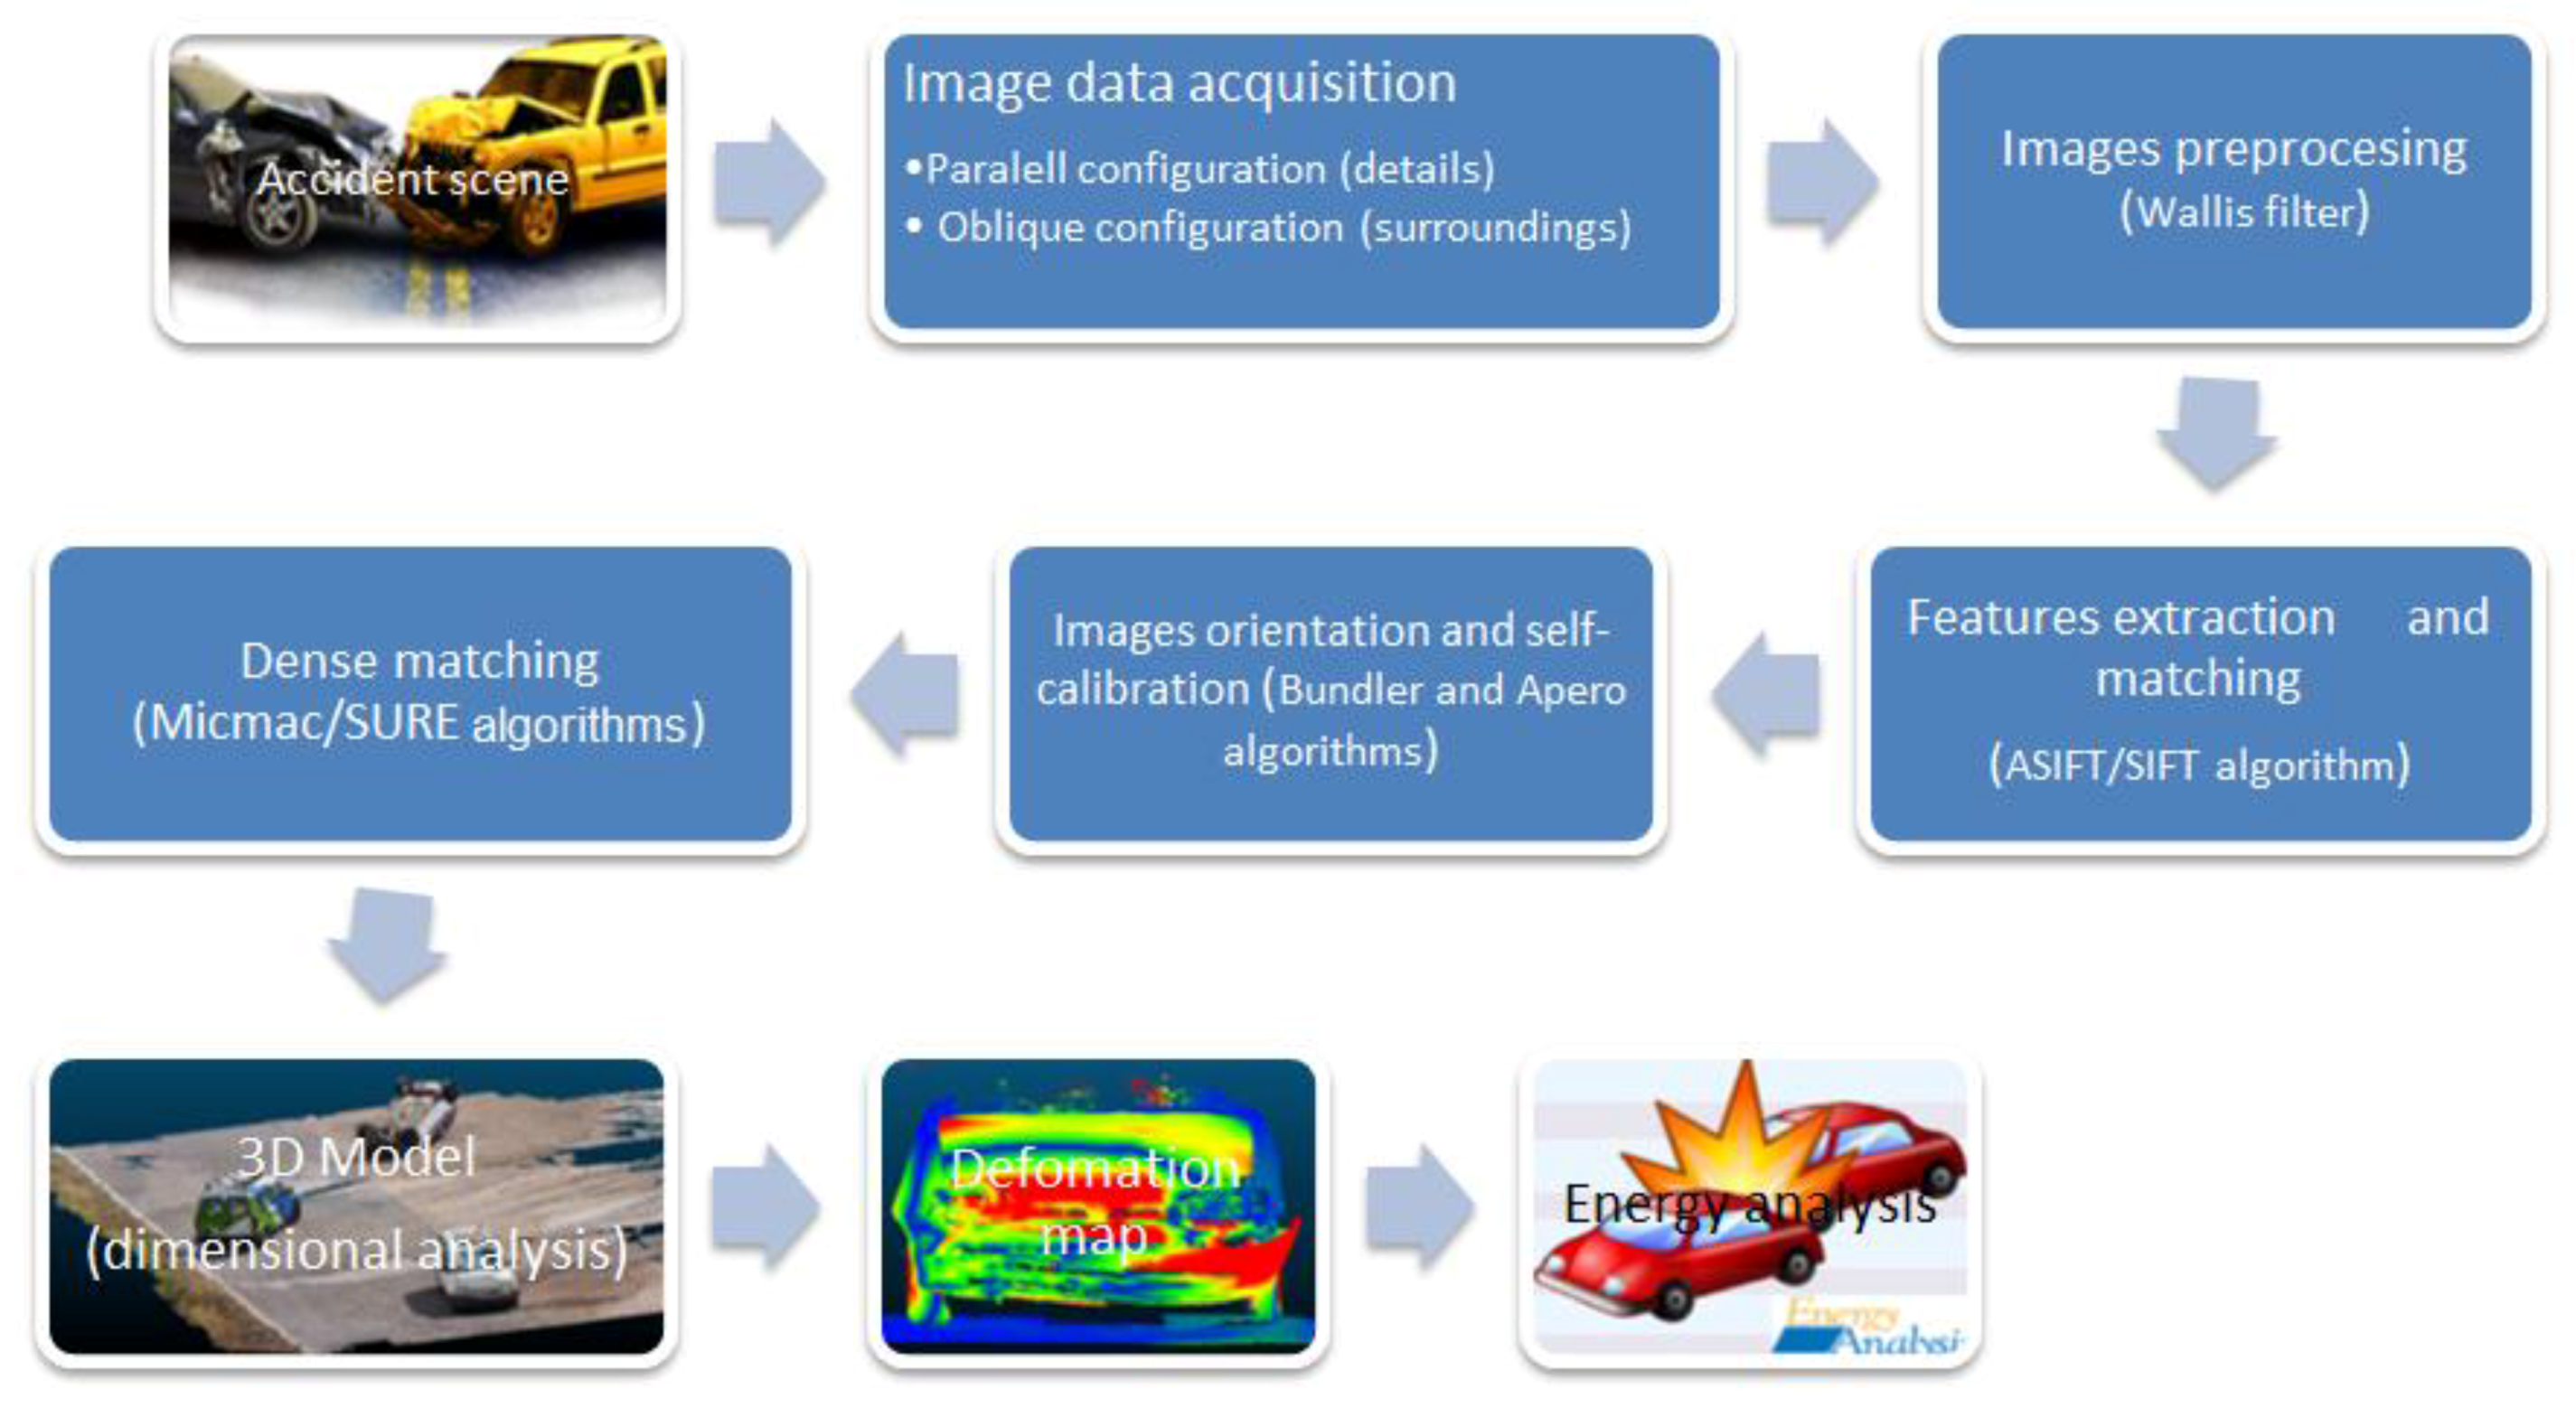
In order to evaluate the accuracy of the proposed methodology, the photogrammetric 3D point clouds were compared with those obtained by a terrestrial laser scanner (Faro Focus 3D). The scanner Faro Focus 3D measures distances using the principle of phase shift at a wavelength of 905 nm. Complementary to this, a metallic scale bar and magnetized targets (with known dimensions) (Figure 1) were used with the purpose of providing scale for two different types of 3D point clouds: (i) general point cloud of the accident scene; and (ii) detailed deformation point cloud.

2.3. Methodology

Next to the description of the used materials, the workflow designed for the energy analysis of the accident is described (Figure 2).
Figure 1. (Left) Metallic scale bar used in the general point cloud. (Right) Magnetized targets used for obtaining the deformation map (detailed point cloud). The metallic scale bar features four branches, each 1 m long from the center point. The magnetized target is 20 cm long.
Remotesensing 07 15161 g001
Figure 2. Workflow carried out for the 3D reconstruction and energy analysis of the road accident.
Remotesensing 07 15161 g002

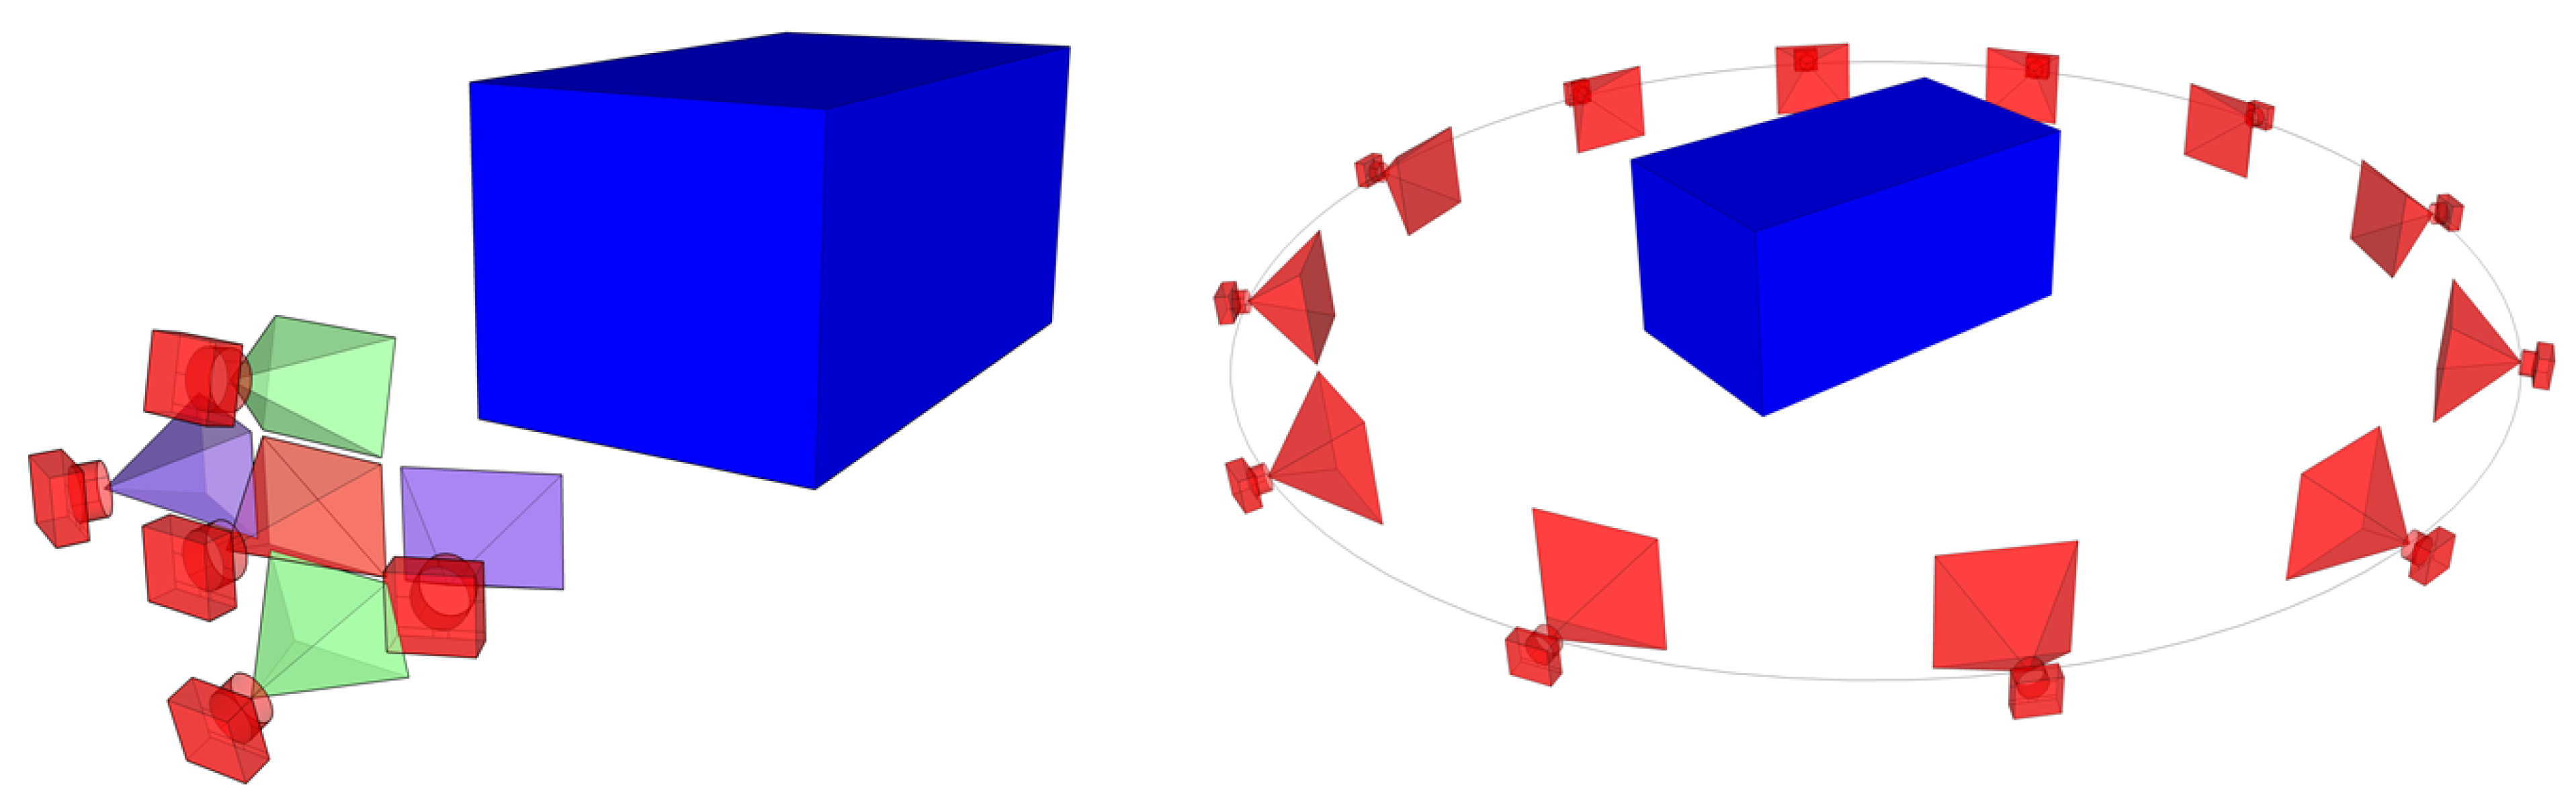
2.3.1. Image Data Protocol Acquisition.

Concerning the photogrammetric procedure, one of the greatest barriers for the non-expert agent is the data acquisition. However, whilst it may be technically simple, the protocol shows several simple rules (e.g. geometrical and radiometric restrictions or camera calibration) which make difficult the data acquisition and, thus, determine the quality of the final result. In this sense, a video-tutorial [14] has been created to help non-expert agents who want to capture a 3D scene with the acquisition of images (through conventional cameras and smartphones).
Regarding the acquisition rules of the images, there are two protocols which can be used by the agent:
  • Parallel protocol. Ideal for detailed reconstructions in specific areas of the vehicle or accident scene (e.g. skid marks, remains from the crash, etc.). In this case, the agent needs to capture five images following a cross shape as shown (Figure 3, left).The overlap between images needs to be at least 80%. The master image or central image (shown in red) will capture the area of interest. The remaining photos (four) have a complementary nature, and should be taken to the left, right (shown in purple), top, and bottom (indicated in green) of the central image. These photos should adopt a certain degree of perspective, turning the camera towards the middle of the interest area. It should be noted that, with the purpose of a complete reconstruction, each photo needs to capture the whole area of interest.
  • Convergent protocol. Presents an ideal behavior in the reconstruction of a 360º 3D point clouds (accident scene and the whole vehicles). In this case, the agent should capture the images following a ring path (keeping a constant distance to the object). It is necessary to ensure a good overlapping between images (> 80%) (Figure 3 Right). In the situations where the object cannot be captured with a unique ring it is possible to adopt a similar procedure based on the capture of images following a half ring.
Figure 3. Different adopted acquisition protocols. (Left) Parallel protocol. (Right) Convergent protocol.
Remotesensing 07 15161 g003
It should be highlighted that the previously-shown protocols do not require an auxiliary camera calibration procedure, since they incorporate self-calibration algorithms as shown (Section 2.3.4).

2.3.2. Image Pre-Processing

Due to the light conditions at the time of the accident, the presence of shadows, textureless, and high specular surfaces (common in vehicles) along the scene, a pre-processing stage is required. This step aims to homogenize the different images captured for the 3D reconstruction improving the keypoint extraction and matching. For this purpose a Wallis filter was applied [15]. Wallis filter is an useful solution when there is lack of texture on the ground or the cars contains an uniform color. In particular, this filter adjusts brightness and contrast of the pixels that lie in certain areas where it is necessary, according to a weighted average. As a result, the Wallis filter provides a weighted combination of the average and the standard deviation of the original image. Although default parameters are defined for Wallis filter, the average contrast, brightness, standard deviation, and kernel size can be introduced by the user as advanced parameters, which will return a more suitable image for feature extraction and matching.

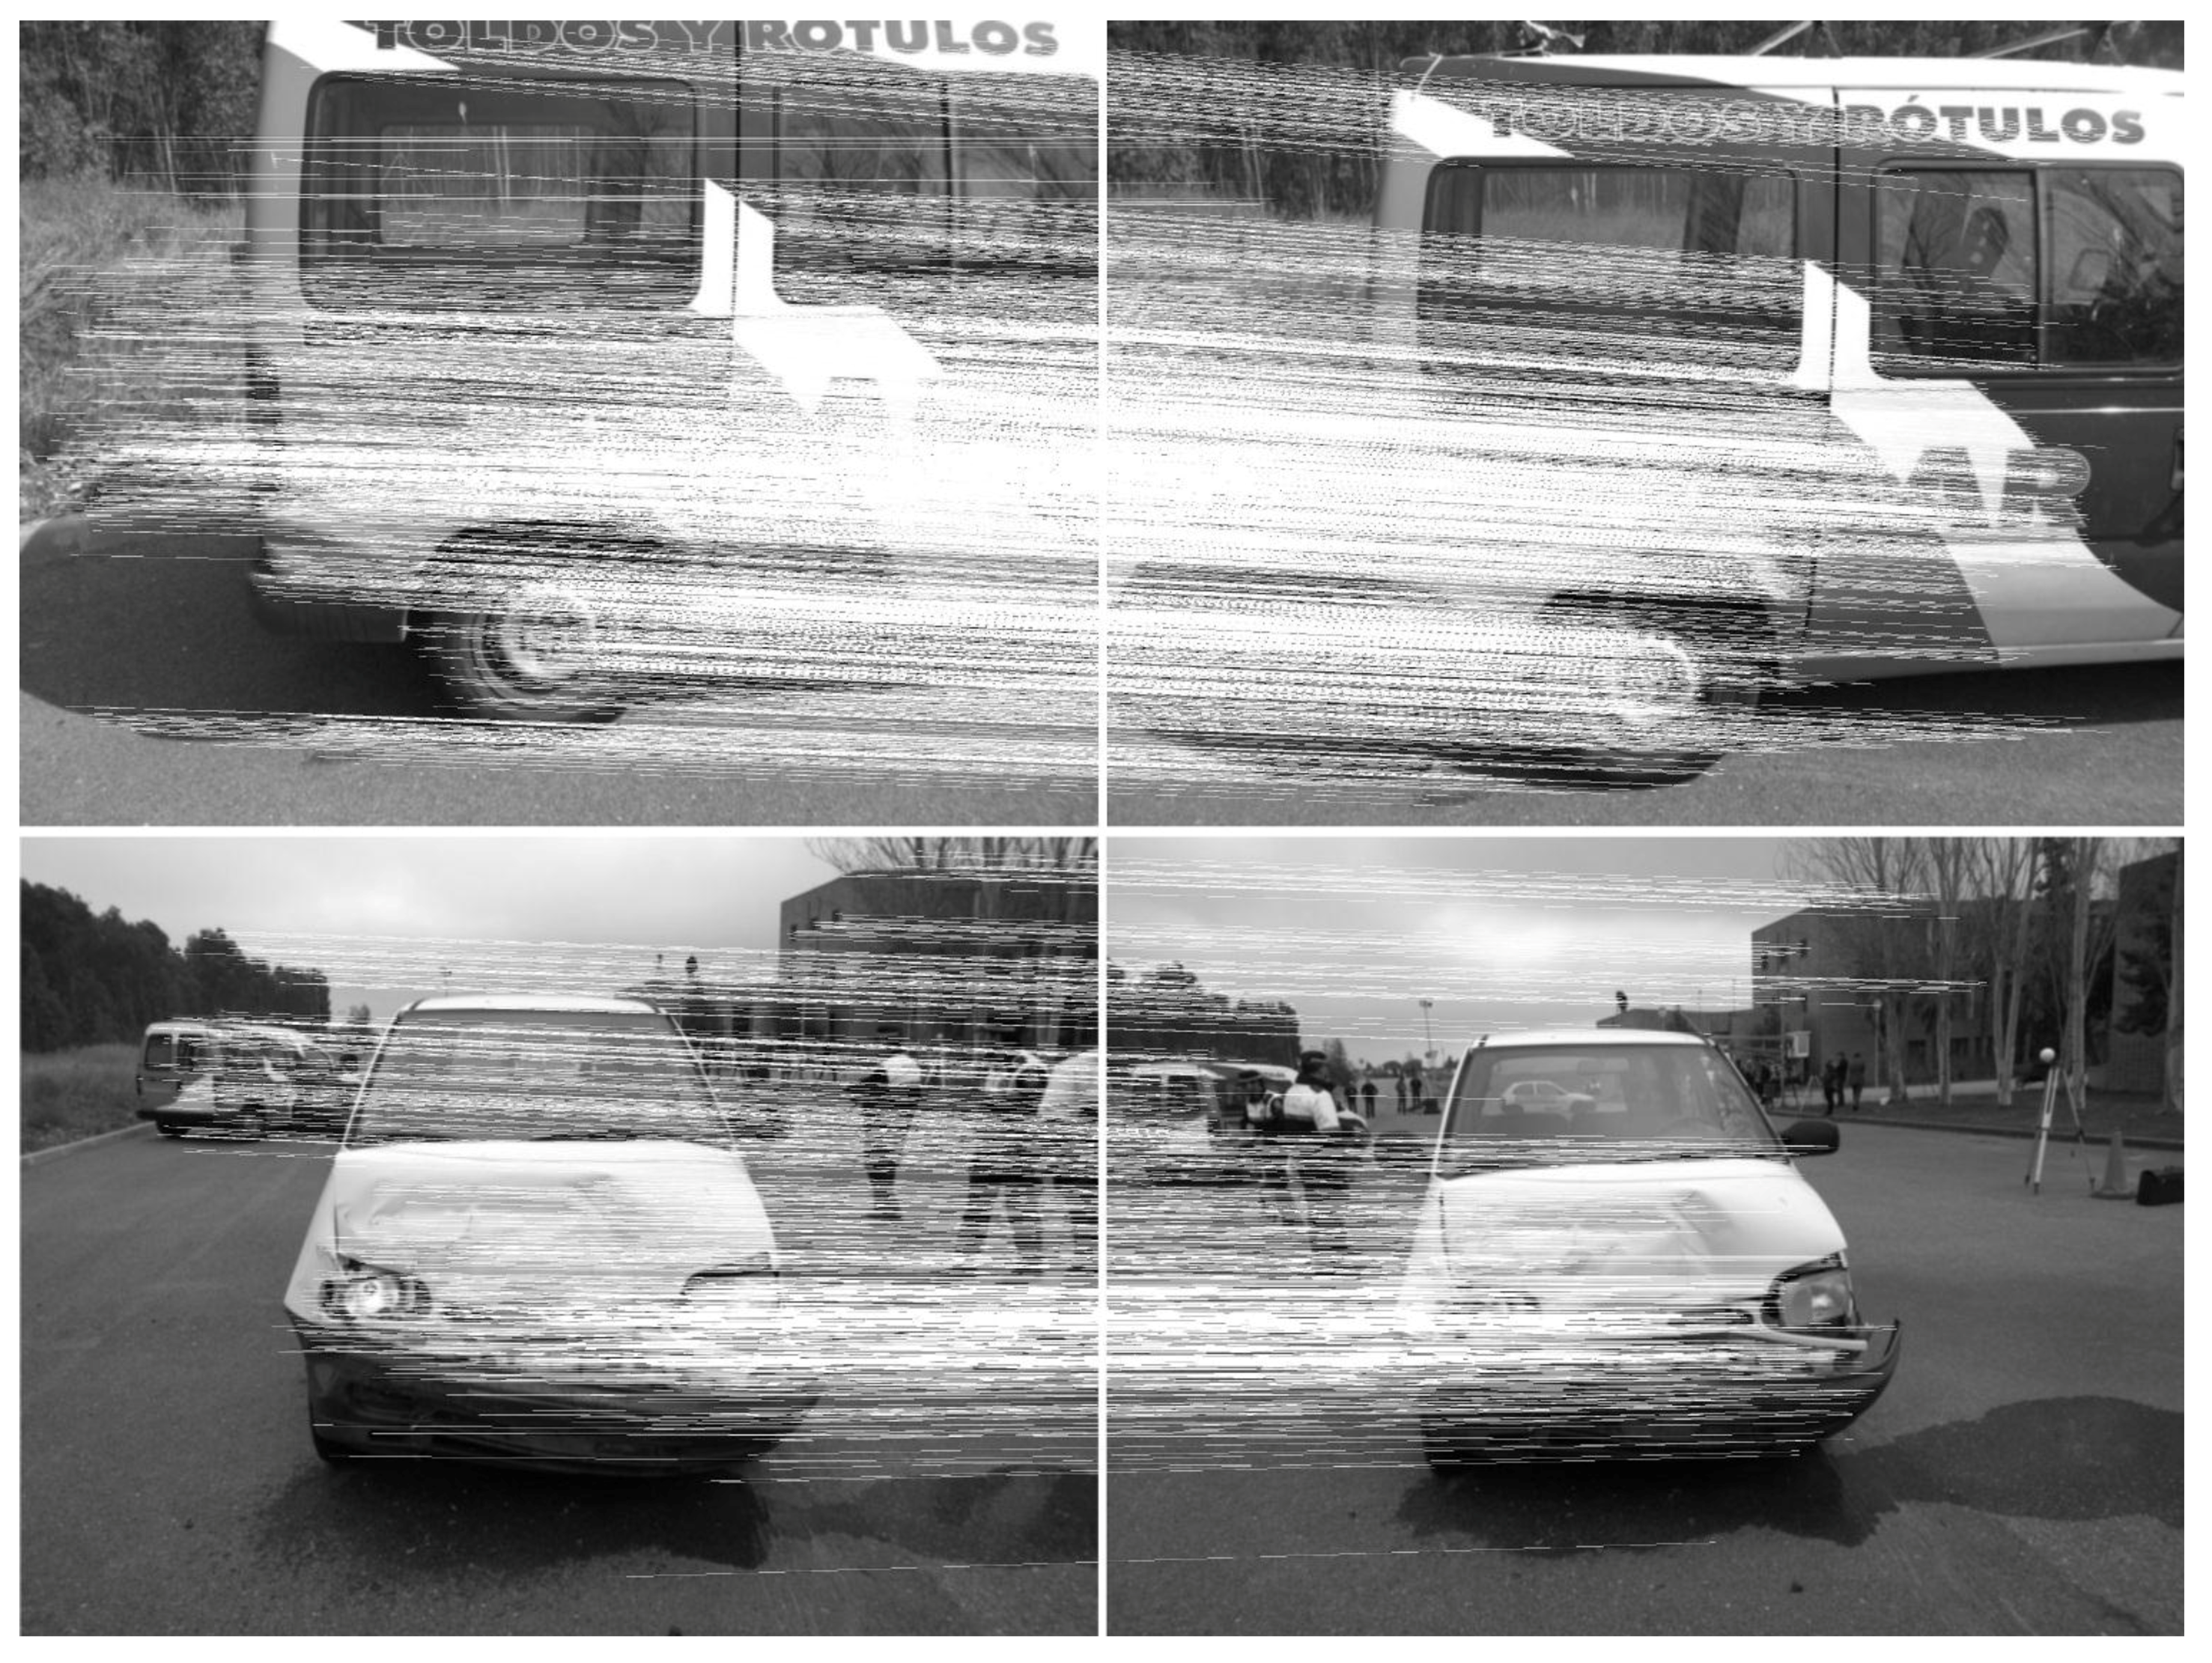
2.3.3. Feature Extraction and Matching

The feature extraction has been carried out by the ASIFT (Affine Scale-Invariant Feature Transform) algorithm [16]. As its most remarkable improvement, ASIFT includes the consideration of two additional parameters that control the presence of images with different scales and rotations. In this manner, the ASIFT algorithm can cope with images displaying a high scale and rotation difference, common in road accident scenes. The result is an invariant algorithm that considers the scale, rotation, and movement between images. The main contribution in the adaptation of the ASIFT algorithm is its integration with robust strategies that allow us to avoid erroneous correspondences. These strategies are the Euclidean distance [17] and the Moisan-Stival ORSA (Optimized Random Sampling Algorithm) [18]. This algorithm is a variant of Random Sample Consensus (RANSAC) [19] with an adaptive criterion to filter erroneous correspondences by the employment of the epipolar geometry constraints. Once the feature points have been extracted and described, the final matching points are assessed based on their spatial distribution on the CCD. An asymmetric distribution (radial and angular) of matching points regarding the principal point, will affect the correct determination of internal camera parameters and also the image orientation. Therefore, if the matching points do not cover an area more than the 2/3 of the CCD format, the user will be alerted in order to modify the detector (ASIFT) and descriptor (SIFT) parameters. Through this quality control we try to minimize those problems associated with the weakness and common deficiencies in the photogrammetric network geometry of road accidents.

2.3.4. Image Orientation and Self-calibration

The data protocol acquisition, which is far from a normal stereoscopic case of classic photogrammetry, will require robust orientation procedures. For this purpose, a combination between computer vision and photogrammetric strategies is used. This combination is fed by the resulting keypoint extracted in the Section 2.3.3. In a first step, an approximation of the external orientation of the cameras was calculated following a fundamental matrix approach [20]. Later, these spatial (X,Y,Z) and angular (ϖ-omega, φ-phi, and χ-kappa) positions are refined by a bundle adjustment complemented with the collinearity condition [21]. In this field, several open source tools have been developed such as Bundler [22] and Apero [23]. For the present case study, both were combined and integrated. In particular, a specific converter has been developed for reading Bundler orientation files (*.out) and computing the three rotation angles and three translation coordinates of the camera in Apero. In addition, a coordinate system transformation has been implemented for passing from the Bundler to the Apero coordinate system.
It is remarkable that at the same time, thanks to the reliability of the photogrammetric procedures used, it is possible to integrate as unknowns several internal camera parameters (focal length, principal point, and radial distortions). This possibility allows the use of non-calibrated cameras and guarantees acceptable results. Nevertheless, for an accurate camera self-calibration the following requirements should be accomplished: a multi-image convergent camera station geometry, a well distributed array of object points throughout the format of the images and the incorporation of orthogonal camera roll angles, and depth changes. Trying to find a balance between an easy-to-use protocol and some approximations to internal camera parameters, a self-calibration strategy supported by a basic calibration model which encloses five internal parameters (focal length, principal point, and two radial distortion parameters) was used [24,25].

2.3.5. Dense Matching

One of the greatest breakthroughs in recent photogrammetry has been exploiting, from a geometric point of view, the image spatial resolution (size in pixels). This has made it possible to obtain a 3D object point of each of the image pixels. Different strategies have emerged in the recent years, such as the Semi-Global Matching (SGM) approach [26] that allows the 3D reconstruction of the scene, in which an object point corresponds with a pixel in the image. These strategies, fed by the external and internal orientations and complemented by the epipolar geometry, are focused on the minimization of an energy function [26]. However, besides the classical SGM algorithm based on a stereo-matching strategy, multi-view approaches are incorporated in order to increase the reliability of the 3D results and to better cope with the case of road accidents (where the images are captured with considerable baselines and perspective). Considering the two types of protocols needed in road accidents (parallel and convergent protocols), two different multi-view algorithms were used. For the parallel protocol, the multi-view MicMac algorithm [27] was used. Meanwhile, for the convergent protocol, the multi-view SURE algorithm [28] was used, which allows a complete reconstruction of the scene.
Finally, a manual stage is required in order to scale the previously-obtained model (making it metric). For this purpose it is necessary to identify one distance, at least in three images, between targets or using specific objects such as the metallic scale bar or the magnetized targets (Figure 1). It could be remarked that performing scaling after dense matching could transmit possible deformations in object space, especially in those linear configurations of cameras (e.g. recording a corridor or the classical single strip in photogrammetry). In our case, the images acquired following both protocols enclosed: (i) redundancy, since at least one object point appears in five or more images; and (ii) robustness, since the geometry provided by the convergent case following a “ring” is less critical. For the parallel case, the reduced area of interest combined with the convergence provided by images at edges could minimize this problem.
The scaled models generated are grouped as follow:
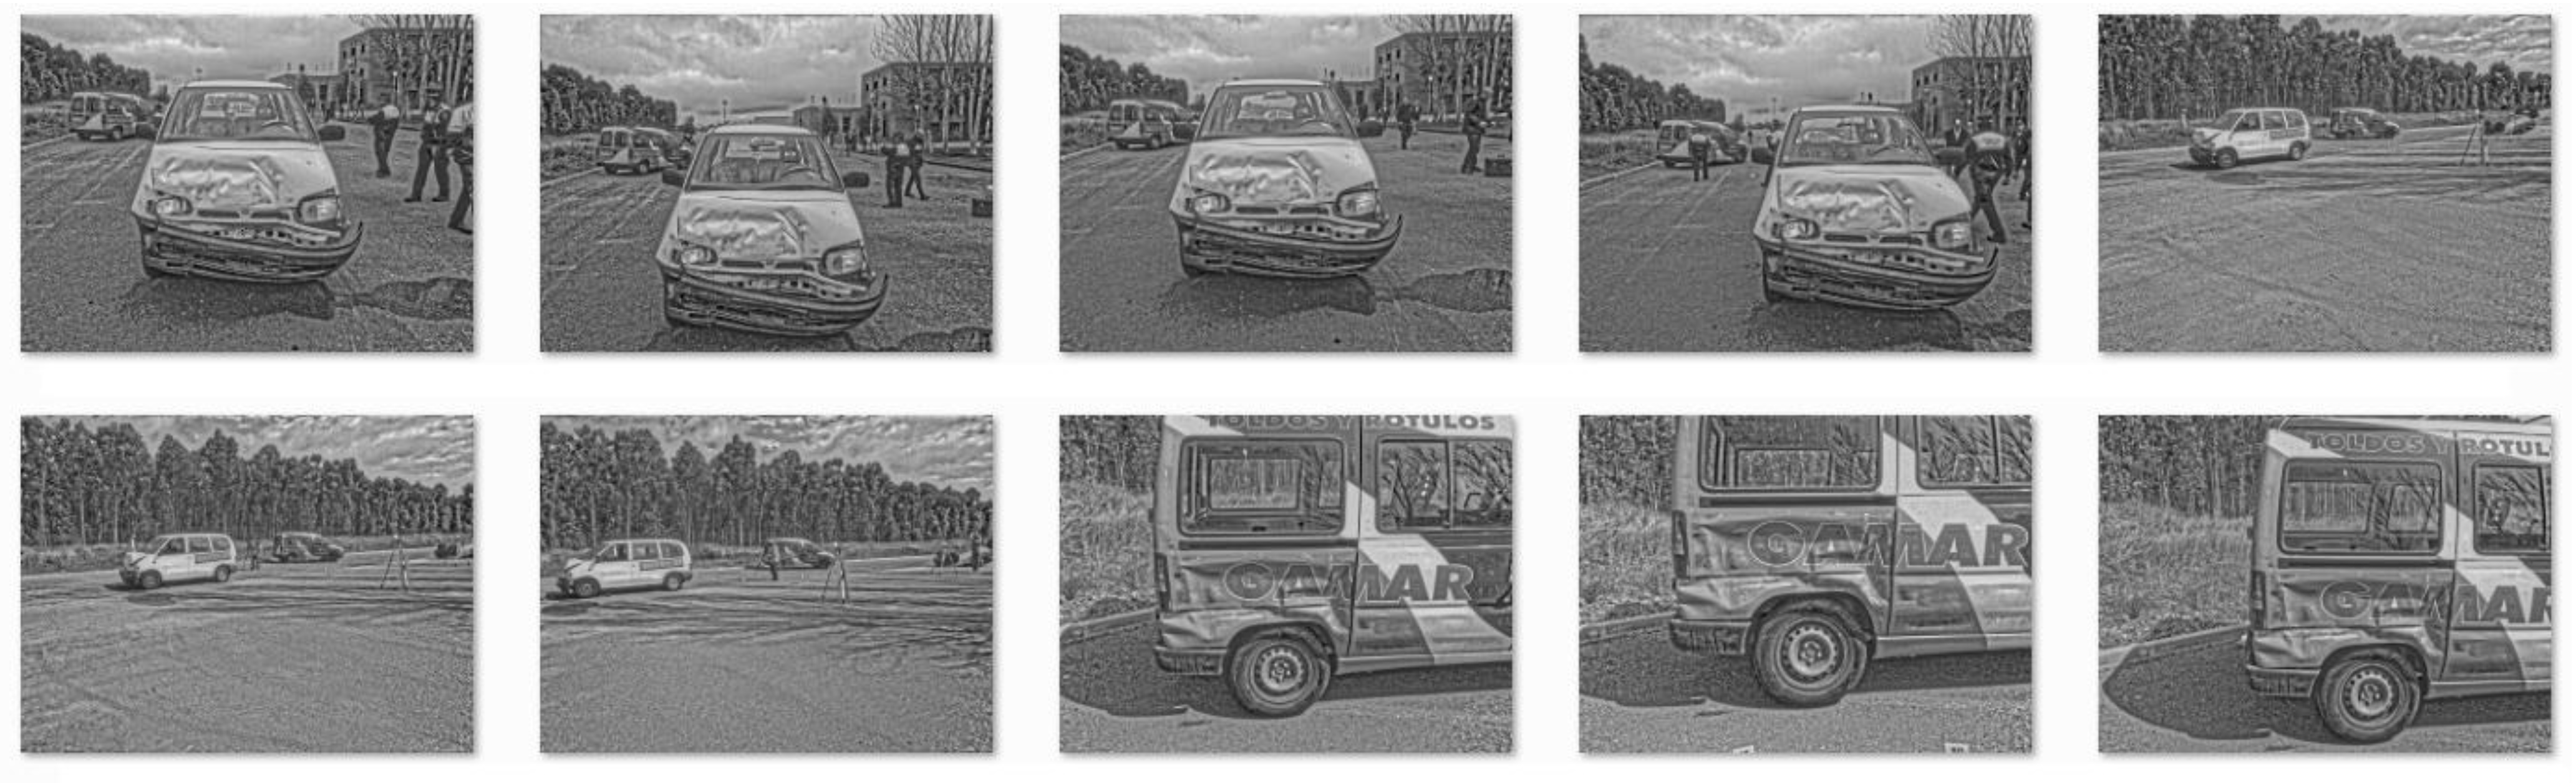
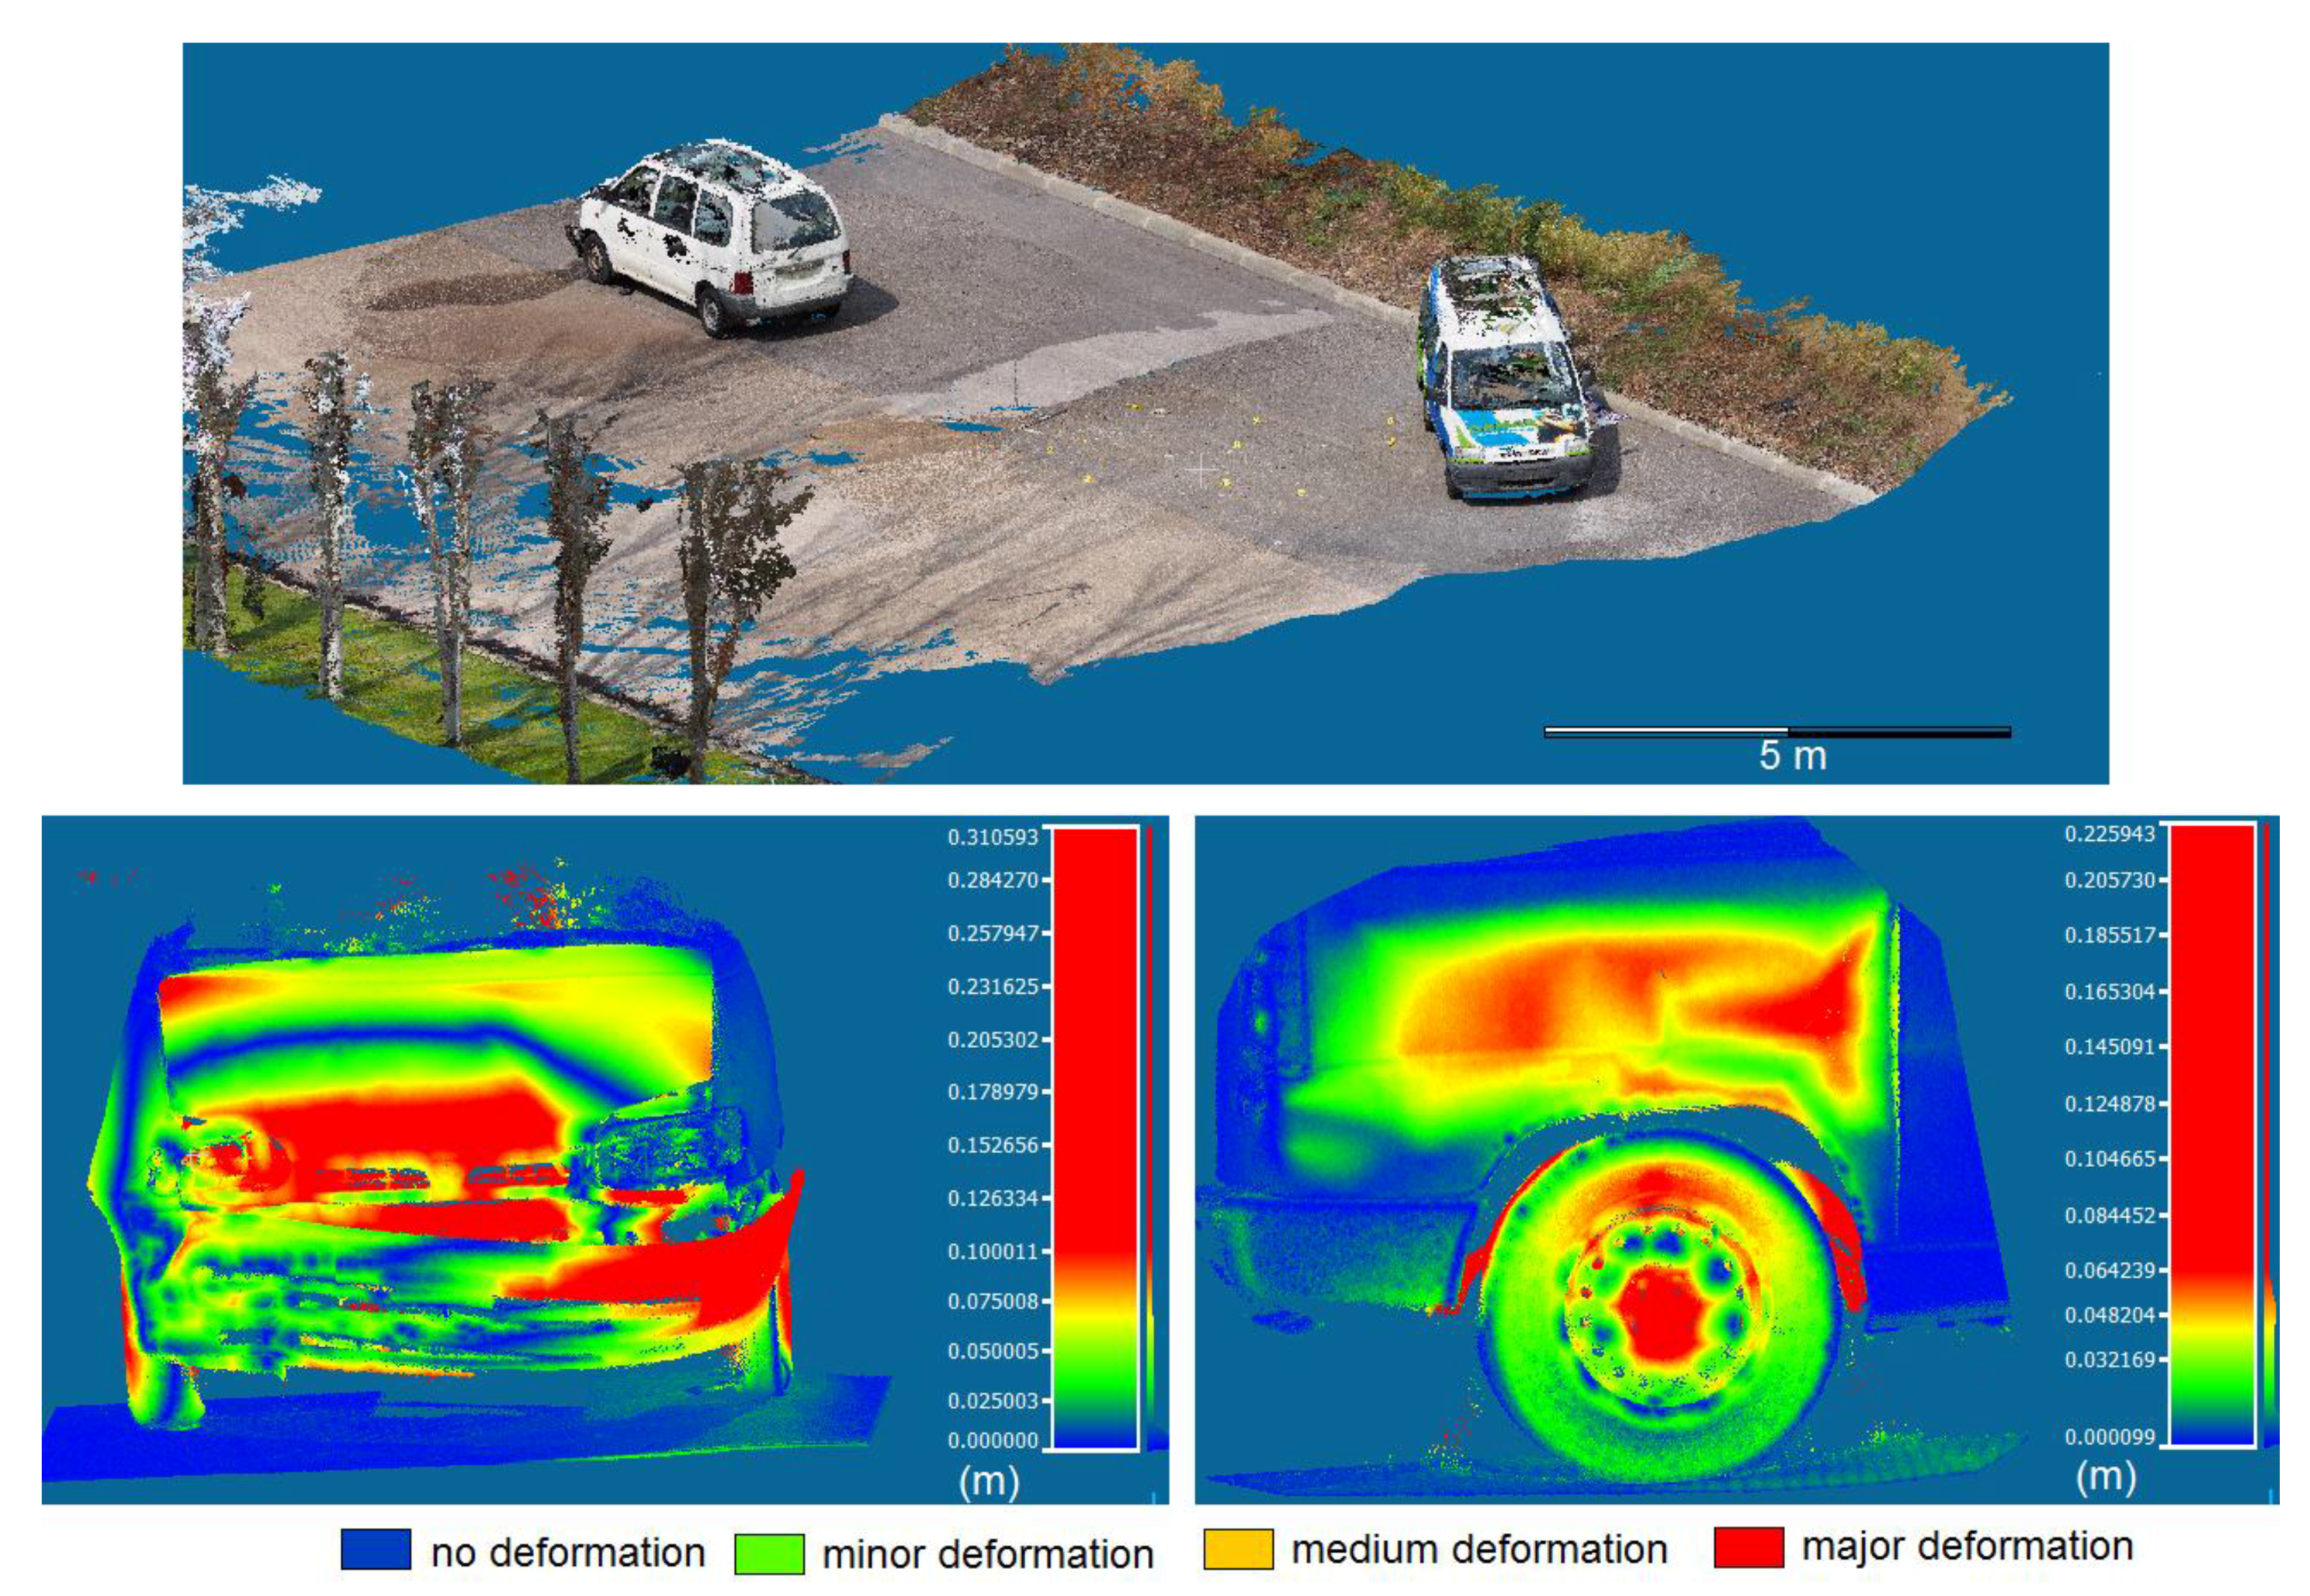
  • Detailed 3D point cloud: the point cloud with high resolution of the damaged areas of the vehicle. This model, which represents the deformation suffered during the crash, is the result of the comparison between the theoretical model (initial model) and the deformed one. The former may be supplied by the vehicle manufacturer or obtained through data collection by measuring undamaged vehicles of the same model (as in this case-study) with the laser scanner.
  • General 3D point cloud: the point cloud which represents the whole accident scenario. This point cloud allows the dimensional analysis of the road accident and the final position of the involved vehicles.

2.3.6. Energy Analysis of the Road Accident

Considering the previously-obtained 3D point clouds (general and detailed point clouds), an energy analysis of the road accident is carried out with the aim to evaluate the impact speeds. For this purpose an analysis of the kinetic energy is performed. This analysis implies the evaluation of different types of energies (e.g. deformation energy absorbed by the vehicle’s bodywork, friction energy, rotational energy, etc.).
The evaluation of the different energies acting on a road accident requires the use of metric information. This metric information can be extracted and evaluated in a simple way thanks to the previously obtained 3D photogrammetric point clouds. The density and photorealistic texture of the point cloud allows the extraction of structural deformations, distances between vehicles, and specific objects or skid marks.
The classical approach for estimating the structural deformation of the vehicle requires the use of several manual measurements with a constant height and equidistance between them using a measuring tape. For the present study case, these measurements were extracted from the detailed 3D point cloud computed (deformation map).
Later, the deformation energy was evaluated through the Prasad’s method [29,30]. This method, considered as a reformulation of the McHenry method [31], relates the power developed during the impact with the structural deformation of the vehicle (Equation (1)).
E d = L i [ i = 1 n ( d 0 2 2 ) + i = 0 n [ ( d 0 d 1 [ c i c i 1 2 + c i 1 ] ) + i = 1 n d 1 2 2 ( ( c i c i 1 ) 2 3 + c i 1 2 + ( c i + 1 c i 1 ) c i 1 ) ] ]
where L is the length of the affected area during the impact, Ci the resulting deformation values, measured in perpendicular directions to the impact and at constant distances. The rigidity coefficients, d0 and d1, are extracted from the tables defined by the NHTSA (National Highway Traffic Safety Administration), according to the vehicle data sheet and the impact.
Complementary to this energy analysis, a force and directional analysis was carried out. As a result, a complete spatial definition (with spatial and angular position) of the different vehicles involved in the accident can be generated. In this sense, the general 3D reconstruction, obtained by the proposed methodology, allows the extraction of essential and basic measurements for accident evaluation.

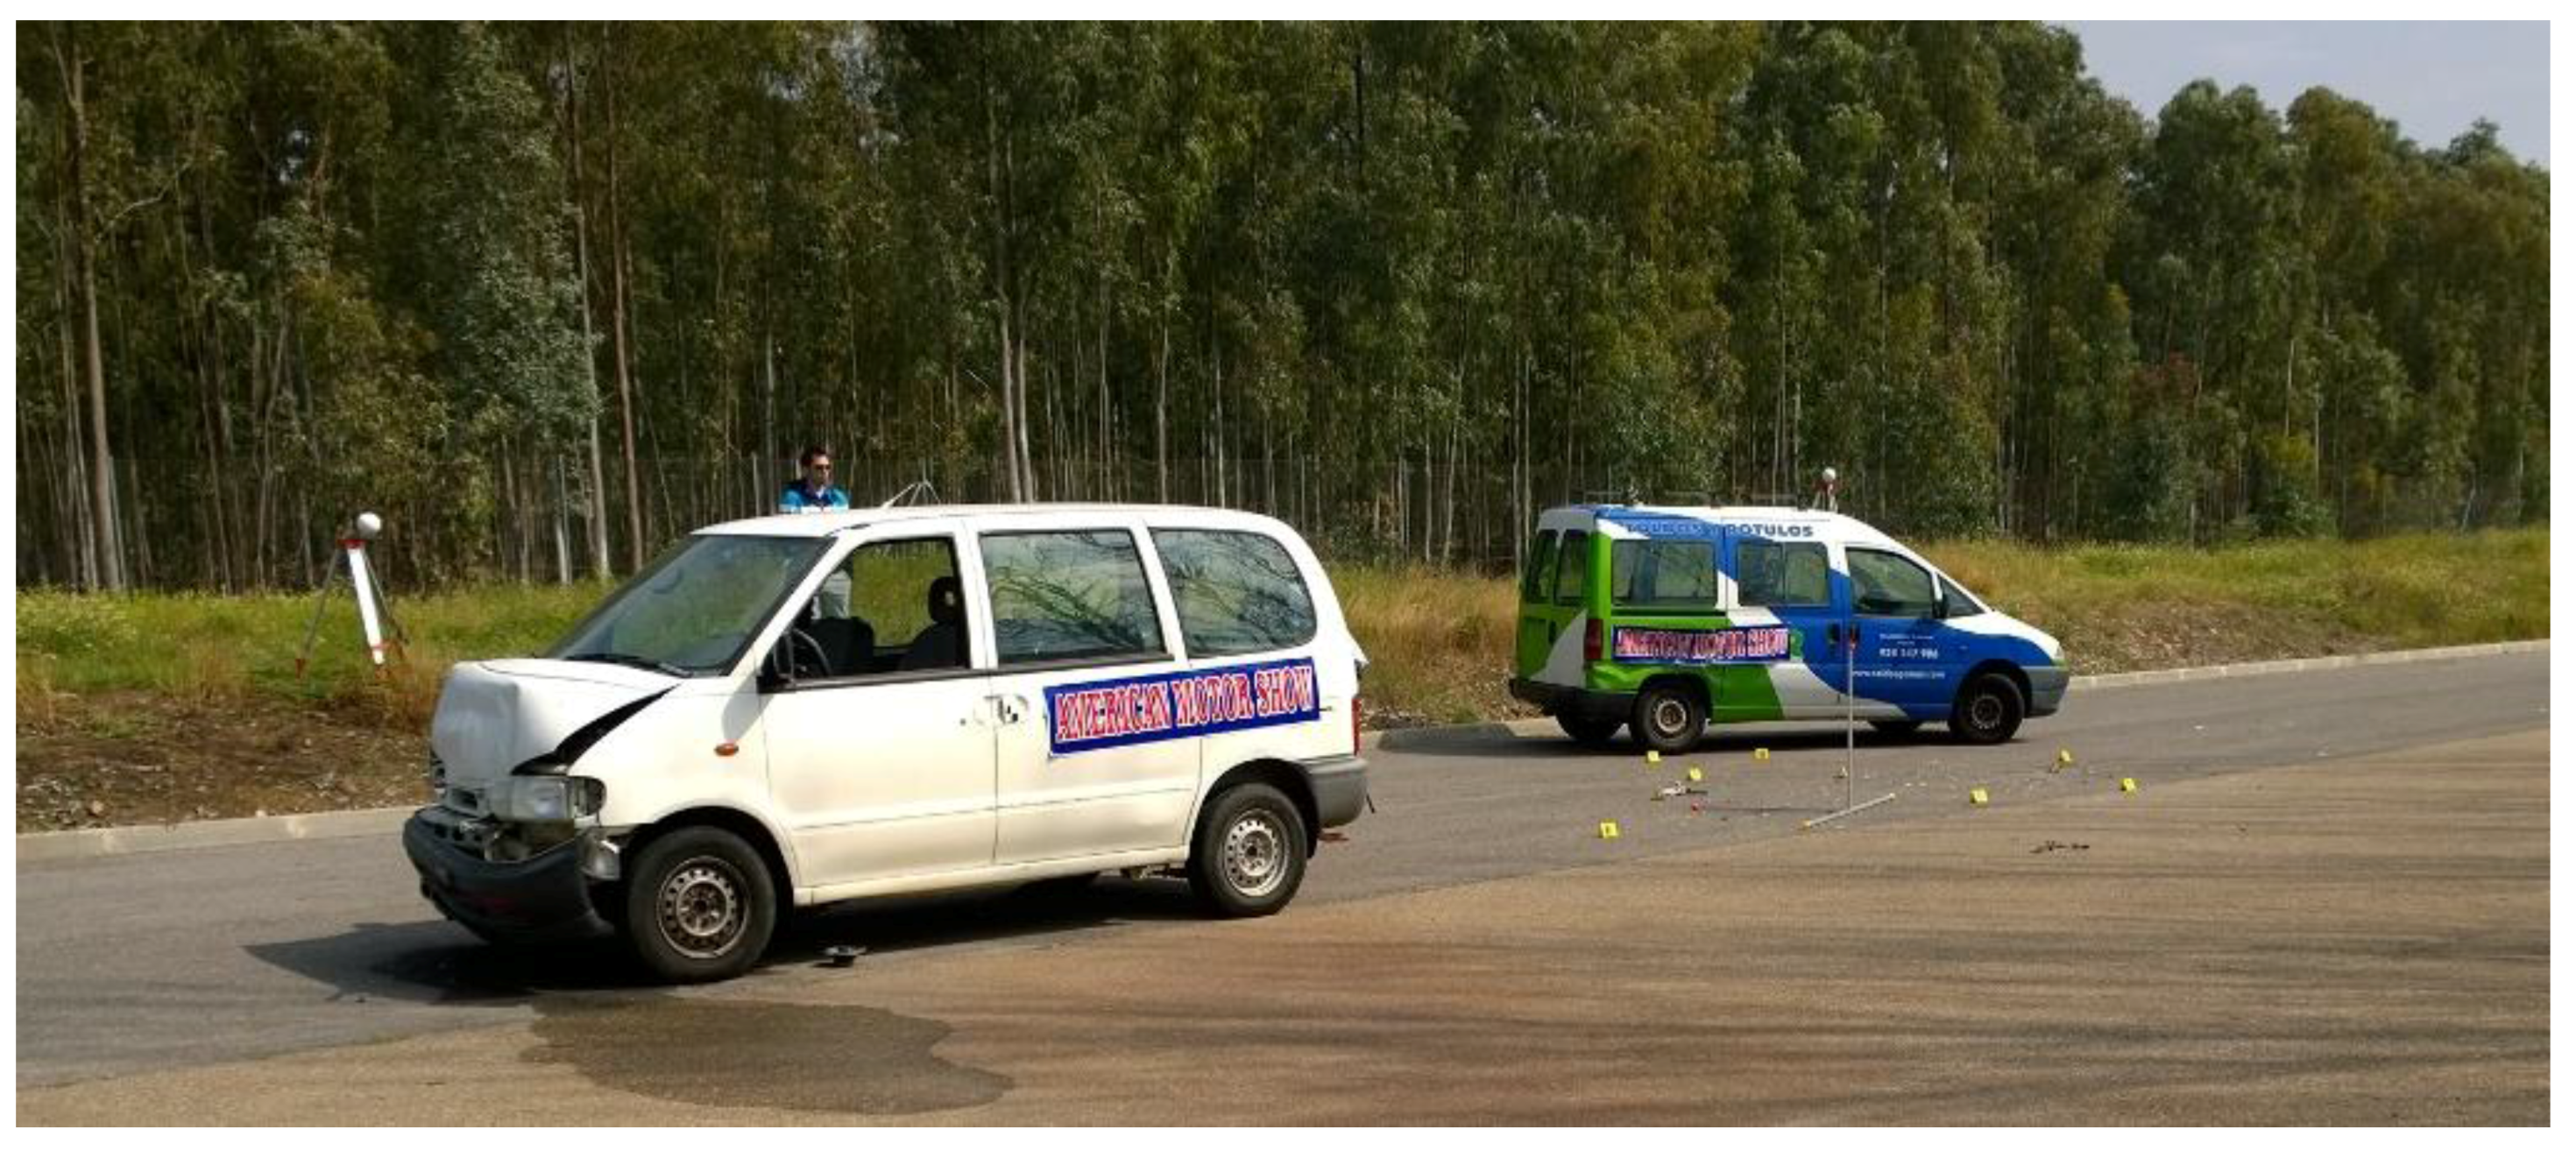
3. Experimental Results

With the aim to validate the presented methodology, a study case was evaluated in the facilities of the Public Security Academy of Extremadura (APEX), Badajoz (Spain) in March 2014. This road accident was materialized by expert agents and confiscated vehicles (property of the local police of Extremadura). Complementary to the image acquisition, a video was recorded during the accident [32].

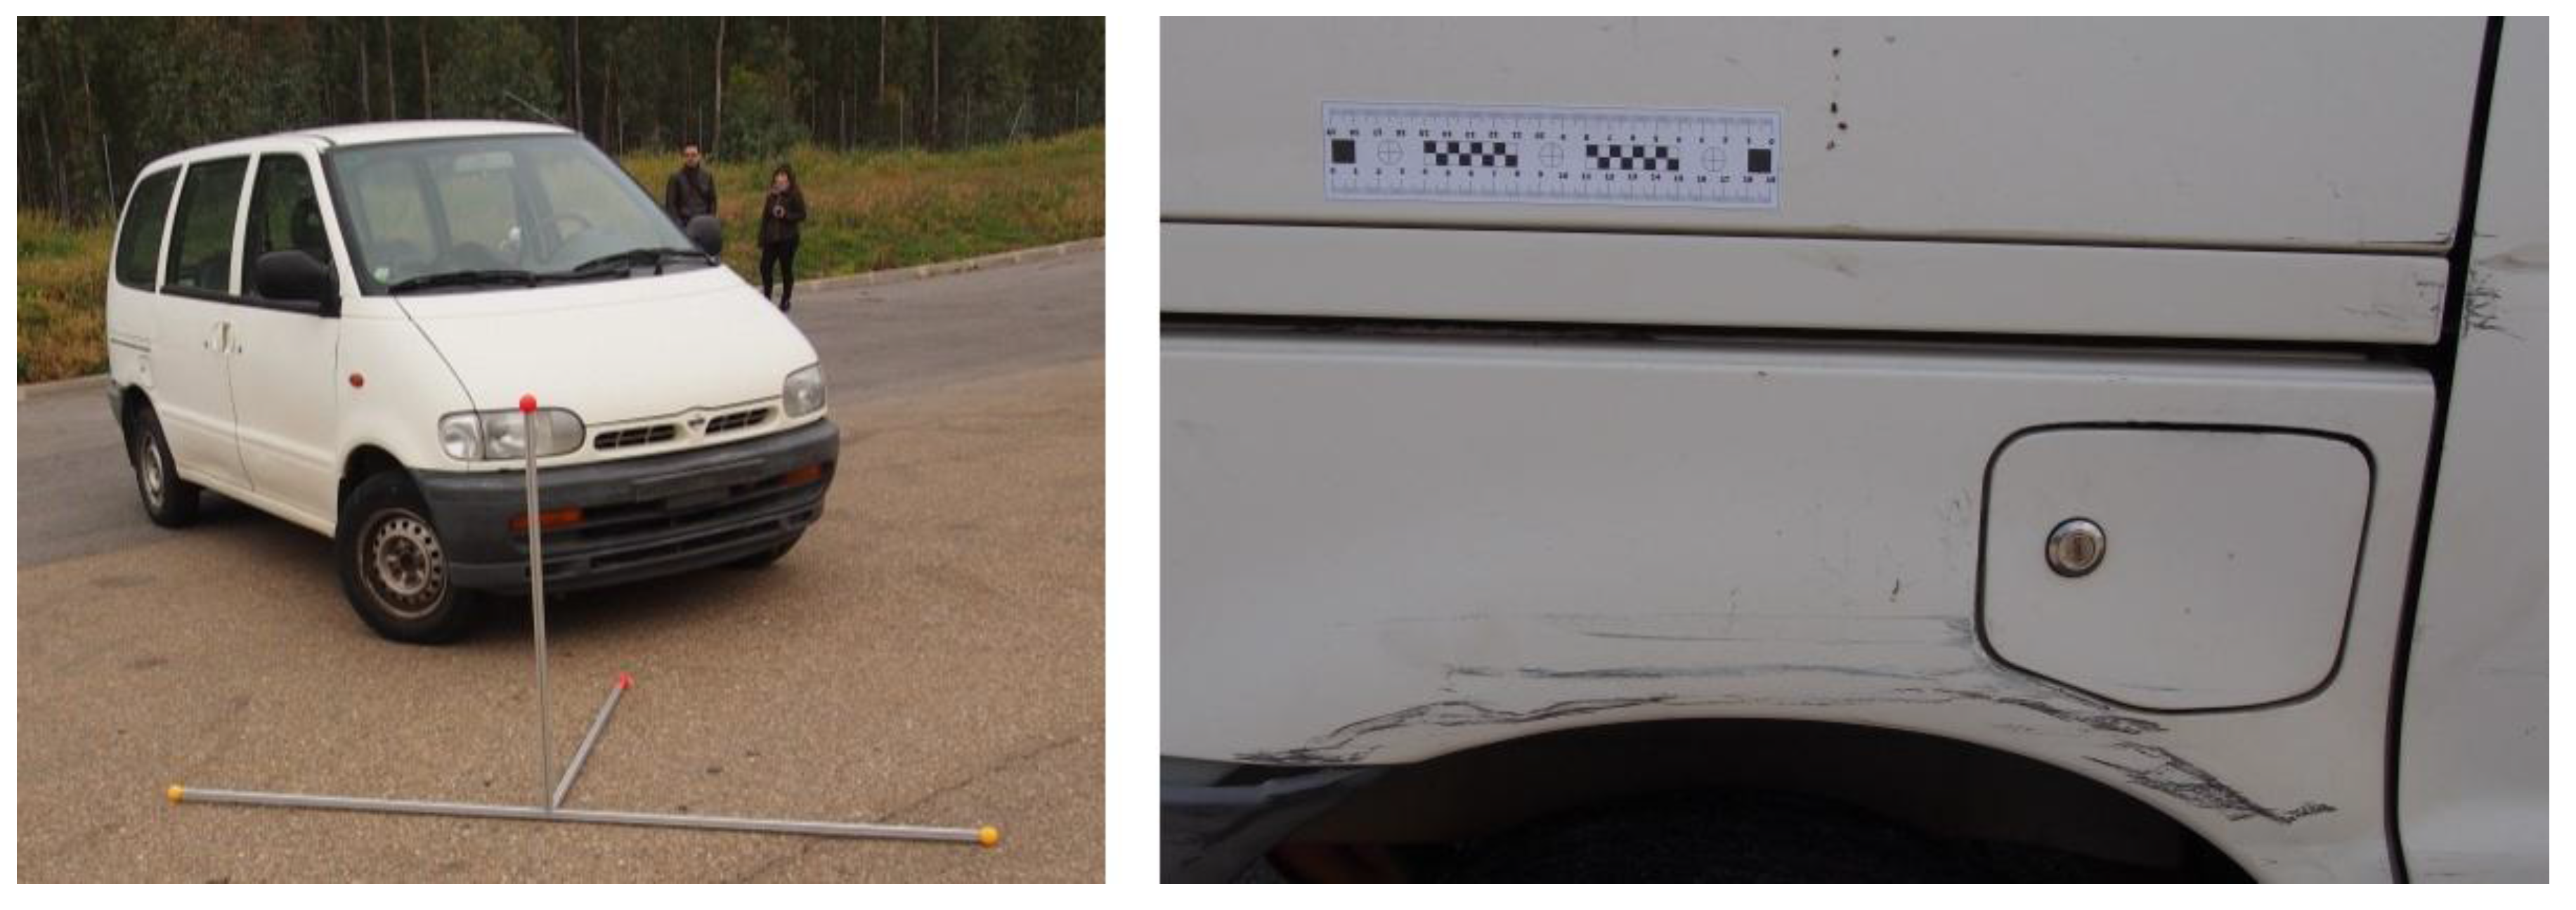
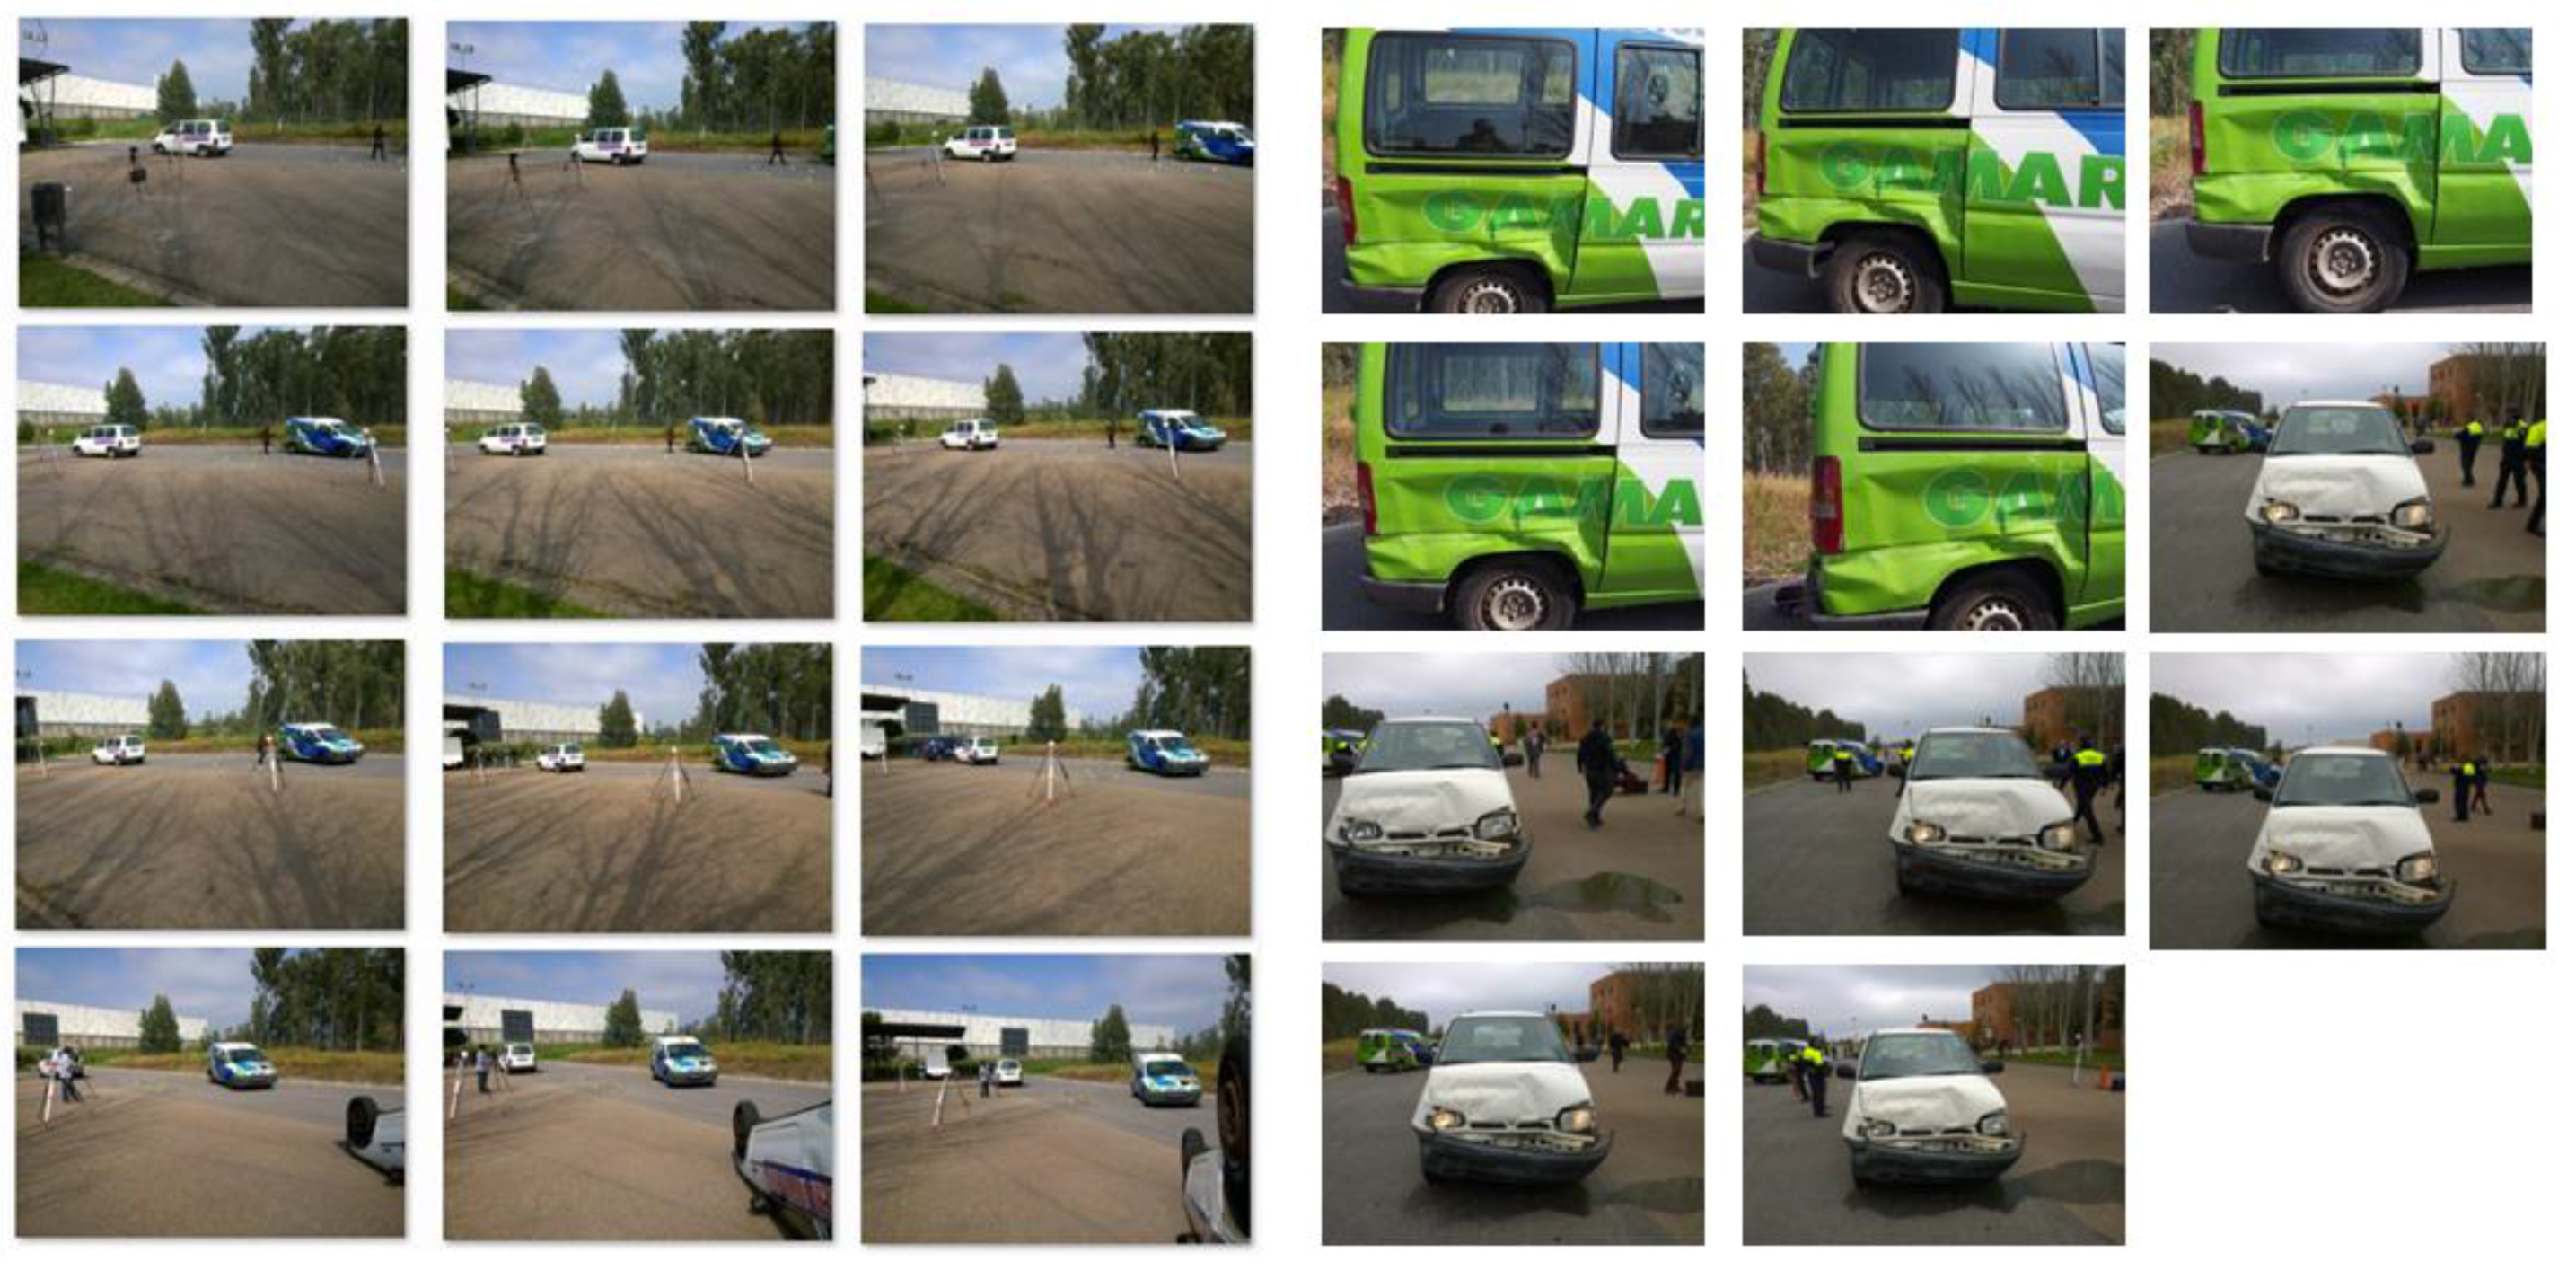
3.1. Data Acquisition Protocol

During the simulated accident, two vehicles were used: a Nissan Serena 1.6 SLX and a Fiat Scudo Combi, whose technical specifications are shown in Table 3. The accident was a frontal crash of the Nissan Serena against the side of the Fiat Scudo, which was placed motionless in a fixed position. After the collision between the vehicles, they both moved to their final positions, shown in Figure 4. The direction of the main impact force was straight without angular components, as shows the video [32].
Table 3. Properties and category of the used vehicles in the simulated accident.
VehicleWheelbaseLengthWidthTrackWeightNHTSA Category
Nissan Serena SLX2.735 m4.320 m1.695 m1.463 m1480 kg3
Fiat Scudo Combi3.000 m4.800 m1.900 m1.574 m1722 kg4
The data acquisition, following the protocol detailed in Section 2.3.1, was divided in two groups (Figure 5): (i) a general model, with a total of 65 images captured by the Olympus EPM-2 camera, which represents the complete accident scenario, considering the convergent protocol; and (ii) detailed models of the vehicles (in the impact area), acquired through the Smartphone Nokia Lumia 1020; following a parallel protocol. There was no special reason for using these sensors, just the interest of the local police to use consumer-grade digital cameras. Regarding data acquisition time, approximately 10 min were required to acquire the whole dataset of images.
Figure 4. Final position of the crashed vehicles involved in the simulated accident. It can be appreciated (between both cars) the metallic scale bar used for providing metric capabilities to the photogrammetric reconstruction.
Remotesensing 07 15161 g004

3.2. Photogrammetric Processing

The originality of the method lies in the energy analysis of road accidents using dense point clouds generated from photogrammetry 3D modeling. Considering this, only the most significant photogrammetric steps will be described.
Firstly, the captured images were pre-processed through the Wallis filter using as input parameters: (i) 0.5 for the contrast; (ii) 1 for the brightness; (iii) a standard deviation of 50; and (iv) a kernel size of 2%, which depends on the image radius. As a result a new image set was obtained (Figure 6).
Figure 5. (Left) Images captured with the consumer-grade digital camera Olympus EPM-2 following a convergent protocol. (Right) Images obtained through a Nokia Lumia 1020 smartphone with a parallel protocol.
Remotesensing 07 15161 g005
Figure 6. Results obtained for the Wallis filter.
Remotesensing 07 15161 g006
Later, during the keypoint extraction and matching, a total of 500 points were matched with a 35% of outliers for the convergent protocol (general model). Meanwhile, for the parallel protocol (detailed models), 1700 keypoints were matched with a 17% of outliers for the Nissan Serena and 2900 keypoints were matched with a 10% of outliers for the Fiat Scudo. Some keypoints and matching results are outlined in Figure 7.
There are a notably higher number of outliers (35%) for the general point clouds in comparison to the detailed ones (17% and 10%). This higher number of outliers for the general point cloud is due to the complexity of the scene, which involves the background as well as several objects and people in movement (e.g. police officers). It is also remarkable that the reconstruction of the Nissan Serena 3D point cloud displayed a higher number of outliers (17%) with a lower number of extracted keypoints (1700) in comparison to the Fiat Scudo 3D point cloud (with a 10% and a 2900 respectively). This phenomenon is related with the surface captured, being more homogenous and adverse in the first case.
Figure 7. Keypoint extraction and matching through the ASIFT detector and the SIFT descriptor.
Remotesensing 07 15161 g007
Concerning the external orientation, a standard deviation of 0.64 pixels was obtained for the convergent protocol, whereas 1.09 pixels and 0.80 pixels were obtained using the parallel protocol for the Nissan Serena and for the Fiat Scudo, respectively. It is worth noting that a worse adjustment was obtained for the Nissan Serena due to its previously-described unfavorable radiometric properties together with its weak geometry (five images with less convergence than those acquired for the Fiat Scudo). Additionally, the adjustment of the general model (with more complexity) has obtained remarkably better results than those obtained for the detailed models due, in part, to the quality of the camera (Olympus EMP-2 versus Nokia Lumia 1020) and the better geometry of the convergent network. Both sensors were self-calibrated following a basic calibration model where internal parameters such as focal length, principal point and radial (K1 and K2) distortion were introduced in the adjustment. In order to check the validity of the calibration model, we have performed several self-calibration tests comparing also different calibration models using rotated and non-rotated images, obtaining non-significant differences in terms of accuracy of the final photogrammetric model.
Once the external orientation of the cameras (bundle adjustment) was obtained, it is possible to reconstruct the scene of the accident through the dense matching strategy defined in Section 2.3.5. As a result, a dense 3D point cloud was obtained for the scene (general point cloud) and for the damage areas (detailed point clouds) (Figure 8). Regarding the spatial resolution, the general point cloud shows a density of approximately twice the Ground Sample Distance (GSD) of the Olympus camera (10mm), with a total number of 3,815,302 points. Furthermore, the detailed point clouds show a similar density (two times the GSD of the smartphone camera) with a value of 1.4 mm and a total of 531,700 points for Nissan Serena and 800,006 points in the case of Fiat Scudo. Both GSD were always referred to the cars. In the convergent case car positions represent more or less the centroid of the ring, whereas in the parallel case they represent the interest part for the deformation maps estimation.
Regarding the scaling, two different objects were used for providing metric results: (i) a magnetized target (20 cm) used for scaling the detailed point clouds of the damages; (ii) a metallic scale bar (1 × 1 × 1 m) used for scaling the general scene of the accident. Figure 4 shows the location of the metallic scale bar. Just, one scale bar was used for the scaling although several artificial targets (yellow targets in Figure 4) were put around the scene in order to check the scaling accuracy.
Figure 8. 3D point clouds obtained by the proposed methodology. (Top) General point cloud performed with a convergent protocol. (Bottom) Detailed deformation point cloud reconstructed with a parallel protocol.
Remotesensing 07 15161 g008
The accuracy of the proposed methodology was contrasted with the data provided by a terrestrial laser scanner (Faro Focus 3D). The scans were acquired with a resolution of 3 mm for an average distance of 10 m seven scans were required to cover the whole road accident (including detailed damages). Each scan was setup with RGB color requiring five minutes per scan, so more than 45 min were required to complete the scene. This evaluation was carried out through a comparison of different measurements around the general point cloud (using previously placed yellows targets) and an analysis of the vehicles deformations. As a result, average discrepancies around 2 cm were obtained for the general point cloud, whereas average discrepancies of 5 mm were obtained for the vehicles deformations.
It is remarkable that the scaling procedure (required for the photogrammetric point cloud) depends on the user’s skill, yielding greater errors than the GSD. Nevertheless, the discrepancy values obtained in both analyses (general point cloud and deformation maps) could be considered valid for the energy analysis of road accidents.
Validated the results, the previously obtained point clouds and their deformations maps were used for the energy analysis of the road accident. This analysis allows the evaluation of the different energies involved in the study (i.e. deformation, rolling resistance, and rotational energies).

3.3. Energy Analysis of the Accident

It is observed that the evaluation of the impact speed (Nissan Serena vehicle), based on the skid marks approach, was not possible since there are not evidences of them on the scenario. According to this, a complementary procedure was used, based on the kinematic energy during the accident. This approach evaluates three types of energy, namely: (i) deformation energy, Ed, absorbed by the vehicles involved in the accident; (ii) rolling resistance energy, Err, needed to stop the Nissan Serena; and (iii) rotational energy, Er, needed to move the Fiat Scudo until its final position.
For the evaluation of the absorbed energy through the structural deformation suffered by the involved vehicles, the Prasad method described in Section 2.3.6 was used. The values of the unknowns L and Ci (Equation (1)) have been obtained from the 3D deformation point clouds. Thanks to the accuracy of the deformation point clouds, it was not necessary to establish a reference line with complementary measurements (which is a common step in the classical Prasad’s approach). The results are shown in the following Table 4.
Table 4. Energy deformation results.
VehicleLC1C2C3C4C5C6d0d1Ed
Nissan Serena SLX1.62 m0.05 m0.1 m0.12 m0.11 m0.05 m0.03 m89.31621.1614011.56 J
Fiat Scudo Combi1.05 m0.02 m0.04 m0.06 m0.05 m0.06 m0.03 m42.64586.943787.23 J
For the analysis of the Nissan Serena rolling resistance energy (Err), the following Equation (2) was applied.
E r r m  ·  g  ·  d  ·  c r r
where m is the vehicle mass, g the gravity, d the distance covered by the vehicle after the impact and crr the rolling resistance coefficient.
It is remarkable that, in cases where the skid marks do not exist, the application of the rolling resistance coefficient replaces the friction coefficient, since friction coefficient refers to two surfaces which slide between them (as occurs in cases where the wheel is blocked).
For the present case study and, thanks to the density and accuracy of the obtained 3D point cloud (Figure 8 top), it is possible to evaluate the distance covered by the vehicle (Nissan Serena) after the impact, obtaining a value of 16 m.
Considering the obtained results and the technical data of the vehicle (Nissan Serena) (Table 3), it is possible to determine the rolling resistance energy, Err, with a value of 6969.02 J.
In order to evaluate the rotational energy, Er, of the Fiat Scudo the Equation (3) was applied, which considers the eccentric forces acting on the vehicle:
E r = m g ( μ ± p ) α 1 2 b
where m is the vehicle mass, g the gravity, µ the coefficient of adhesion, p the road slope expressed in parts per unit, α the rotational angle of the vehicle (in radians), and b the vehicle wheelbase.
In this case, a vehicle turning angle of 121º has been determined using the general 3D point cloud. The road slope is 0%. The coefficient of adhesion between tires and asphalt (in normal circumstances) is 0.6. Based on these values and considering the technical data of the Fiat Scudo, shown in Table 3, the rotational energy, Er, determined was 32107.50J.
Through the previously evaluated energies, it is possible to obtain the impact speed, Vi, of the Nissan Serena, as the sum of the calculated energies (Equation (4)).
V i = 2 ( E d + E r + E g ) m
where the impact speed, Vi, is a result of the correlation between deformation, rolling resistance and rotational energies (previously obtained) and the vehicle mass.
According to the previously obtained values, the vehicle had an impact speed of 31.55 km/h. This computed speed was compared with the actual impact speed recorded and reported by the Local Police in the expert report being of 32 km/h.

4. Conclusions

This article shows the potential offered by the combination of photogrammetric procedures and energy analysis in the evaluation of road accidents, which usually exhibit geometric and radiometric complexity from a photogrammetric point of view. In relation to the former the network configuration of the cameras together with the object points used to provide weakness for cameras orientation. In relation to the latter, the different illumination conditions and the car texture could weaken the matching results. The proposed methodology guarantees automatism (in the 3D point cloud reconstruction), flexibility (feasible with conventional non-calibrated cameras and smartphone sensors), accuracy (with more precise results that those obtained by classical procedures). In order to validate the methodology, it was applied in a simulated case study. It is worth mentioning that the presented strategy is being used by the local police of Salamanca through a research agreement. One of the most representative contributions of this paper is the integration of photogrammetric results (by means of distances, angles and deformations) with dynamic analysis of road accident parameters (especially speed impact). To this end, metric deformation maps have been generated based on photogrammetric point clouds which exhibit the degree of deformation, very useful for consideration in the Prasad method described in Section 2.3.6.
Further investigations regarding experimental tests will be focused on including a low-cost device that monitors the acceleration and speed of the vehicle, as well as to test the approach proposed at night time using artificial light. Regarding the photogrammetric method a clear future milestone will be the improvement of the scaling procedure (which is strongly influenced by the user’s skill) through the use of recognition algorithms for the identification of artificial targets and the metallic scale bar. This should help to develop an automatic procedure able to obtain 3D point clouds with metric properties. Furthermore, the future use of point cloud filters will be considered with the aim of reducing the noise of the obtained 3D point cloud in cases where the vehicles exhibit highly specular surfaces or variable reflections.

Acknowledgments

This work has been partially supported by the CISE, Security Institute of the University of Salamanca and the Security Academy of Extremadura, APEX (Badajoz, Spain) through the project “3D Reconstruction of Traffic Accidents”. Also authors want to give thanks to Konrad Wenzel and nFrames company for providing a demo license of SURE in order to perform this research.

Author Contributions

All of the authors conceived of and designed the study. Diego Gonzalez-Aguilera setup the case of study and proposes the photogrammetric methodology. Alejandro Morales performs the energetic analysis of the road accident defined in the article. Miguel A. Gutiérrez and Alfonso I. López study the road accident numerically and also contributes in the experimental campaign. Diego Gonzalez-Aguilera, Alejandro Morales, Miguel A. Gutiérrez and Alfonso I. López write the manuscript.

Conflicts of Interest

The authors declare no conflict of interest.

References

  1. Pérez Rodríguez, M.U.; Sabucedo Álvarez, J.A.; Martínez Cárdenas, J.G. Investigación y Reconstrucción de Accidentes: La reconstrucción práctica de un accidente de tráfico. Secur. Vialis 2011, 3, 27–37. [Google Scholar] [CrossRef]
  2. Sánchez Ferragut, A.; Díaz Sánchez, J.L. La Reconstrucción de Accidentes de Tráfico desde el punto de vista policial. Cuadernos de la Guardia Civil 2004, 31, 109–118. [Google Scholar]
  3. Carballo, H. Pericias Tecnico-Mecanicas; Ediciones Larocca: Buenos Aires, Argentina, 2005. [Google Scholar]
  4. Luhmann, T.; Robson, S.; Stephen, K.; Harley, I. Close Range Photogrammetry Principles, Methods and Applications; Whittles Publishing: Scotland, UK, 2006. [Google Scholar]
  5. González-Aguilera, D.; Muñoz-Nieto, A.; Rodríguez-Gonzalvez, P.; Mancera-Taboada, J. Accuracy assessment of vehicles surface area measurement by means of statistical methods. Measurement 2013, 46, 1009–1018. [Google Scholar] [CrossRef]
  6. Du, X.; Jin, X.; Zhang, X.; Shen, J.; Hou, X. Geometry features measurement of traffic accident for reconstruction based on close-range photogrammetry. Adv. Engin. Softw. 2009, 40, 497–505. [Google Scholar] [CrossRef]
  7. Fraser, C.S.; Hanley, H.B.; Cronk, S. Close-range photogrammetry for accident reconstruction. Opt. 3D Meas. VII 2005, 2, 115–123. [Google Scholar]
  8. Fraser, C.S.; Cronk, S.; Hanley, H.B. Close-range photogrammetry in traffic incident management. In Proceedings of the International Archives of the Photogrammetry, Remote Sensing and Spatial Information Sciences, Beijing, China, 3–11 July 2008; pp. 125–128.
  9. Hattori, S.; Akimoto, K.; Fraser, C.; Imoto, H. Automated procedures with coded targets in industrial vision metrology. Photogramm. Engin. Remote Sens. 2002, 68, 441–446. [Google Scholar]
  10. Han, I.; Kang, H. Determination of the collision speed of a vehicle from evaluation of the crush volume using photographs. Proc. Inst. Mech.Engin. Part D: J. Automob. Engin. 2015. [Google Scholar] [CrossRef]
  11. Poole, G.; Venter, P. Measuring accident scenes using laser scanning systems and the use of scan data in 3d simulation and animation. In Proceedings of the 23rd Southern African Transport Conference, Pretoria, South Africa, 12–15 July 2004; pp. 377–388.
  12. Buck, U.; Naether, S.; Braun, M.; Bolliger, S.; Friederich, H.; Jackowski, C.; Aghayev, E.; Christe, A.; Vock, P.; Dirnhofer, R.; et al. Application of 3D documentation and geometric reconstruction methods in traffic accident analysis: With high resolution surface scanning, radiological MSCT/MRI scanning and real data based animation. Forensic Sci. Int. 2007, 170, 20–28. [Google Scholar] [CrossRef] [PubMed]
  13. Buck, U.; Naether, S.; Räss, B.; Jackowski, C.; Thali, M.J. Accident or homicide—Virtual crime scene reconstruction using 3D methods. Forensic Sci. Int. 2013, 225, 75–84. [Google Scholar] [CrossRef] [PubMed]
  14. Protocol for data acquisition. Available online: https://vimeo.com/127157351 (accessed on 9 November 2015).
  15. Wallis, K.F. Seasonal adjustment and relations between variables. J. Am. Stat. Assoc. 1976, 69, 18–31. [Google Scholar] [CrossRef]
  16. Morel, J.M.; Yu, G. ASIFT: A new framework for fully affine invariant image comparison. J. Imaging Sci. 2009, 2, 438–469. [Google Scholar] [CrossRef]
  17. Gruen, A. Adaptive least squares correlation: A powerful image matching technique. South Afr. J. Photogramm. Remote Sens. Cartogr. 1985, 14, 175–187. [Google Scholar]
  18. Moisan, L.; Stival, B. A probabilistic criterion to detect rigid point matches between two images and estimate the fundamental matrix. Int. J. Comput. Vis. 2004, 57, 201–218. [Google Scholar] [CrossRef]
  19. Fischler, M.A.; Bolles, R.C. Random sample consensus: A paradigm for model fitting with applications to image analysis and automated cartography. Commun. ACM 1981, 24, 381–395. [Google Scholar] [CrossRef]
  20. Hartley, R.; Zisserman, A. Multiple View Geometry in Computer Vision; Cambridge University Press: New York, NY, USA, 2003. [Google Scholar]
  21. Kraus, K.; Jansa, J.; Kager, H. Advanced Methods and Applications Vol 2. Fundamentals and Standard Processes Vol. 1; Institute for Photogrammetry Vienna University of Technology: Bonn, Germany, 1997. [Google Scholar]
  22. Snavely, N.; Seitz, S.M.; Szeliski, R. Modeling the world from Internet photo collections. Int. J. Comput. Vis. 2008, 80, 189–210. [Google Scholar] [CrossRef]
  23. Deseilligny, M.P.; Clery, I. Apero, an open source bundle adjustment software for automatic calibration and orientation of set of images. ISPRS-Int. Arch. Photogramm. Remote Sens. Spat. Inf. Sci. 2011, 38, 269–277. [Google Scholar]
  24. Kukelova, Z.; Pajdla, T. A minimal solution to the autocalibration of radial distortion. In Proceedings of the IEEE Conference on Computer Vision and Pattern Recognition, Minneapolis, MN, USA, 17–22 June 2007; pp. 1–7.
  25. Sturm, P.; Ramalingam, S.; Tardif, J.P.; Gasparini, S.; Barreto, J. Camera models and fundamental concepts used in geometric computer vision. Found. Trends®® Comput. Graph. Vis. 2011, 6, 1–183. [Google Scholar] [CrossRef]
  26. Hirschmuller, H. Stereo processing by semiglobal matching and mutual information. IEEE Trans. Pattern Anal. Mach. Intell. 2008, 30, 328–341. [Google Scholar] [CrossRef] [PubMed]
  27. Micmac website. Available online: http://www.tapenade.gamsau.archi.fr/TAPEnADe/Tools.html (accessed on 9 November 2015).
  28. Rothermel, M.; Wenzel, K.; Fritsch, D.; Haala, N. SURE: Photogrammetric surface reconstruction from imagery. In Proceedings of the LC3D Workshop, Berlin, Germany, 4–5 December 2012; pp. 1–9.
  29. Prasad, A. Energy Absorbed by Vehicle Structures in Side-Impacts; SAE Technical Paper: Warrendale, PA, USA, 1991. [Google Scholar]
  30. Prasad, A. CRASH3 Damage Algorithm Reformulation for Front and Rear Collisions; SAE Technical Paper: Warrendale, PA, USA, 1990. [Google Scholar]
  31. McHenry, R. A Comparison of Results Obtained With Different Analytical Techniques for Reconstruction of Highway Accidents; SAE Technical Paper: Warrendale, PA, USA, 1975. [Google Scholar]
  32. Simulated accident. Available online: https://www.youtube.com/watch?v=z3i_9EbcEZM (accessed on 9 November 2015).

