Article

Magma Pathways and Their Interactions Inferred from InSAR and Stress Modeling at Nyamulagira Volcano, D.R. Congo

by
Christelle Wauthier
1,2,*,
Valérie Cayol
3,4,
Benoît Smets
5,6,7,
Nicolas D’Oreye
6,8 and
François Kervyn
7
1
Department of Geosciences, The Pennsylvania State University, State College, PA 16801, USA
2
Institute for CyberScience, The Pennsylvania State University, State College, PA 16801, USA
3
DSPT3, LMV-LTL, The Lyon University, Université Jean Monnet-CNRS-IRD, Saint-Etienne 42023, France
4
Laboratoire Magmas et Volcans, Université Blaise Pascal-CNRS-IRD, OPGC, Clermont-Ferrand 63038, France
5
Department of Geography, Vrije Universiteit Brussel, Brussels 1050, Belgium
6
European Center for Geodynamics and Seismology, Walferdange 7256, Luxembourg
7
Department of Earth Sciences, Royal Museum for Central Africa, Tervuren 3080, Belgium
8
Department of Geophysics/Astrophysics, National Museum of Natural History, Luxembourg 2160, Luxembourg
*
Author to whom correspondence should be addressed.
Remote Sens. 2015, 7(11), 15179-15202; https://0-doi-org.brum.beds.ac.uk/10.3390/rs71115179
Submission received: 30 July 2015 / Revised: 30 October 2015 / Accepted: 5 November 2015 / Published: 12 November 2015
(This article belongs to the Special Issue Volcano Remote Sensing)

Abstract

:
A summit and upper flank eruption occurred at Nyamulagira volcano, Democratic Republic of Congo, from 2–27 January 2010. Eruptions at Nyamulagira during 1996–2010 occurred from eruptive fissures on the upper flanks or within the summit caldera and were distributed along the ~N155E rift zone, whereas the 2011–2012 eruption occurred ~12 km ENE of the summit. 3D numerical modeling of Interferometric Synthetic Aperture Radar (InSAR) geodetic measurements of the co-eruptive deformation in 2010 reveals that magma stored in a shallow (~3.5 km below the summit) reservoir intruded as two subvertical dikes beneath the summit and southeastern flank of the volcano. The northern dike is connected to an ~N45E-trending intra-caldera eruptive fissure, extending to an ~2.5 km maximum depth. The southern dike is connected to an ~N175E-trending flank fissure extending to the depth of the inferred reservoir at ~3.5 km. The inferred reservoir location is coincident with the reservoir that was active during previous eruptions in 1938–1940 and 2006. The volumetric ratio of total emitted magma (intruded in dikes + erupted) to the contraction of the reservoir (rv) is 9.3, consistent with pressure recovery by gas exsolution in the small, shallow modeled magma reservoir. We derive a modified analytical expression for rv, accounting for changes in reservoir volume induced by gas exsolution, as well as eruptive volume. By using the precise magma composition, we estimate a magma compressibility of 1.9–3.2 × 10⁹ Pa−1 and rv of 6.5–10.1. From a normal-stress change analysis, we infer that intrusions in 2010 could have encouraged the ascent of magma from a deeper reservoir along an ~N45E orientation, corresponding to the strike of the rift transfer zone structures and possibly resulting in the 2011–2012 intrusion. The intrusion of magma to greater distances from the summit may be enhanced along the N45E orientation, as it is more favorable to the regional rift extension (compared to the local volcanic rift zone, trending N155E). Repeated dike intrusions beneath Nyamulagira’s SSE flank may encourage intrusions beneath the nearby Nyiragongo volcano.

Graphical Abstract

1. Introduction

It is a challenge to quantitatively predict the position and direction of dike intrusions and resulting eruptive fissures at volcanoes, because they are governed by the interplay between several factors, such as a heterogeneous regional stress field, preexisting discontinuities and heterogeneous and anisotropic properties of rocks. Nevertheless, dikes at basaltic volcanoes usually show some regularity in their emplacement pattern, as eruptive fissures and vents tend to align with the direction of the maximum regional principal stress [1]. For instance, radial and circumferential diking alternate at the Galapagos volcanoes [2,3,4]; persistent diking occurs along well-developed volcanic rift zones at Kilauea Volcano (e.g., [5]); and summit eruptions alternate with proximal and distal eruptions at Piton de la Fournaise volcano [6].
At Nyamulagira, in the western branch of the East African Rift System (EARS), eruptions seem to occur with spatio-temporal periodicity [7,8,9]. For instance, since 1996, eruptive fissures opened in sequence on the northern flank (1996 and 1998), on the southern flank (2000), on both the northern and southern flank (2001), again on the northern flank (2002 and 2004) and again on the southern flank (2006 and 2010) (Figure 1). Although most eruptive fissures align with a N155E-trending axis, eruptions sometimes occur on the eastern flank, along an ~N45E direction (e.g., 1938–1940 and 2011–2012 eruptions).
The 2010 Nyamulagira eruption was observed by Interferometric Synthetic Aperture Radar (InSAR) with different acquisition geometries, allowing detailed numerical modeling of the involved sources of deformation. Although the event was a rather typical upper flank eruption, it may have perturbed Nyamulagira’s plumbing system significantly, as the following eruption in 2011–2012 occurred ~12 km ENE of the summit (Figure 1) [10]. The mechanism responsible for such a change in eruption location and behavior is unclear.
Figure 1. Geological setting of the Virunga Volcanic Province (VVP), western branch of the East African Rift System (EARS), north of Lake Kivu. The rift extension direction in this area is ~N110E, with an estimated extension rate of 2-2.8 mm/year [11,12]. The Goma–Gisenyi urban area is outlined in white on the northern shores of Lake Kivu. Eruptive fissures and lava flows (see the legend) were mapped from radar and optical images [7]. Nyamulagira’s caldera rim is outlined with a white dashed line. Faults are from [13], and rose diagrams of VVP’s faults (yellow) and eruptive fissures (red) are from [9]. The white rectangle gives the extent of Figure 2.
Remotesensing 07 15179 g001
In this study, we present co-eruptive InSAR observations of the 2010 eruption at Nyamulagira volcano. We invert the InSAR deformation field to infer volume changes, geometries and locations of sources of deformation involved in the eruption. Finally, we examine the normal stress changes induced by the modeled 2010 sources of deformation on Nyamulagira’s rift zones and provide insights about the relationships between recent eruptions and changes in eruption behavior.
Figure 2. Data, 1st column: most coherent wrapped interferograms covering the entire 2010 Nyamulagira eruption (heights of ambiguity, i.e., the topographic altitude difference, which generates one residual topographic fringe in a differential interferogram [14]; for interferograms, (a)–(d) are 45, 430, 704 and 3000 m, respectively). Pixels with coherence lower than 0.2 have been masked out (the unmasked wrapped interferograms are shown in Figure S1, and the four selected unwrapped interferograms are shown in Figure S2). Nyamulagira’s summit caldera is outlined with a dashed white line. Note that the ALOS interferogram has been rewrapped to the ENVISAT’s wavelength of 5.6 cm. Model, 2nd column, and residuals, 3rd column, for the preferred best-fit model (Figure 3), including two dike intrusions associated with the 2010 eruptive fissures (bold green lines) and a deflating reservoir, for the four interferograms (a)–(d).
Remotesensing 07 15179 g002

2. Background

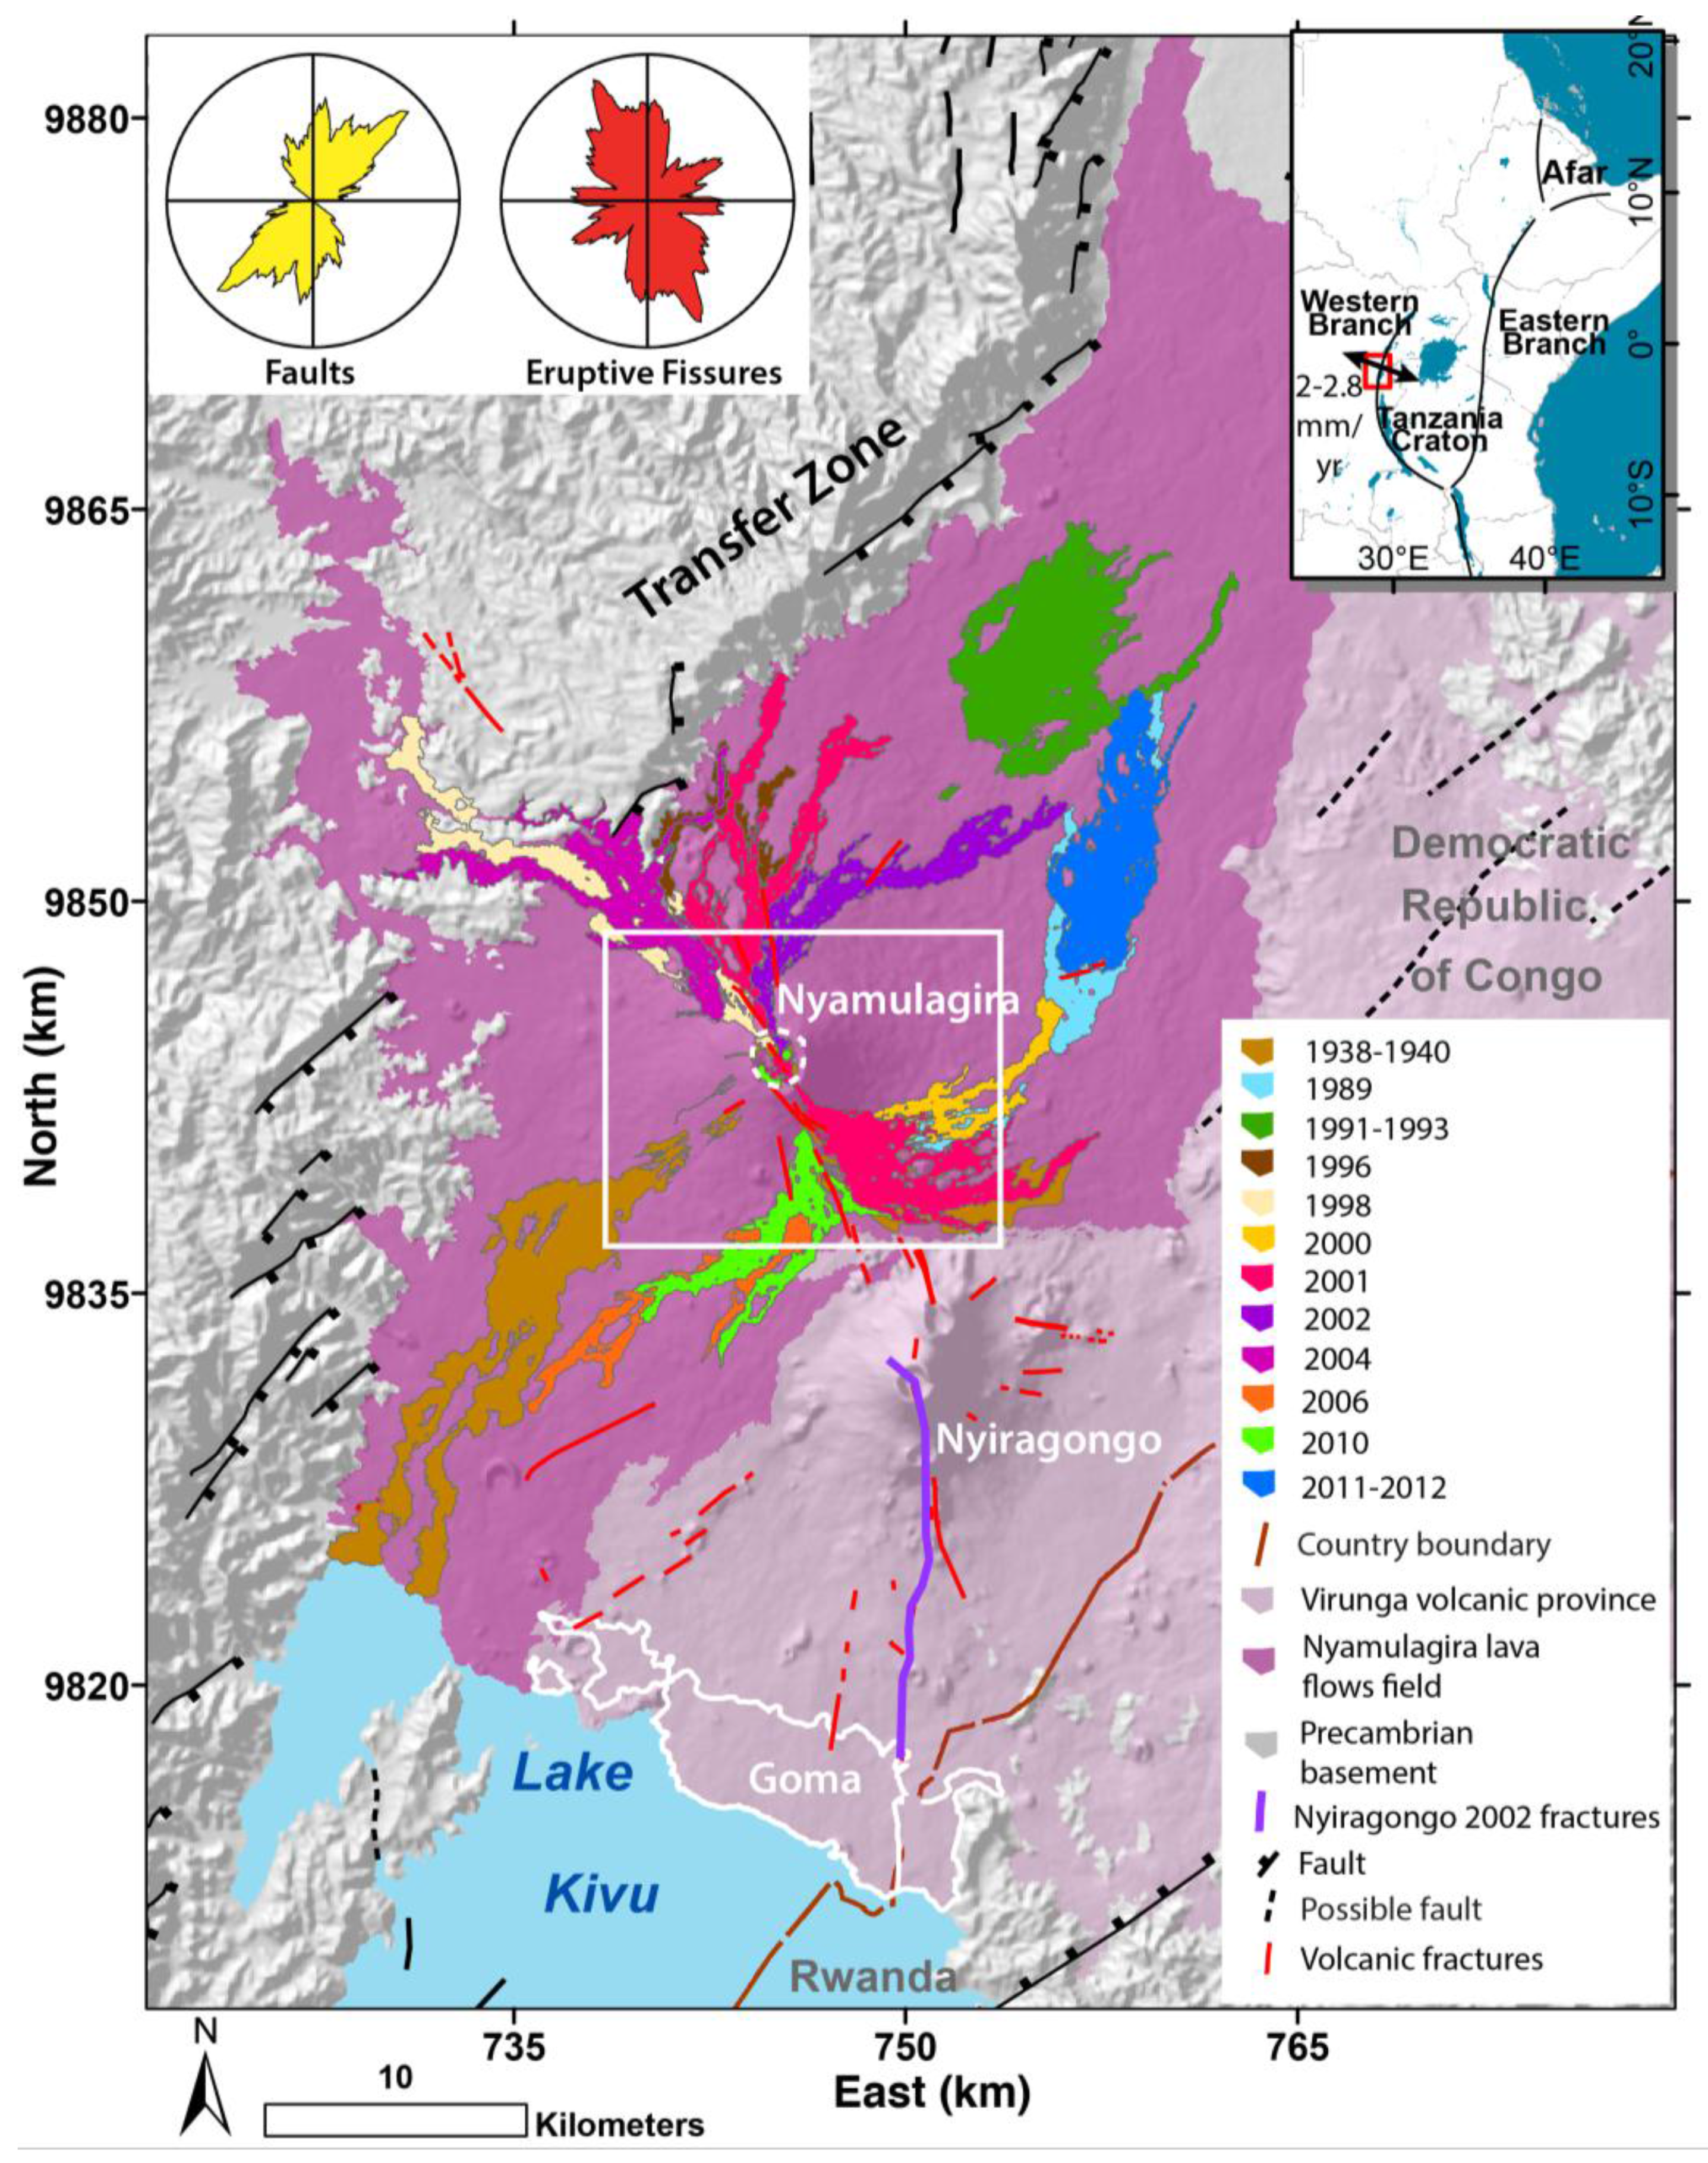
2.1. Geologic Setting

Nyamulagira is a basaltic shield volcano located in the Virunga Volcanic Province (VVP), Democratic Republic of Congo. The VVP volcanism is probably controlled by the transfer zone that links the Lake Edward and Lake Kivu segmented extensional basins located along the western branch axis of the EARS [15,16,17,18]. Nyamulagira is one of Africa’s most active volcanoes, with eruptive episodes occurring every 1–4 years since the 1980s [10]. Eruptive centers and fissure distributions mostly follow two orientations: ~N155E and ~N45E [9]. The ~N45E orientation corresponds to the strike of rift-related structures in the VVP (see the fault and eruptive fissure rose diagrams in Figure 1). The ~N155E orientation crosses the caldera, extends towards Nyiragongo’s edifice and can be considered as a volcanic rift zone.
Figure 3. Geometry of the preferred best-fit model including two dikes and a deflating reservoir: (a) Map view. The 2010 eruptive fissures are shown as bold green lines. (b) North-vertical cross-section. (c) East-vertical cross-section. Volume changes of the dike associated with the caldera’s fissure, the southern flank’s fissure and the spherical reservoir are 0.74, 4.2 and −5.1 × 10⁶ m3, respectively.
Remotesensing 07 15179 g003

2.2. Characteristics of Recent Eruptions

Eruptions at Nyamulagira during 1996–2010 occurred from eruptive fissures on the upper flanks or within the summit caldera and were distributed along the ~N155E rift zone (Figure 4). The 1996, 1998, 2000, 2004, 2006 and 2010 eruptions correspond to typical upper flank (<3 km from the caldera) short-lived eruptions, which last a few days to weeks and generate between ~45 and 70 × 106 m3 of lava [9]. The magma that feeds such upper flank eruptions likely intrudes as subvertical dikes from a storage area located at a depth of up to 5 km below the ground surface [19,20]. In contrast, the 1989, 1991–1993, 2001 and 2011–2012 eruptions correspond to less frequent (roughly decennial) long-lived eruptions, which last from several months to years, produce larger volumes of lava (i.e., >80 × 106 m3) and occur in the summit area (as in 2001) or >9 km from the summit [9]. The location of the ~N70E 2011–2012 eruptive fissures (Figure 4) corresponds to the eastern extension of an unusual ~4 km-deep long-period (LP) earthquake swarm oriented ~N45E, which was recorded the month preceding the 2010 eruption (Figure 5). Dikes feeding these larger volume eruptions might initiate from a deeper (~20-km depth) magma reservoir located between Nyamulagira and Nyiragongo [9]. An alternative hypothesis is that eruptions fed by dikes parallel to local EARS structures (i.e., oriented ~N45E, Figure 1) have a longer duration and larger volumes because they are more favorably oriented with respect to the remote stress associated with the rift extension [8].
Figure 4. Close-up of the distribution of recent eruptive fissures at Nyamulagira. The potential dike surface orientations investigated in the normal stress analysis (Section 5.4) and shown in Figure 6 and Figure S3 are represented with brown dashed lines. SC stands for south of the caldera.
Remotesensing 07 15179 g004
Figure 5. Sequence of seismic, volcanic and deformation events related to the 2010 Nyamulagira eruption. a–d correspond to the time spanned by the corresponding interferograms shown in Figure 2. See [10] for a detailed review of the four eruptive stages. SP and LP stand for short and long period, respectively.
Remotesensing 07 15179 g005

2.3. The January 2010 Eruption

On the morning of 2 January 2010 at 2:15 a.m. (local time, UTC/GMT+2), a swarm of short-period volcano-tectonic earthquakes and associated volcanic tremors began at Nyamulagira and is interpreted to indicate the eruption onset [10]. Clear seismic precursors (e.g., increased number of long- and short-period events, along with increased sequences of volcanic tremors) started only 2 h before the onset of the eruption [10]. Time series of deformation computed from InSAR data [21] indicate pre-eruptive vertical (uplift) displacements at the summit (5 cm) and close to the 2010 eruptive fissures (3 cm). After the start of the eruption, seismicity was mainly characterized by continuous volcanic tremors (Figure 5). Intense lava fountains were observed within Nyamulagira caldera, in a pit crater and along ~N45E-trending fissures (Figure 4). Furthermore, lava fountains were also observed along a new ~600 m-long ~N175E fissure on the southern flank of the volcano, ~1.5 km from the caldera rim, building a new volcanic cone. After ~8 days, the eruptive activity was localized to this circular vent on the southern flank (Figure 5; see [10] for a detailed review of the four eruptive stages). The main lava flow reached up to ~10.6 km from the eruptive vent, covering portions of the 2006 lava flows (Figure 1) before the eruption ceased on 27 January 2010. Due to the poor configuration of the seismic network around the volcano and the use of an over-simplistic velocity model [10,22], the location of earthquakes is poorly constrained (horizontal location uncertainties are in the order of ~10–15 km, and the vertical uncertainty is likely even larger). Therefore, we only consider swarms and general trends to be significant [10].

3. Methods

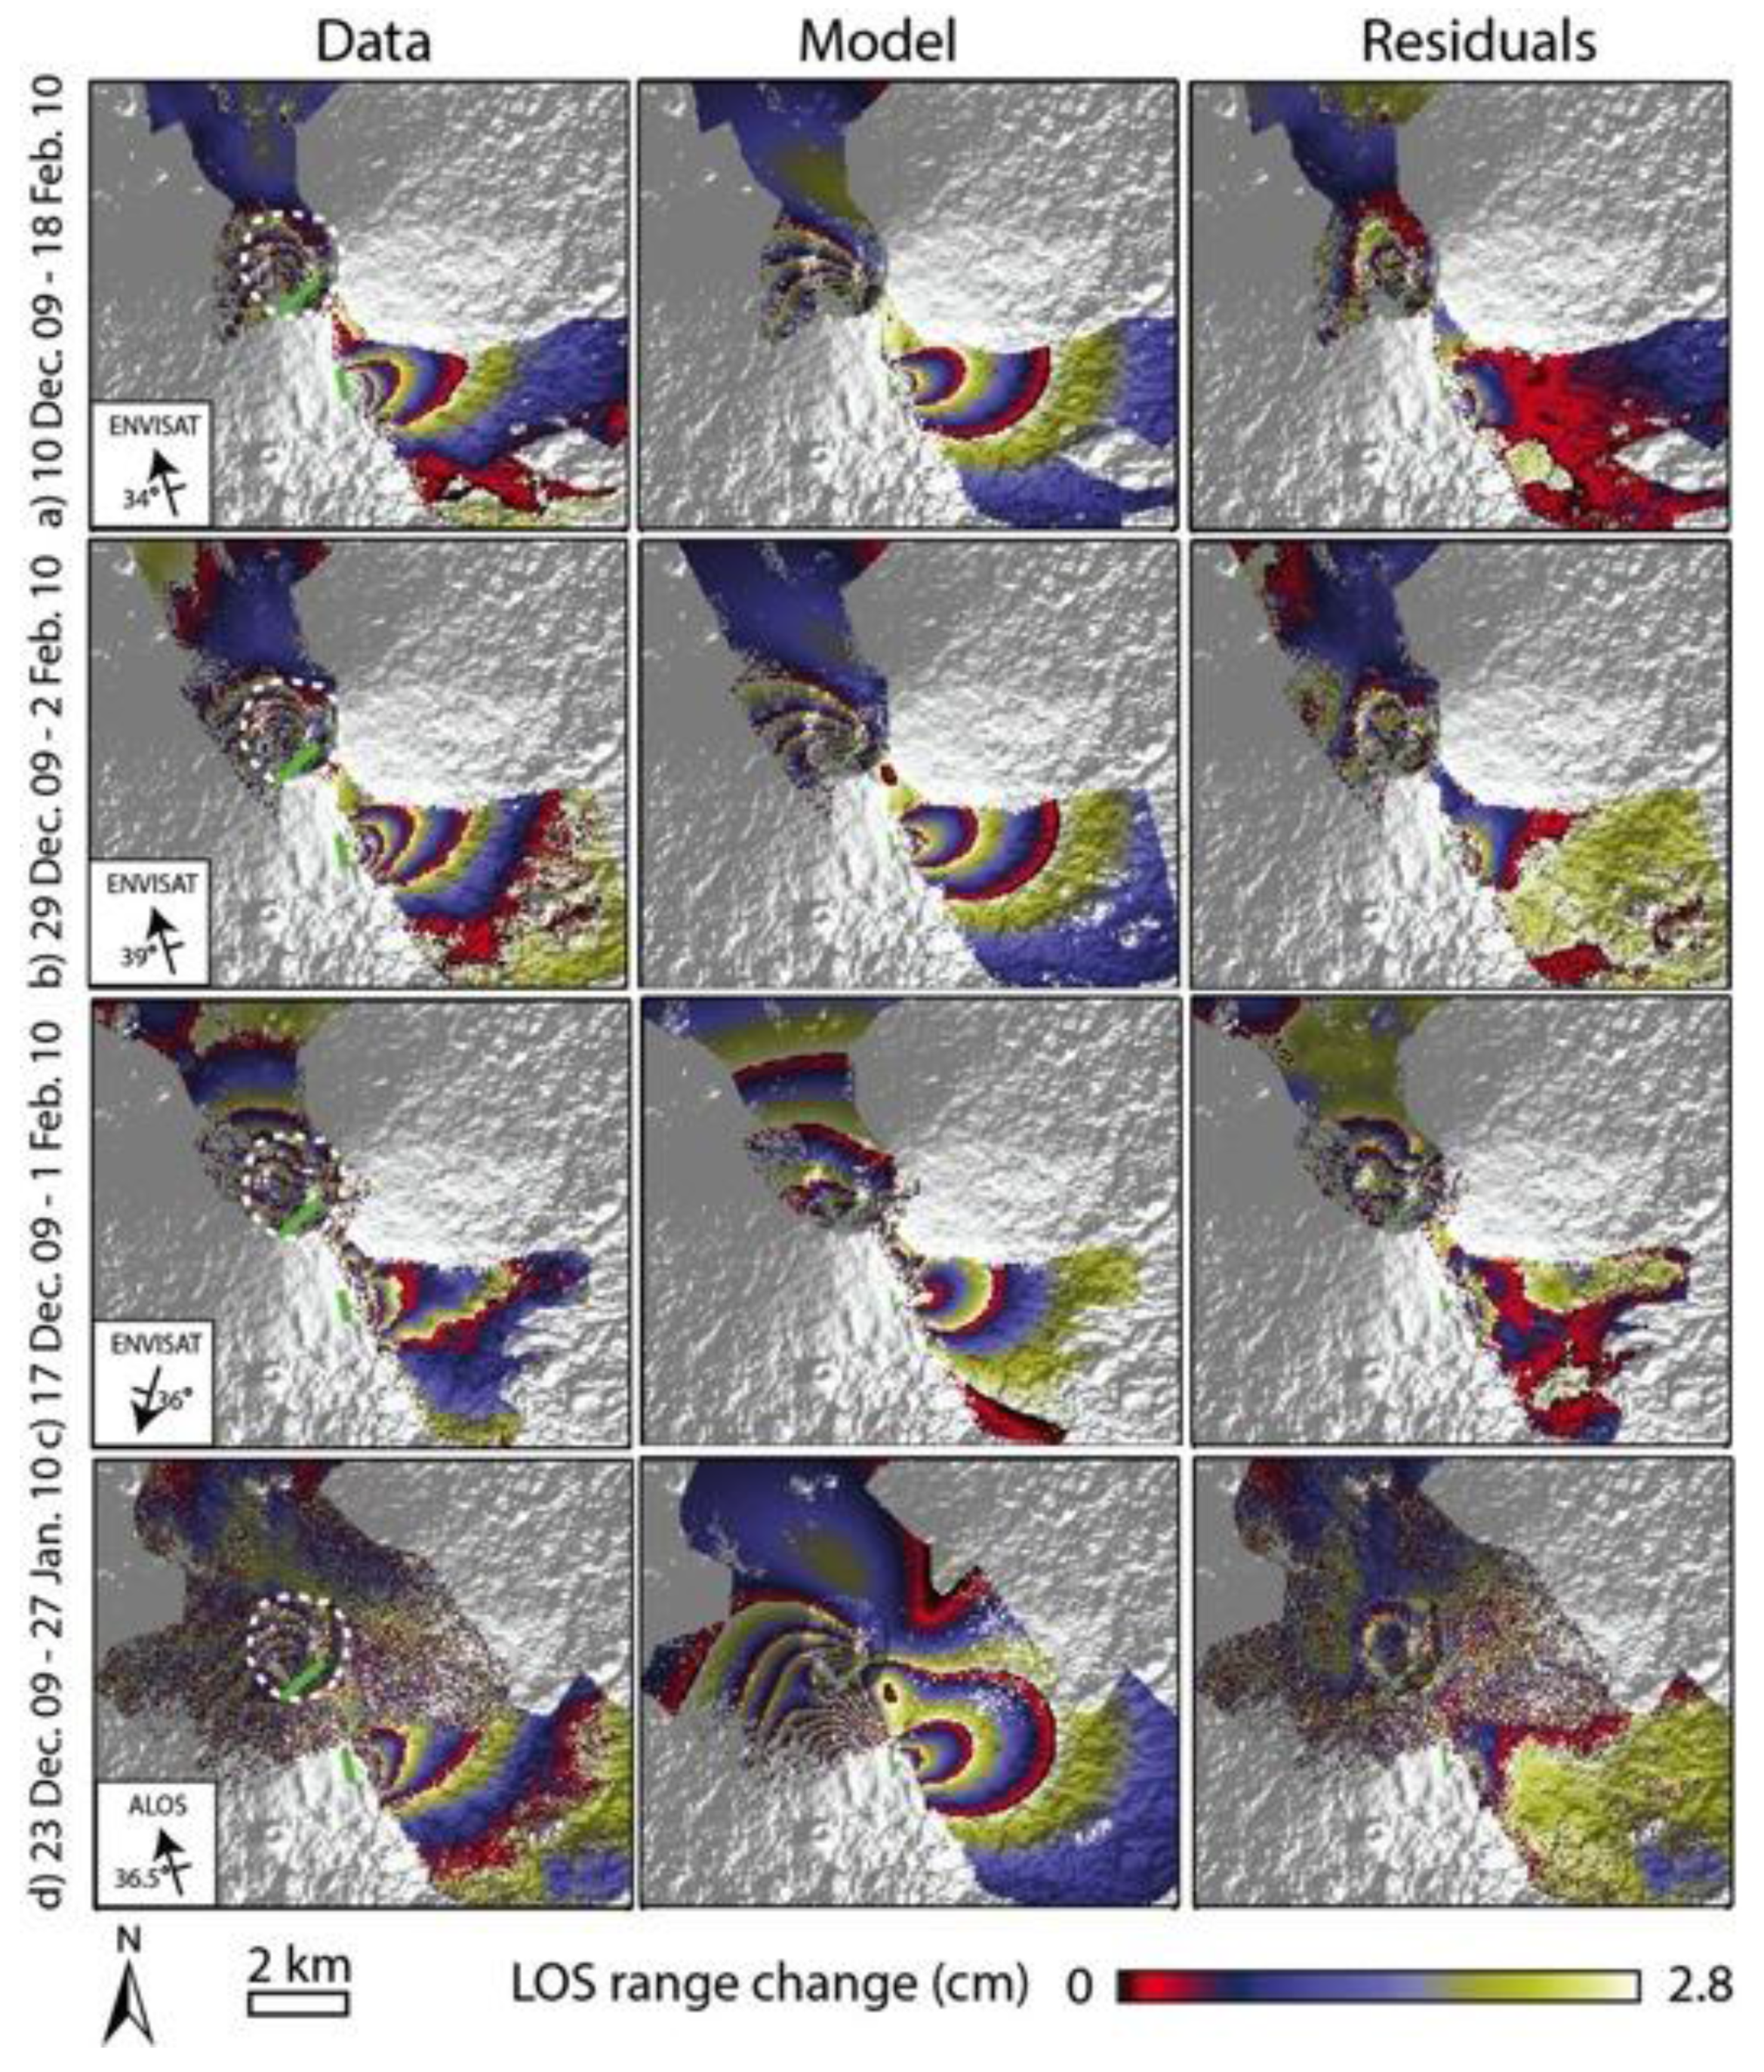
3.1. InSAR Processing

Data from the European Space Agency (ESA)’s ENVISAT satellite and from the Japanese Exploration Agency’s ALOS-1 satellite imaged the deformation of Nyamulagira during the January 2010 eruption. The most coherent interferograms covering the entire eruption with the shortest time span possible are shown in Figure 2 (Figure S1 in the Supplementary Material shows all of the unmasked interferograms available). The interferograms were processed using the JPL/Caltech ROI_PAC SAR software, multilooked with a factor of 2 in range and 10 in azimuth and filtered with an adaptive filter to optimize the signal-to-noise ratio [23]. We removed the orbital and topographic interferometric phase contribution using precise orbits and a 30-m-resolution digital elevation model generated by the NASA Shuttle Radar Topography Mission [24]. The interferometric phase was unwrapped (Figure S2) with the SNAPHU algorithm [25]. Line of sight (LOS) ground displacements of up to ~15 cm are visible northwest of the caldera eruptive fissure and correspond to a range decrease (ground displacement toward the satellite) in the ascending interferograms (Figure 2a,b and d) and a range increase (ground displacement away from satellite) in the descending interferogram (Figure 2c). A range decrease of ~6 cm is visible north of the caldera fissure in the descending interferogram only. A range decrease of ~25 cm is visible west of the southern flank fissure in the ALOS ascending interferogram (note that this area is incoherent in the other interferograms). Deformation up to ~12 cm is visible east of the southern flank fissure and corresponds to a range decrease in the ascending interferograms and a range increase in the descending interferogram. Finally, a few centimeters of range increase is also visible in the descending interferogram north of the southern flank fissure. Note that the maximum amplitude of horizontal deformation (<25 cm, [21]) is not large enough to be resolved by offset-tracking methods, for which the errors on the offset estimations will be of the same order as the deformation (e.g., [26,27]). Moreover, the deformation field is dominated by the ~EW displacements [28] induced by the dike intrusions (Figure S2), making an azimuthal offset calculation unlikely to constrain our inversions and models further.

3.2. Boundary Elements Modeling and Non-Linear Inversions

We modeled the deformation for the 2010 Nyamulagira eruption using the 3D-mixed boundary element method [29]. This numerical modeling approach explicitly takes into account the topography, mechanical interactions between sources and allows realistic dike models connected to the eruptive fissures [30]. The convention for stresses follows rock mechanics’ convention where compression is positive. We assume a Poisson’s ratio of 0.25. The Young’s modulus is assumed to be 5 GPa, corresponding to the value inferred from seismic velocities for the upper few kilometers of the crust in the VVP [31].
Prescribed boundary conditions are stress vectors. They are null at the ground surface. Sources are assumed to undergo constant pressure changes, corresponding to the difference between the magma pressure and the normal stress exerted by the host rock. Although the way to include gravitational stresses and other remote stresses is a matter of debate [32,33], we chose to neglect vertical gradients corresponding to gravitational forces, as a previous study conducted for dikes at Piton de la Fournaise volcano [30] showed that vertical gradients could not be resolved. For dikes, the constant overpressure boundary condition is consistent with hydraulic connection within all parts of the dikes. Dikes are parameterized with 6 geometrical parameters allowing for physically-meaningful parameter ranges (see Supplementary Methods and Figure S4 in the Supplementary Material), and reservoirs are parameterized with 4–8 parameters, depending on the tested geometry. These assumptions are consistent with [10], who inferred that the two 2010 eruptive fissures opened at the same time and were fed from the same magma ascent.
Ground surface element size affects ground surface displacement patterns, while source element size affects ground surface displacement amplitudes, and thus, the stress changes estimation [30]. Consequently, two meshing strategies are followed: one for the ground surface and one for the source meshes. For the ground surface, mesh elements have sizes that increase away from the maximum of displacement (Figure S5 [34]). The element size, which provides the best compromise between accuracy and computation time, is determined by successively decreasing the elements sizes until surface displacement is unchanged. To limit computation time, for deformation sources, coarse elements are used in inversions, and after inversions have converged, final computations with 4-times more elements are performed to adjust the source pressure changes.
As surface displacements are a non-linear function of the sources’ geometry and location, non-linear inversions of the deformation sources are required. To invert the InSAR data and solve for the most likely models, we used a nearest-neighbor algorithm [35]. To make the inversions computationally manageable, we subsample the unwrapped interferograms following a circular subsampling method [30,36], leading to a total of 2118 subsampled points.
Generally, when inverting for model parameters, increasing the number of model parameters decreases the misfit; however, the lowest misfit model determined is not necessarily the most likely. In order to select the most likely model, we select the model that minimizes the Akaike information criterion (AIC) [37,38], which is defined as:
A I C = 2 ( k + 1 ) +   N ( ln ( χ 2 N ) )
where N is the number of inverted parameters, N is the number of subsampled data points and χ 2 is the misfit.

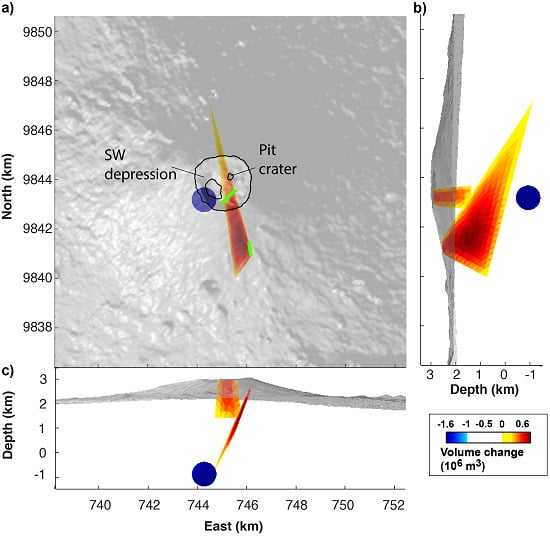
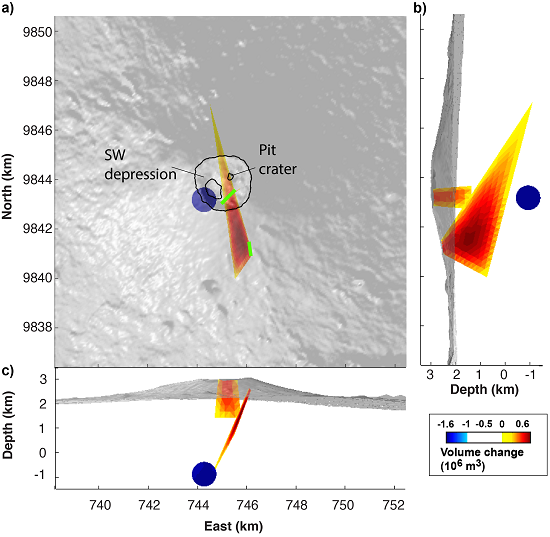
4. Numerical 3D Modeling Results

The January 2010 co-eruptive InSAR deformation is the result of successive eruptive processes that occurred between mid-December 2009 and early February 2010. The InSAR data provide a “snapshot”, which includes several potential volcanic processes: a pre-eruptive reservoir inflation, the intrusion of magma in dikes and sills, a co-eruptive reservoir deflation and a post-eruptive pressure restoration from gas exsolution (Figure 5). Unfortunately, the lack of continuous ground-based measurements means that these potential events cannot be observed individually, so their occurrence is a matter of debate and will be discussed in Section 5.
To model the January 2010 co-eruptive deformation, we first inverted the InSAR data for a single dike connecting the two eruptive fissures and found that it could explain only 68% of the observed deformation (Table 1). Given the localized patterns of deformation observed (Figure 2), the January 2010 eruption must have been fed by two dikes, spatially close to each other. Following [39], we assume that they interact, and we thus invert them simultaneously. Considering two distinct dikes, associated respectively with the summit and the southern flank eruptive fissures, only slightly improves the fit with 71% of the observed deformation explained at best (Table 1). Moreover, adding a simple quadrangular connection between both dikes beneath the southern flank provides the worst fit, with only 60% of the observed deformation explained at best (Table 1). Even with two dikes, the circular deformation signal north of the caldera, corresponding to a range increase visible in the ENVISAT descending interferogram (Figure 2c), remains unexplained. Such a signal may however be caused by the pressure change in a reservoir located beneath the caldera. Hence, we then invert for one or two dike(s) plus one of the following sources: a circular sill, a rectangular sill, a spherical reservoir or a laccolith dome-shaped intrusion (Table 1), assumed to experience a uniform static pressure change.
Table 1. Comparison of the best-fit model obtained for each combination of sources inverted. Note that several inversions were run for each possible source combination; only the best-fit result obtained for each combination is shown. * denotes the preferred model among all of the best-fit models. Percentage of explained deformation and RMS error are defined in the Supplementary Materials.
ModelExplained Deformation (%)RMS Error (cm)AIC
1 dike682.5702
2 dikes712.5746
2 dikes + quadrangular connection602.51216
1 dike + circular sill831.9295
1 dike + rectangular sill822374
1 dike + spherical reservoir861.7295
2 dikes + circular sill871.665
2 dikes + rectangular sill871.696
2 dikes + spherical reservoir*901.529
2 dikes + laccolith861.7164
When modeling magma reservoirs, there are trade-offs between the reservoir dimension and the pressure change, and only the latter can be determined with confidence. Additional data, such as magma extrusion rates, are required to resolve this trade-off [40]. Here, we arbitrarily fixed the reservoir radius to 500 m. In Section 5.2, we will discuss the consistency of this reservoir dimension with the erupted volume and host rock failure ability.
The best-fit model, giving the lowest RMS error and AIC value and explaining 90% of the observed deformation (Table 1, Figure 2), includes two dikes and a spherical deflating magma reservoir located beneath the caldera. With this model, the dike connected to the northern eruptive fissure (the “northern dike”) in the caldera is subvertical, extends to ~1.5 km beneath the summit and has a horizontal bottom side (Figure 3 and Table 2). It experiences a volume increase of ~0.74 × 10⁶ m3. The second dike, connected to the southern eruptive fissure on the SE flank (the “southern dike”), extends to a greater depth, reaching ~3.5 km beneath the surface. It has an ~6 km-long bottom side dipping at ~40 degrees northward (Figure 3 and Table 2). It experiences a larger volume increase of ~4.2 × 10⁶ m3. The spherical magma reservoir, located beneath the SW depression in Nyamulagira caldera (Figure 3) and centered at a depth of ~4 km beneath the summit, experiences a volume decrease of ~5.1 × 10⁶ m3.
Table 2. Best-fit parameters for the most likely model using two dikes and a spherical reservoir. The 95% confidence intervals on the 12 inverted parameters are shown (Figure S6, [41]).
ParameterDike Connected to the Caldera FissureDike Connected to Southern Flank FissureReservoir
Static pressure change (MPa)1.4 [1, 1.6]1.4 [1, 1.6]−26 [−26, −17]
Elevation of the base (middle point) for dikes or center of the reservoir (m a.s.l.)1400 [1236, 2314]−150 [−620, 486]−890 [−1462, −181]
Dip angle (°)90 *106 [88, 120]-
Angle between the line connecting the top and base middle points and the dipping direction (°)0 *42 [0.5, 43]-
Length of the base scaled to that of the top1.4 [1.3, 1.7]13 [10, 13]-
Vertical angle of the base (°)0 *−14 [−33, −6]-
Horizontal position of the reservoir (km)--744.2 [744.1, 744.5];
9843.2 [98430, 9843]
Radius of the reservoir (m)--500 **
* denotes a parameter that was fixed during the inversion in order to reduce the number of inverted parameters. ** indicates that the radius has been fixed to a reasonable value of 500 meters, due to the well-known trade-off between spherical reservoir pressure and radius. This radius is also consistent with the radius of the depression in the SW part of Nyamulagira’s caldera.

5. Discussion

5.1. Sources of Deformation

The preferred best-fit model, including two dikes and a spherical reservoir, leads to reasonable residuals (Figure 2). There are some residuals in the summit area, probably advocating for a more complex magma reservoir/northern dike geometry or a more complex rheology. However, it is difficult to further constrain the geometry of the summit deformation source due to the lack of coherence on the vegetated flanks. Similarly, some residuals are visible east of the southern flank eruptive fissure, possibly because of new ash deposits. The bottom of the southern dike extends beneath the southern flank of Nyamulagira where the opening and subsidence of a graben structure is visible [20], as commonly observed at the upper tip of blade-shaped dikes [42,43,44,45]. Therefore, there is probably a pre-existing area of weakness close to the surface in which magma intrudes laterally along dikes to feed the SE flank eruptions from the shallow summit reservoir beneath the caldera. The upper southeastern flank of Nyamulagira may be developing a volcanic rift zone, similar to the well-developed volcanic rift zones observed on the volcanoes of Hawaii, La Réunion and the Canary Islands (e.g., [46]).
As both fissures were fed by the same batch of magma [10], the dikes and reservoir are probably connected, but our modeling method cannot resolve this connection. The connection between both dikes is probably via another dike, as this is the most efficient means of transporting magma through the lithosphere [47,48]. Such a dike may be too narrow to cause detectable InSAR displacements. Indeed, the data fit breaks down when we try to add a sizeable connecting dike (Table 1), but if the connecting dike has a width smaller than 400 m at a 1-km depth, forward 3D-MBEM models show that it is undetectable. This dike width is similar to the eruptive fissure width, indicating that flow in the connecting dike could be the same as the flow at the surface. A similarly narrow path is also postulated for other volcanoes, such as Nyiragongo [31] and Piton de la Fournaise [39,49].
The fissure that opened on the caldera floor follows an ~N45E orientation, which contrasts notably with the N155E orientation of the main rift zone and the southern flank eruptive fissure. However, this N45E orientation corresponds to a fracture system that opened during the 1938–1940 major eruption [10]. Furthermore, during that same eruption, the SW caldera depression formed as the result of a collapse of the caldera. The magma reservoir modeled in this study is located in the same zone as the reservoir implied in the 1938–1940 eruption [10]. In 2010, this reservoir could have induced the same stress field as in 1938–1940, reactivating N45E-trending pre-existing structures. The eruptive fissures are not located at the crest of the reservoir, as expected when a spherical reservoir fails under tension [32], but away from the summit. This might be explained by host rock stresses inherited from previous eruptions.
There was no conclusively identified deflating reservoir during the 1996, 1998, 2000, 2001, 2002, 2004 and 2006 eruptions at Nyamulagira. The lack of an observed deflating reservoir at Nyamulagira can be explained by the following (not mutually exclusive) factors: (1) subtle deflation signals hidden by the deformation signals of large dike intrusions; (2) lack of coherent InSAR data in areas affected by reservoir deflation; (3) magma compressibility restoring pressure [50,51,52,53,54]; and (4) a source of emitted magma too deep for inducing observable deformation [55].

5.2. Magma Reservoir Size

Assuming the reservoir is spherical, the maximum overpressure sustainable before tensile failure of the host rock is given as a function of the lithostatic stress, Pl, and the tensile strength, T0 [39,56], as:
Δ P r = 2 ( P l + T 0 )
where P l   =   ρ r g H , with ρ r indicating host rock density, g indicating the acceleration of gravity and H indicating the depth to the top of the reservoir. If we assume ρ r = 2600 kg/m3 [57], T 0 = 0.5–5 MPa [58] and use a value of H = 3.5 km from our inversions, the overpressure Δ P r = 179–183 MPa. If we consider that the pre-eruption excess volume Δ V r , which induced the failure, corresponds to the pre-eruptive inflation detected by InSAR,   u z = 5 cm [21], we can estimate the radius of this reservoir. Assuming the reservoir volume change corresponds to that of a spherical reservoir in an infinite medium (the reservoir depth/radius ratio is >5), we can compute this radius from [59]:
R =   ( E π ( 1 + υ ) Δ V Δ P r ) 1 / 3
where E   and υ are Young’s modulus and Poisson’s ratio, respectively, and Δ V r = π u z H 2 / ( 1 υ ) . Because of the 1/3 power, the estimated volume has little sensitivity to the overpressure or the volume change. We find that the reservoir radius should be smaller than R = 250 m in order for failure to occur. Since InSAR measurements are not continuous, this reservoir radius is likely larger. For instance, if pre-eruptive inflation corresponds to the co-eruptive deflation, then the reservoir should be smaller than R = 315 m. These values are of the same order as the assumed reservoir radius, suggesting that our model is plausible. As surface deformation measurements are not sensitive to the reservoir radius for depth/radius ratios > 5, a change in the reservoir radius will not affect the depth and the reservoir volume changes determined from the inversions.
No reactivation of the ring fault around the summit caldera was observed. This occurs when magma reservoirs undergo under-pressure. Here, the depth of the eruptive fissure is at a higher elevation than the reservoir, and at the end of the eruption, degassed lava was emitted, implying that the reservoir is probably at lithostatic equilibrium at the end of the eruption.

5.3. Magma Budget

The InSAR data covering the Nyamulagira 2010 eruption require a deflating source beneath the caldera, which we modeled as a spherical reservoir at ~3.5 km beneath the summit (Figure 3) experiencing a volume decrease of ~5.1 × 10⁶ m3. The intruded magma volume in the two dikes is ~4.9 × 10⁶ m3, similar to the reservoir volume decrease. The estimated extruded lava flow and tephra volume is 45.5 ± 7.6 × 10⁶ m3 [10] and 10 × 106 m3 [8], respectively, leading to an average dense rock equivalent volume of ~42.3 × 10⁶ m3 (assuming a lava, tephra and dense rock density of 2200, 1000 and 2600 kg/m3 [8], respectively). The total emitted volume is thus ~47.2 × 10⁶ m3 (= the sum of dike volumes + dense rock equivalent erupted volume), leading to a ratio (rv) between the total emitted volume and the reservoir volume decrease of ~9.3. This ratio is an intermediate value between commonly-reported values in the EARS, for instance of ~20–40 [45] for the Dabbahu intrusion and of ~3 for the Dallol intrusion [60]. Refill of the shallow reservoir from a deep reservoir is not necessarily required to explain this discrepancy, as the pressure in the reservoir could have been restored by gas exsolution in the magma chamber [50].
We follow an approach similar to the one of Rivalta and Segall [50] to express rv. We assume that mass is conserved between magma emitted from the reservoir and magma transmitted to the edifice and that magma is compressible. However, we additionally account for the lava erupted at the surface (see Appendix A) and assume that pressure in the magma chamber before the eruption, P r , corresponds to the maximum sustainable overpressure defined above, P r = P l + Δ P r = 3 P l + T o , and that, after the eruption, pressure in the magma chamber returns to a lithostatic state. Thus, we obtain the following:
r v = 1 + β m β c + V e Δ V r [ ρ e ρ m ( P l ) ρ m ( P r ) ]
where β m and β c are the magma and reservoir compressibility, V e is the dense rock equivalent volume of emitted products, Δ V r is the reservoir volume change, ρ e is the dense rock equivalent density of emitted products (lava flows + tephra) and ρ m ( P l ) and   ρ m ( P r ) are the densities of magma in the reservoir after and before the eruption. Reservoir compressibility can be computed by assuming a spherical reservoir and neglecting the influence of the ground surface [50], leading to β c = 3 ( 1 + υ ) / ( 2 E ) .
Compressibility of magma, β m , is derived from β m = 1 / ρ m d ρ m / d p , assuming β m   remains constant over the pressure interval, so that:
β m = 1 ρ m ( P r ) [ ρ m ( P l ) ρ m ( P r ) P l P r ]
The variation of magma density with pressure depends on the amount of exsolved gas, given by:
ρ m ( P ) = [ χ g ( P ) ρ g ( P ) + 1 χ g ( P ) ρ l ( P ) ]
where χ g ( P ) is the mass fraction of gas in the magma and ρ g ( P ) and ρ l ( P ) are the densities of gas and liquid, respectively, all of which vary with pressure. χ g ( P ) can be determined from the analytic expression derived from Henry’s law [61] or derived from more complex models [62,63,64]. The gas density is given by the ideal gas law   ρ g ( P ) = P M / R T , where M is the gas molar mass, R is the gas constant and T is the absolute temperature, while the liquid density takes the liquid compressibility, β l   = 1 2 × 10 10   P a 1 , into account: ρ l = ρ o ( 1 + β l P ) , where ρ o = 2500 kg / m 3 is the density of the liquid phase of magma at atmospheric pressure.
Here, the volatiles considered are CO2 and H2O, and the magma compositions are estimated from recent studies of the volcano [10,65] (Table 3). Using the online code for thermodynamics computation of Papale et al. [64], we find that for a 1200 °C magma at a 3.5-km depth, almost all CO2 is gaseous and all H2O is liquid, so that χ C O 2 ( P ) = 0.1   wt% and χ H 2 O ( P ) = 0   wt% . At the pressure corresponding to rupture of the reservoir, P r , we find   χ C O 2 ( P r ) = 0.05   wt% . Successively using Equations (5) and (6), we get a magma compressibility of β m = 1.9-3.2 × 10⁹ Pa−1. If we consider a reservoir compressibility for a source in an infinite medium [50] and take ρ e = 2600 kg/m3 for the dense rock equivalent density and V e = 47.2 × 10⁶ m3, using Equation (4), we obtain rv = 6.5–10.1, a value consistent with that determined from modeled volume changes. The contribution of the emitted lava flow to rv is 0.5, thus it accounts for approximately only 5% of rv. This value of r v indicates that the magma emitted can be entirely issued from the 3.5-km depth shallow magma chamber and that discrepancy between the emitted and the reservoir volume change are compensated by CO2 exsolution.
Table 3. Thermodynamics parameters and major and minor element composition considered for the 2010 lavas of Nyamulagira used to compute the weight percent of the exsolved gases.
T (°C)P (MPa)SiO2TiO2Al2O3Fe2O3FeOMnOMgOCaONa2OK2OH2O (wt%)CO2 (wt%)
120087.5453.51513.1120.24.511,532.21.250.1

5.4. Stress Analysis

To understand the possible origin of the 2011–2012 eruption, we compute static stress changes induced by the modeled 2010 eruption deformation sources. Static stress changes can be used as an indicator for dike unclamping (e.g., [31,66,67,68,69,70]). Indeed, each dike intrusion changes the normal stress on pathways for potential diking. The sign of the induced normal stress change indicates whether subsequent intrusions are favored or prevented. If the normal stress changes are negative, subsequent dike emplacement is favored (unclamping); otherwise, subsequent dike emplacement is prevented (clamping). Note that we do not intend to forecast the shallow feeder dike orientation for the 2011–2012 eruption, but are interested in understanding the initiation of dikes. To quantitatively estimate the stress changes induced by the 2010 Nyamulagira eruption, we compute normal stress changes on five potential planes induced by the best-fitting deformation sources. From the distribution of eruptive vents, fissures and pre-existing rift-related structures (Figure 1), five potential vertical dike surfaces were considered (Figure 4): an ~N155E direction corresponding to the more active rift zone, an ~N45E direction crossing the summit caldera and an ~N45E south caldera (SC) direction, as well as an ~EW direction and an ~N65E direction connecting to the 2011–2012 eruptive fissure corresponding to a radial dike emplacement. Potential dike surfaces investigated range from the ground surface down to three kilometers below sea level (b.s.l.).
The 2010 eruption deformation sources induce unclamping in all potential dike surfaces (Figure 6 and Figure S3). Along the ~N45E surface crossing the caldera, the ~EW and ~N65E radial investigated surfaces, the unclamping is only significant in the shallowest part of the surfaces (<~2 km beneath the ground surface) and in the immediate proximity of the modeled reservoir. The ~N155E and the ~N45E SC surfaces are unclamped over large areas (66 and 111 km2, respectively) to greater depths. Stress changes from the 2010 intrusions and reservoir beneath the SSE flank could have thus encouraged the vertical ascent of magma from a deeper crustal reservoir along the ~N45E SC surface below the volcanic edifice. This interpretation is consistent with the hypothesis of a deep (~20–30-km depth) magma reservoir feeding the less common distal lower flanks’ eruptions [19].
Figure 6. Perspective plots from two orthogonal viewing angles showing the changes in the normal stress on the potential dike surfaces (Figure 4) caused by the preferred model of the 2010 best-fitting deformation sources (black mesh). The color scale corresponds to normal stress change in MPa, with positive values (clamping) clipped to dark red and negative values (unclamping) from blue to red. SC stands for south of the caldera. Both the N155 and N45E SC dike surfaces are unclamped over large and deep areas beneath the volcano by the 2010 eruption sources, while only a small area of the N45E (caldera intersecting) surface is unclamped.
Remotesensing 07 15179 g006
We also calculated the normal stress change induced by the 2010 Nyamulagira eruption on the ~NS potential dike surface at Nyiragongo, determined from the modeling of the 2002 Nyiragongo eruption [31] (Figure S7). The normal stress change is slightly negative close to Nyiragongo summit (the minimum value is −0.0015 MPa). Thus, dike intrusions in the SSE flank of Nyamulagira also slightly unclamp the northern part of the Nyiragongo dike surface. A single dike intrusion probably does not induce a normal stress change large enough to cause an eruption at Nyiragongo. However, repeated dike intrusions in Nyamulagira’s SSE flank may contribute to the failure of the shallow plumbing system of Nyiragongo.

5.5. Influence of the Crustal Extension

The EARS extension probably plays a role in the preferred diking orientations and on the amount of intruded magma volumes. The tectonic rift extension, σt, in this part of the rift is oriented ~N110E [11,12]. Resolving this extension on the potential dike directions for host rocks under lithostatic stress, P l , we get smaller amplitudes of host rock stresses on the N45E than on the N155E potential dike directions, with values of:
σ r N 45 E =   P l sin ( 110 ° 45 ° ) σ t =   P l 0.9   σ t  
and:
σ r N 155 E =   P l sin ( 155 ° 110 ° ) σ t =   P l 0.7   σ t  
respectively.
Next, we assume that failure of the reservoir corresponds to the same magma pressure (Pm) whatever the intrusion orientation, which might be the case around a reservoir, as each intrusion changes the state of stress in the host medium. We find that the overpressure along the N45E surface Δ P N 45 E =   P m   P l + 0.9   σ t is larger than the overpressure along the N155E surface Δ P N 155 E =   P m   P l + 0.7   σ t . If we consider that the length of the intrusion is a linear function of the overpressure, because the length is limited either by magma cooling [69] or by the resistance to fracture at the dike tip [70], dike intrusions are expected to be longer along the N45E direction than along the N155E direction.

5.6. Magma Storage and Transport

From the detailed geodetic modeling of the 2010 Nyamulagira eruption and the results of [10], we suggest a model of magma transfer and storage associated with a typical upper flank eruption on the SSE flank of Nyamulagira. The onset of the eruption may be marked by over-pressurized magma intruding upward in a dike from a shallow reservoir located at ~4 km beneath the SW caldera depression. Magma propagation is likely driven by the buoyancy of the gas pocket and gas-rich magma at the dike tip, as evidenced by the intense lava fountaining during the first stage of the eruption and the large rv. The magma overpressure keeps the dike open. Just after the eruption onset, the dike may grow laterally due to the decreased buoyancy corresponding to the increased density of the underlying, gas-poor magma, mainly in the direction of the slope, into a weak and fractured area beneath the SSE flank, as observed, for instance, at Piton de La Fournaise [39] and Etna [71]. As the overpressure in the reservoir is relaxed, the magma flow rate decreases; magma can no longer reach the summit caldera and erupts only at the lower flank vent. A few days after the eruption onset, the eruption is restricted to a small portion at the base of the fracture. Finally, after a few more days or weeks, the activity stops.
This study provides insights for the shallow magma plumbing system active during 2006–2012 (Figure 7). In 2006, magma intruded from a depth into a shallow reservoir located at an ~1-km depth beneath the SW depression of the summit caldera [20] as a sub-vertical dike beneath the volcano and probably grew laterally in the SSE flank of the volcano, where an eruptive fissure opened. This process of vertical ascent feeding lateral dikes is common for small volcanic edifices (e.g., [39,72,73]). We also suggest that the 2010 sources unclamped the deep part of the potential dike surface oriented ~N45E, south of the caldera, in which magma could have intruded from a deep reservoir. Magma could have then migrated laterally following this ~N45E SC orientation, which may represent a plane of weakness due to pre-existing faults buried under the lava field [13] toward the 2011–2012 eruption site location. Unusual seismic tremor data [10] also suggest magma movement at a depth along a similar ~N45E orientation.
Figure 7. Schematic shallow magma plumbing system for the period 2006–2012. Arrows represent possible magma migration paths. Red and blue sources experience inflation and deflation, respectively. Orange stars denote the locations of eruptive fissures and vents. SC stands for south of the caldera. The two dikes and magma reservoir inferred from the modeling of the 2010 eruption data are represented with black meshes.
Remotesensing 07 15179 g007

6. Conclusions

The best-fit model describing the 2010 co-eruptive deformation, which is also the most likely according to the AIC values (Table 1), indicates two subvertical dike intrusions and deflation of a magma reservoir. The northern dike is connected to an intra-caldera ~N45E-trending eruptive fissure, extending to an ~2.5-km maximum depth. The southern dike is connected to an ~N175E-trending flank eruptive fissure, extending to the depth of the inferred reservoir at ~3.5 km. The magma reservoir is located ~3.5 km beneath the SW depression in Nyamulagira caldera. The reservoir location is coincident with the reservoir active during the 1938–1940 [10] and 2006 [20] eruptions. The ratio of total emitted volume to the decrease in reservoir volume decrease is determined to be ~9.3, suggesting that the magma in the reservoir is gas-rich, allowing gas exsolution to restore the pressure loss induced by the eruption. This value is consistent with the shallow and small magma reservoir modeled in this study.
From a normal stress change analysis, we infer that the 2010 intrusions beneath the SSE flank of Nyamulagira encouraged diking at a depth along the ~N155E and ~N45E SC surfaces. The 2010 intrusions might have encouraged the ascent of magma from a deeper reservoir, which then fed an intrusion in 2011–2012. Due to regional rift extension, more extensive intrusions would be favored along the ~N45E orientation, providing a possible explanation for the ensuing distal 2011–2012 eruption. Finally, our normal stress change results also suggest that repeated dike intrusions beneath Nyamulagira’s SSE flank slightly encourage intrusions beneath Nyiragongo.

Supplementary Files

Supplementary File 1

Acknowledgments

Radar images and precise orbits are provided by ESA. Data were provided in the frame of European Space Agency (ESA) projects (ESA Cat-1 nr 3224, ESA AO ALOS3690 projects) and several Belgian Science Policy (Belspo) and Luxembourg FNR projects, such as SAMAAV (Belspo, Action-1 grant), GORISK (Belspo, Grant SR/00/113) and NYALHA (National Research Fund of Luxembourg, AFR Ph.D. Grant 3221321). The authors thank Robert Dennen and Roman DiBiase for proof reading the English and the staff of the Goma Volcano Observatory for their collaboration during fieldwork. The authors thank Falk Amelung for comments on an earlier version of the manuscript and would like to thank the four anonymous reviewers for their constructive suggestions and comments.

Author Contributions

Christelle Wauthier computed the interferograms and the geodetic model calculations and wrote the paper. Benoît Smets provided tectonic context. Christelle Wauthier, Benoît Smets, François Kervyn and Nicolas d’Oreye performed the field observations. Valérie Cayol provided the 3D-MBEM code and performed the compressibility calculations. All authors discussed the results and commented on the manuscript.

Conflicts of Interest

The authors declare no conflict of interest.

Appendix A: Ratio of Emitted over Reservoir Volume Change, Taking Lava Erupted at the Surface into Account

We use rv, the ratio of magma intruded in the dikes, V d , and erupted at the surface, V e , over the reservoir volume change,
r v = V d + V e V r ( P 2 ) V r ( P 1 )
where V r ( P 2 ) and V r ( P 1 ) are the reservoir volumes after and before the eruption, respectively.
Taking into account the reservoir compressibility   β c = ( 1 / V r ) d V r / d P r with V r the reservoir volume, we obtain:
r v = 1 β c ( P 2 P 1 ) ( V d + V e V r ( P 1 ) )
Mass is conserved during the eruption, so:
ρ m r ( P 1 ) V r ( P 1 ) = ρ m r ( P 2 ) V r ( P 2 ) + ρ m d ( P 2 d ) V d + ρ e V e
where ρ m r ( P 1 ) and ρ m r ( P 2 ) are the magma densities in the reservoir before and after the eruption, ρ m d ( P 2 d ) is the magma density in the dikes, V d is the dike volume and ρ e and V e are the dense rock equivalent density and volume, respectively, of products emitted at the surface. Following [50], we further assume that hydraulic connectivity leads to the same pressure as the reservoir and in the dike P 2 = P 2 d , so that densities are identical, and we thus consider ρ m r ( P 1 ) = ρ m ( P 1 ) .
Taking the reservoir compressibility into account, Equation (A3) becomes:
ρ m ( P 1 ) = ρ m ( P 2 ) ( 1 + β c ( P 2 P 1 ) + V d V r ( P 1 ) ) + ρ e V e V r ( P 1 )
From the compressibility of magma given in Equation (6), we obtain ρ m ( P 2 ) = ρ m ( P 1 ) [ 1 + β m ( P 2 P 1 ) ] , which we substitute in Equation (A4) to compute V d / V r ( P 1 ) , which we further use to calculate rv. After neglecting second order terms, we finally obtain:
r v = 1 + β m β c + V e Δ V r [ ρ e ρ m ( P 2 ) ρ m ( P 1 ) ]

References

  1. Nakamura, K.; Jacob, K.H.; Davies, J.N. Volcanoes as possible indicators of tectonic stress orientation—Aleutians and Alaska. Pure Appl. Geophys. 1977, 115, 87–112. [Google Scholar] [CrossRef]
  2. Chadwick, W.W.; Dieterich, J.H. Mechanical modeling of circumferential and radial dike intrusion on Galapagos volcanoes. J. Volcanol. Geotherm. Res. 1995, 66, 37–52. [Google Scholar] [CrossRef]
  3. Chestler, S.R.; Grosfils, E.B. Using numerical modeling to explore the origin of intrusion patterns on Fernandina Volcano, Galapagos Islands, Ecuador. Geophys. Res. Lett. 2013, 40, 4565–4569. [Google Scholar] [CrossRef]
  4. Bagnardi, M.; Amelung, F.; Poland, M.P. A new model for the growth of basaltic shields based on deformation of Fernandina volcano, Galápagos Islands. Earth Planet. Sci. Lett. 2013, 377–378, 358–366. [Google Scholar] [CrossRef]
  5. Klein, F.W.; Koyanagi, R.Y.; Nakata, J.S.; Tanigawa, W.R. The seismicity of Kilauea’s magma system. Volcan. Hawaii 1987, 1350, 1019–1185. [Google Scholar]
  6. Peltier, A.; Bachèlery, P.; Staudacher, T. Magma transport and storage at Piton de La Fournaise (La Réunion) between 1972 and 2007: A review of geophysical and geochemical data. J. Volcanol. Geotherm. Res. 2009, 184, 93–108. [Google Scholar] [CrossRef]
  7. Smets, B.; Wauthier, C.; d’Oreye, N. A new map of the lava flow field of Nyamulagira (D.R. Congo) from satellite imagery. J. Afr. Earth Sci. 2010, 58, 778–786. [Google Scholar] [CrossRef]
  8. Wadge, G.; Burt, L. Stress field control of eruption dynamics at a rift volcano: Nyamuragira, D.R.Congo. J. Volcanol. Geotherm. Res. 2011, 207, 1–15. [Google Scholar] [CrossRef]
  9. Smets, B.; Kervyn, M.; d’Oreye, N.; Kervyn, F. Spatio-temporal dynamics of eruptions in a youthful extensional setting: Insights from Nyamulagira Volcano (D.R. Congo), in the western branch of the East African Rift. Earth-Sci. Rev. 2015, 150, 305–328. [Google Scholar] [CrossRef]
  10. Smets, B.; d’Oreye, N.; Kervyn, F.; Kervyn, M.; Albino, F.; Arellano, S.R.; Bagalwa, M.; Balagizi, C.; Carn, S.A.; Darrah, T.H.; et al. Detailed multidisciplinary monitoring reveals pre- and co-eruptive signals at Nyamulagira volcano (North Kivu, Democratic Republic of Congo). Bull. Volcanol. 2014, 76, 1–35. [Google Scholar] [CrossRef]
  11. Stamps, D.S.; Calais, E.; Saria, E.; Hartnady, C.; Nocquet, J.-M.; Ebinger, C.J.; Fernandes, R.M. A kinematic model for the East African Rift. Geophys. Res. Lett. 2008, 35, L05304. [Google Scholar] [CrossRef]
  12. Saria, E.; Calais, E.; Stamps, D.S.; Delvaux, D.; Hartnady, C.J.H. Present-day kinematics of the East African Rift. J. Geophys. Res. Solid Earth 2014, 119, 1–17. [Google Scholar] [CrossRef]
  13. Smets, B.; Delvaux, D.; Ross, K.A.; Poppe, S.; Kervyn, M.; d’Oreye, N.; Kervyn, F. The role of inherited crustal structures and magmatism in the development of rift segments: Insights from the Kivu basin, western branch of the East African Rift. Tectonophysics 2015. submitted. [Google Scholar]
  14. Hanssen, R.F. Radar Interferometry: Data Interpretation and Error Analysis; Springer Science & Business Media: Berlin, Germany, 2001. [Google Scholar]
  15. Ebinger, C.J. Tectonic development of the western branch of the East African rift system. GSA Bull. 1989, 101, 885–903. [Google Scholar] [CrossRef]
  16. Ebinger, C.J. Geometric and kinematic development of border faults and accommodation zones, Kivu-Rusizi rift, Africa. Tectonics 1989, 8, 117–133. [Google Scholar] [CrossRef]
  17. Ebinger, C.; Furman, T. Geodynamical setting of the virunga volcanic province, East Africa. Acta Vulcanol. 2002, 14, 1–8. [Google Scholar]
  18. Corti, G.; Bonini, M.; Innocenti, F.; Manetti, P.; Piccardo, G.B.; Ranalli, G. Experimental models of extension of continental lithosphere weakened by percolation of asthenospheric melts. J. Geodyn. 2007, 43, 465–483. [Google Scholar] [CrossRef]
  19. Pouclet, A. Volcanologie du Rift de L’afrique Centrale, le Nyamuragira Dans les Virunga, Essaie de Magmatologie du Rift. Ph.D. Thesis, University of Paris-Sud., Orsay, France, 1976. [Google Scholar]
  20. Wauthier, C.; Cayol, V.; Poland, M.; Kervyn, F.; d’Oreye, N.; Hooper, A.; Samsonov, S.; Tiampo, K.; Smets, B. Nyamulagira’s magma plumbing system inferred from 15 years of InSAR. Geol. Soc. Lond. Spec. Publ. 2013, 380, 39–65. [Google Scholar] [CrossRef]
  21. Samsonov, S.; d’Oreye, N. Multidimensional time-series analysis of ground deformation from multiple InSAR data sets applied to Virunga Volcanic Province. Geophys. J. Int. 2012, 191, 1095–1108. [Google Scholar]
  22. D’Oreye, N.; Gonzalez, P.J.; Shuler, A.; Oth, A.; Bagalwa, L.; Ekstrom, G.; Kavotha, D.; Kervyn, F.; Lucas, C.; Lukaya, F.; et al. Source parameters of the 2008 Bukavu-Cyangugu earthquake estimated from InSAR and teleseismic data. Geophys. J. Int. 2011, 184, 934–948. [Google Scholar] [CrossRef] [Green Version]
  23. Rosen, P.A.; Hensley, S.; Peltzer, G.; Simons, M. Updated repeat orbit interferometry package released. Eos Trans. Am. Geophys. Union 2004, 85, 47. [Google Scholar] [CrossRef]
  24. Farr, T.G.; Rosen, P.A.; Caro, E.; Crippen, R.; Duren, R.; Hensley, S.; Kobrick, M.; Paller, M.; Rodriguez, E.; Roth, L.; et al. The shuttle radar topography mission. Rev. Geophys. 2007, 45, 1–43. [Google Scholar] [CrossRef]
  25. Chen, C.W.; Zebker, H.A. Two-dimensional phase unwrapping with use of statistical models for cost functions in nonlinear optimization. J. Opt. Soc. Am. A 2001, 18, 338. [Google Scholar] [CrossRef]
  26. Fialko, Y.; Simons, M.; Agnew, D. The complete (3-D) surface displacement field in the.the epicentral area of the 1999 M_W7. 1 Hector Mine Earthquake, California, from space geodetic observations. Geophys. Res. Lett. 2001, 28, 3063–3066. [Google Scholar] [CrossRef]
  27. Bechor, N.B.D.; Zebker, H.A. Measuring two-dimensional movements using a single InSAR pair. Geophys. Res. Lett. 2006, 33, 1–5. [Google Scholar] [CrossRef]
  28. Wright, T.J. Toward mapping surface deformation in three dimensions using InSAR. Geophys. Res. Lett. 2004, 31, 1–5. [Google Scholar] [CrossRef]
  29. Cayol, V.; Cornet, F.H. 3D mixed boundary elements for elastostatic deformation field analysis. Int. J. Rock Mech. Min. 1997, 34, 275–287. [Google Scholar] [CrossRef]
  30. Fukushima, Y. Finding realistic dike models from interferometric synthetic aperture radar data: The February 2000 eruption at Piton de la Fournaise. J. Geophys. Res. 2005, 110, B03206. [Google Scholar] [CrossRef]
  31. Wauthier, C.; Cayol, V.; Kervyn, F.; d’Oreye, N. Magma sources involved in the 2002 Nyiragongo eruption, as inferred from an InSAR analysis. J. Geophys. Res. 2012, 117, B05411. [Google Scholar] [CrossRef]
  32. Grosfils, E.B. Magma reservoir failure on the terrestrial planets; Assessing the importance of gravitational loading in simple elastic models. J. Volcanol. Geotherm. Res. 2007, 166, 47–75. [Google Scholar] [CrossRef]
  33. Gerbault, M.; Cappa, F.; Hassani, R. Elasto-plastic and hydromechanical models of failure around an infinitely long magma chamber. Geochem. Geophys. Geosyst. 2012, 13, 1–27. [Google Scholar] [CrossRef]
  34. Cayol, V. Analyse Élastostatique Tridimensionnelle du Champs de Déformations des Édifices Volcaniques Par Éléments Frontières Mixtes; Université de Paris VII: Paris, France, 1996. [Google Scholar]
  35. Sambridge, M. Geophysical inversion with a neighbourhood algorithm—I. Searching a parameter space. Geophys. J. Int. 1999, 138, 479–494. [Google Scholar] [CrossRef]
  36. Fukushima, Y. Transferts de Magma au Volcan du Piton de la Fournaise Determines par la Modelisation 3d de Donnees D’interferometrie Radar Entre 1998 et 2000; Universite Blaise-Pascal: Aubière, France, 2006. [Google Scholar]
  37. Akaike, H. A new look at the statistical model identification. IEEE Trans. Autom. Control 1974, 19, 716–723. [Google Scholar] [CrossRef]
  38. O’Brien, G.S.; Lokmer, I.; Bean, C.J. Statistical selection of the “best” seismic source mechanisms from inversions of synthetic volcanic long-period events. J. Geophys. Res. Solid Earth 2010, 115, 1–13. [Google Scholar] [CrossRef]
  39. Fukushima, Y.; Cayol, V.; Durand, P.; Massonnet, D. Evolution of magma conduits during the 1998–2000 eruptions of Piton de la Fournaise volcano, Réunion Island. J. Geophys. Res. Solid Earth 2010, 115, 1–21. [Google Scholar] [CrossRef]
  40. Anderson, K.; Segall, P. Bayesian inversion of data from effusive volcanic eruptions using physics-based models: Application to Mount St. Helens 2004–2008. J. Geophys. Res. Solid Earth 2013, 118, 2017–2037. [Google Scholar] [CrossRef]
  41. Sambridge, M. Geophysical inversion with a neighbourhood algorithm-II. Appraising the ensemble. Geophys. J. Int. 1999, 138, 727–746. [Google Scholar] [CrossRef]
  42. Rubin, A.M. Dike-induced faulting and graben subsidence in volcanic rift zones. J. Geophys. Res. 1992, 97, 1839. [Google Scholar] [CrossRef]
  43. Rubin, A.M.; Pollard, D.D. Dike-induced faulting in rift zones of Iceland and Afar. Geology 1988, 16, 413–417. [Google Scholar] [CrossRef]
  44. Calais, E.; d’Oreye, N.; Albaric, J.; Deschamps, A.; Delvaux, D.; Déverchère, J.; Ebinger, C.; Ferdinand, R.W.; Kervyn, F.; Macheyeki, A.S.; et al. Strain accommodation by slow slip and dyking in a youthful continental rift, East Africa. Nature 2008, 456, 783–787. [Google Scholar] [CrossRef] [PubMed]
  45. Wright, T.J.; Ebinger, C.; Biggs, J.; Ayele, A.; Yirgu, G.; Keir, D.; Stork, A. Magma-maintained rift segmentation at continental rupture in the 2005 Afar dyking episode. Nature 2006, 442, 291–294. [Google Scholar] [CrossRef] [PubMed]
  46. Carracedo, J.C.; Guillou, H.; Nomade, S.; Rodriguez-Badiola, E.; Perez-Torrado, F.J.; Rodriguez-Gonzalez, A.; Paris, R.; Troll, V.R.; Wiesmaier, S.; Delcamp, A.; et al. Evolution of ocean-island rifts: The northeast rift zone of Tenerife, Canary Islands. Geol. Soc. Am. Bull. 2010, 123, 562–584. [Google Scholar] [CrossRef]
  47. Rubin, A.M. Propagation of Magma-Filled Cracks. Annu. Rev. Earth Planet. Sci. 1995, 23, 287–336. [Google Scholar] [CrossRef]
  48. Delaney, P.; Pollard, D. Deformation of Host Rocks and Flow of Magma during Growth of Minette Dikes and Breccia-Bearing Intrusions near Ship Rock, New Mexico; U.S. Government Publishing Office (USGPO): Washington, DC, USA, 1981; p. 69. [Google Scholar]
  49. Traversa, P.; Pinel, V.; Grasso, J.R. A constant influx model for dike propagation: Implications for magma reservoir dynamics. J. Geophys. Res. Solid Earth 2010, 115, 1–19. [Google Scholar] [CrossRef]
  50. Rivalta, E.; Segall, P. Magma compressibility and the missing source for some dike intrusions. Geophys. Res. Lett. 2008, 35, L04306. [Google Scholar] [CrossRef]
  51. Johnson, D.J. Dynamics of magma storage in the summit reservoir of Kilauea Volcano, Hawaii. J. Geophys. Res. 1992, 97, 1807. [Google Scholar] [CrossRef]
  52. Johnson, D.J.; Sigmundsson, F.; Delaney, P.T. Comment on “Volume of magma accumulation or withdrawal estimated from surface uplift or subsidence, with application to the 1960 collapse of Kilauea Volcano”. Bull. Volcanol. 2000, 61, 491–493. [Google Scholar] [CrossRef]
  53. Huppert, H.E.; Woods, A.W. The role of volatiles in magma chamber dynamics. Nature 2002, 420, 493–495. [Google Scholar] [CrossRef] [PubMed]
  54. Mastin, L.G.; Roeloffs, E.; Beeler, N.M.; Quick, J.E. Constraints on the Size, Overpressure, and Volatile Content of the Mount St. Helens Magma System from Geodetic and Dome-Growth Measurements During the 2004–2006+ Eruption. US Geol. Surv. Prof. Pap. 2008, 1750, 461–488. [Google Scholar]
  55. Amelung, F.; Day, S. InSAR observations of the 1995 Fogo, Cape Verde, eruption: Implications for the effects of collapse events upon island volcanoes. Geophys. Res. Lett. 2002, 29, 5–8. [Google Scholar] [CrossRef]
  56. Grosfils, E.B.; McGovern, P.J.; Gregg, P.M.; Galgana, G.A.; Hurwitz, D.M.; Long, S.M.; Chestler, S.R. Elastic models of magma reservoir mechanics: a key tool for investigating planetary volcanism. Geol. Soc. Lond. Spec. Publ. 2013, 401, SP401-2. [Google Scholar] [CrossRef]
  57. Mishina, M. Gravity survey in and around volcanoes Nyamuragira and Nyiragongo. In Volcanoes Nyiragongo and Nyamuragia: Geophysical Aspects; Tohoku University: Sendai, Japan, 1983; pp. 69–74. [Google Scholar]
  58. Hickman, S.H.; Healy, J.H.; Zoback, M.D. In situ stress, natural fracture distribution, and borehole elongation in the Auburn Geothermal Well, Auburn, New York. J. Geophys. Res. 1985, 90, 5497. [Google Scholar] [CrossRef]
  59. Segall, P. Earthquake and Volcano Deformation; Princeton University Press: Princeton, NJ, USA, 2010. [Google Scholar]
  60. Nobile, A.; Pagli, C.; Keir, D.; Wright, T.J.; Ayele, A.; Ruch, J.; Acocella, V. Dike-fault interaction during the 2004 Dallol intrusion at the northern edge of the Erta Ale Ridge (Afar, Ethiopia). Geophys. Res. Lett. 2012, 39, 2–7. [Google Scholar] [CrossRef]
  61. Sparks, R.S.J. The dynamics of bubble formation and growth in magmas: A review and analysis. J. Volcanol. Geotherm. Res. 1978, 3, 1–37. [Google Scholar] [CrossRef]
  62. Mastin, L.G.; Ghiorso, M.S. A Numerical Program for Steady-State Flow of Magma-Gas Mixtures through Vertical Eruptive Conduits; Department of the Interior: Washington, DC, USA, 2000.
  63. Newman, S.; Lowenstern, J.B. VolatileCalc: A silicate melt–H2O–CO2 solution model written in Visual Basic for excel. Comput. Geosci. 2002, 28, 597–604. [Google Scholar] [CrossRef]
  64. Papale, P.; Moretti, R.; Barbato, D. The compositional dependence of the saturation surface of H2O + CO2 fluids in silicate melts. Chem. Geol. 2006, 229, 78–95. [Google Scholar] [CrossRef]
  65. Head, E.M.; Shaw, A.M.; Wallace, P.J.; Sims, K.W.W.; Carn, S.A. Insight into volatile behavior at Nyamuragira volcano (D.R. Congo, Africa) through olivine-hosted melt inclusions. Geochem. Geophys. Geosyst. 2011, 12. [Google Scholar] [CrossRef]
  66. Amelung, F.; Yun, S.-H.; Walter, T.R.; Segall, P.; Kim, S.-W. Stress control of deep rift intrusion at Mauna Loa volcano, Hawaii. Science 2007, 316, 1026–1030. [Google Scholar] [CrossRef] [PubMed]
  67. Hamling, I.J.; Wright, T.J.; Calais, E.; Bennati, L.; Lewi, E. Stress transfer between thirteen successive dyke intrusions in Ethiopia. Nat. Geosci. 2010, 3, 713–717. [Google Scholar] [CrossRef]
  68. Grandin, R.; Socquet, A.; Jacques, E.; Mazzoni, N.; de Chabalier, J.-B.; King, G.C.P. Sequence of rifting in Afar, Manda-Hararo rift, Ethiopia, 2005–2009: Time-space evolution and interactions between dikes from interferometric synthetic aperture radar and static stress change modeling. J. Geophys. Res. 2010, 115, B10413. [Google Scholar] [CrossRef]
  69. Fialko, Y.A.; Rubin, A.M. Thermal and mechanical aspects of magma emplacement in giant dike swarms. J. Geophys. Res. Solid Earth 1999, 104, 23033–23049. [Google Scholar] [CrossRef]
  70. Lister, J.R. Steady solutions for feeder dykes in a density-stratified lithosphere. Earth Planet. Sci. Lett. 1991, 107, 233–242. [Google Scholar] [CrossRef]
  71. Acocella, V.; Neri, M. Dike propagation in volcanic edifices: Overview and possible developments. Tectonophysics 2009, 471, 67–77. [Google Scholar] [CrossRef]
  72. Poland, M.P.; Moats, W.P.; Fink, J.H. A model for radial dike emplacement in composite cones based on observations from Summer Coon volcano, Colorado, USA. Bull. Volcanol. 2008, 70, 861–875. [Google Scholar] [CrossRef]
  73. Hurwitz, D.M.; Long, S.M.; Grosfils, E.B. The characteristics of magma reservoir failure beneath a volcanic edifice. J. Volcanol. Geotherm. Res. 2009, 188, 379–394. [Google Scholar] [CrossRef]

