Article

An Autonomous System to Take Angular Thermal-Infrared Measurements for Validating Satellite Products

1
Earth Physics and Thermodynamics Department, University of Valencia, 50 Dr. Moliner, E-46100 Burjassot-Valencia, Spain
2
Instituto Universitario Centro de Estudios Ambientales del Mediterráneo–CEAM-UMH, 14 Charles Darwin, E-46980 Paterna-Valencia, Spain
*
Author to whom correspondence should be addressed.
Remote Sens. 2015, 7(11), 15269-15294; https://0-doi-org.brum.beds.ac.uk/10.3390/rs71115269
Submission received: 30 July 2015 / Revised: 22 October 2015 / Accepted: 10 November 2015 / Published: 13 November 2015

Abstract

:
An autonomous system for field land surface temperature (LST) measurements taken at different observation angles was developed to be deployed easily at any conventional meteorological tower station. The system permits ground-truth data to be acquired on a continuous basis, and angularly scans land and sky hemispheres with a single thermal-infrared (TIR) radiometer. This paper describes the autonomous angular system and the methodology to assess ground-truth LST and relative-to-nadir emissivity data from system measurements. Ground-truth LSTs were used to validate satellite-retrieved LST products at two experimental sites (rice crop and shrubland areas). The relative-to-nadir emissivity values were used to analyze the anisotropy of surface emissive properties over thermally-homogeneous covers. The EOS-MODIS MOD11_L2/MYD11_L2 LST product was evaluated and shown to work within expected uncertainties (<2.0 K) when tested against the system data. A slight underestimation of around −0.15 K was observed, which became greater for the off-nadir observation angles at the shrubland site. The system took angular measurements for the different seasonal homogeneous covers at the rice crop site. These measurements showed emissivity angular anisotropies, which were in good agreement with previously published data. The dual-view ENVISAT-AATSR data reproduced them, and revealed that the system data collected for thermally-homogeneous surfaces could be used to test future satellite TIR sensors with multi-angular or bi-angular capabilities, like the forthcoming SLSTR on board Copernicus Sentinel-3A.

Graphical Abstract

1. Introduction: Background and Objectives

Land surface temperature (LST) and thermal-infrared emissivity are defined at the interface between the Earth’s surface and its atmosphere, and are critical variables for understanding land-atmosphere interactions. Thus LST and emissivity are key parameters in a wide range of environmental applications, such as meteorological, climatological, and hydrological studies, which involve energy and water fluxes [1]. They can also be used for other applications, like detecting changes in land cover and use [2]. Current remote-sensing techniques are the best tools to obtain LST and emissivity data from regional to global scales, different periodicities, and long-term coverage. An optimal uncertainty of ±1K in LST retrievals is expected [3]. However, new satellite missions and retrieval techniques need ground-truth LST and emissivity data to be validated and improved to obtain better accuracy. Ground-truth LSTs also permit the estimation of the different heat fluxes and, thus, the validation of satellite flux products [4,5]. In previous papers, LST products were fundamentally validated using data measured mainly along transects during specific field campaigns as a reference [6,7,8,9]. In recent years, our purpose has been to combine them with continuous data recording using an autonomous system deployed at permanent stations, which is also able to perform angular scans to analyze the anisotropy of surface LST and emissivity. An autonomous device for the routine field data acquisition of angular TIR measurements was designed and integrated into conventional meteorological stations. The device was designed to determine accurate LSTs and angular dependences, with appropriate atmospheric and emissivity corrections of TIR data, and to reduce the number of radiometers that each permanent station needs. We are unaware of the existence of previous similar systems and our design was not inspired in previously published devices. This device performs complete angular scans to sample land and sky temperatures with a single TIR radiometer, rather than using radiometers fixed at specific viewing angles. The latter is the case of the Oklahoma Mesonet’s skin temperature network [10] and of single stations like that described in [11], or that pointing at three specific zenithal angles for one azimuthal angle described in [12]. The angular measurements taken by our system can provide valuable information to assess hemispherical sky radiance by a simple numerical sum or integration of data [13], which is required to atmospherically correct the system-measured data to retrieve LSTs. Angular data are also useful for characterizing angular dependences of land surface temperatures and emissivities. The paper follows with Section 2, which describes the experimental system and setup. Section 3 offers the system data analysis. Section 4 shows the validation of the satellite-retrieved LST products and the analysis of the emissivity anisotropy for homogeneous covers. Finally, Section 5 summarizes the main conclusions.

2. Experimental System and Setup

The proposed system is an autonomous device that can rotate automatically to attain a set of zenith and azimuth viewing angles for which a single TIR radiometer takes measurements. The convenience of this configuration is the achievement of complete scans of both land and sky hemispheres by means of sweeping measurements at predefined angles. Moreover, using only one TIR radiometer with a single calibration avoids possible intercalibration problems.

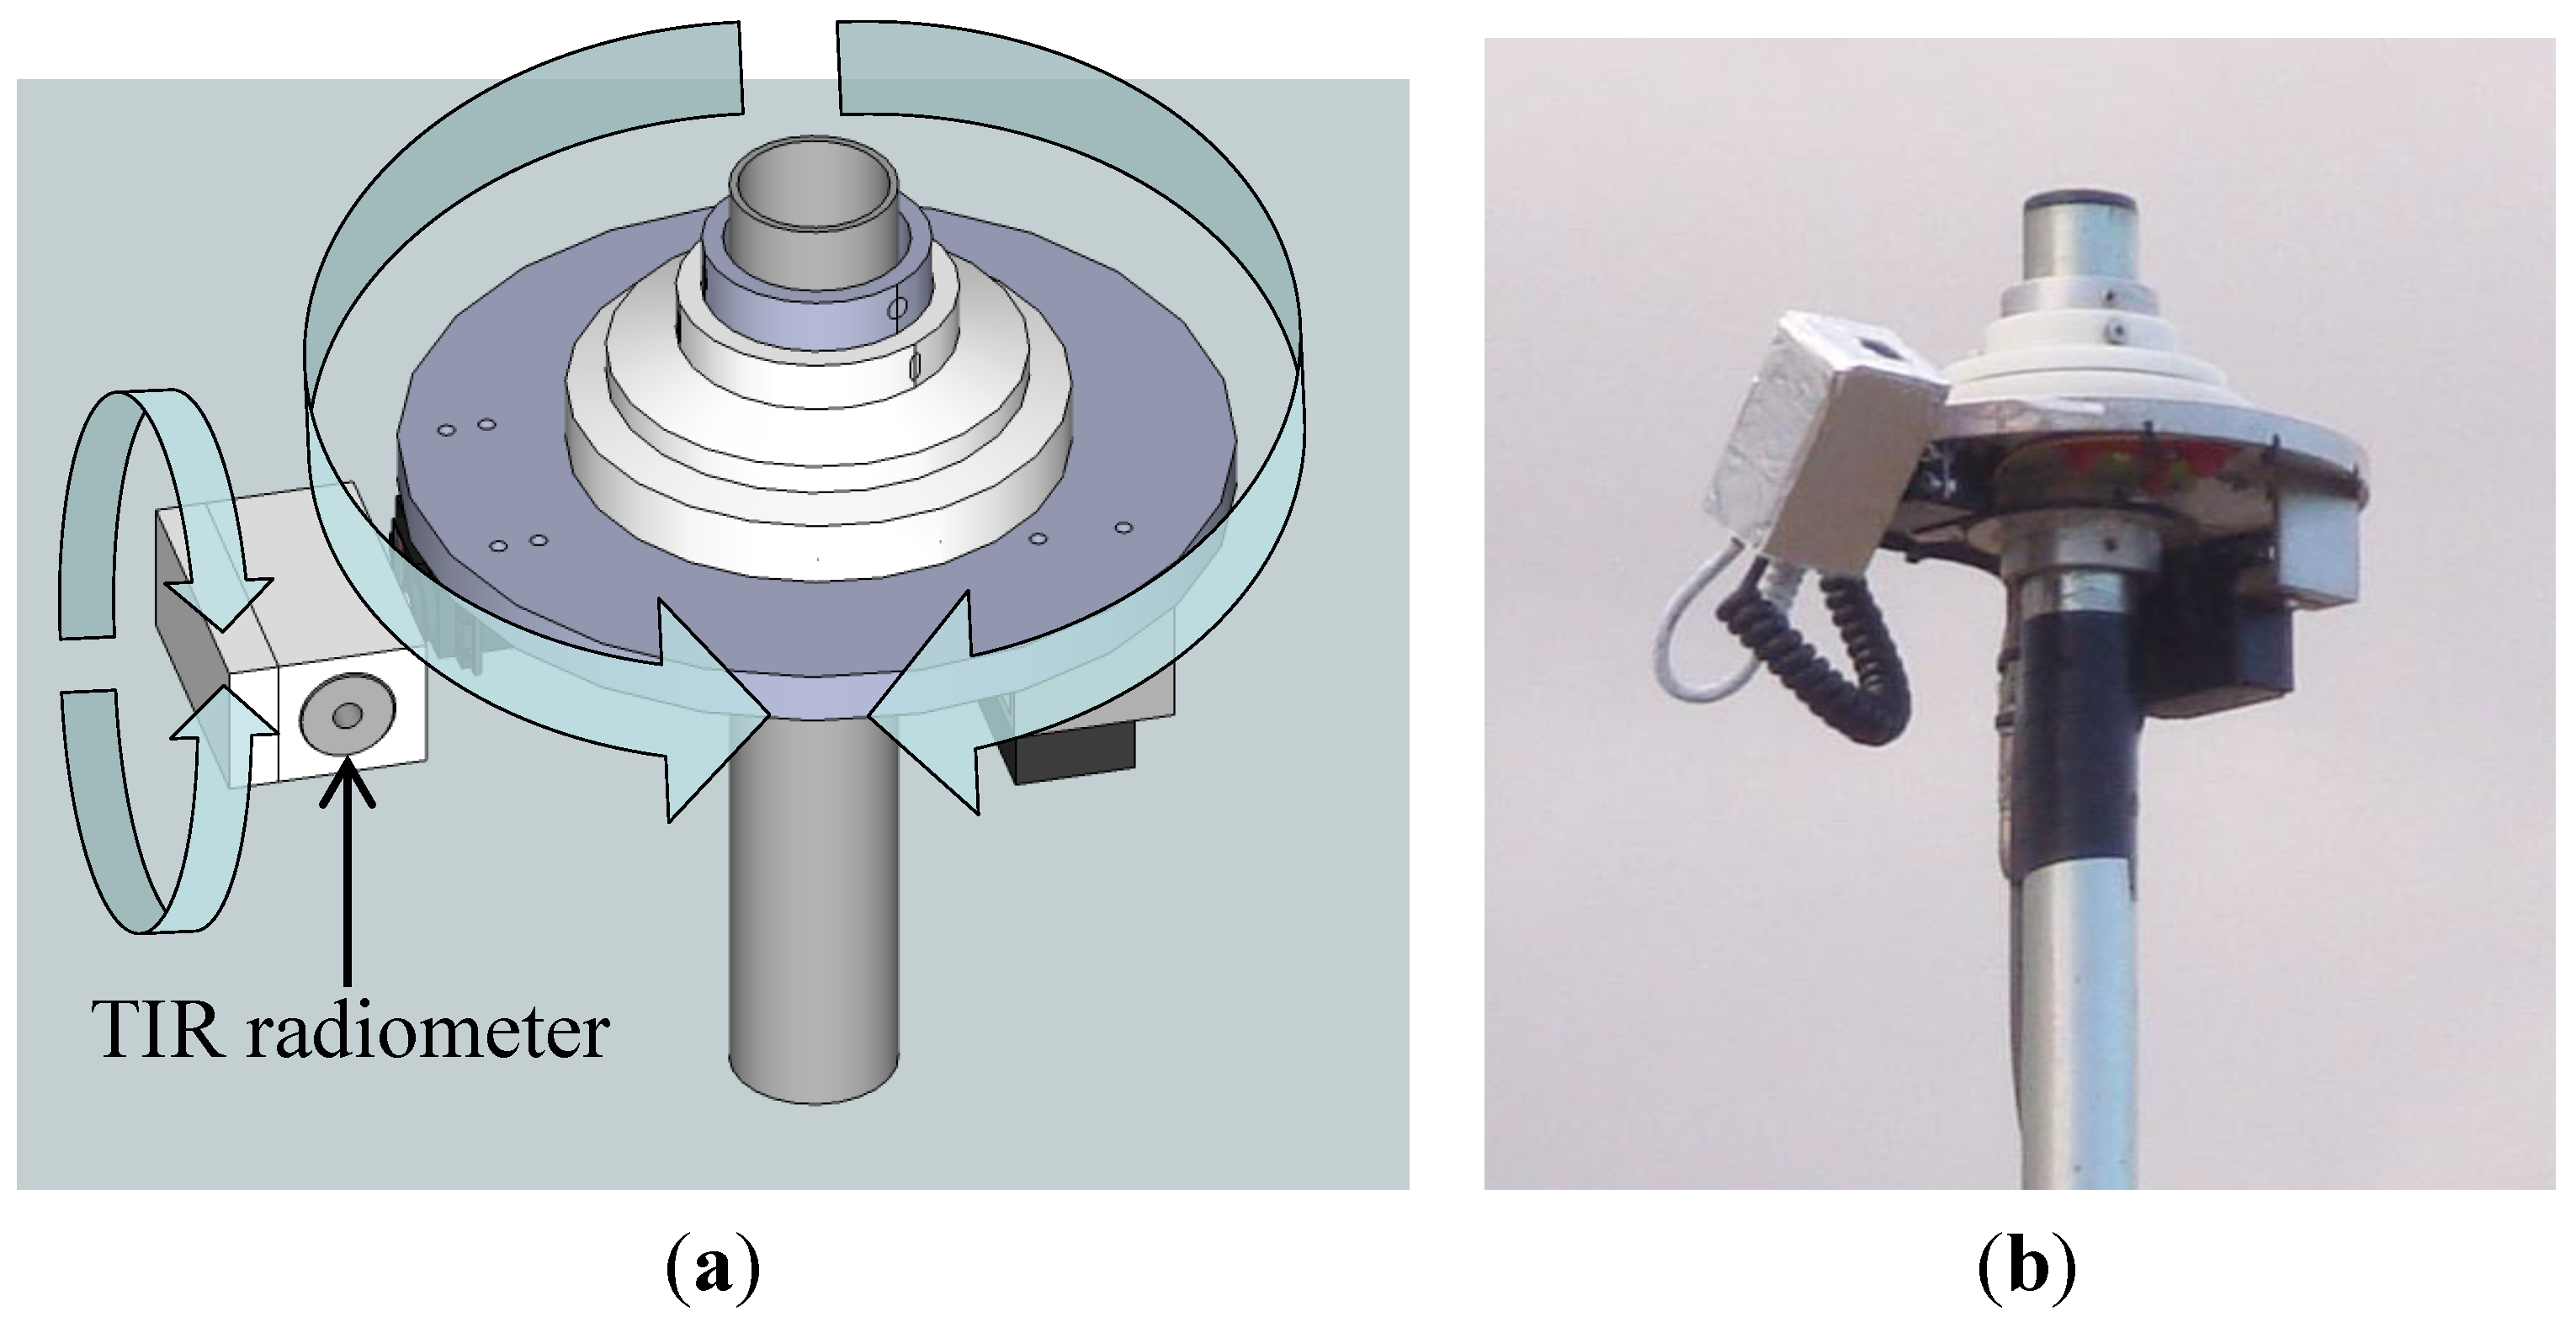
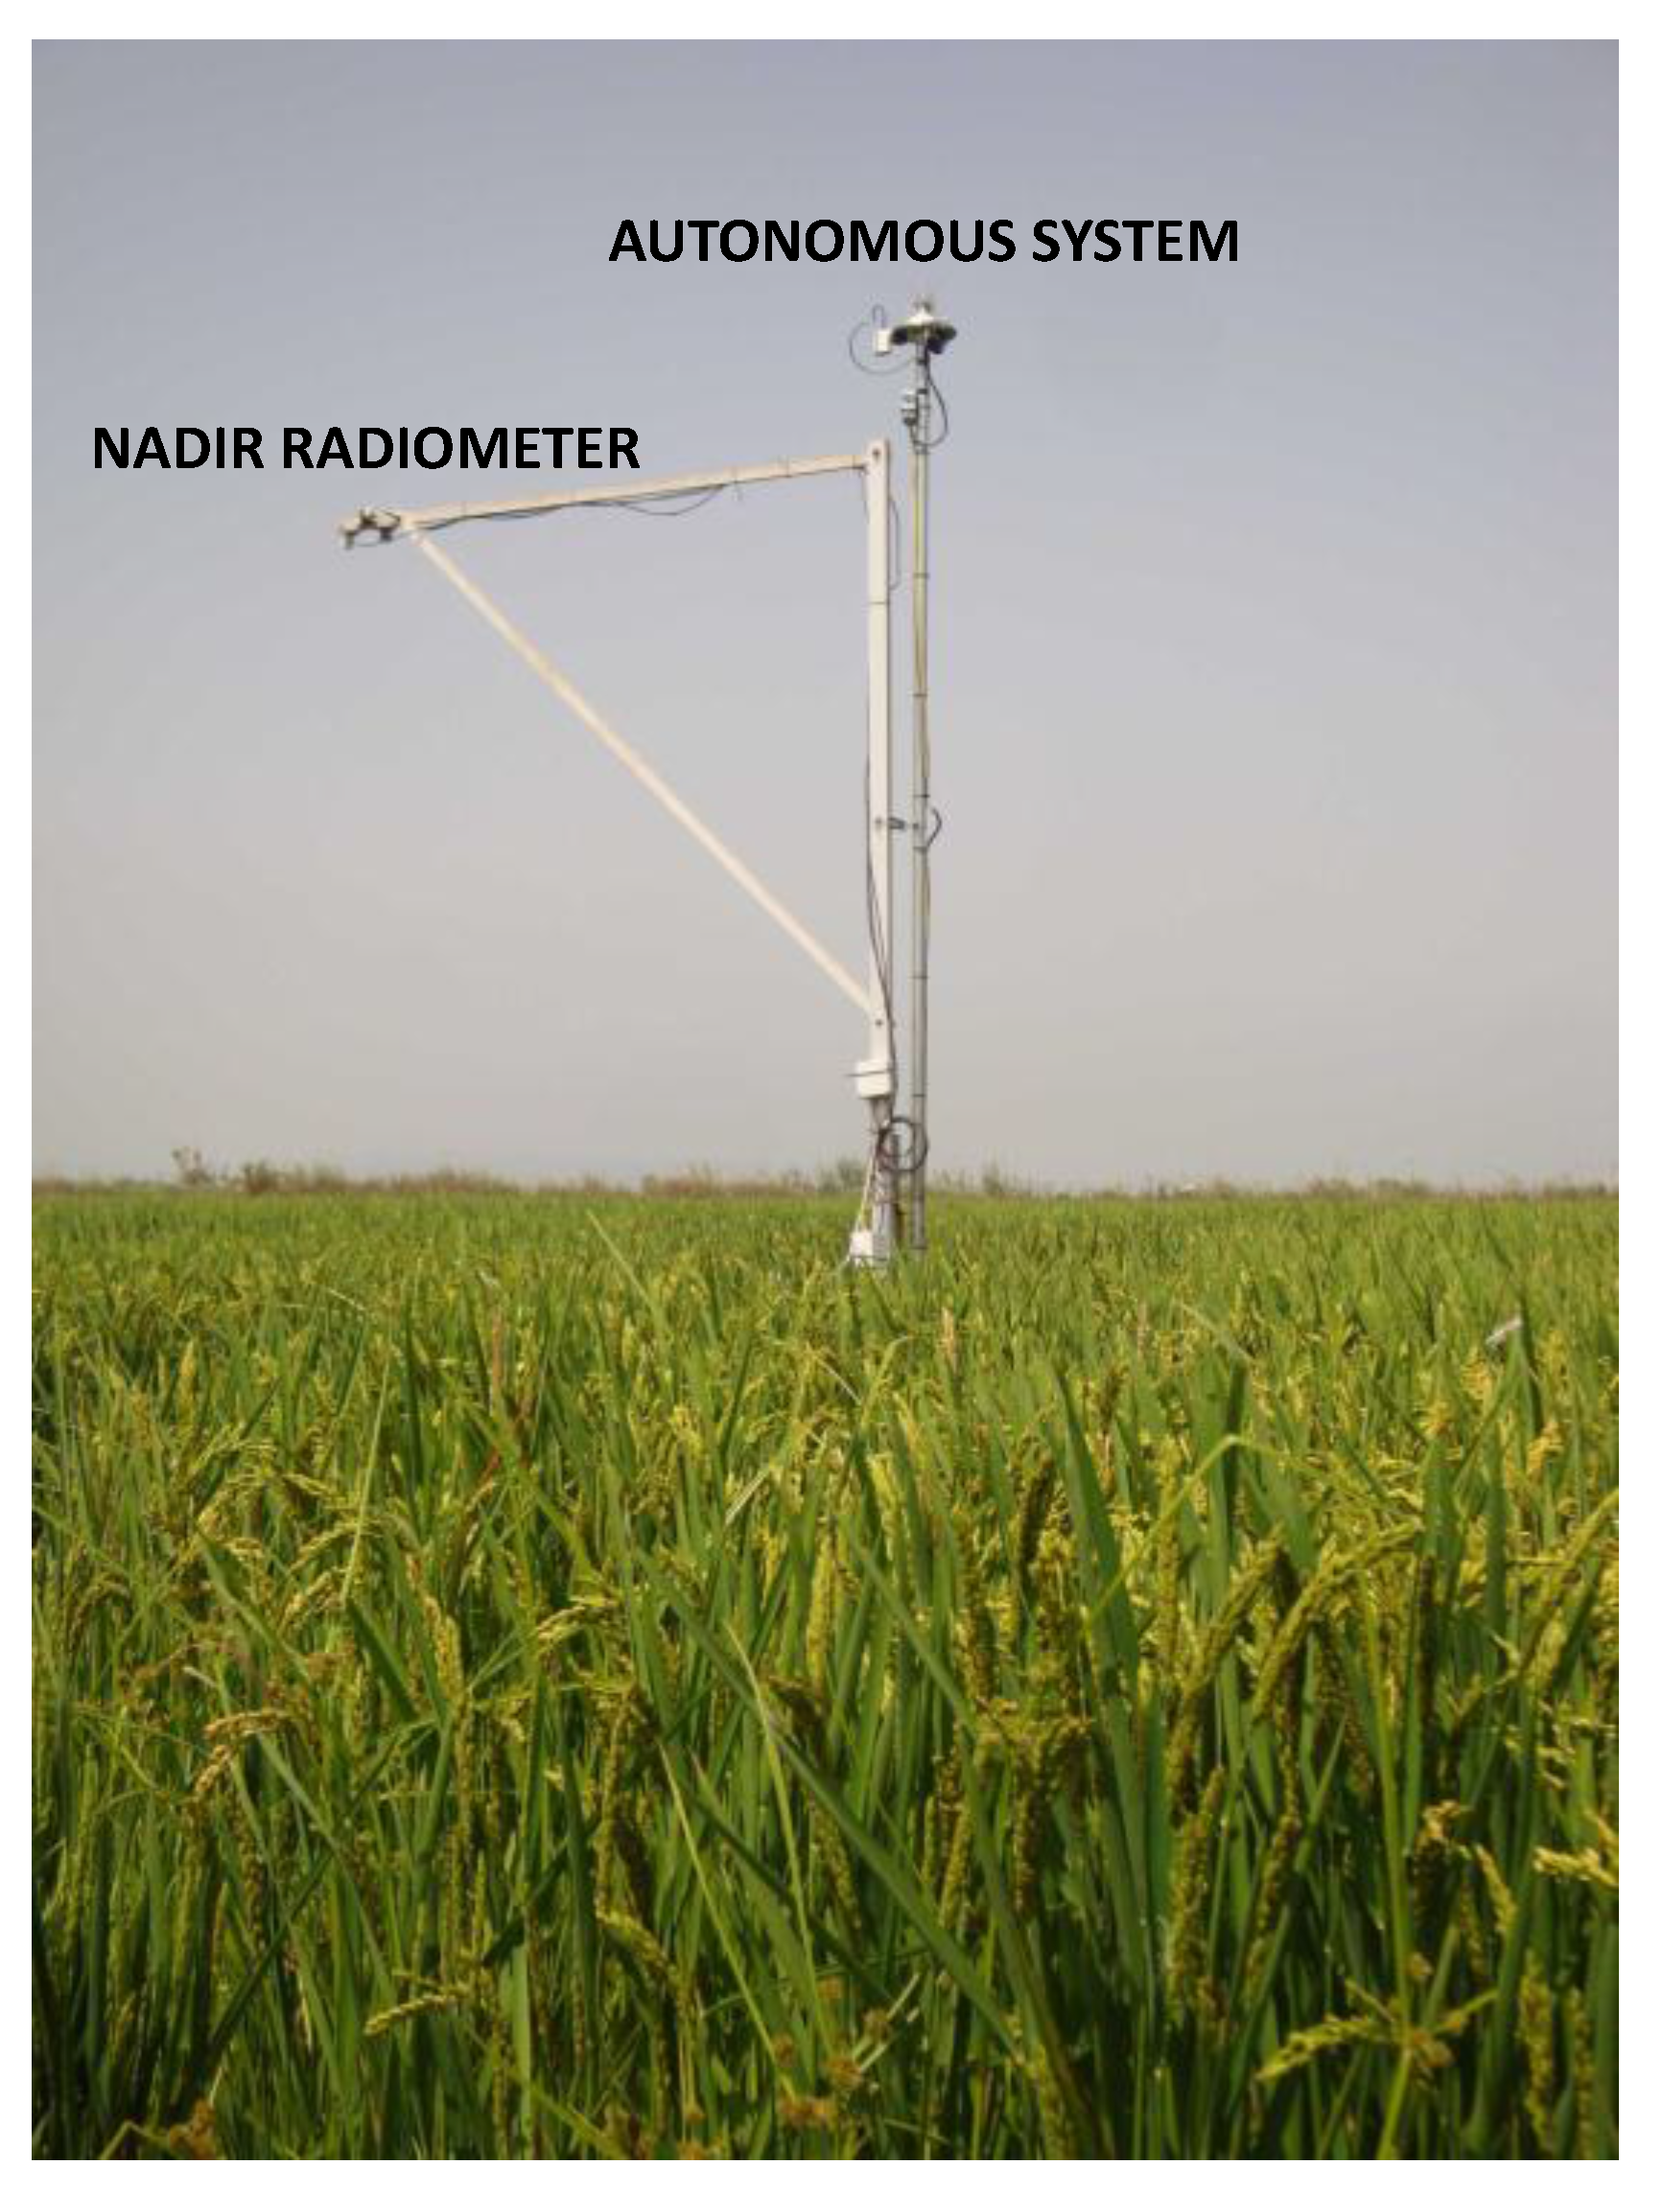
2.1. Description of the Autonomous System

The system has a leveled plate that rotates around a hollow cylinder, which acts as a system axis (Figure 1). A ball bearing is inserted between the above two elements, which allows the main plate to rotate around the fixed cylinder to attain any desired azimuth observation angle. A servomotor and a gear wheel below the main plate are the mechanical parts that are in charge of driving the system to the selected azimuth positions. A second servomotor, whose axis is placed radially to the cylinder, is attached to the bottom main plate face to control the zenith positioning of a TIR radiometer. The radiometer is enclosed inside a rectangular-shape head built in polyamide, which is externally isolated with aluminum-plated foam film. The head is attached to the second servomotor axis and acts as a radiation shield to prevent the detector from solar heating. It also contains a digital inclinometer that provides precise knowledge of the actual viewing zenith angle. By using a magnet appended to the bottom main plate face, three equidistant reed switches fixed to the rotation axis are used to maintain precise information on the system’s azimuth positioning. The hollow cylinder allows the insertion of a 40-mm diameter mast of any desired height for taking measurements. Many conventional meteorological station towers end in a mast to accommodate different sensors. The system can be integrated into such towers at any desired level, and not necessarily the highest.
Figure 1. (a) System design and (b) view of the autonomous system.
Remotesensing 07 15269 g001

2.2. Data Acquisition Procedure

The motion made by the system to attain different viewing directions is controlled by an extensively used CR1000 Campbell datalogger. A serial servo controller is placed between the datalogger and servomotors to attain accurate positioning and smooth movements. Although selecting the ensemble of the azimuth and zenith observation angles where measurements are to be taken is possible, the system is operationally configured for 10 azimuth and 11 zenith equally-spaced positions (azimuth angles of 18, 54, 90, 126, 162, 198, 234, 270, 306, and 342 degrees from north, and zenith angles of 0, 18, 36, 54, 72, 90, 108, 126, 144, 162, and 180 degrees from zenith). For this configuration, a complete sweep of both sky and land hemispheres fits a 15-min period well. The system takes the 11 consecutive and different zenith-angle measurements on the same vertical plane, moves to the following azimuth angle through a horizontal rotation and starts taking the next 11 measurements at the selected zenith angles. The time period that elapses between one single measurement and the following is set at four seconds. During the first second, the system is allowed to change position. Afterward the radiometer response can be finally accommodated during the consecutive two-second period. Lastly, TIR measurements are taken during the fourth second. In addition to measuring the target and internal sensor temperatures, both zenith and azimuth angles are also stored by the datalogger. In all, the system takes 440 seconds to complete a whole scan at the default setting. The difference to a 15-min period, i.e., 460 seconds, is used to perform other operational tasks. They consist of: an automatic azimuth reference using the response of three fixed reed switches to the main plate magnet motion, data transmission by means of a communication modem to avoid interferences when sampling the TIR sensor, and basic and smooth system motions to attain the starting and resting positions.

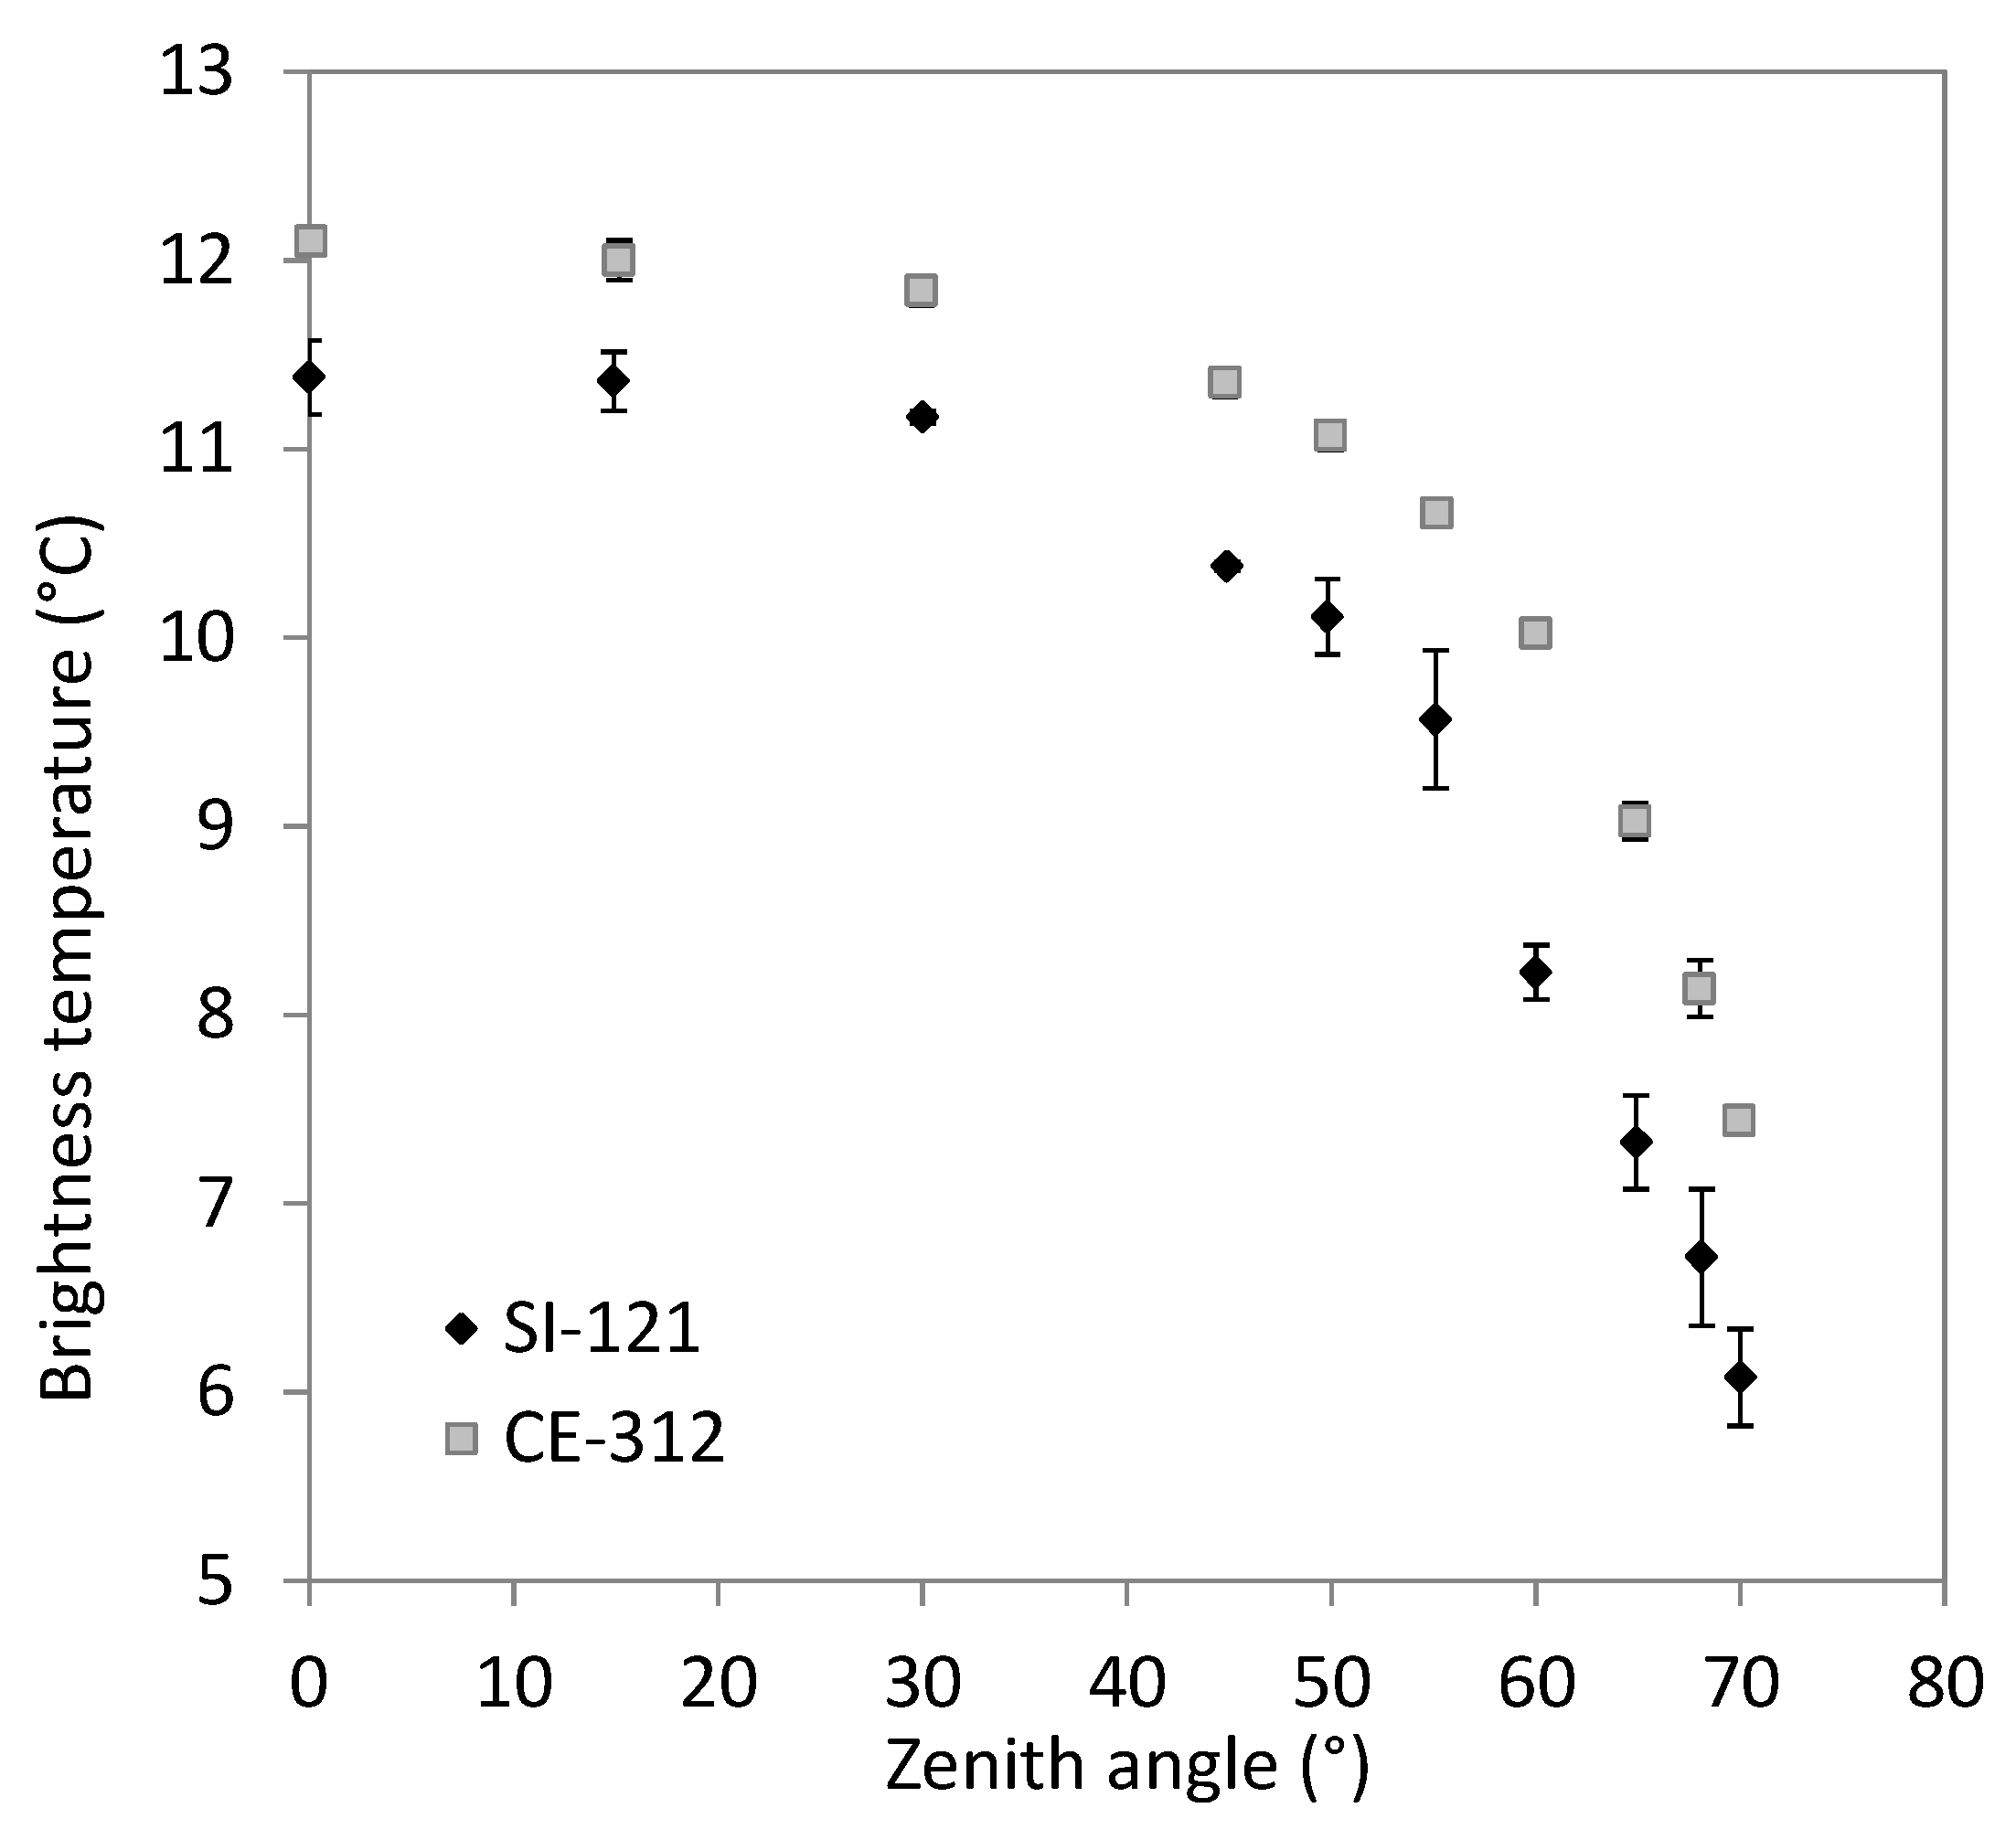
2.3. TIR Radiometer Integrated into the System

The 8–14 µm Apogee Instruments Infrared Radiometer model SI-121 (www.apogeeinstruments.com) was selected for different reasons. Its small size and mass (190 g) and durability under field conditions make the radiometer suitable for the system’s autonomous angular movement at permanent stations. Another reason was its good quality-price ratio, as proved in calibrations with traceable blackbodies. The radiometric temperature accuracies for the Apogee SI-121 radiometers used for this study were obtained through calibrations against: (a) a Landcal Blackbody Source P80P with temperatures from 278 K to 303 K, performed at our laboratory regularly, and (b) a National Institute of Standards and Technology (NIST) blackbody with temperatures from 283 K to 303 K during a TIR radiometer comparison campaign organized by the Committee on Earth Observation Satellites (CEOS) [14]. Accuracies of ±0.2 K were obtained at temperatures from 278 K to 303 K with (a), and were better than ±0.2 K at 293–303 K with (b) [14]. Apogee radiometers incorporate a germanium lens at their front aperture, which provides an almost square transmission window from 8 to 14 μm. The radiometer’s response time to changes in target temperature is less than one second. However, minor fluctuations were observed during periods that lasted longer than one second if the radiometer was exposed to target temperature changes in the order of 20 K. The system uses a period of four seconds, which is longer than the radiometer’s response time, to avoid the problem and to increase measurement reliability. The SI-121 half angle field-of-view (FOV) is 18°. It corresponds to the radius of a hemispherical circle from which 98% of the radiation viewed by the radiometer detector is emitted. The cumulative ratio of the radiation received at the radiometer detector in terms of its peripheral vision follows a Weibull cumulative distribution function. The corresponding Weibull probability density function determines a weighting filter for incoming radiation in observation angle terms. For instance, the distribution establishes that 90% of detected radiance comes from a solid angle sustained by a 10° half-angle in relation to the lens center. To test the radiometer’s capability to reproduce the angular variation of the TIR surface emission, we took angular measurements over a water surface with a SI-121 and a Cimel Electronique CE-312 radiometer (with an 8–13 µm wide spectral band). The CE-312 radiometer has a half angle of 5° (www.cimel.fr) [15]. According to the abovementioned TIR radiometer comparison campaign [14], both radiometers agreed with a reference blackbody within ±0.2 K at 293–303 K. Figure 2 shows a comparison between both radiometers in terms of brightness temperatures for different viewing angles. Error bars show standard deviations of six measurements collected at each viewing angle. The same comparison is made in Section 3.2 in terms of emissivities. Both radiometer measurement sets were acquired with a time difference of around 1.5 h; thus, they were not concurrent, which is the main cause of the temperature differences observed in Figure 2. Additionally, smaller differences can be found between the CE-312 (5° half angle, 8–13 µm) and SI-121 (18° half angle, 8–14 µm) measurements due to differences in the band spectral response functions and FOVs of the radiometers, together with the angular variations in water surface emissivities and downwelling sky radiances. The water emissivity spectral decrease from 0.991 (at 11 µm) to 0.961 (at 14 µm) at nadir implies differences of around 0.002 between the band emissivity values for CE-312 and SI-121. In any case, and despite the wide FOV of the SI-121 radiometer, Figure 2 shows that its data reproduce quite well the angular dependence observed for a water surface with the narrower-FOV CE-312 radiometer. This figure also shows that zenith angle dependence is greater than possible horizontal inhomogeneity since zenith angles were scanned over the water surface.
Figure 2. Angular variations of the brightness temperatures measured over a water surface by radiometers SI-121 (18° half angle FOV, 8–14 µm) and CE-312 (5° half angle FOV, 8–13 µm).
Remotesensing 07 15269 g002

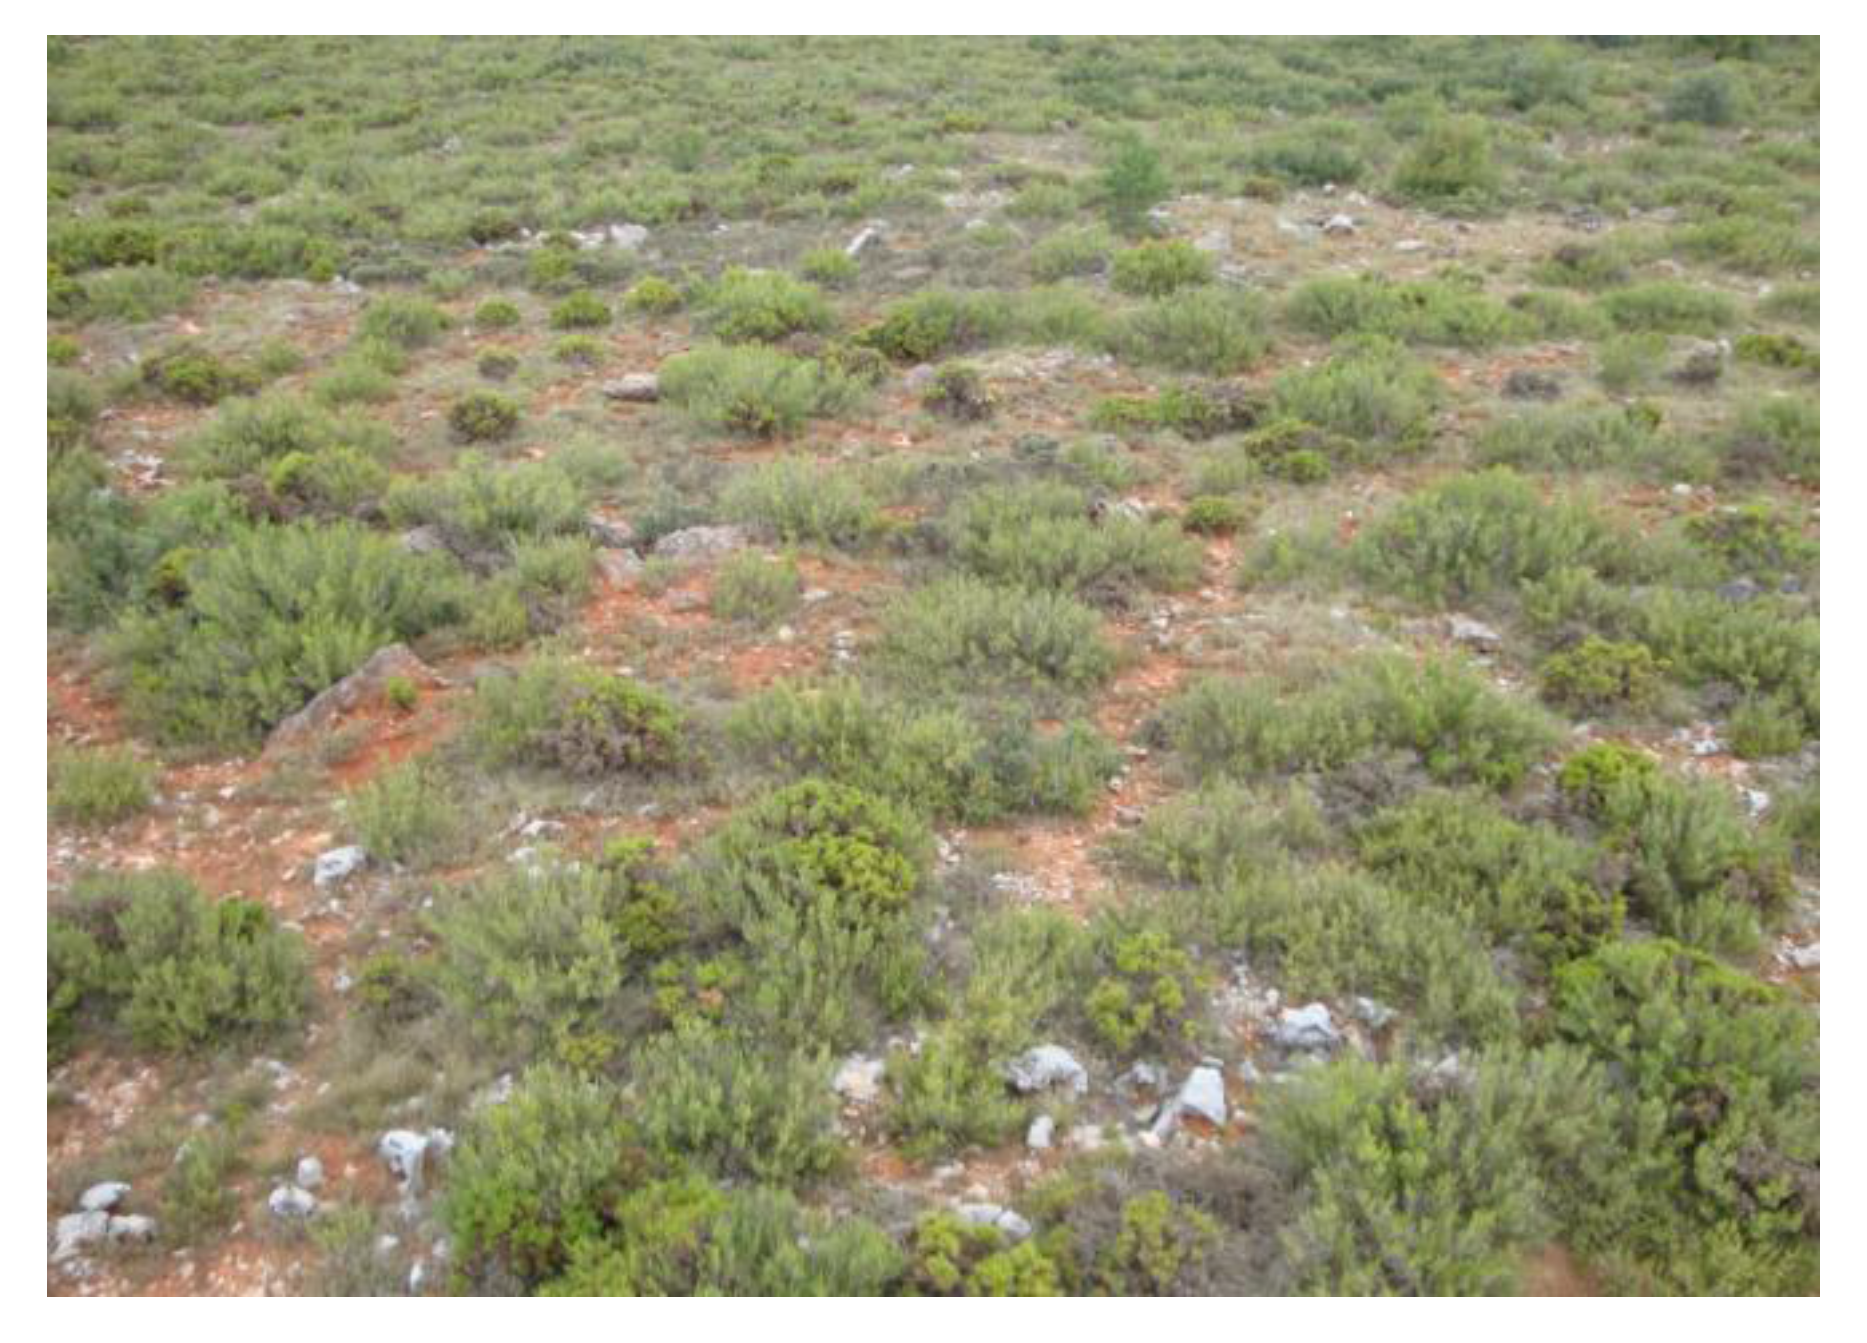
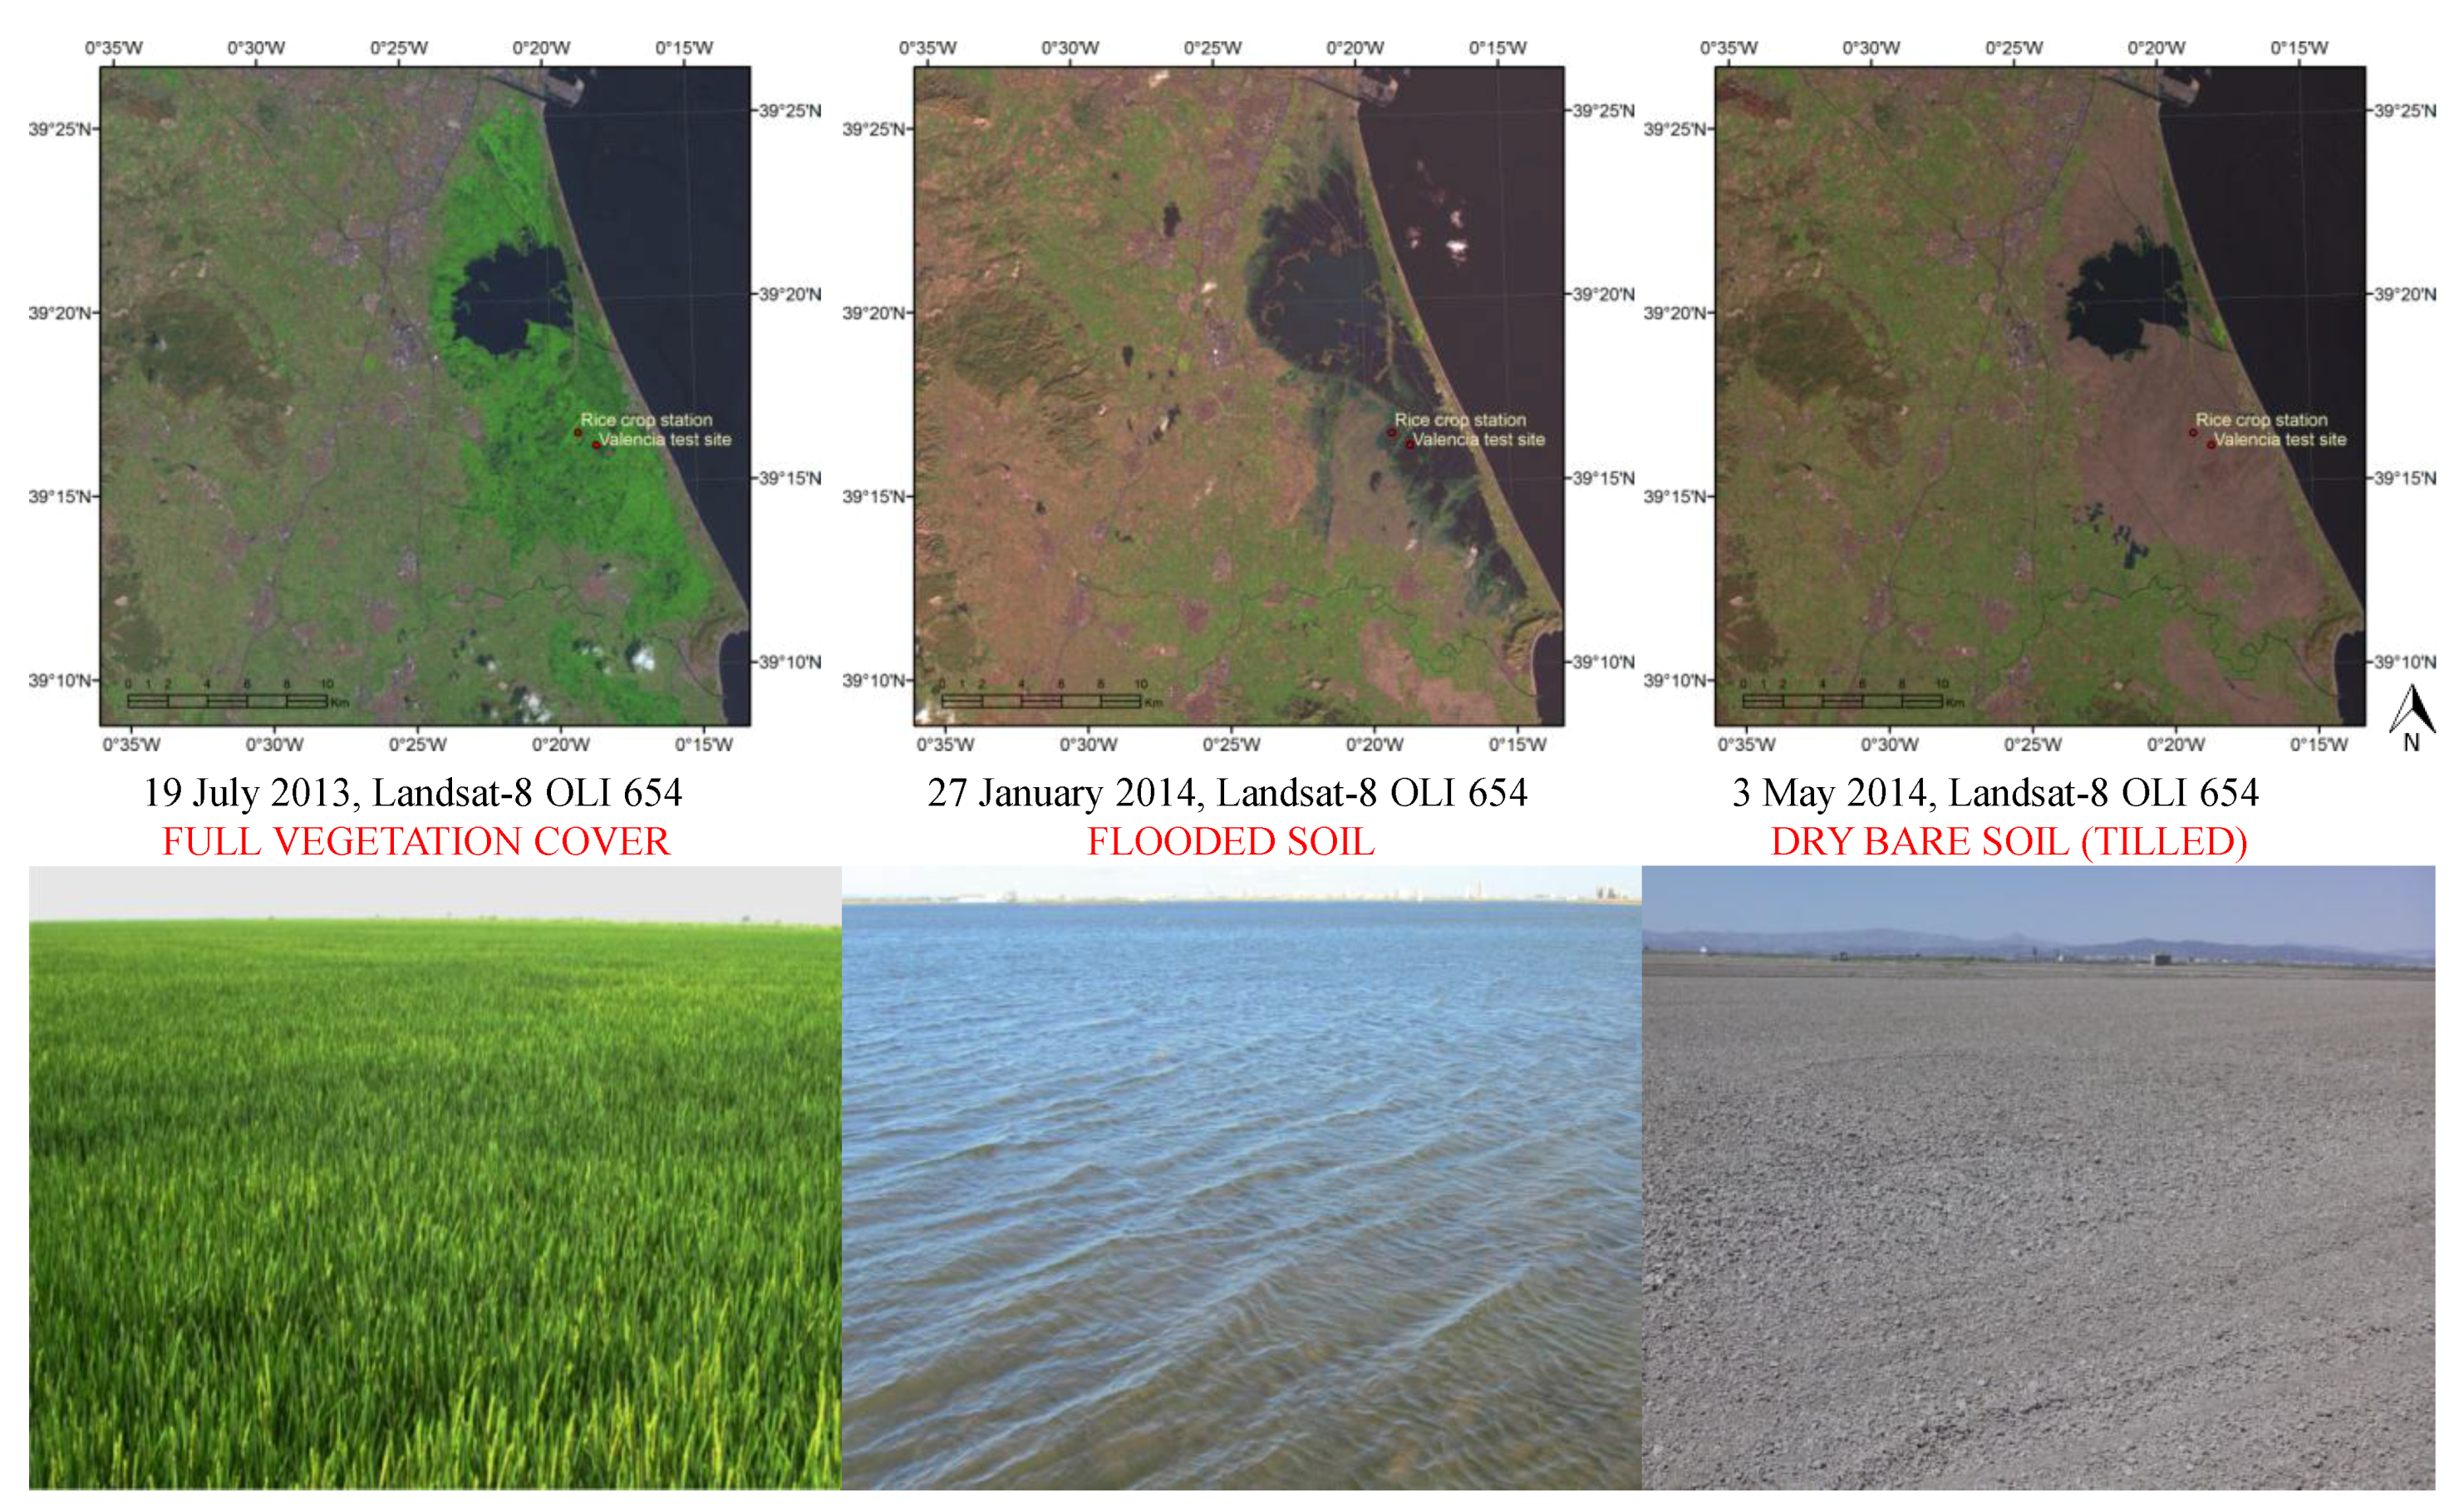
2.4. Field Setup: Experimental Sites

The autonomous and angular system was first deployed at two experimental sites located in: (a) a ~100 km2 flat and homogeneous area of rice crop fields (39.274°N, −0.317°E in WGS-84; 2.5 m above sea level) and (b) a ~200 km2, high-plain area of shrubland (39.224°N, −0.903°E in WGS-84; 800 m above sea level) dominated by rosemary (Rosmarinus officinalis L.) and gorse (Ulex parviflorus L.). The second site is the typical Mediterranean calcic thermophile shrubland, which is one of the most representative natural canopies in Eastern Spain (Figure 3) [16]. The shrubland site has a fraction of vegetation cover (FVC) of around 0.49 for the nadir view, which remains almost constant throughout the year [16]. The rice crop site has a FVC close to one (i.e., full vegetation cover), from July to harvest in September, and is then flooded from December to January, and also in June. The land cover changes from wet to dry bare soils from February to May, except for significant precipitation events, which are frequent in April. Growing, flooding, and harvesting occur over short periods of time for all the individual plots in the rice field area. Thus, the site is homogeneous for most of the year. Seasonal land cover variation makes this site interesting since different surface conditions can be studied by the system with time (Figure 4). The cultivated rice area with a full vegetation cover has been extensively used in experimental validation campaigns of satellite TIR sensors, in which the area was called the Valencia Test Site [6,7,16,17]. In these references, the spatial thermal homogeneity for the rice crop site area was evaluated at satellite scale using Landsat-5 TM and EOS ASTER data. Standard deviations below ±0.5 K for an area up to ~16 km2 were obtained. The spatial thermal homogeneity of the shrubland site area was also evaluated in [16] using Landsat-5 TM data. Standard deviation values of ±1.1 K were obtained for an area of ~16 km2 in summer (when higher thermal heterogeneity is expected), which revealed a relatively high thermal homogeneity for a shrubland area. At the rice crop site, the system was affixed to the top of a three-meter mast erected vertically on a 40-cm-wide farming plot ridge (Figure 5). With the described configuration, there were some observation angles where the ridge was viewed partly by the system SI-121 radiometer, but most angles had representative and homogeneous views of the crop. A second SI-121 radiometer was fixed for a continuous nadir view of the crop on a horizontal arm (Figure 5). It was setup at an azimuth direction of 216° to avoid any significant contribution of the secondary radiometer emission on the system’s radiometer measurements. At the shrubland site, the system was deployed at a 10-meter height at the top of a conventional meteorological tower. The measurements that corresponded to observation angles for which the system radiometer faced parts of the meteorological tower were removed from the records.
Figure 3. View of the shrubland site from the station.
Remotesensing 07 15269 g003
Figure 4. Seasonal land cover variation at the rice crop site, with three different covers studied with time. Landsat-8 OLI false color images (RGB 654) and site views on 19 July 2013 (full vegetation cover), 27 January 2014 (flooded soil), and 3 May 2014 (bare soil).
Remotesensing 07 15269 g004
Figure 5. Deployment of the autonomous system at the rice crop site.
Remotesensing 07 15269 g005

3. Data Processing Methods

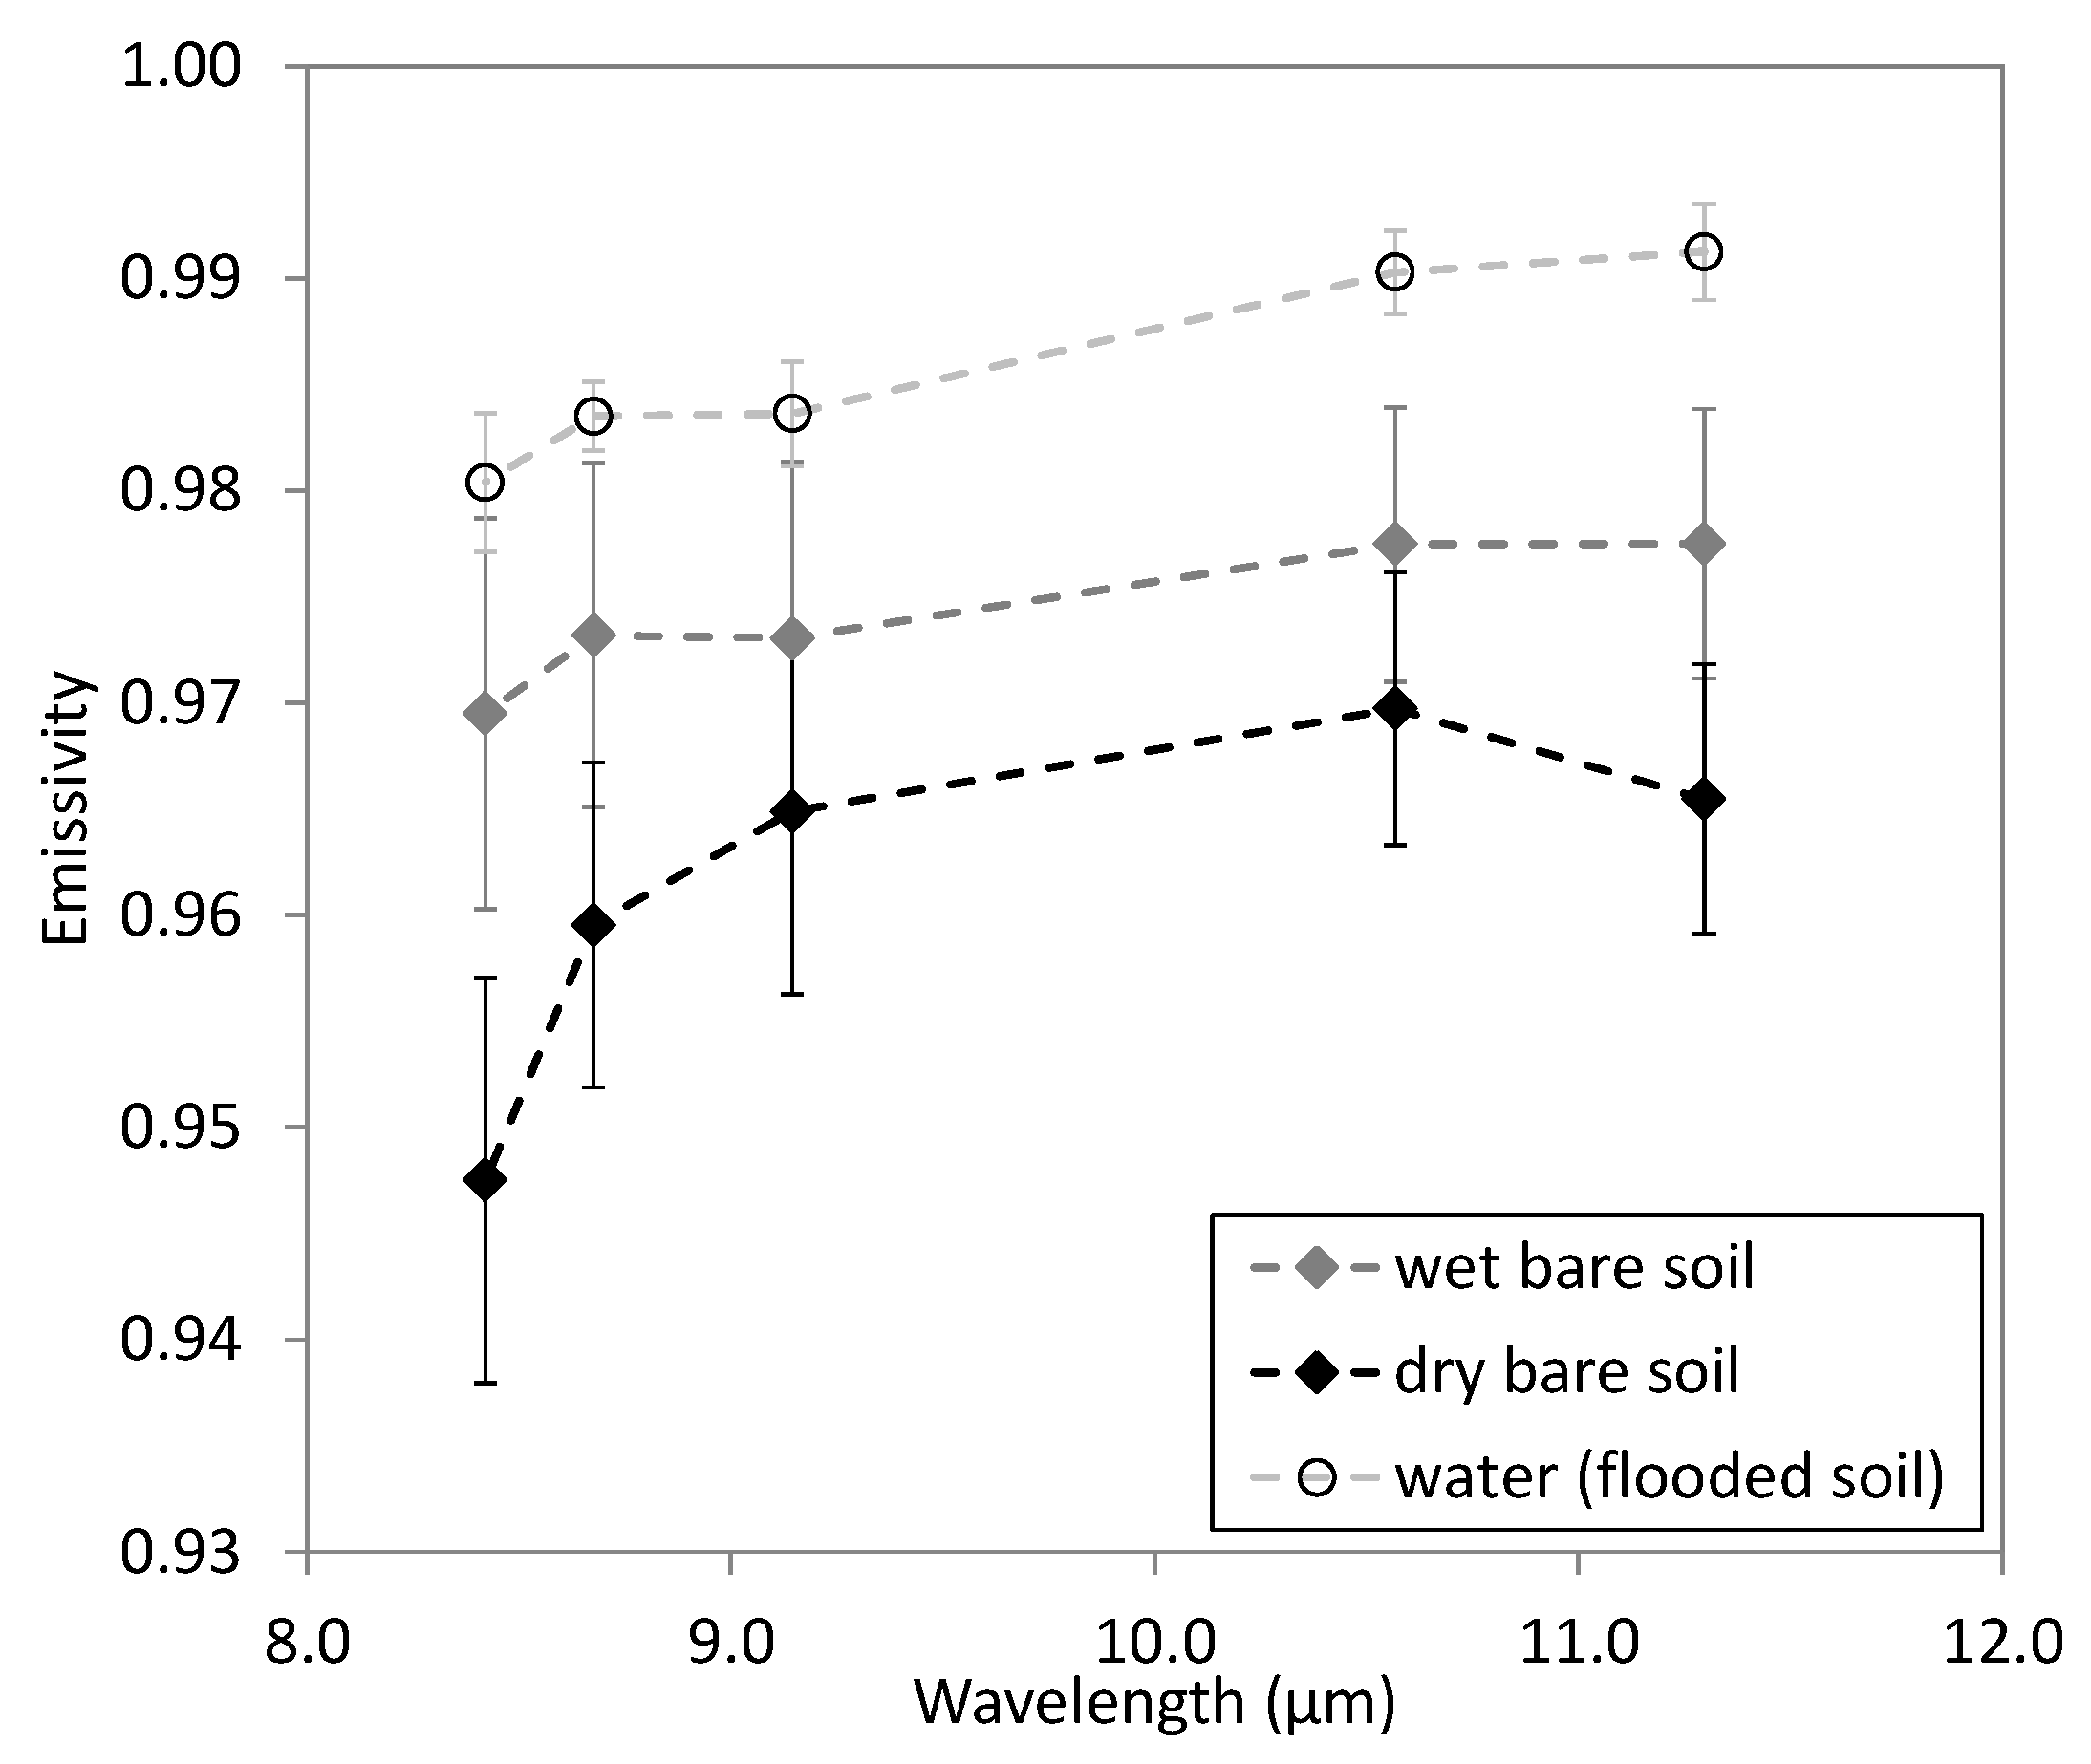
3.1. Ground-Truth LST Retrieval: Emissivity Correction

The radiance measured by band i of a TIR radiometer, which observes a surface at ground level for a direction ( θ , ϕ ) , can be expressed as follows:
L i ( θ , ϕ ) = ε i ( θ , ϕ ) B i ( T ) + ( 1 ε i ( θ , ϕ ) ) L i a t m , h e m
where B i ( T ) is the averaged Planck’s function for band i and T is the LST; ε i ( θ , ϕ ) is the directional surface emissivity; and L i a t m , h e m is the hemispheric downwelling radiance, i.e., the downwelling irradiance divided by π. The latter can be obtained by integrating the atmospheric radiance that comes from any viewing direction:
L i a t m , h e m = 1 π 0 2 π 0 π / 2 L i a t m ( θ , ϕ ) cos θ sin θ d θ d ϕ
In case of horizontal homogeneity of the atmosphere, i.e., totally cloud-free or cloudy conditions, sky radiances follow the expressions [13]:
L i a t m ( θ , ϕ ) = L i a t m ( θ ) L i a t m ( 0 o ) cos x i ( θ )
L i a t m , h e m = 2 2 x i L i a t m ( 0 o )
Cloud-free conditions are required to retrieve the LST from satellite TIR observations and to, thus, validate their data by comparison with ground LST measurements. Therefore, Equations (3) and (4) can be used to obtain L i a t m , h e m from the system angular L i a t m ( θ ) measurements. A linear regression between ln ( L i a t m ( θ ) ) and ln ( cos ( θ ) ) for each scan, following Equation (3), respectively provides xi and L i a t m ( 0 º ) from the slope and offset, as required to obtain L i a t m , h e m by Equation (4). The azimuthal data dispersion around the regression line is negligible for the scans collected under cloud-free conditions and is taken into account for estimating the uncertainties for xi, L i a t m ( 0 º ) , and L i a t m , h e m .
Emissivity measurements were taken at the experimental sites by the temperature-emissivity separation method (TES) [18,19] and the box method [20] and CE-312 radiometers with six TIR bands (b1: 8–13 μm, b2: 11.0–11.7 μm, b3: 10.3–11.0 μm, b4: 8.9–9.3 μm, b5: 8.5–8.9 μm and b6: 8.1–8.5 μm) [15]. The TES method was used especially for surfaces with significant emissivity spectral and angular variations (e.g., flooded soils and wet-to-dry bare soils), while the box method was used for vegetation covers. The emissivity results for the fully-vegetated cover at the rice crop site showed similar emissivity values in all the bands. A near-gray body spectrum was obtained with ε ≈ 0.985 ± 0.005 and negligible spectral variation between eight and 13 μm [7,16,17]. Similar results were obtained by the box method for the rosemary and gorse samples at the shrubland site, with ε ≈ 0.982 ± 0.005 and ε ≈ 0.983 ± 0.006 between eight and 13 μm, respectively. Figure 6 shows the TES method results for the wet (February) and dry (May) bare soils at the rice crop site. The low values for the CE-312 band six (8.1–8.5 μm) have Reststrahlen effects due to the presence of quartz in bare soil [21]. The effects diminish for the wet soils since water strongly absorbs in the region of the quartz Reststrahlen bands [21]. Figure 6 also shows the water emissivity values for the flooded soils (December-January and June) at this site obtained from [22] since there is no difference for fresh water and sea water emissivities [23]. A hand-portable Fourier transform infrared (FT-IR) spectrometer, Designs and Prototypes (D&P) Instruments model 102 [24], was used to test the spectral variation observed with the other methods. Emissivity spectra were obtained from the spectrometer wavelength-based radiance data by a spectral smoothness method [24]. This method obtains the target surface temperatures by minimizing the reflected atmospheric emission lines within a portion of the measured spectra. Figure 7 shows the D&P FT-IR spectra obtained for a soil sample at the shrubland site, together with the TES measurements. Table 1 summarizes the CE-312 band 1 (8–13 μm) emissivity values obtained for the different covers at the rice crop site and for the different elements at the shrubland site. These emissivity values were used in Equation (1) to obtain the LST from the data measured by the SI-121 radiometer used in the system.
Figure 6. Spectral variation of the emissivities measured at nadir by the TES method and the multiband CE-312 radiometers at the rice crop site. Water emissivities were obtained from [22].
Remotesensing 07 15269 g006
Figure 7. Example of the spectra measured by a D&P FT-IR spectrometer for the shrubland site soil, together with the multiband data measured by the TES method.
Remotesensing 07 15269 g007
Table 1. Emissivity values (8–13 μm) measured at nadir for the different covers/elements at both experimental sites.
SiteCover/Element ε 8 13  μ m
Shrubland siterosemary0.982 ± 0.005
gorse0.984 ± 0.006
soil (Chromic luvisol, clay-loam)0.959 ± 0.006
stone (Lithic Leptosol)0.960 ± 0.005
Rice crop sitefull vegetation cover0.985 ± 0.005
dry bare soil1,*0.962 ± 0.004
wet bare soil (saturated)2,*0.971 ± 0.003
flooded soil (water)0.986 ± 0.003
1 12 February 2014; 2 3 May 2014; * Textural and mineralogical features and organic matter content for the bare soil at the rice crop site were described in [21] (sample D).
The effective emissivities for the heterogeneous cover at the shrubland site were determined by the Vegetation Cover Method (VCM) described in [25] with field-measured emissivities for the different elements (i.e., rosemary, gorse, soil, and stone emissivities; Table 1) [16]. This method estimates the surface effective emissivity as:
ε i = ε i , v F V C + ε i , b g ( 1 F V C ) + d ε i
where the first two terms on the right-hand side correspond to the direct emission of vegetation and bareground components, respectively, and the last one to the cavity term. The cavity term involves first-order reflections in the cavities defined by the rough surface. As mentioned in Section 2.4, the FVC was 0.49 for the shrubland site. It was estimated from the MSG-SEVIRI FVC products and orthophotographs from the Spanish National Geographic Institute (http://www.ign.es) [16]. The calculation of the cavity term i, as defined by Equations (4)–(7) of [25], required the average vegetation dimension values (height, width, and separation between vegetation patches). Average values of 1.0 ± 0.4 m, 1.4 ± 0.4 m, and 0.6 ± 0.3 m were measured for the height, width and separation between vegetation patches at the site, respectively. The ranges of variability of the measured dimensions were considered in the estimation of the effective emissivities with Equation (5). Table 2 shows the effective emissivities determined by the VCM for the shrubland site for the zenith observation angles used by the system for land observations. The emissivity uncertainties in Table 2 were obtained as the quadratic sum of uncertainty due to the variability in the measured dimensions and the uncertainty due to the propagation of uncertainties in the component emissivities through Equation (5).
Table 2. Effective emissivities (8–13 μm) for the shrubland site at the system zenith angles.
Zenith Angle (°) ε 8 13  μ m
00.985 ± 0.005
180.986 ± 0.005
360.987 ± 0.005
540.989 ± 0.006
720.990 ± 0.006
The emissivity angular dependences for the bare soil and water (flooded soil) covers at the rice crop site were measured and characterized in [21,22,26,27], respectively (see Section 3.2 for further details). Angular measurements were taken for the full vegetation cover with a mobile goniometric system. The results did not show significant angular variations for that cover at the rice crop site in accordance with the system angular data, and with much smaller angular differences than the radiometer uncertainty of ±0.2 K. The angular variations for the unstressed, fully-covering rice crop were expected to be small [6]. According to the experimental results in [28] for alfalfa, the differences between the nadir and off-nadir (±60°) brightness temperatures were within ±0.5 K. Such a small variation was attributed to high canopy density (as in our case, soil was not visible) and to absence of water stress, which were likely to reduce angular effects.
Finally, Equation (1) was used to obtain ground-truth LSTs to evaluate satellite products. The system radiance measurements taken at azimuth angles of 18°, 54°, 198°, and 234° and at a zenith angle of 144° (i.e., 36° from nadir) were used. These angles were selected because radiometer footprints were found entirely over the rice crop or shrubland. Agricultural ridges or station structure elements were not observed, respectively. They were relatively low zenith angles that help avoid significant angular effects. The zenith angle of 18° was also considered for the flooded and bare soil conditions at the rice crop site, i.e., when the agricultural ridge effect was negligible for this observation angle. The average values of the LSTs retrieved with Equation (1) for the above-mentioned angles were used as reference ground LST data to evaluate satellite products. Ground LST uncertainties were obtained as the square root of the quadratic sum of the ground LST standard deviation for the different observations considered within a scan and the uncertainty calculated with the propagation, with Equation (1), of the uncertainties in L i a t m , h e m , εi, and L i ( θ , ϕ ) . The latter was obtained from the uncertainty of ±0.2 K, estimated for the Apogee SI-121 radiometers. The LST standard deviations for the abovementioned angles (four azimuths) within a scan were lower than ±0.7 K and ±0.3 K at the shrubland site for the MODIS overpass times at day and night, respectively. LST standard deviations of ±0.16 K and ±0.09 K were obtained at the rice crop site with flooded soil covers (December–January) for the day and night overpass times, respectively. LST standard deviations of ±0.5 K and ±0.11 K were obtained at the rice crop site with bare soil covers (March–May) for the day and night overpass times, respectively. The minimum LST standard deviations are shown for flooded soil, while bare soils depict the maximum deviations at the rice crop site. These standard deviations were taken into account in the ground LST uncertainty determination and quantify the surface inhomogeneity-related azimuthal LST variability. Considering the SI-121 half angle FOV and the system setup height at the permanent station at the shrubland site, a footprint area of 54 m2 is observed for the zenith angle of 36° from nadir. Thus, although the shrubland site is a heterogeneous cover, i.e., with different surface elements (i.e., shrubs and soil), it is quite thermally homogeneous at the radiometer footprint level.
To test the consistency of the LST data collected by the system’s SI-121 radiometer, four CE-312 radiometers were used to take concurrent measurements along transects [6] at the rice crop site for the flooded soil (water surface; 13 June 2014) and full vegetation (22 July 2014) covers. Previous studies have proved the homogeneity of the area [6,7], with standard deviations computed using ASTER data for an area of ~1 km2 from ±0.3 K to ±0.5 K and standard deviations for the CE-312 radiometer measurements along transects lower than ±0.6 K in summer. Despite the reported homogeneity, possible horizontal inhomogeneity effects were also present in this comparison. The average LST values were computed from the data measured with the CE-312 radiometers along the transects, and standard deviation values of ±0.5 K and ±0.4 K were obtained for the full vegetation and flooded soil cases, respectively. The concurrent LSTs taken by the system’s SI-121 radiometer at the abovementioned zenith and azimuth angles were also averaged and standard deviation values of ±0.3 K and ±0.15 K were obtained for the full vegetation and flooded soil cases, respectively. Differences between the averaged CE-312 LSTs measured along the transects and the LSTs provided by the system SI-121 data were +0.13 K and −0.16 K for the full vegetation and flooded soil covers, respectively. This shows good agreement.

3.2. Emissivity Angular Dependence: Relative-to-Nadir Emissivities

Emissivity can be obtained from Equation (1) as follows:
ε i ( θ , ϕ ) = L i ( θ , ϕ ) L i a t m , h e m B i ( L S T ) L i a t m , h e m
In the case of thermally-homogeneous and isotropic surface covers, in which the LST does not depend on observation angles, the assessment of relative-to-nadir values, ε r i ( θ , ϕ ) , avoids the knowledge of the LST itself by taking two simultaneous radiance measurements, one at nadir, i.e., (0,ϕ), and another at a defined angular configuration (θ,ϕ), using the following expression [29]:
ε r i ( θ , ϕ ) = ε i ( θ , ϕ ) ε r i ( 0 , ϕ ) = L i ( θ , ϕ ) L i a t m , h e m L i ( 0 , ϕ ) L i a t m , h e m
This expression was used in [21] to analyze the emissivity angular variation of inorganic soils and their dependence on soil moisture. An equivalent expression was proposed in [30] to study the emissivity angular dependences for some soils, grass, and water samples.
As the autonomous system measures radiances at an ensemble of azimuth and zenith observation angles, relative-to-nadir emissivities can be determined with Equation (7) to analyze the anisotropy of the emissivities for the homogeneous surfaces observed by the system.

3.3. Satellite Data: EOS-MODIS and ENVISAT-AATSR

The EOS Moderate Resolution Imaging Spectroradiometer (MODIS) LST products (collection 5) were evaluated by taking the ground-truth LSTs as a reference. Ground-truth LSTs were retrieved from the data acquired by the permanent stations with the autonomous system at both sites, as explained in Section 3.1. Specifically, the LST products are the land surface temperature and emissivity (LST/E) 5-Minute L2 Swath 1 km (MOD11_L2 and MYD11_L2 for MODIS onboard EOS-Terra and EOS-Aqua, respectively) and the MODIS LST/E Daily L3 Global 1 km Grid (MOD11A1 and MYD11A1 for Terra and Aqua, respectively). The EOS-MODIS overpass times over the experimental sites are 10:30–12:00 UTC and 12:30–14:00 UTC in the daytime and 21:30–23:00 UTC and 01:30–03:00 UTC at nighttime for Terra and Aqua, respectively. These products are generated with the generalized split-window algorithm [31], applied to the MODIS brightness temperatures in channels 31 (10.78–11.28 µm) and 32 (11.77–12.27 µm). The algorithm coefficients were obtained by regressions of the MODIS simulated data for wide ranges of surface and atmospheric conditions. They depend on zenith observation angle θ, atmospheric total column water vapor W0, and the lower boundary temperature in the atmosphere T0. The required emissivities were obtained from classification-based emissivities [32], which were modeled for 16 different land cover types. For each MODIS pixel, the land cover class is assigned according to the classification given by the MODIS land-cover product (lpdaac.usgs.gov), which in fact showed some errors in Eastern Spain [16]. The M*D11_L2 product is swath-based. The L3 M*D11A1 product is tile-based and gridded in the Sinusoidal projection, and is produced daily at a 1-kilometer spatial resolution [33]. Both products are available on the reverb.echo.nasa.gov website. The M*D11A1 product can be downloaded and reprojected from the sinusoidal projection to a different coordinate system/cartographic projection with the USGS MODIS Reprojection Tool Web (MRTWeb, mrtweb.cr.usgs.gov).
Several images collected by the dual-view Advanced Along-Track Scanning Radiometer (AATSR) on board the decommissioned ESA’s ENVISAT satellite were used to obtain the relative-to-nadir emissivities for the different seasonal and homogeneous land covers in the rice crop area. AATSR used a conical scanning mechanism to observe the same target with two different viewing angles: first at an angle of around 55° (the forward view); 120 s later at an angle close to nadir (the nadir view; from 0° to 23.5°). The nominal spatial resolution of the AATSR images is 1 km × 1 km for the nadir view and 1.5 km × 2 km for the forward view. The AATSR ATS_TOA_1PUBCM images used in this paper were obtained from the third reprocessing dataset provided by the ESA Earth Observation Missions Helpdesk (earth.esa.int). This product includes top-of-atmosphere (TOA) brightness temperatures for the AATSR spectral bands from mid-wave to thermal infrared (at 3.7, 10.85, and 12.0 µm) and reflectances for the four bands from visible to short-wave infrared, for both the nadir and forward views. The TOA brightness temperatures in AATSR bands at 11 and 12 µm and the nadir and forward views were used to obtain TOA radiances, L i , T O A ( θ , ϕ ) , with the Planck function weighted by the spectral response of the bands. In order to estimate the relative-to-nadir emissivities from the AATSR data, surface radiances L i ( θ , ϕ ) in Equation (7) can be derived from L i , T O A ( θ , ϕ ) using atmospheric transmittances, τ i   a t m ( θ , ϕ ) , and upwelling radiances, L i a t m ( θ , ϕ ) as follows:
L i ( θ , ϕ ) = L i , T O A ( θ , ϕ ) L i a t m ( θ , ϕ ) τ i   a t m ( θ , ϕ )
The atmospheric parameters in Equations (7) and (8) were estimated with the MODTRAN 5 radiative transfer model [34] and the re-analysis atmospheric profiles from the National Centers for Environmental Prediction (NCEP) [35]. NCEP atmospheric profiles are produced every 6 h and consist in global fields of eastward and northward wind components, geopotential height, temperature and relative humidity. These parameters are provided at 26 pressure levels of a synoptic standard model. Levels are constant and independent on surface elevation, the first level being 1000 hPa. The rice crop site is close to the sea, so the corresponding NCEP profile may contain land and sea influences. However in [17], we concluded that NCEP profiles provided accurate results in the single-band atmospheric correction of TOA radiances (Equation (8)) compared with the local radiosonde measurements collected at the rice crop site. The site is at sea level and there is a height gap of 80–200 m from the ground to the first NCEP profile level. Thus, to perform atmospheric parameter simulations with the MODTRAN 5 model, the data obtained from the NCEP profile levels were completed with an additional level at the surface height. The data measured at a meteorological station placed at the site were used for this level to improve the simulations for the lowest atmospheric layer. Given the NCEP coarse spatial resolution of 1° × 1°, an interpolation procedure to the spatial resolution of the TIR satellite data was required [36]. The profiles for the four grid corners that surrounded the site, and for the two times before and after the TIR observation was made, were used. They were spatially interpolated to the site for each time. Then the resulting profiles were interpolated to the observation time. Spatial interpolation was performed following an inverse distance weighted interpolation method, as explained in [17]. Finally, the atmospheric parameters in Equations (7) and (8) were simulated for the AATSR zenith angles in the nadir and forwards views using MODTRAN 5 and the NCEP profiles interpolated and completed with surface level data.

4. Results and Discussion

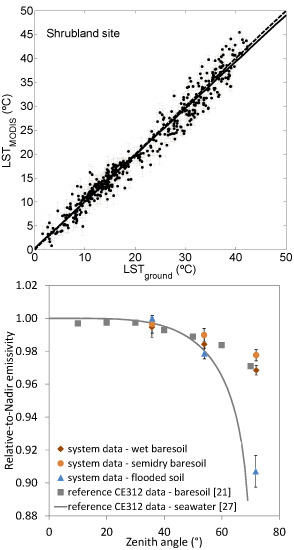
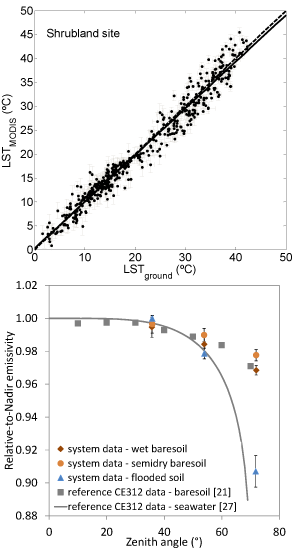
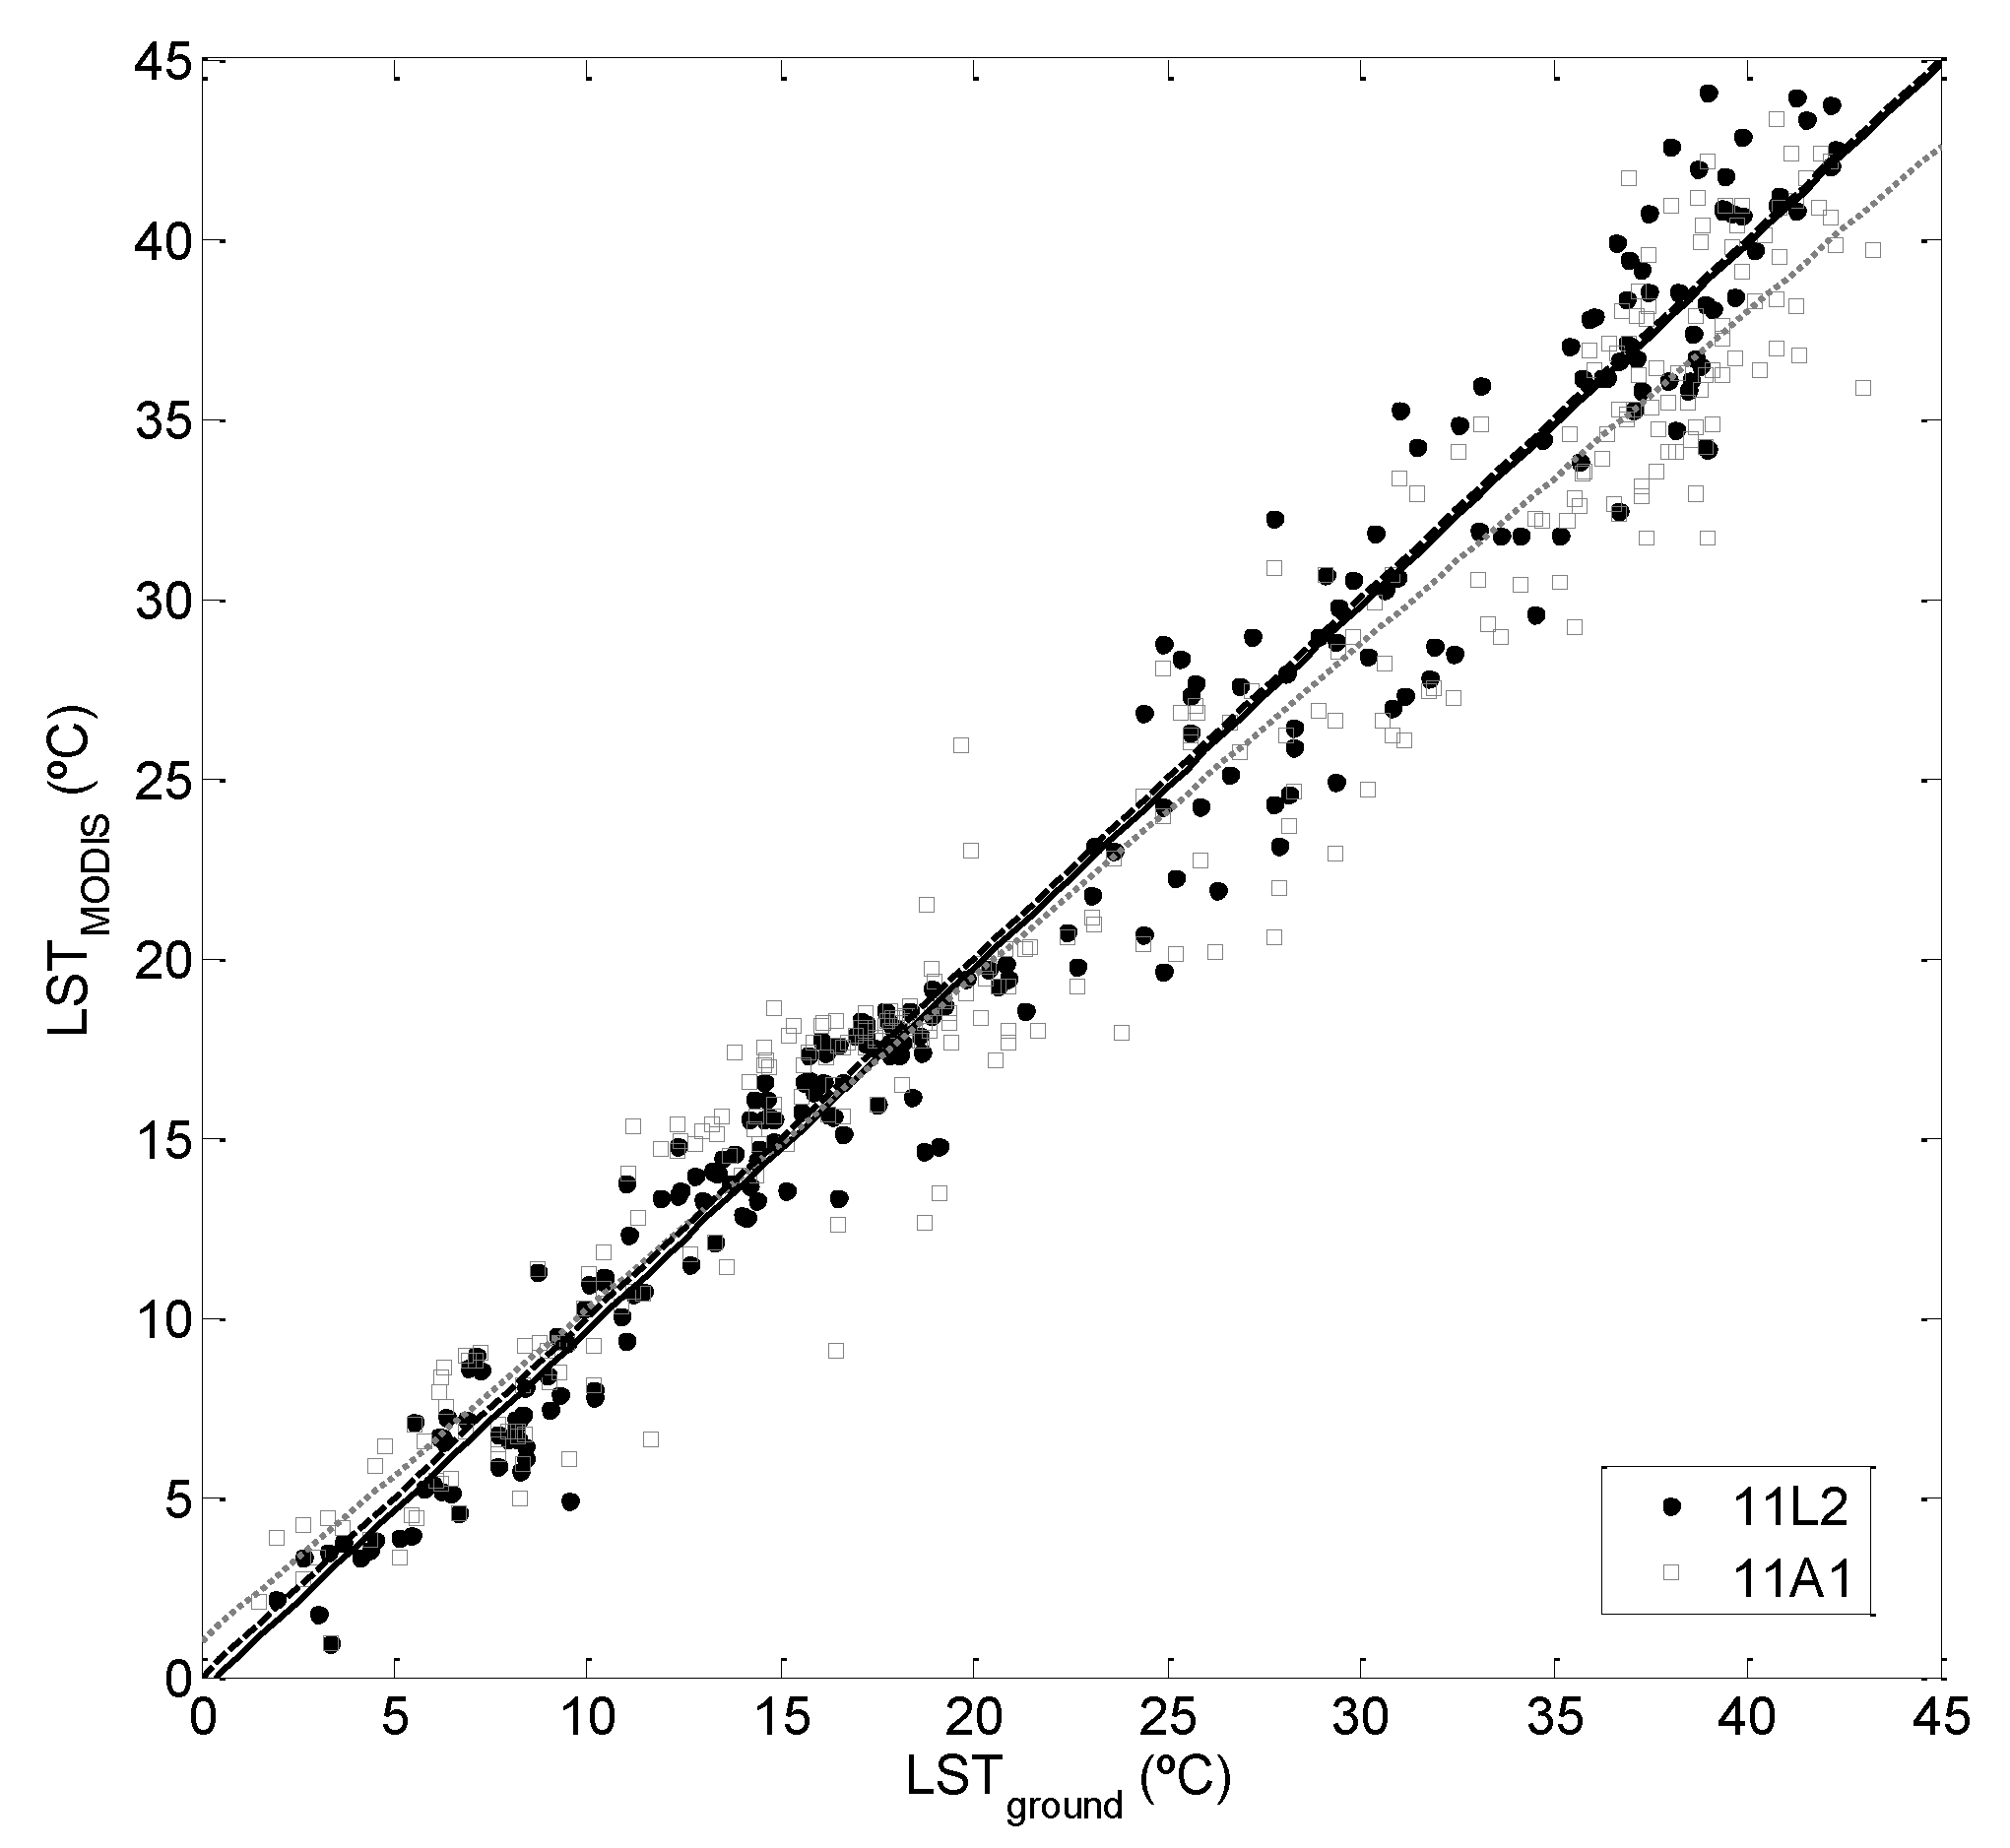
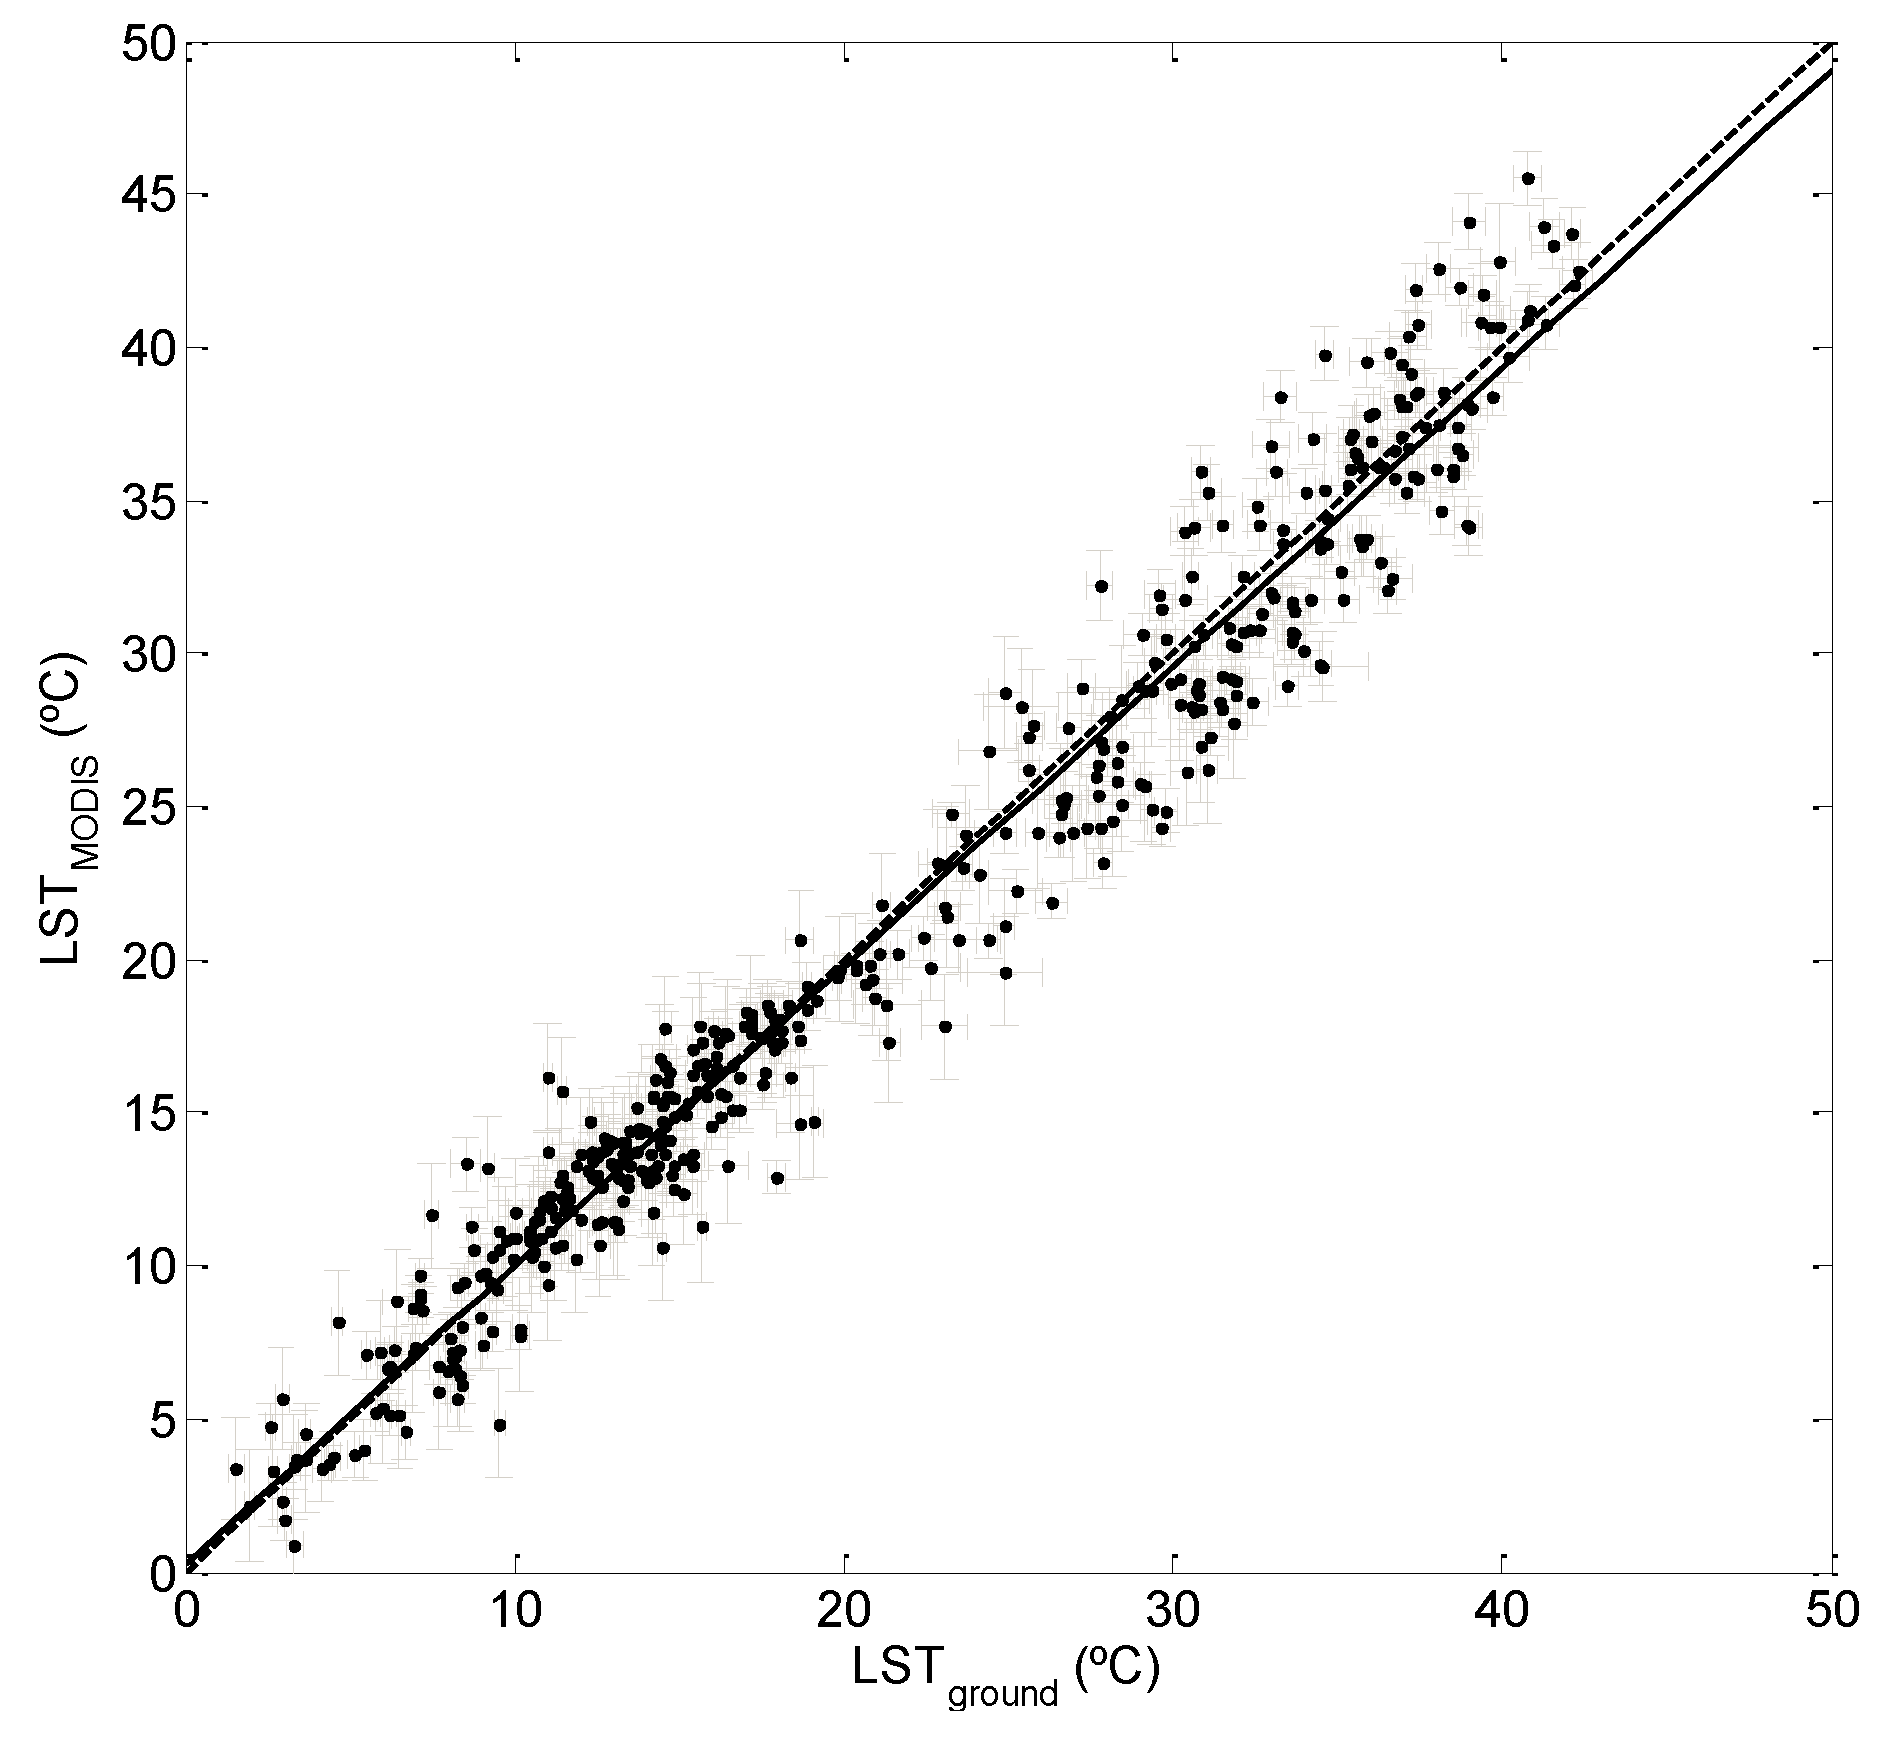
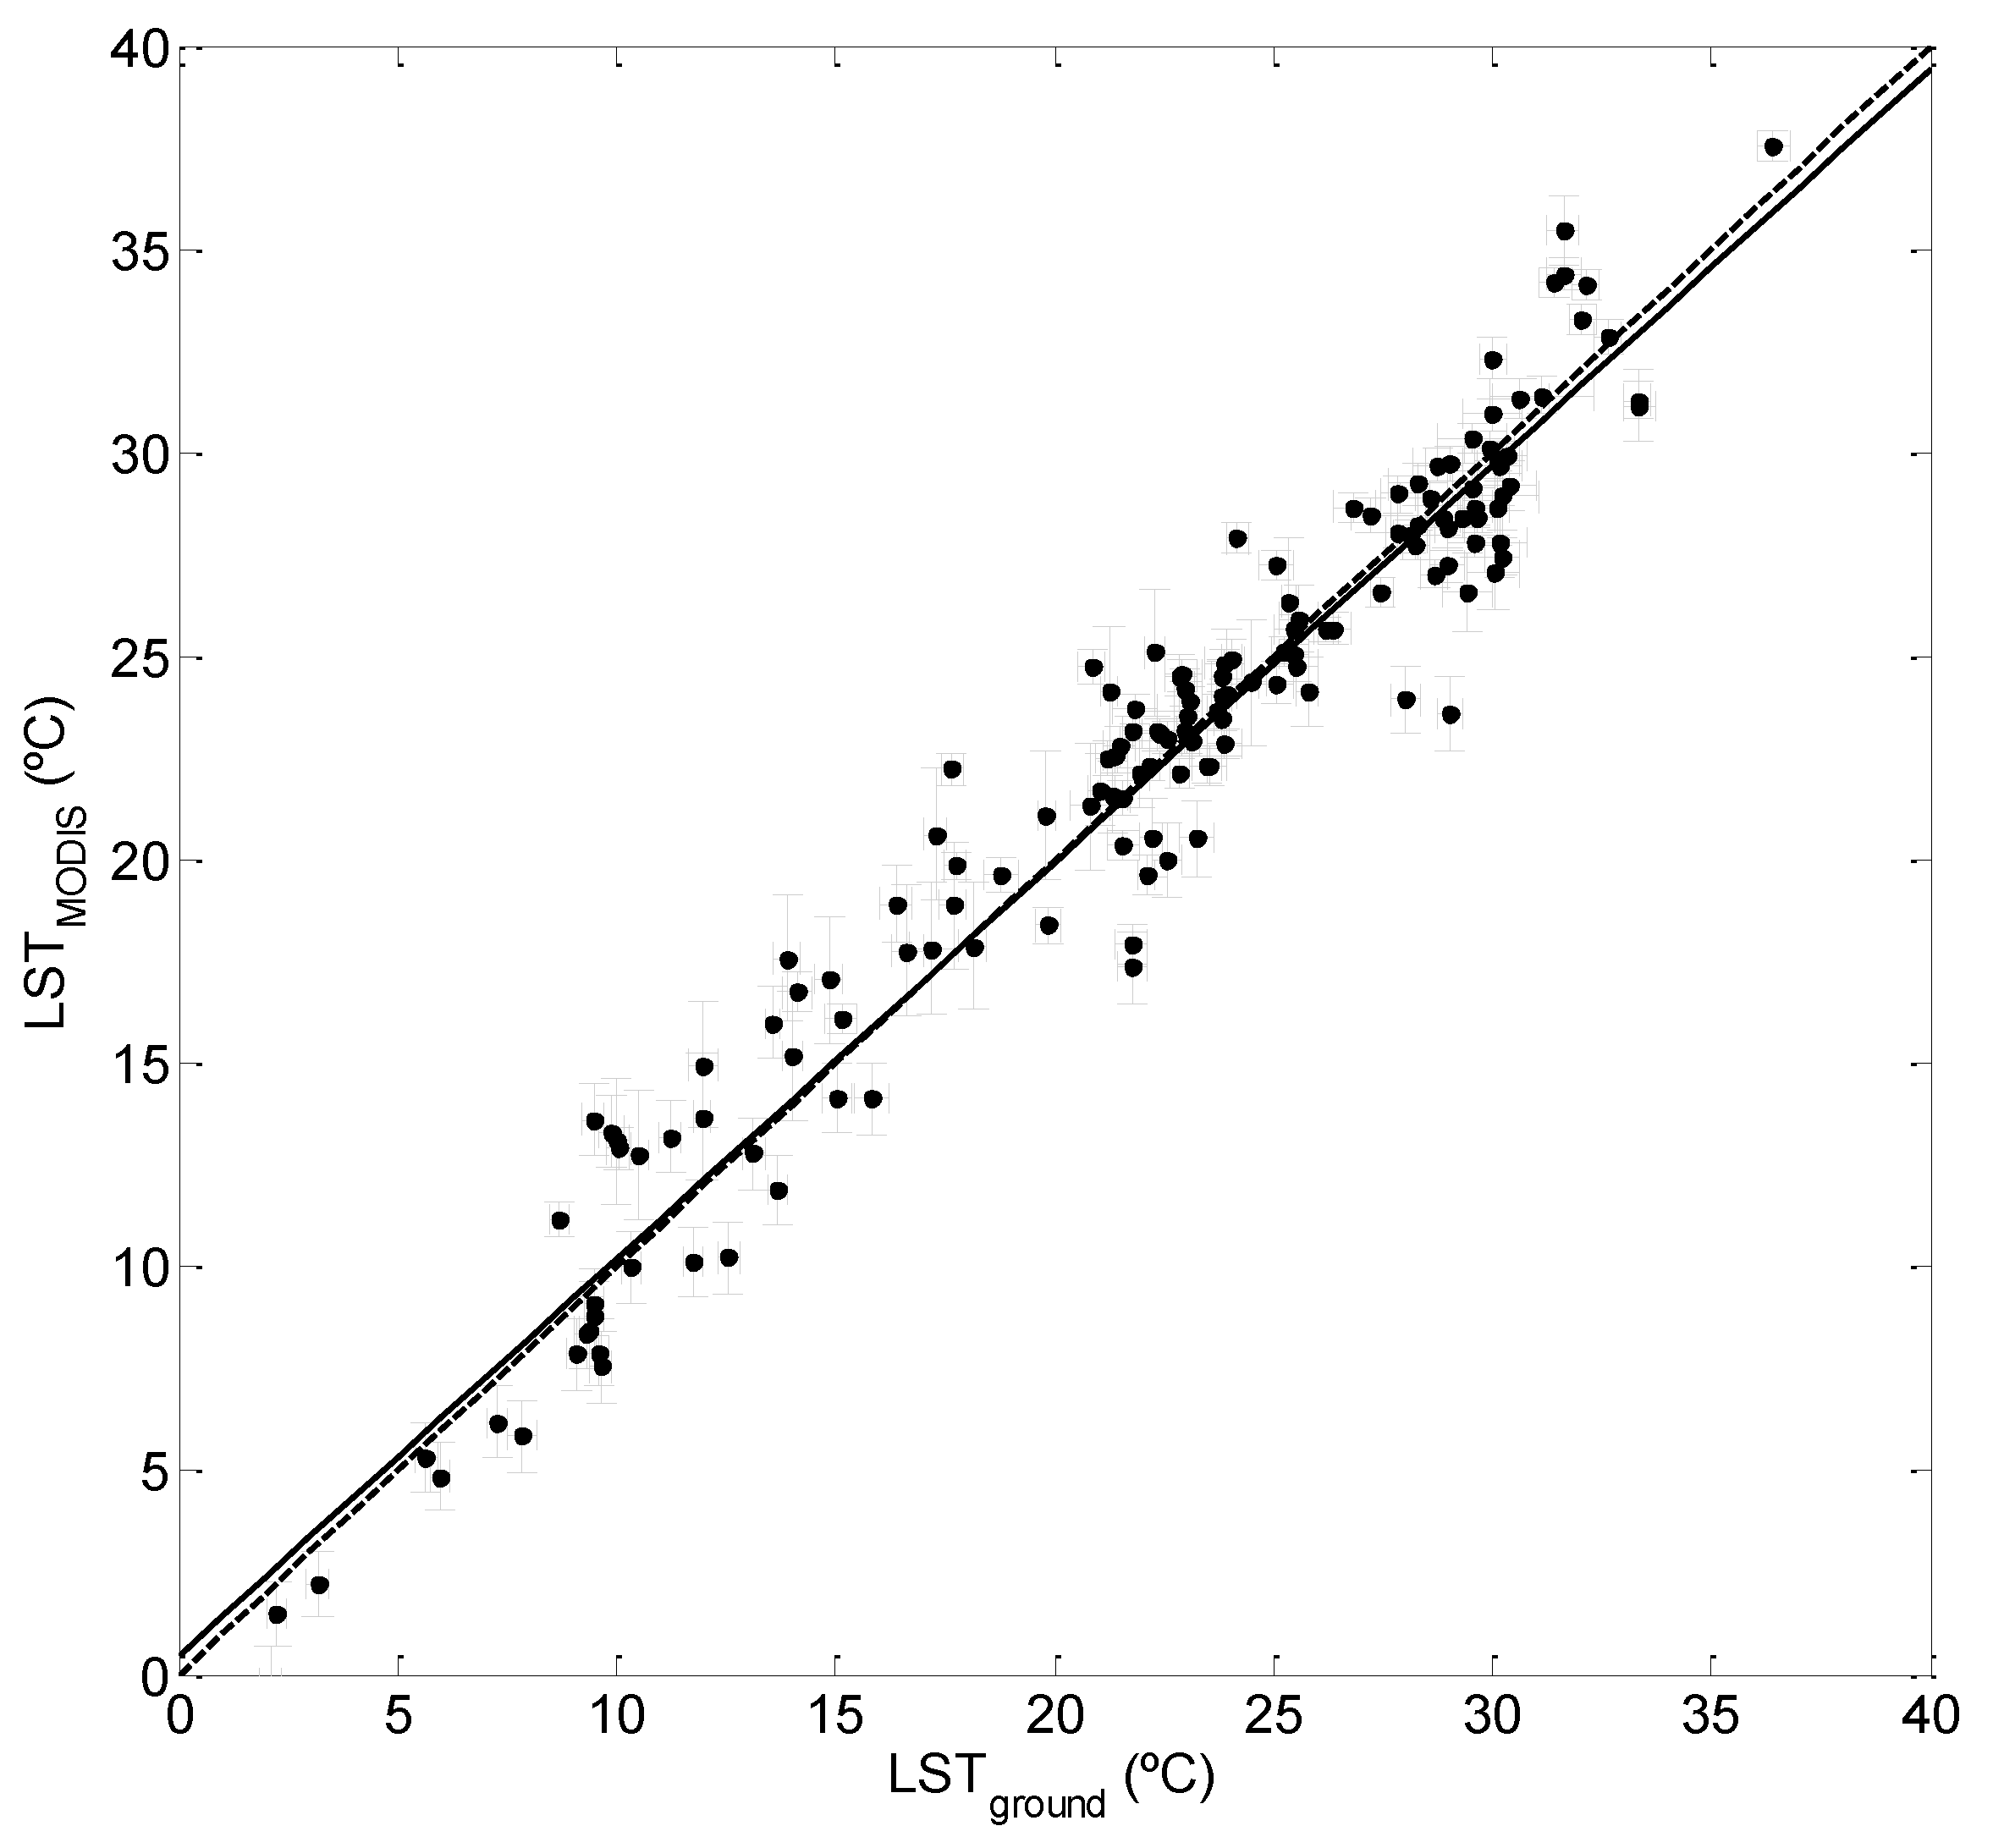
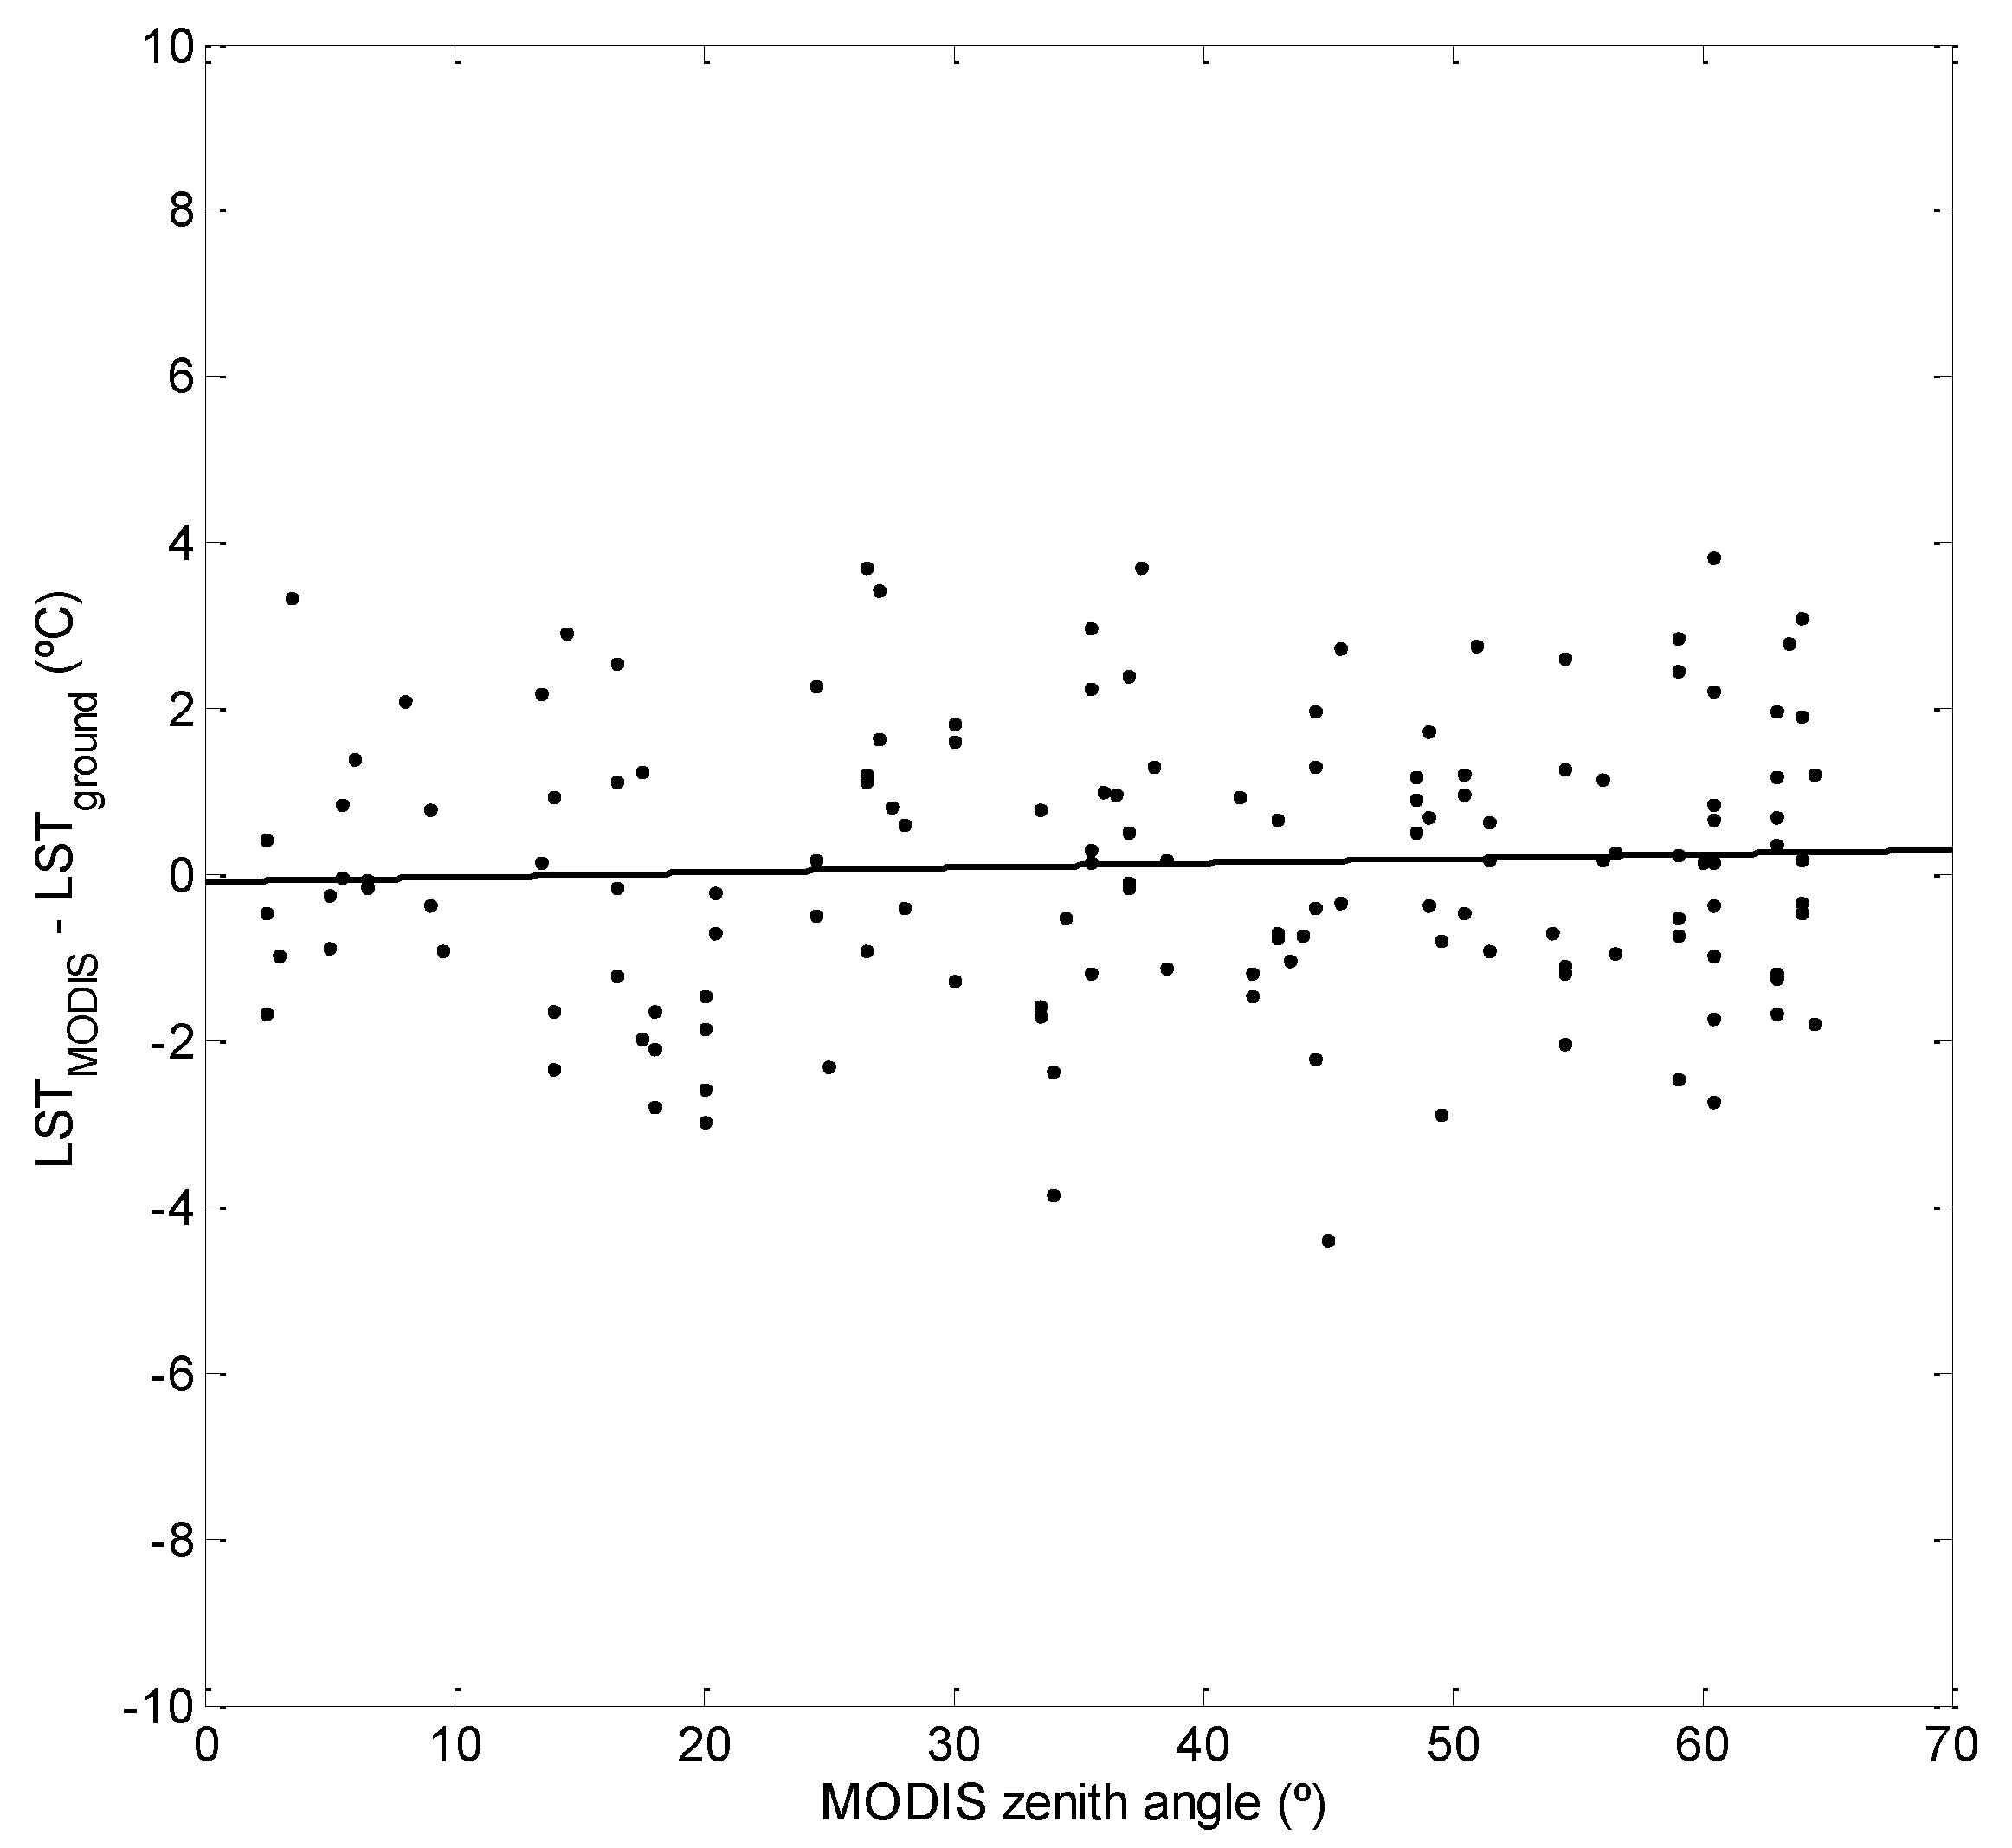
4.1. Evaluation of MODIS-Retrieved LST Products with the System Ground-Truth LSTs

The ground-truth LSTs from the permanent station at the shrubland site were used to compare the M*D11_L2 and M*D 11A1 products. The data collected from April to August 2013 were used to cover a wide range of ground LSTs (0 °C –45 °C), with around 250 cloud-free concurrent ground and MODIS-retrieved LST data. Cloud-free data were selected by filtering cloudy data with the quality control bits of the MODIS products and the concurrent sky measurements collected by the angular system. The temperatures measured by the system within five minutes of the Terra or Aqua overpasses were used to obtain the concurrent ground-truth LSTs. Not only the single pixel that covered the permanent station location was considered for the comparison, but also the mean and standard deviation values of the 3 × 3 pixels of the MODIS products centered at this location. Table 3 shows the statistics of the differences between the MODIS-retrieved and the ground LST values. It includes: mean, standard deviation (SD), median, robust standard deviation (RSD = median (|difj-median(difj)|) × 1.4826; difj is each of the LSTproduct–LSTground differences [16]), and the square roots of the quadratic sums of the mean and SD (RMSE) and median and RSD (R-RMSE), respectively. R-RMSE is an estimation of the product total LST uncertainty. Median and RSD, which represent systematic and random uncertainties respectively, minimized the influence of any possible outliers and can be considered statistically more consistent validation parameters than the mean and SD [37]. Table 3 also includes skewness and kurtosis values. They quantitatively describe the distribution functions of the LST differences, which were mostly Gaussian, and explain discrepancies between the mean and median and SD and RSD. Figure 8 shows the LSTs from both MODIS products against the ground LSTs for 3 × 3 pixels. Similar results were obtained for one pixel, as shown in Table 3. Although both products (i.e., M*D11_L2 and M*D11A1) were generated with the same algorithm, discrepancies were observed between the results obtained for them. Since the M*D11A1 product is tile-based and gridded (see Section 3.3), one reason for the discrepancies could be some kind of data averaging of the consecutive orbits (with acquisition time differences of around 2–4 hours) in the overlapping regions. Table 3 shows a median of −0.12 K and an RSD of ±1.8 K for the M*D11_L2 product in the case of one pixel, which yield an uncertainty of ±1.8 K (±1.9 K for the 3 × 3 pixels case). However, higher median and RSD values were obtained for the M*D11A1 product, with uncertainties of ±2.4 K. Therefore, the M*D11_L2 product was chosen to thoroughly evaluate MODIS generalized split-window algorithm performance.
Table 3. Statistics of the differences between the MODIS-retrieved products and the ground LST data for the shrubland site.
LSTproduct – LSTground (K)M*D11_L2 1 PixelM*D11A1 1 PixelM*D11_L2 3 × 3M*D11A1 3 × 3
mean−0.3−0.8−0.3−0.5
SD2.02.52.02.4
RMSE2.02.72.02.5
median−0.12−0.5−0.11−0.3
RSD1.82.41.92.4
R−RMSE1.82.41.92.4
Skewness−0.14−0.40−0.30−0.42
Kurtosis0.16−0.110.01−0.27
Figure 8. Comparison between the MODIS-retrieved LST provided by products M*D11_L2 and M*D11A1 with the ground-truth LST measurements taken at the shrubland site (~250 cloud-free matchups), together with linear regressions.
Remotesensing 07 15269 g008
The M*D11_L2 evaluation was extended to nine months of data at the shrubland site (from April to December 2013; with ~500 cloud-free events). Table 4 shows the statistics of the differences found between the M*D11_L2 and the ground LSTs. Figure 9 shows the M*D11_L2 data compared to the ground LSTs. The ground LST error bars represent the measurement uncertainties described in Section 3.1. The MODIS LST errors were obtained from the corresponding M*D11_L2 product layer. The errors assigned for the 3 × 3 pixel average LST values were calculated as the square root of the quadratic sum of the LST standard deviation in the nine pixels and the corresponding product errors.
Table 4. Statistics of the differences between the MODIS M*D11_L2 product and the ground LST data at the shrubland site.
LSTproduct –LSTground (K)M*D11_L2 1 PixelM*D11_L2 3 × 3
mean−0.2−0.4
SD2.12.2
RMSE2.12.2
median−0.10−0.18
RSD1.92.0
R−RMSE1.92.0
Skewness−0.04−0.20
Kurtosis0.13−0.05
Figure 9. Comparison between the MODIS-retrieved LST provided by the M*D11_L2 product with the ground-truth LST measurements taken at the shrubland site (~500 cloud-free matchups), together with linear data regression (solid line).
Remotesensing 07 15269 g009
A very slight underestimation was also observed in this case and the RSD was around ±2 K. Figure 10 shows differences between the M*D11_L2 product and the ground data compared to the MODIS acquisition zenith angle for the site. In the data set, the percentages of the MODIS zenith angles lower and larger than 40° were 55% and 45%, respectively. The LST differences were seen to depend on the MODIS zenith angle, which could mean an increase in the MODIS-retrieved LST uncertainties with a MODIS zenith angle. A median of –1.0 K and an RSD of ±2.0 K, with an R-RMSE of ±2.3 K, were obtained for those angles larger than 40° and one pixel (median of –1.0 K and RSD of ±2.4 K, with R-RMSE of ±2.5 K, for the 3 × 3 pixels). The increase in the negative differences with the MODIS angle is shown in Figure 10. This suggests the existence of a drop in the LST for the off-nadir observations caused by the angular dependences of the LSTs in heterogeneous areas due to the changing proportions of the different elements in the surface view. It could also result from insufficient atmospheric absorption correction by the MODIS algorithm at these angles [6]. Note that the ground LSTs were obtained from the system data measured at zenith angles of 36° (or 18° and 36°) from nadir, so they could overestimate the LSTs for the MODIS data at larger observation angles.
Figure 10. Differences between the MODIS M*D11_L2 and the ground LSTs with the MODIS zenith angle at the shrubland site (~500 cloud-free matchups), together with quadratic regression (solid line).
Remotesensing 07 15269 g010
The M*D11_L2 product was also evaluated at the rice crop site using the data from the periods of homogeneous surface covers: full vegetation cover (July–August), flooded soils, i.e., water (December–January), and bare soil (March–April, mainly). Figure 11 shows the M*D11_L2 data compared to the ground LSTs at the rice crop site. Table 5 shows the statistics of the differences found between the M*D11_L2 and ground LSTs for all the covers together (all seasons, ~150 cloud-free events). As mentioned above, the rice crop area has been previously used in validation experiments that were run in summers [6,7,16,17], i.e., with full vegetation cover. A median of 0.0 ± 1.3 K was obtained when we analyzed the data for these cover conditions in summer (~50 cloud-free events). A mean value of −0.6 K and an SD of ±0.9 K were obtained for the MOD11_L2 minus the ground LST differences in [6], where the ground LST measurements were taken along transects concurrently with 11 MODIS overpasses in summer. A mean value of +0.4 K and an SD of ±0.6 K were obtained in [8] with ground LSTs measured, concurrently with four nighttime MOD11_L2 images, by IR radiometers deployed at similar vegetation sites during a field campaign. Similar uncertainties were obtained for soybean areas in accordance with [9]. However, negative biases from −0.6 K to −4 K and SDs from ±0.8 K to ±3 K, with RMSEs from ±1 K to ±4 K, were obtained in [38] at four barren surface sites (i.e., soil or sand with perennial subshrubs). These sites were equipped with Kipp and Zonen CNR1 net radiometers or Apogee SI-111 TIR radiometers fixed at nadir. In all ~900 cloud-free matchups were analyzed for the different barren sites. The RMSEs shown in [38] for the four barren surface sites were higher than the RMSE and R-RMSE values obtained for the shrubland site (Table 4) and the rice crop site (Table 5) using the LSTs retrieved from the system data as a reference.
Figure 11. Comparison between the MODIS-retrieved LST provided by the M*D11_L2 product and the ground-truth LST measurements at the rice crop site (~150 cloud-free matchups), together with linear data regression (solid line).
Remotesensing 07 15269 g011
Table 5. Statistics of the differences between the MODIS M*D11_L2 product and the ground LST data at the rice crop site.
LSTproduct –LSTground (K)M*D11_L2 1 PixelM*D11_L2 3 × 3
mean−0.08 −0.01
SD1.81.8
RMSE1.81.8
median−0.16 −0.04
RSD1.61.8
R-RMSE1.61.8
Skewness0.06 0.10
Kurtosis0.11 0.15
Figure 12 shows the differences between the M*D11_L2 product and the ground data compared to the MODIS zenith angle for the rice crop site. The percentages of MODIS zenith angles below and above 40° in the data set were 51% and 49%, respectively. No dependence of the LST differences on MODIS zenith angle was observed in the rice crop area, where several homogeneous surface covers were analyzed with time. The different angular dependences shown in Figure 10 and Figure 12 could be due to a drop in the MODIS LSTs for the off-nadir observations caused by a change in the proportions of the different elements (i.e., vegetation and soil) in the surface view compared with the nadir observation for the shrubland site, which does not occur for the homogeneous surfaces.
Figure 12. Differences between the MODIS M*D11_L2 and the ground LSTs with the MODIS zenith angle at the rice crop site (~150 cloud-free matchups), together with regression (solid line).
Remotesensing 07 15269 g012

4.2. Emissivity Angular Dependence

In Section 2.3, we compared the dependence of the brightness temperatures measured by radiometers SI-121 and CE-312 on the zenith observation angle for water surfaces. Figure 13 shows the same comparison in terms of the relative-to-nadir emissivities assessed following Equation (7). The water emissivity decrease with the angle shown in [22,26,27] is quite well reproduced by both the SI-121 and CE-312 data.
Figure 13. The relative-to-nadir emissivities obtained from the SI-121 (18° half angle FOV, 8–14 µm) and CE-312 (5° half angle FOV, 8–13 µm) measurements over a water surface.
Remotesensing 07 15269 g013
Figure 14. Angular dependence of the relative-to-nadir emissivities obtained with Equation (7) from the system data for two different land covers at the rice crop site: (a) flooded soil (water) and (b) bare soil (wet and semidry). Comparison made with the CE-312 angular measurements over seawater and the same bare soil in previous papers.
Remotesensing 07 15269 g014
The angular scans performed by the autonomous system allowed us to analyze the emissivity anisotropy of the observed homogeneous surfaces. Both the bare soil and water covers at the rice crop site are expected to show emissivity angular dependences [21,22,26,27]. Following Equation (7), relative-to-nadir emissivities were assessed from the data acquired by the system for flooded soils (water cover; December–January and June) and for bare soils: semidry bare soil (March–April) and wet bare soil (February). Figure 14 shows the relative-to-nadir emissivity values compared to the zenith observation angle for both covers, together with the values obtained from the CE-312 band one measurements in previous papers. Figure 14a shows the mean values, and standard deviation (error bars), obtained from the data acquired by the system on cloud-free days with the operational acquisition configuration described in Section 2.2. Figure 14b provides the values obtained from the system data for the wet and semidry bare soil conditions and from the laboratory measurements of a soil sample collected at the rice crop site. Laboratory measurements were taken with a CE-312 radiometer for different soil moisture (SM) contents (see soil D, silty clay loam soil, in [21]). The angular data measured by the system reproduced the emissivity anisotropies for both homogeneous covers, i.e., water and bare soil, and even the soil moisture effect in the latter.
The agreement observed between the relative-to-nadir emissivities obtained with the system and from the CE 312 band one data provided in the above-cited studies [21,22,26,27] reveals that they are suitable reference data for testing the emissivity angular variations obtained from dual-view satellite sensors. These studies also include data for the narrower CE 312 spectral bands within 8–13 µm, which can be used as reference data for the satellite sensor bands.
Four cloud-free ENVISAT-AATSR images acquired over the rice crop area were used to assess the relative-to-nadir emissivities for different land covers: 1 and 26 April, 2011 (bare soil); 25 July, 2011 (full vegetation cover in the rice crops); and 19 December, 2011 (flooded soil, i.e., water). We selected the rice crop area since different homogeneous surfaces can be studied with time, where angular dependences are due to surface emissivity anisotropies and not to temperature differences between surface elements, as in heterogeneous areas. Table 6 shows the atmospheric parameters for these dates. They were required to obtain the relative-to-nadir emissivities with Equations (7) and (8). Table 7 shows the relative-to-nadir emissivities obtained from the AATSR bands at 11 µm and 12 µm for the rice crop area on these dates. The regions of interest that covered the experimental site (of about 25–36 pixels) were used to compute the statistics. We also used a region of interest in a nearby lagoon as another example of water surface. Table 7 shows the median and SDs of the retrieved relative-to-nadir emissivity values. As expected (see Section 3.1), very low emissivity angular dependence is observed for the full vegetation cover. For water, the reference values of the relative-to-nadir emissivities at 55° are 0.983 and 0.975 for the AATSR bands at 11 µm and 12 µm, respectively, according to [27]. For the bare soil at the rice crop site, the reference values of the relative-to-nadir emissivities at 55° in the 10.3–11.7 µm spectral region are 0.982 and 0.994 for the SM contents of 45% and 3%, respectively [21]. The agreement observed between Table 7 and the reference values, with differences lower than 0.005, shows that the dual-view ENVISAT-AATSR data reproduce quite well the emissivity angular dependences for these homogeneous land covers. Thus, the data acquired by the designed system over homogeneous surfaces can be used to test future satellite TIR sensors with multi-angular or bi-angular capabilities, like the Sea and Land Surface Temperature Radiometer (SLSTR) on board the forthcoming Copernicus Sentinel-3A.
Table 6. Atmospheric parameters obtained with the MODTRAN 5 and NCEP profiles for the AATSR bands at 11 and 12 µm and the nadir and forward views for the selected dates.
DateAATSR Band/ViewZenith Angle (°) L i a t m (θ,ϕ)
(W/m2∙sr∙µm)
τ i   a t m ( θ , ϕ ) L i a t m , h e m
(W/m2∙sr∙µm)
19 December 201111/nadir1.60.5770.9051.002
12/nadir1.60.9050.8451.472
11/forward 54.90.9290.8471.002
12/forward54.91.3540.7661.472
1 April 201111/nadir10.21.6090.7892.555
12/nadir10.22.3020.6763.399
11/forward 54.32.4250.6792.555
12/forward54.33.2180.5453.399
24 April 201111/nadir19.61.7110.7602.644
12/nadir19.62.3970.6403.504
11/forward 52.72.4010.6612.644
12/forward52.73.1540.5223.504
25 July 201111/nadir19.62.5480.6693.823
12/nadir19.63.3610.5264.800
11/forward 52.73.4650.5453.823
12/forward52.74.2620.3914.800
Table 7. The relative-to-nadir emissivities obtained for the AATSR bands at 11 and 12 µm for the selected dates with different land covers.
DateLand CoverAATSR 11 µmAATSR 12 µm
19 December 2011water-flooded soil0.986 ± 0.0080.975 ± 0.009
19 December 2011water-near lagoon0.984 ± 0.0020.971 ± 0.002
1 April 2011bare soil 0.982 ± 0.0050.972 ± 0.007
24 April 2011bare soil 0.978 ± 0.0070.973 ± 0.008
25 July 2011full vegetation cover0.994± 0.0090.994 ± 0.009

5. Conclusions

The experimental data acquired by the autonomous system in an extensive and homogeneous area of rice crops, with different seasonal land covers, and in a typical Mediterranean calcic thermophile shrubland, were used to evaluate the uncertainty of the EOS-MODIS LST products. Although both the M*D11_L2 and M*D11A1 LST products were retrieved with the same algorithm, lower bias and uncertainty values were obtained for the M*D11_L2 product. A very slight underestimation of around −0.15 K was shown in both areas for this product, with uncertainty values lower than ±2.0 K (R-RMSE). A significant dependence of LST differences between the product and ground data on the MODIS acquisition zenith angle was observed at the shrubland site, with a median of −1.0 K and an R-RMSE of ±2.3 K for angles larger than 40°. The increase in the negative differences with the angle observed for this site could result from angular LST dependences due to the changing proportions of the different surface elements in the view for the off-nadir angles.
The data measured by the system for the homogeneous covers at the rice crop site (i.e., full vegetation cover, bare soil, and flooded soil) were used to analyze emissivity anisotropies for these covers. These data were used to assess the relative-to-nadir emissivities for the different seasonal land covers. The relative-to-nadir emissivities were first compared with reference angular emissivity values. The obtained agreement proved that they were suitable reference data for testing the emissivity angular variations retrieved from the dual-view satellite sensors on thermally-homogeneous surfaces. The ENVISAT-AASTR images were processed to assess the relative-to-nadir values in the rice crop area, which reproduced well the observed emissivity angular dependences for the different homogeneous covers in this area. Therefore, the data collected by the designed system for thermally-homogeneous surfaces, such as those at the rice crop site, can be used to test forthcoming satellite TIR sensors with multi-angular or bi-angular capabilities, like SLSTR on board Sentinel-3A.

Acknowledgments

This study has been supported by the Spanish Ministry of Economy and Competitiveness (projects CGL2010-16364, CGL2011-13579-E, CGL2011-30433-C02-02/01, CGL2013-46862-C2-1-P, and GRACCIE Consolider–Ingenio 2010; and Raquel Niclòs’ “Ramón y Cajal” RYC-2010-06213 Research Contract) and the Generalitat Valenciana (projects PROMETEO/2009/006 and PROMETEOII/2014/038). The CEAM-UMH is funded by the “Conselleria d’Infraestructures, Territori i Medi Ambient” of the Generalitat Valenciana.

Author Contributions

Raquel Niclòs is the main author of this research work and wrote the manuscript. José A. Valiente and Raquel Niclòs conceived and developed the system. Raquel Niclòs, José A. Valiente and Maria J. Barberà conducted the experiments, system setup, data processing, and satellite data analyses and evaluation. César Coll contributed to the satellite data validation.

Conflicts of Interest

The authors declare no conflict of interest.

References

  1. Anderson, M.C.; Kustas, W.P.; Norman, J.M.; Hain, C.R.; Mecikalski, J.R.; Schultz, L.; Gonzalez-Dugo, M.P.; Cammalleri, C.; d’Urso, G.; Pimstein, A.; et al. Mapping daily evapotranspiration at field to continental scales using geostationary and polar orbiting satellite imagery. Hydrol. Earth Syst. Sci. 2011, 15, 223–239. [Google Scholar] [CrossRef] [Green Version]
  2. Hulley, G.; Veraverbeke, S.; Hook, S. Thermal-based techniques for land cover change detection using a new dynamic MODIS multispectral emissivity product (MOD21). Remote Sens. Environ. 2014, 140, 755–765. [Google Scholar] [CrossRef]
  3. Li, Z.L.; Tang, B.H.; Wu, H.; Ren, H.; Yan, G.; Wan, Z.; Trigo, I.F.; Sobrino, J.A. Satellite-derived land surface temperature: Current status and perspectives. Remote Sens. Environ. 2013, 131, 14–37. [Google Scholar] [CrossRef]
  4. Kustas, W.P.; French, A.N.; Hatfield, J.L.; Jackson, T.J.; Moran, M.S.; Rango, A.; Schmugge, T.J. Remote sensing research in hydrometeorology. Photogramm. Eng. Remote Sens. 2003, 69, 631–646. [Google Scholar] [CrossRef]
  5. Sánchez, J.M.; Caselles, V.; Niclòs, R.; Coll, C.; Kustas, W.P. Estimating energy balance fluxes above a boreal forest from radiometric temperature observations. Agr. Forest Meteorol. 2009, 149, 1037–1049. [Google Scholar] [CrossRef]
  6. Coll, C.; Caselles, V.; Galve, J.M.; Valor, E.; Niclòs, R.; Sánchez, J.M.; Rivas, R. Ground measurements for the validation of land surface temperatures derived from AATSR and MODIS data. Remote Sen. Environ. 2005, 97, 288–300. [Google Scholar] [CrossRef]
  7. Coll, C.; Caselles, V.; Valor, E.; Niclòs, R.; Sánchez, J.M.; Galve, J.M.; Mira, M. Temperature and emissivity separation from ASTER data for low spectral contrast surfaces. Remote Sens. Environ. 2007, 110, 162–175. [Google Scholar] [CrossRef]
  8. Wan, Z.; Zhang, Y.; Zhang, Q.; Li, Z.L. Validation of the land-surface temperature products retrieved from Terra Moderate Resolution Imaging Spectroradiometer data. Remote Sen. Environ. 2002, 83, 163–180. [Google Scholar] [CrossRef]
  9. Wan, Z. New refinements and validation of the MODIS Land-Surface Temperature/Emissivity products. Remote Sens. Environ. 2008, 112, 59–74. [Google Scholar] [CrossRef]
  10. Fiebrich, C.A.; Martinez, J.E.; Brotzge, J.A.; Basara, J.B. The Oklahoma Mesonet’s skin temperature network. J. Atmos. Ocean. Technol. 2003, 20, 1496–1504. [Google Scholar] [CrossRef]
  11. Göttsche, F.M.; Olesen, F.S.; Bork-Unkelbach, A. Validation of land surface temperature derived from MSG/SEVIRI with in situ measurements at Gobabeb, Namibia. Int. J. Remote Sens. 2013, 34, 3069–3083. [Google Scholar] [CrossRef]
  12. Trigo, I.F.; Monteiro, I.T.; Olesen, F.; Kabsch, E. An assessment of remotely sensed land surface temperature. J. Geophys. Res. 2008, 113. [Google Scholar] [CrossRef]
  13. Niclòs, R.; Caselles, V.; Coll, C.; Valor, E.; Sánchez, J.M. In situ surface temperature retrieval in a boreal forest under variable cloudiness conditions. Int. J. Remote Sens. 2005, 26, 3985–4000. [Google Scholar] [CrossRef]
  14. Theocharous, E.; Usadi, E.; Fox, N.P. CEOS Comparison of IR Brightness Temperature Measurements in Support of Satellite Validation. Part I: Laboratory and Ocean Surface Temperature Comparison of Radiation Thermometers; National Physical Laboratory: Teddington, UK, 2010. [Google Scholar]
  15. Brogniez, G.; Pietras, C.; Legrand, M.; Dubuisson, P.; Haeffelin, M. A high accuracy multiwavelength radiometer for in situ measurements in the thermal infrared. Part II: Behavior in field experiments. J. Atmos. Oceanic Technol. 2003, 20, 1023–1033. [Google Scholar] [CrossRef]
  16. Niclòs, R.; Galve, J.M.; Valiente, J.A.; Estrela, M.J.; Coll, C. Accuracy assessment of land surface temperature retrievals from MSG2-SEVIRI data. Remote Sens. Environ. 2011, 115, 2126–2140. [Google Scholar] [CrossRef]
  17. Coll, C.; Caselles, V.; Valor, E.; Niclòs, R. Comparison between different sources of atmospheric profiles for land surface temperature retrieval from single channel thermal infrared data. Remote Sens. Environ. 2012, 117, 199–210. [Google Scholar] [CrossRef]
  18. Gillespie, A.; Rokugawa, S.; Matsunaga, T.; Cothern, J.S.; Hook, S.; Kahle, A.B. A temperature and emissivity separation algorithm for Advanced Spaceborne Thermal Emission and Reflection Radiometer (ASTER) images. IEEE Trans. Geosci. Remote Sens. 1998, 36, 1113–1126. [Google Scholar] [CrossRef]
  19. Mira, M.; Schmugge, T.J.; Valor, E.; Caselles, V.; Coll, C. Comparison of thermal infrared emissivities retrieved with the two-lid box and the TES methods with laboratory spectra. IEEE Trans. Geosci. Remote Sens. 2009, 47, 1012–1021. [Google Scholar] [CrossRef]
  20. Rubio, E.; Caselles, V.; Coll, C.; Valor, E.; Sospedra, F. Thermal-infrared emissivities of natural surfaces: Improvements on the experimental set-up and new measurements. Int. J. Remote Sens. 2003, 24, 5379–5390. [Google Scholar] [CrossRef]
  21. García-Santos, V.; Valor, E.; Caselles, V.; Coll, C.; Burgos, M.A. Effect of soil moisture on the angular variation of thermal infrared emissivity of inorganic soils. IEEE Geosci. Remote Sens. Lett. 2014, 11, 1091–1095. [Google Scholar] [CrossRef]
  22. Niclòs, R.; Doña, C.; Bisquert, M.; Valor, E. Thermal-infrared spectral and angular characterization of crude oil and seawater emissivities for oil slick identification. IEEE Trans. Geosci. Remote Sens. 2014, 52, 5387–5395. [Google Scholar] [CrossRef]
  23. Salisbury, J.W.; D’Aria, D.M. Emissivity of terrestrial materials in the 8–14 µm atmospheric window. Remote Sens. Environ. 1992, 42, 83–106. [Google Scholar] [CrossRef]
  24. Horton, K.A.; Johson, J.R.; Lucey, P.G. Infrared measurements of Pristine and disturbed soils 2. Environmental effects and field data reduction. Remote Sens. Environ. 1998, 64, 47–52. [Google Scholar] [CrossRef]
  25. Valor, E.; Caselles, V. Mapping land surface emissivity from NDVI: Application to European, African and South American areas. Remote Sens. Environ. 1996, 57, 167–184. [Google Scholar] [CrossRef]
  26. Niclòs, R.; Valor, E.; Caselles, V.; Coll, C.; Sánchez, J.M. In situ angular measurements of thermal infrared sea surface emissivity—Validation of models. Remote Sens. Environ. 2005, 94, 83–93. [Google Scholar] [CrossRef]
  27. Niclòs, R.; Caselles, V.; Valor, E.; Coll, C.; Sánchez, J.M. A simple equation for determining the sea surface emissivity in the 3–15 μm region. Int. J. Remote Sens. 2009, 30, 1603–1619. [Google Scholar] [CrossRef]
  28. Lagouarde, J.P.; Kerr, Y.H.; Brunet, Y. An experimental study of angular effects on surface temperature for various plant canopies and bare soils. Agr. Forest Meteorol. 1995, 77, 167–190. [Google Scholar] [CrossRef]
  29. Labed, J.; Stoll, M.P. Angular variation of land surface spectral emissivity in the thermal infrared: Laboratory investigations on bare soils. Int. J. Remote Sens. 1991, 12, 2299–2310. [Google Scholar] [CrossRef]
  30. Sobrino, J.A.; Cuenca, J. Angular variation of thermal infrared emissivity for some natural surfaces from experimental measurements. Appl. Opt. 1999, 38, 3931–3936. [Google Scholar] [CrossRef] [PubMed]
  31. Wan, Z.; Dozier, J. A generalized split-window algorithm for retrieving land surface temperature from space. IEEE Trans. Geosci. Remote 1996, 34, 892–905. [Google Scholar] [CrossRef]
  32. Snyder, W.C.; Wan, Z.; Zhang, Y.; Feng, Y.Z. Classification-based emissivity for land surface temperature measurement from space. Int. J. Remote Sens. 1998, 19, 2753–2774. [Google Scholar] [CrossRef]
  33. Wan, Z. Collection-5 MODIS Land Surface Temperature Products Users’ Guide; ICESS, University of California: Santa Barbara, CA, USA, 2006. [Google Scholar]
  34. Berk, A.; Anderson, G.P.; Acharya, P.K.; Chetwynd, J.H.; Bernstein, L.S.; Shettle, E.P.; Matthew, M.W.; Adler-Golden, S.M. MODTRAN 4 User Manual; Air Force Research Laboratory, Space Vehicles Directorate, Hanscom Air Force Base: Bedford, MA, USA, 1999. [Google Scholar]
  35. Kalnay, E.; Kanamitsu, M.; Kistler, R.; Collins, W.; Deaven, D.; Gandin, L.; Iredell, M.; Saha, S.; White, G.; Woollen, J.; et al. The NCEP/NCAR 40 year reanalysis project. Bull. Am. Meteorol. Soc. 1996, 77, 437–471. [Google Scholar] [CrossRef]
  36. Schroedter, M.; Olesen, F.; Fischer, H. Determination of land surface temperature distributions from single channel IR measurements: An effective spatial interpolation method for the use of TOVS, ECMWF and radiosonde profiles in the atmospheric correction scheme. Int. J. Remote Sens. 2003, 24, 1189–1196. [Google Scholar] [CrossRef]
  37. Schneider, P.; Ghent, D.; Corlett, G.; Prata, F.; Remedios, J. AATSR Validation: LST Validation Protocol. UL-NILU-ESA-LST-LVP Issue 1 Revision 0. 2012. Available online: http://lst.nilu.no/Portals/73/Docs/Reports/UL-NILU-ESA-LST-LVP-Issue1-Rev0-1604212.pdf (accessed on 5 November 2015).
  38. Li, H.; Sun, D.; Yu, Y.; Wang, H.; Liu, Y.; Liu, Q.; Du, Y.; Wang, H.; Cao, B. Evaluation of the VIIRS and MODIS LST products in an arid area of Northwest China. Remote Sens. Environ. 2014, 142, 111–121. [Google Scholar] [CrossRef]

