Article

Changes in Growing Season Vegetation and Their Associated Driving Forces in China during 2001–2012

1
State Key Laboratory of Earth Surface Processes and Resource Ecology, Beijing Normal University, Beijing 100875, China
2
College of Resources Science and Technology, Beijing Normal University, Beijing 100875, China
3
Academy of Disaster Reduction and Emergency Management, Beijing Normal University, Beijing 100875, China
4
College of Urban and Environmental Sciences, Peking University, Beijing 100875, China
*
Author to whom correspondence should be addressed.
Remote Sens. 2015, 7(11), 15517-15535; https://0-doi-org.brum.beds.ac.uk/10.3390/rs71115517
Submission received: 28 August 2015 / Revised: 9 November 2015 / Accepted: 12 November 2015 / Published: 18 November 2015

Abstract

:
In recent decades, the monitoring of vegetation dynamics has become crucial because of its important role in terrestrial ecosystems. In this study, a satellite-derived normalized difference vegetation index (NDVI) was combined with climate factors to explore the spatiotemporal patterns of vegetation change during the growing season, as well as their driving forces in China from 2001 to 2012. Our results showed that the growing season NDVI increased continuously during 2001–2012, with a linear trend of 1.4%/10 years (p < 0.01). The NDVI in north China mainly exhibited an increasing spatial trend, but this trend was generally decreasing in south China. The vegetation dynamics were mainly at a moderate intensity level in both the increasing and decreasing areas. The significantly increasing trend in the NDVI for arid and semi-arid areas of northwest China was attributed mainly to an increasing trend in the NDVI during the spring, whereas that for the north and northeast of China was due to an increasing trend in the NDVI during the summer and autumn. Different vegetation types exhibited great variation in their trends, where the grass-forb community had the highest linear trend of 2%/10 years (p < 0.05), followed by meadow, and needle-leaf forest with the lowest increasing trend, i.e., a linear trend of 0.3%/10 years. Our results also suggested that the cumulative precipitation during the growing season had a dominant effect on the vegetation dynamics compared with temperature for all six vegetation types. In addition, the response of different vegetation types to climate variability exhibited considerable differences. In terms of anthropological activity, our statistical analyses showed that there was a strong correlation between the cumulative afforestation area and NDVI during the study period, especially in a pilot region for ecological restoration, thereby suggesting the important role of ecological restoration programs in ecological recovery throughout China in the last decade.

Graphical Abstract

1. Introduction

In recent decades, global climate change has affected the characteristics of vegetation throughout the world [1,2]. As a key component of terrestrial ecosystems, vegetation has an irreplaceable role in regulating the carbon balance, reducing greenhouse gases, and maintaining climate stability by modifying biophysical land-surface properties and other biochemical processes [3,4]. The instrument-derived temperature records obtained in recent decades provide convincing evidence that northern terrestrial ecosystems have experienced the greatest warming rate throughout the world, particularly during the winter and spring [5,6], which has been reported to have significant regional impacts on the function and integrity of ecosystems from global to local scales [7,8,9,10,11]. Among the various ecosystem indicators, vegetation cover is considered to be a primary indicator when assessing the ecological environment as well as for social and economic sustainability development [12]. At present, many aspects of vegetation dynamics still remain poorly understood, although numerous studies have considered the associations between vegetation dynamics and climate change [13,14]. Therefore, achieving a good understanding of vegetation dynamics and their driving forces is a major objective in the environmental sciences, particularly when studying the effects of climate change on terrestrial ecosystems [15].
In recent years, monitoring vegetation dynamics and identifying their associated driving forces has become a crucial issue in studies of global climate change. Many studies based on satellite data have documented changes in vegetation growth with links to climate change in different regions and biomes [4,16,17,18,19]. China has experienced remarkable climatic warming, which has resulted in the more frequent occurrence of extreme weather and climate events [20]. These extreme climate events such as drought have significantly affected the vegetation dynamics in many parts of China [12,21]. For instance, recent studies have addressed the responses of natural vegetation dynamics to climate drivers in China during the last 30 years [22], as well as the effects of the precipitation intensity and temperature on grass dynamics over northern China [23]. Increasingly, studies have highlighted the importance of understanding the response of vegetation growth to climate change, as well as for predicting future interactions between terrestrial ecosystems and the climatic system. However, the responses of vegetation to climate change vary considerably among regions and biomes [24], and the changes within various vegetation types are still poorly understood. It should be noted that changes in different vegetation types and their responses to climate variability are of importance for understanding the variations in vegetation productivity and the terrestrial net carbon uptake [25,26]. In addition, the conclusions of most previous studies were based on global inventory modeling and mapping studies (GIMMS) using the normalized difference vegetation index (NDVI), with a low spatial resolution of 8 × 8 km2, and thus certain uncertainties may be included in regional studies of vegetation dynamics. Fortunately, a more recent NDVI dataset from the Terra MOderate Resolution Imaging Spectroradiometer (MODIS) is considered to be an improvement over GIMMS NDVI, and it has been used widely in regional vegetation detection and model analysis [27]. Therefore, studying variations in vegetation using MODIS NDVI in China may be an important supplement that can facilitate robust conclusions.
In addition to the changes in climate and atmospheric composition, land-use change such as afforestation and reforestation may also have played an important role in vegetation dynamics [14]. Afforestation has been implemented worldwide as regional and national policies to sequester carbon dioxide from the atmosphere [28,29]. In China, a series of national policies has been implemented to address pressing environmental problems and to improve ecosystem services in northwestern and northern China, including the Three-North Belt Program, the Natural Forest Protection Program, and the Grain for Green Program. The widespread implementation of ecological restoration programs has significantly altered land cover in the region, as well as increasing the forest cover. As a result, rapid changes in vegetation cover have been detected in recent decades in northern China [29]. However, the causes of vegetation dynamics in China are complex and the contributions of climate change and ecological restoration remain unclear. In addition, large-scale afforestation may also alter bio-geophysical properties such as the surface albedo and evapotranspiration. For example, a recent study showed that the conversion of croplands to forests can alter plant productivity and ecosystem carbon fluxes because forests may have higher gross primary productivity and net ecosystem productivity than croplands [30]. These changes in the flux of water, energy and carbon between terrestrial ecosystems and the atmosphere will have inevitable effects on the regional climate. Thus, an overall evaluation of vegetation in China is necessary in order to clearly understand the interactions between terrestrial ecosystems and the atmosphere.
The primary aim of this study was to explore spatiotemporal variations in vegetation and their driving forces in China by considering the combined effects of climate change and anthropological activity on vegetation dynamics during recent decades, as well as changes in vegetation during the spring, summer, and autumn to obtain a deeper understanding of vegetation dynamics. We aimed to address the following questions. (1) How the vegetation dynamics in China responded to rapid climate change and large-scale ecological restoration? (2) How the different vegetation types changed in response to climate change? To answer these questions, we performed several steps. First, we characterized the spatial patterns and vegetation dynamics during the growing season (defined as April to October) in China. Next, we analyzed the changes in different vegetation types and their responses to climate change. Finally, we considered the contributions of both climate change and anthropological activity to explore the driving forces of vegetation dynamics.

2. Methods and Datasets

2.1. Datasets

The MODIS/Terra MOD13A3 datasets obtained by NASA’s Earth Observing System during 2001 to 2012 were used in this study (http://e4ftl01.cr.usgs.gov). The spatial and temporal resolutions of this NDVI dataset are 1 × 1 km2 and one month, respectively. This NDVI is used widely to study changes in regional vegetation coverage because of its moderate spatial resolution and high quality resulting from robust treatments of water, clouds, and heavy aerosols. First, the data format and projection of the raw MODIS-NDVI data were transformed using MODIS Reprojection Tools. Next, the growing season NDVI was defined as the average NDVI from April to October for each year [4]. In this study, pixels with a mean growing season NDVI < 0.05 were masked as non-vegetated areas.
Meteorological datasets from 570 meteorological stations, which comprised the monthly mean temperatures and accumulated monthly precipitation from 2001–2012, were collected from the China Meteorological Data Sharing Service System (http://cdc.cma.gov.cn). In addition, vegetation types were obtained from a digitized 1:1,000,000 scale map of vegetation in China [31]. The vegetation was grouped into 12 types: needle-leaf forest (NF), mixed needle-leaf and broadleaf forest, broadleaf forest (BF), scrub, desert, steppe, grass-forb community (GFC), meadow, swamp, alpine vegetation, cultivated vegetation, and others. To assess the variability in the trends within different vegetation types, we selected six vegetation types: NF, BF, scrub, steppe, GFC, and meadow, each of which contained more than 20 meteorological stations. It should be noted that most of the selected station together with the surrounding 3 × 3 km2 area completely belonged to a unique vegetation type. For those stations with more than one vegetation types in 3 by 3 km2 window, we have corrected the boundary of the window according to vegetation type boundary before extracted NDVI value in order to obtain clear NDVI value for a unique vegetation type.

2.2. Methods

2.2.1. Analysis of Trends in Vegetation Dynamics

Linear regression can be used to simulate the trends in vegetation dynamics for each pixel. The slope of the linear regression was employed as an index to fit the trend in the vegetation dynamics for every pixel using the least squares method for a given study period, which can comprehensively reflect the spatiotemporal variation characteristics of vegetation coverage [32,33]. The slope is calculated as follows:
S l o p e = n × i = 1 n i × N D V I i i = 1 n i i = 1 n N D V I i n × i = 1 n i 2 ( i = 1 n i ) 2
where Slope is the trend in the vegetation dynamics, n is equal to 12, i is the order of year from 1 to 12 in the study period, and NDVIi is the mean NDVI in the ith year. The NDVI exhibits an increasing trend when Slope > 0 and a decreasing trend when Slope < 0.

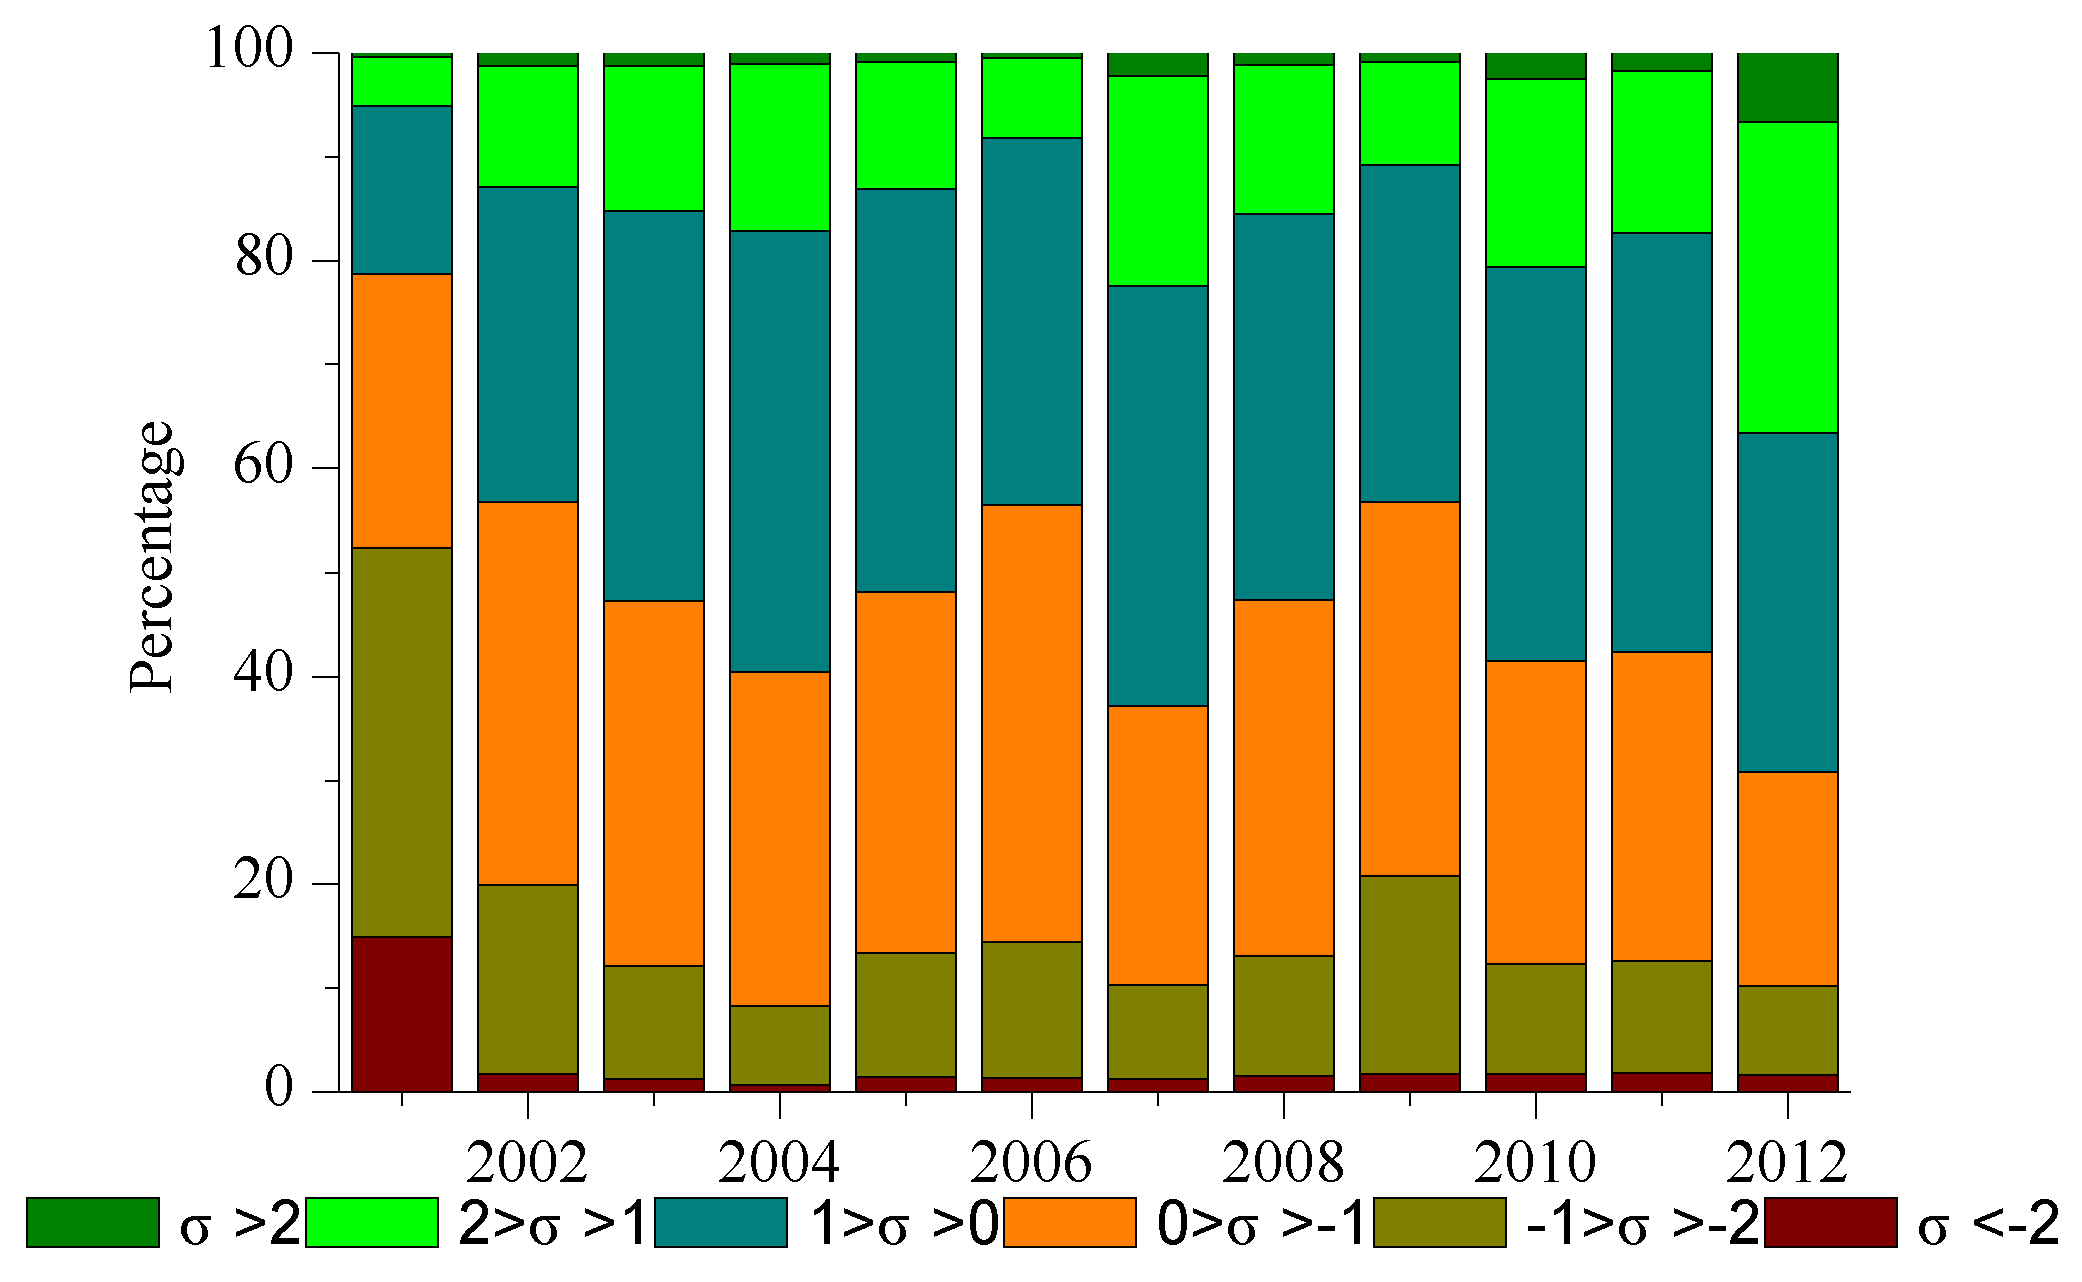
2.2.2. Analysis of the Intensity of the Vegetation Dynamics

An anomaly is defined as a standardized departure from the average growing season NDVI [34,35], which has been used widely as a proxy for assessing the intensity of vegetation dynamics:
σ ( i ) = ( N D V I i M e a n ( N D V I ) ) / S D ( N D V I )
where NDVIi is the mean growing season NDVI for year i, and Mean(NDVI) and SD(NDVI) are the average and standard deviation, respectively, of the growing season NDVI from 2001 to 2012. Anomalies were divided into three levels: (1) |σ(i)|<1, referred to as weak intensity, both positive (IW+) and negative (IW–); (2) |σ(i)|>1, referred to as moderate intensity, both positive (IM+) and negative (IM–); and (3) |σ(i)|>2, referred to as large intensity, both positive (IL+) and negative (IL–).

2.2.3. Partial Correlation Analysis

Climatic drivers affect vegetation growth simultaneously, so the vegetation dynamics are coupled with the effects of climate factors. Thus, ordinary correlation analysis may introduce bias during the analysis of the relationship between vegetation dynamics and climate factors. An advantage of partial correlation analysis is that when two variables are associated simultaneously with a third variable, the impact of the third is excluded, and only the correlation between the other two variables is estimated during correlation analysis [36]. This is an effective method for overcoming the shortcomings of ordinary correlation analysis. The formula for partial correlation analysis is as follows:
r x y z = r x y r x z r y z ( 1 r x z 2 ) ( 1 r y z 2 )
where rxy·z is the partial correlation coefficient between variables x and y after fixing variable z; and rxy, rxz, and ryz are the correlation coefficients between variables x and y, x and z, and y and z, respectively.
The correlation coefficient is calculated as follows:
r x y = i = 1 n ( x i x ¯ ) ( y i y ¯ ) i = 1 n ( x i x ¯ ) 2 i = 1 n ( y i y ¯ ) 2
where rxy is the correlation coefficient for x and y, whose value ranges from –1 to 1.
It should be noted that, in the current study, we employed site-by-site partial correlation analysis to explore the responses of the vegetation dynamics to climate factors, as follows: (1) based on the meteorological sites, we extracted annual and monthly NDVI values from 3 × 3 km2 areas; and (2) using these NDVI values, we calculated the partial correlation coefficients between the NDVI and the annual and monthly mean temperature and precipitation.

3. Results and Discussion

3.1. Trend and Intensity of Vegetation Dynamics on a National Scale

During the 12-year investigation period (2001–2012), the average NDVI for China increased with a linear trend of 1.4%/10 years (p < 0.01). Figure 1 shows that the average annual NDVI curve can be divided into two principal stages, as follows. (1) The mean NDVI increased significantly during 2001–2002 at a rate of 4.96%, which might reflect the large-scale implementation of the GGP program introduced in 2002; (2) The mean NDVI during 2002–2012 exhibited a significant increase with a linear trend of 0.7%/10 years (p < 0.01). Moreover, the mean NDVI ranged from 0.4029 to 0.4170, with a change rate of 2.94%.
Figure 1. Inter-annual variation in the NDVI throughout China during 2001–2012. The values on the curve represent the change rate between two adjacent years.
Remotesensing 07 15517 g001
Figure 2 shows the inter-annual variations in the percentage of land area with differences in the intensity of the vegetation dynamics from 2001 to 2012. The area with vegetation greenness increased from 21% in 2001 to 69% in 2012, i.e., an increase of 2.2%/year (p < 0.05), which suggests that there was an overall increasing trend in vegetation greenness throughout the entire period. The vegetation greenness IM+ and IL+ increased simultaneously, and the rates of increase for IM+ and IW+ were 1.2%/year (p < 0.05) and 0.3%/year (p < 0.05), respectively. In addition, the area with vegetation decreased from 2001 to 2012 at the same rate of –2.2%/year (p < 0.05). This significant decline in vegetation greenness can be attributed mainly to a decrease in the area with IM– rather than the area with IW–, which supports earlier findings [36]. However, the land fraction of vegetation with IM– decreased at a rate of –1.1%/year (p < 0.1) during the entire study period.

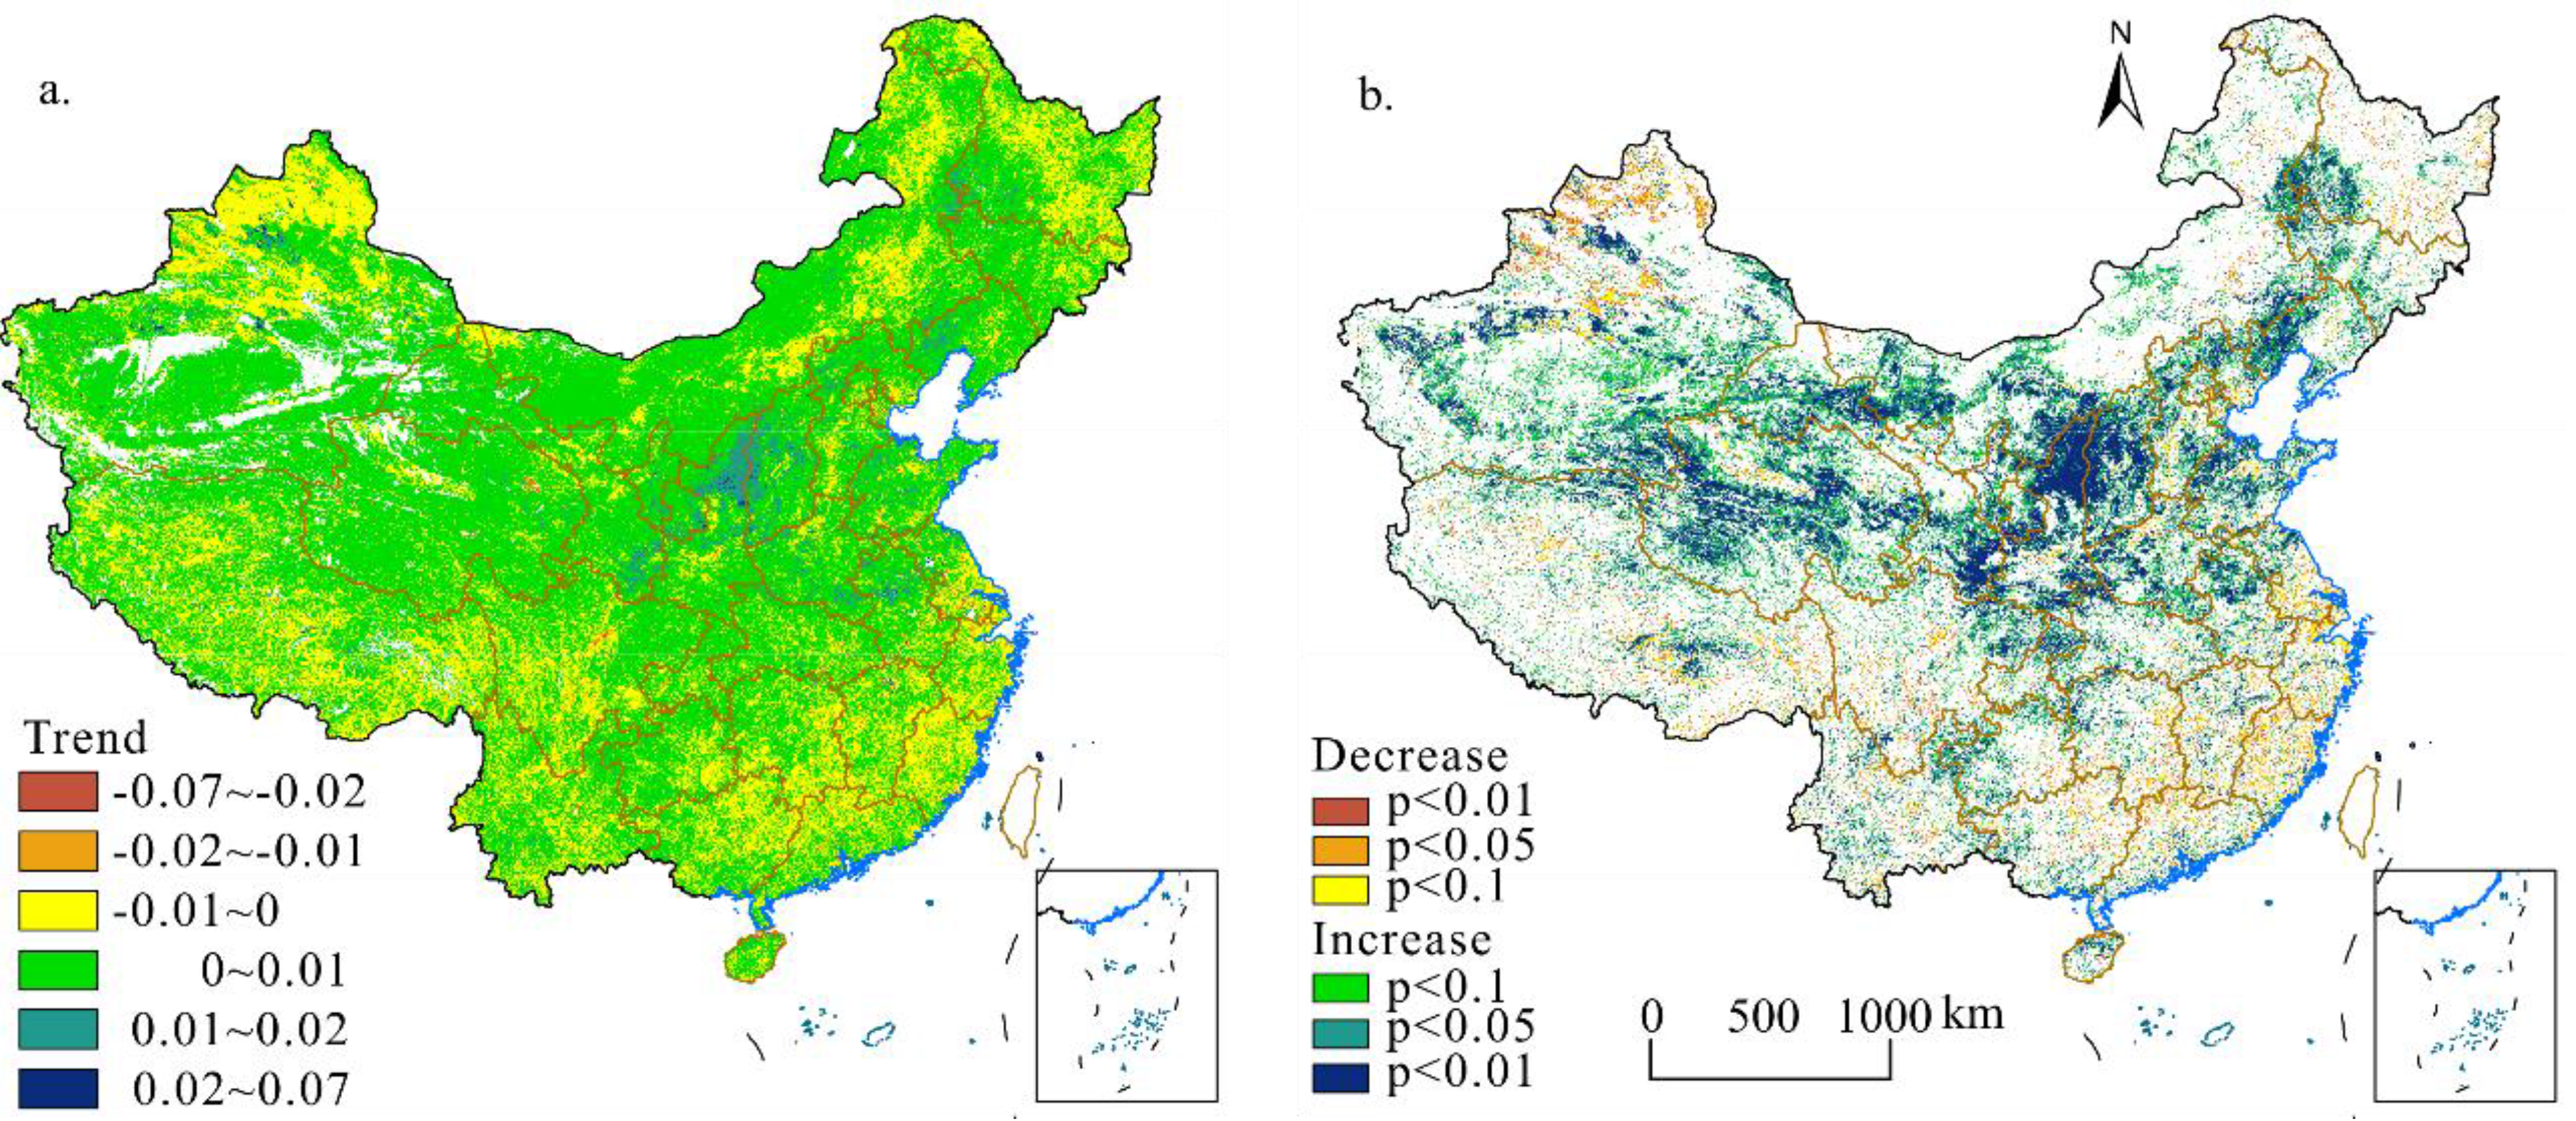
3.2. Spatial Pattern of Vegetation Dynamics

Linear regression analysis was used to detect trends in the NDVI changes. The results showed that the spatial changes in NDVI clearly differed between 2001 and 2012, where the areas with increasing and decreasing trends accounted for 70.14% and 29.86%, respectively. Significance tests of the changes in the NDVI were also conducted, which showed that the NDVI in 30.5%, 30.8%, and 21.4% of the entire study area increased significantly at the 0.01, 0.05, and 0.1 levels, respectively. By contrast, the NDVI in 4.7%, 6.8%, and 5.8% of the entire study area decreased significantly at the 0.01, 0.05, and 0.1 levels, respectively. Provincial statistics showed that most regions of China had an increasing trend. Regions with vegetation browning were distributed mainly in Shanghai, Zhejiang, Jiangxi, and Fujian, whereas most of the greening regions were located in Shanxi, Shaanxi, and Ningxia (Table 1).
Figure 2. Percentage of land area with different NDVI intensities throughout China.
Remotesensing 07 15517 g002
Table 1. Vegetation dynamics in different provinces during 2001–2012.
ProvinceTrend %/10 YearsIncrease (%)Decrease (%)ProvinceTrend %/10 YearsIncrease (%)Decrease (%)
Heilongjiang0.9057.09 (14.7)42.91 (5.02)Guangxi0.2152.56 (12.49)47.44 (8.92)
Xinjiang0.4672.06 (23.73)27.94 (5.09)Guangdong0.1051.88 (14.18)48.12 (12.41)
Shanxi6.4492.64 (79.69)7.36 (1.64)Hainan2.2170.05 (31.65)29.95 (5.65)
Ningxia4.4090.06 (52.56)9.94 (2.06)Jilin2.2876.35 (25.06)23.65 (2.55)
Xizang0.3461.93 (14.22)38.07 (5.39)Liaoning3.8587.26 (46.91)12.74 (2.11)
Shandong3.6381.06 (49.68)18.94 (5.85)Tianjin1.7566.38 (33.16)33.62 (12.48)
Henan3.9284.58 (46.05)15.42 (3.85)Qinghai1.9386.41 (48.41)13.59 (1.82)
Jiangsu0.2555.28 (22.96)44.72 (17.80)Gansu2.7788.11 (49.66)11.89 (1.04)
Anhui2.9277.18 (38.84)22.82 (5.36)Shaanxi5.4288.02 (76.87)11.98 (1.68)
Hubei1.9376.75 (28.84)23.25 (3.15)Neimenggu1.5676.32 (23.77)23.68 (1.72)
Zhejiang−1.3340.08 (9.12)59.92 (24.41)Chongqing2.0278.84 (36.02)21.16 (2.73)
Jiangxi−0.1849.79 (14.94)50.21 (12.68)Hebei3.1878.99 (41.91)21.01 (6.07)
Hunan0.2055.07 (15.17)44.93 (9.73)Shanghai-2.1835.22 (13.71)64.78 (36.48)
Yunnan1.0061.16 (17.83)38.84 (6.50)Beijing2.5477.00 (33.97)23.00 (8.80)
Guizhou1.9070.73 (23.65)29.27 (3.45)Sichuan0.9364.53 (17.71)35.47 (5.32)
Fujian−1.5132.76 (7.83)67.24 (27.16)
The bold values in brackets denote significant (p < 0.05) changes in vegetation.
In north China, the NDVI mainly exhibited an increasing spatial trend, whereas there was a dominant decreasing trend in south China. The areas with highly significant increases (p < 0.01) were distributed mainly in the north of Shaanxi, Shanxi, and southern Qinghai provinces. The areas with decreasing trends were located in the southeast and northeast regions of China, specific areas of the Tibetan Plateau, and the north of Xinjiang (Figure 3). Further analysis showed that the average trends in the NDVI were 0.8%/10 years, 1.4%/10 years, and 1.8%/10 years (p < 0.01) during spring (April and May), summer (June to August), and autumn (September and October), respectively (Supplementary Figure S1). Moreover, the significantly increasing trend in the NDVI was due mainly to the increasing trend in the NDVI during the spring over the arid and semi-arid areas of northwest China, as well as to the increasing trend in the NDVI during the summer and autumn in the north and northeast of China. In addition, it should be noted that there was a significant decreasing trend during autumn in most areas of the Tibetan Plateau.
Figure 3. Spatial patterns of trend (a) and its significance (b) of the vegetation dynamics in China during 2001–2012.
Remotesensing 07 15517 g003

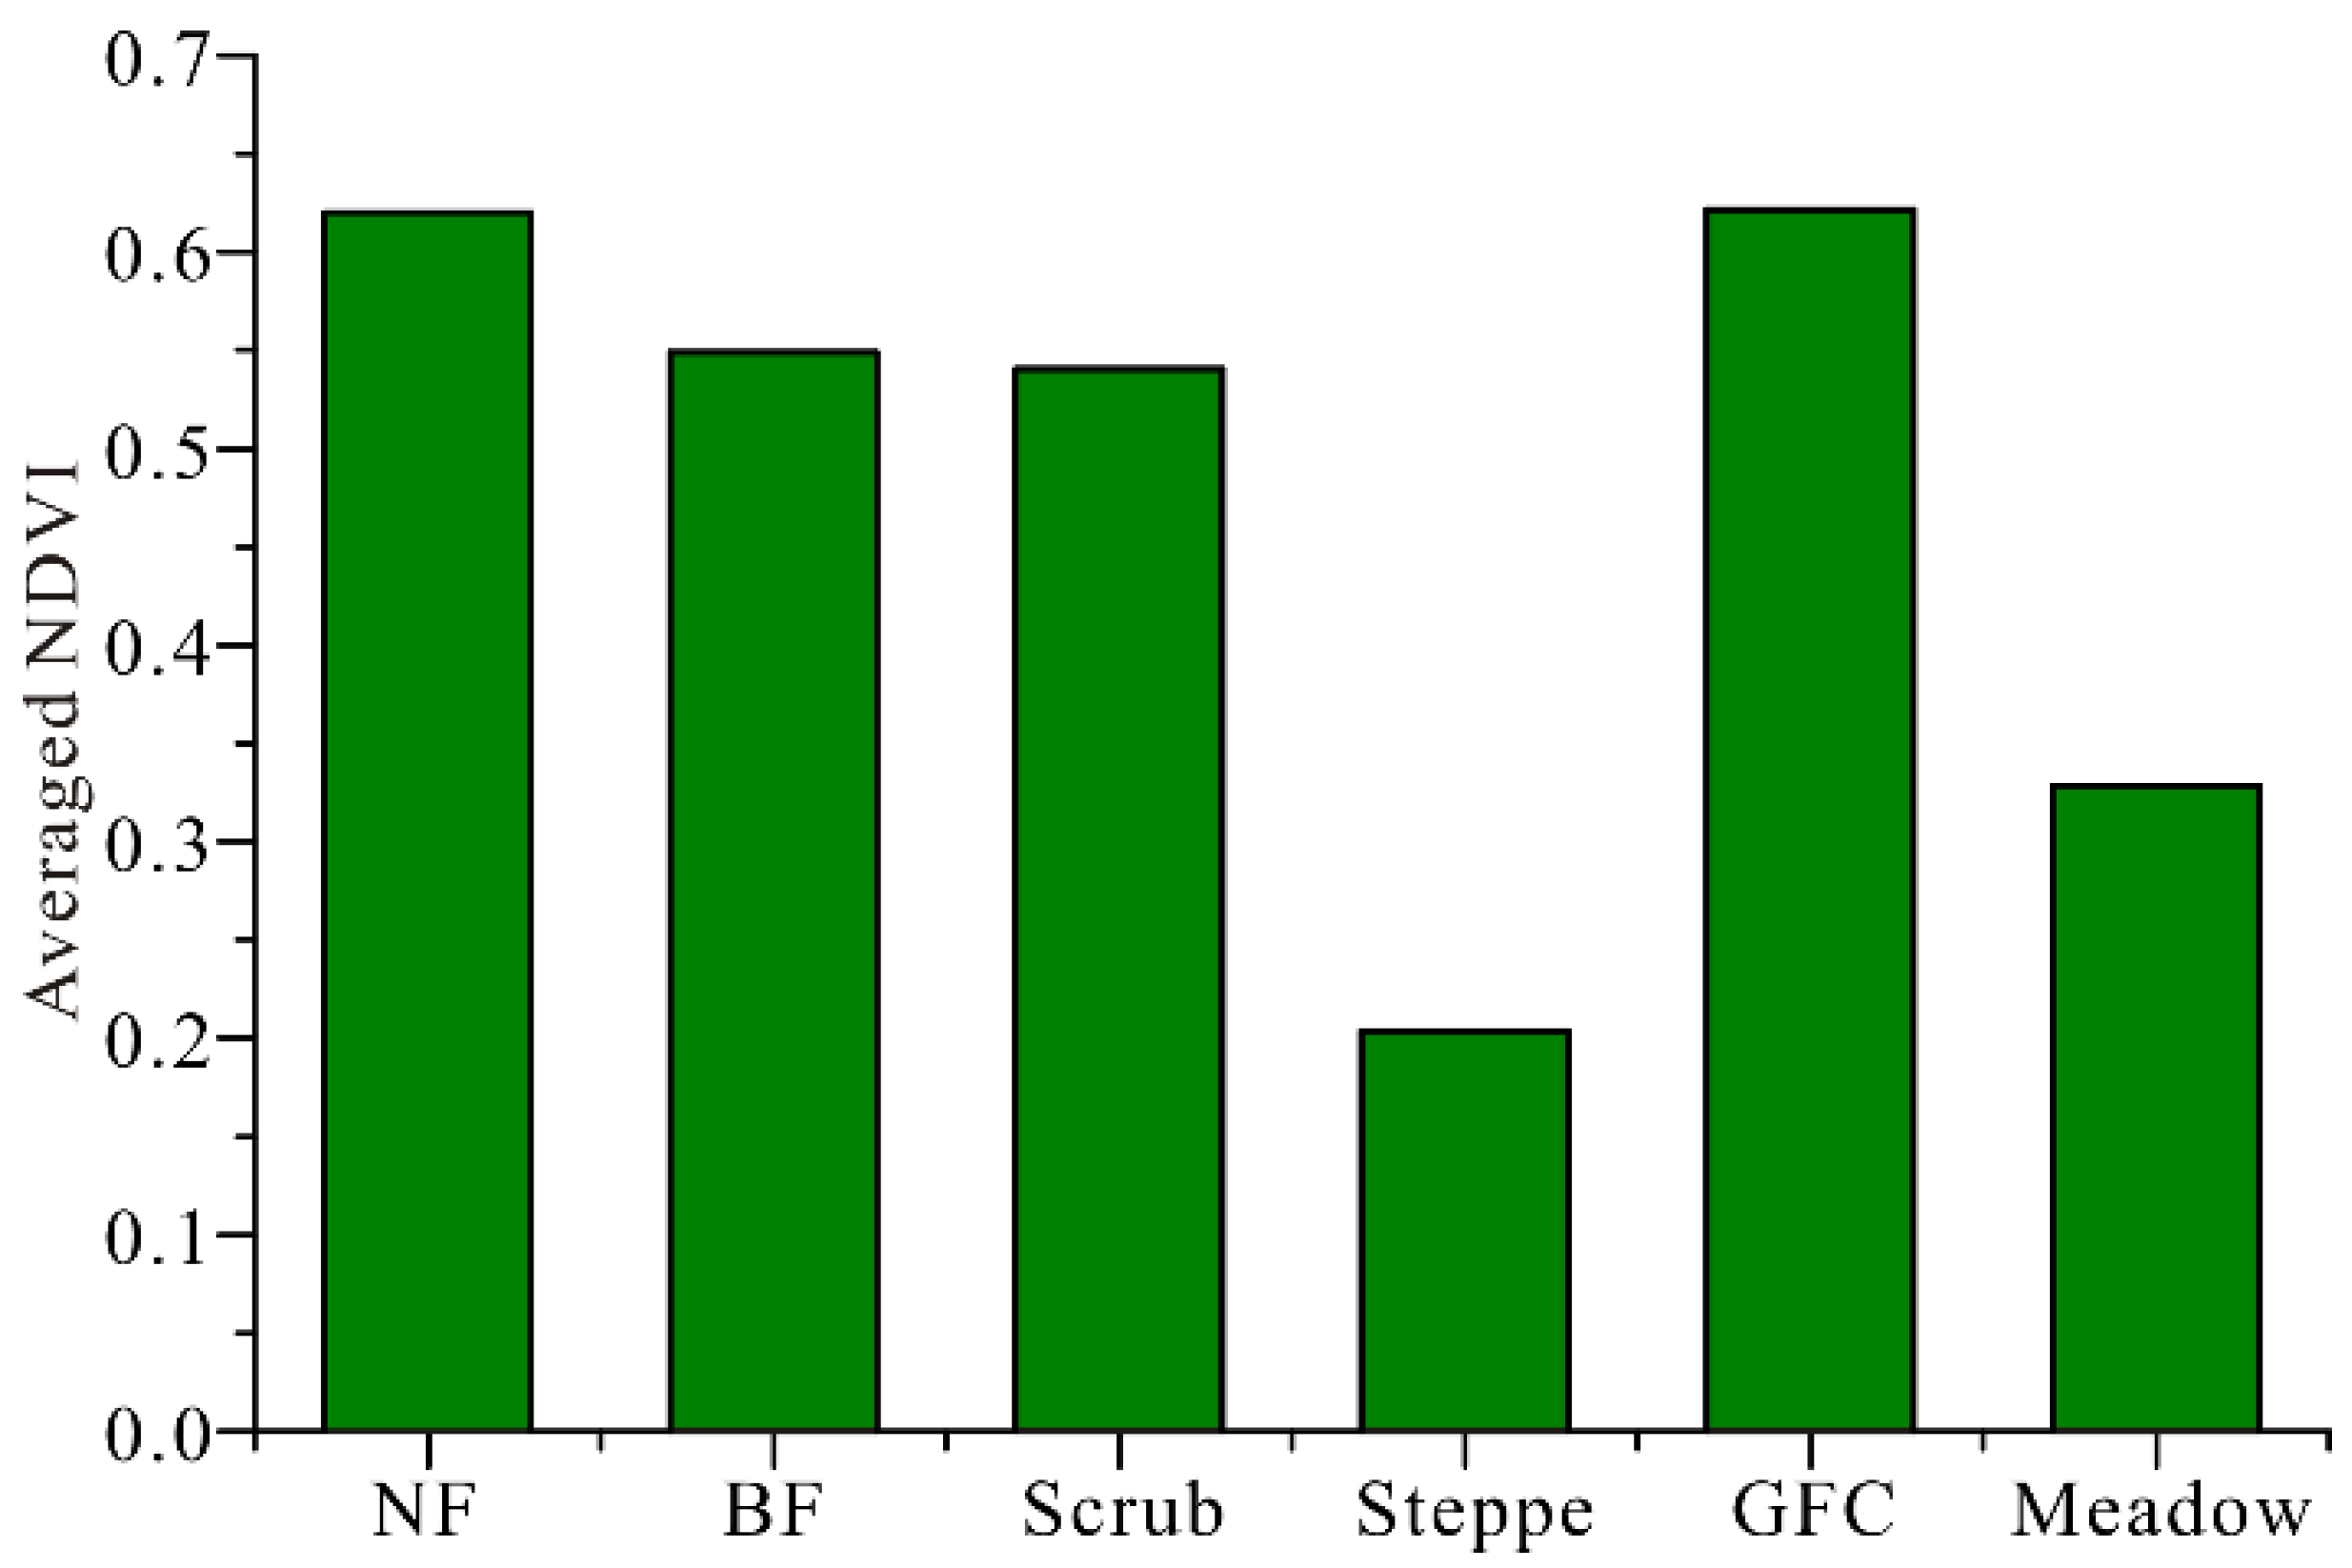
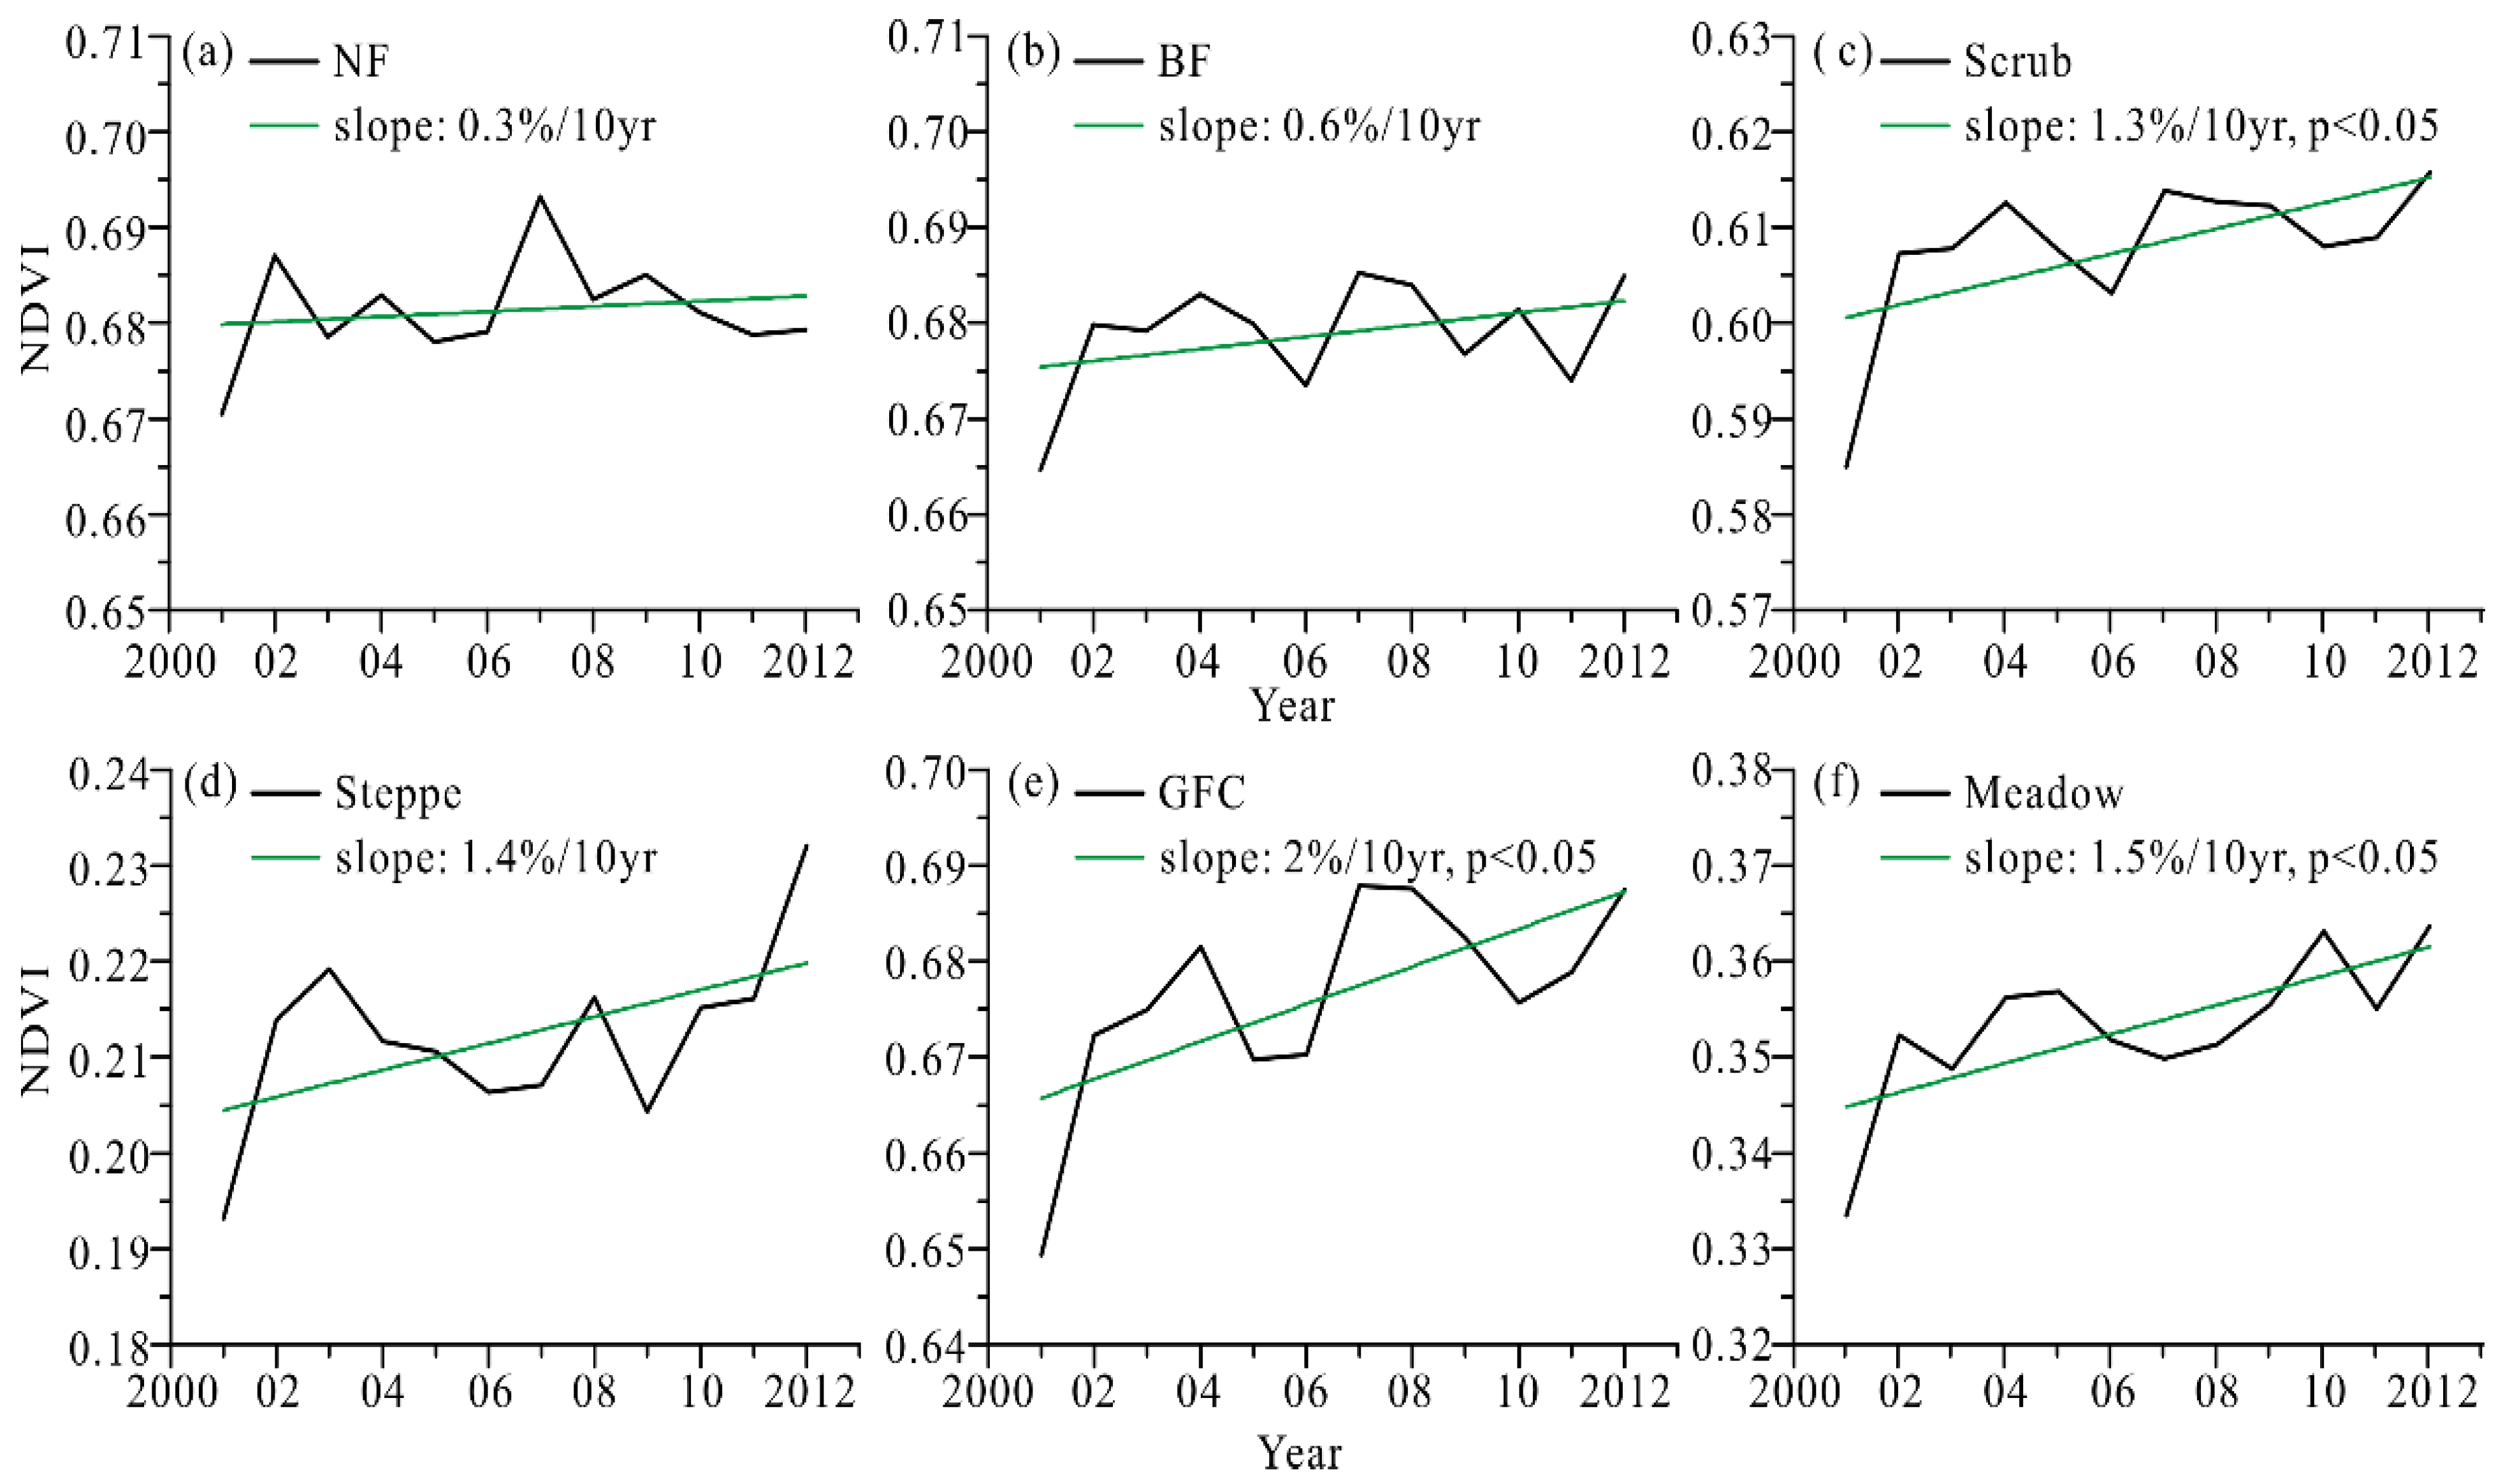
3.3. Vegetation Dynamics for Different Vegetation Types

At the biome level, forest ecosystems generally have a higher NDVI than other ecosystems. For forest ecosystems, NF had a higher NDVI than BF in our study. It should be noted that GFC had the same high NDVI as NF, which may be attributed to the warm and wet climate in south China. Scrub had the fourth largest NDVI, followed by meadow. Steppe, which is distributed mainly in Inner Mongolia, Tibet, and the north of Xinjiang, had the lowest NDVI in the growing season, which may be mainly due to the cold and dry climate (Figure 4).
Figure 4. Spatial averaged NDVI for different vegetation types.
Remotesensing 07 15517 g004
Figure 5 shows that all of the selected vegetation types had slight increasing trends during the study period with a linear trend of 0.3%–2%/10 years. NF, BF, and GFC had the three highest NDVI values (from 0.6493 to 0.6932), where GFC had the highest linear trend of 2%/10 years (p < 0.05). Steppe had the lowest NDVI value (from 0.1932 to 0.2320) and it had an increasing trend of 1.4%/10 years.
Figure 5. Inter-annual variation in the NDVI for different vegetation types: (a) NF; (b) BF; (c) scrub; (d) steppe; (e) GFC; and (f) meadow.
Remotesensing 07 15517 g005
Moreover, the intensity of the improvements in vegetation greenness for scrub, steppe, GFC, and meadow were better than those for NF and BF (Figure 6). In particular, the area with vegetation greenness increased from 39% to 52% at a rate of 0.34%/year for NF, from 37% to 61% at a rate of 0.77%/year for BF, from 25% to 63% at a rate of 1.67%/year for scrub (p < 0.05), from 21% to 76% at a rate of 2.41%/year for steppe (p < 0.05), from 24% to 64% at a rate of 2.2%/year for GFC (p < 0.05), and from 23% to 68% at a rate of 2.3%/year for meadow (p < 0.01). This suggests that there was an overall increasing trend in the selected vegetation types throughout the entire study period. This increase in vegetation greenness is attributed mainly to increases in the area of vegetation greenness IM+ and IL+ for most vegetation types, but especially NF and BF. The highest rate of increase occurred with IM+ for all six vegetation types: 0.25%/year for NE, 0.61%/year for BF, 0.99%/year for scrub (p < 0.05), 1.24%/year for steppe (p < 0.05), 1.23%/year for GFC (p < 0.05), and 1.22%/year for meadow (p < 0.01). By contrast, the area with vegetation browning decreased from 2001 to 2012 at a rate corresponding to the increased rate of vegetation greening. The highest rate of decrease also occurred with IM– for all six vegetation types: –0.22%/year for NF, –0.37%/year for BF, –0.79%/year for scrub, –1.18%/year for steppe, –0.97%/year for GFC (p < 0.10), and –1.15%/year for meadow (p < 0.05).

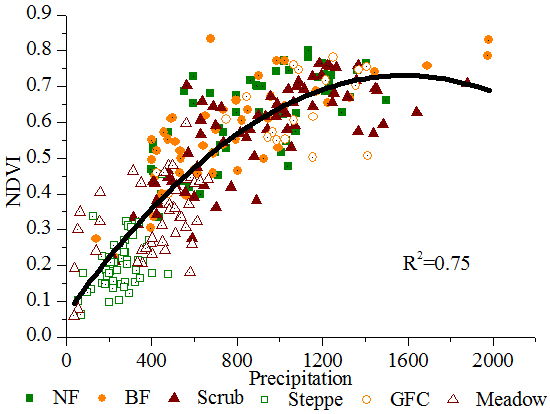
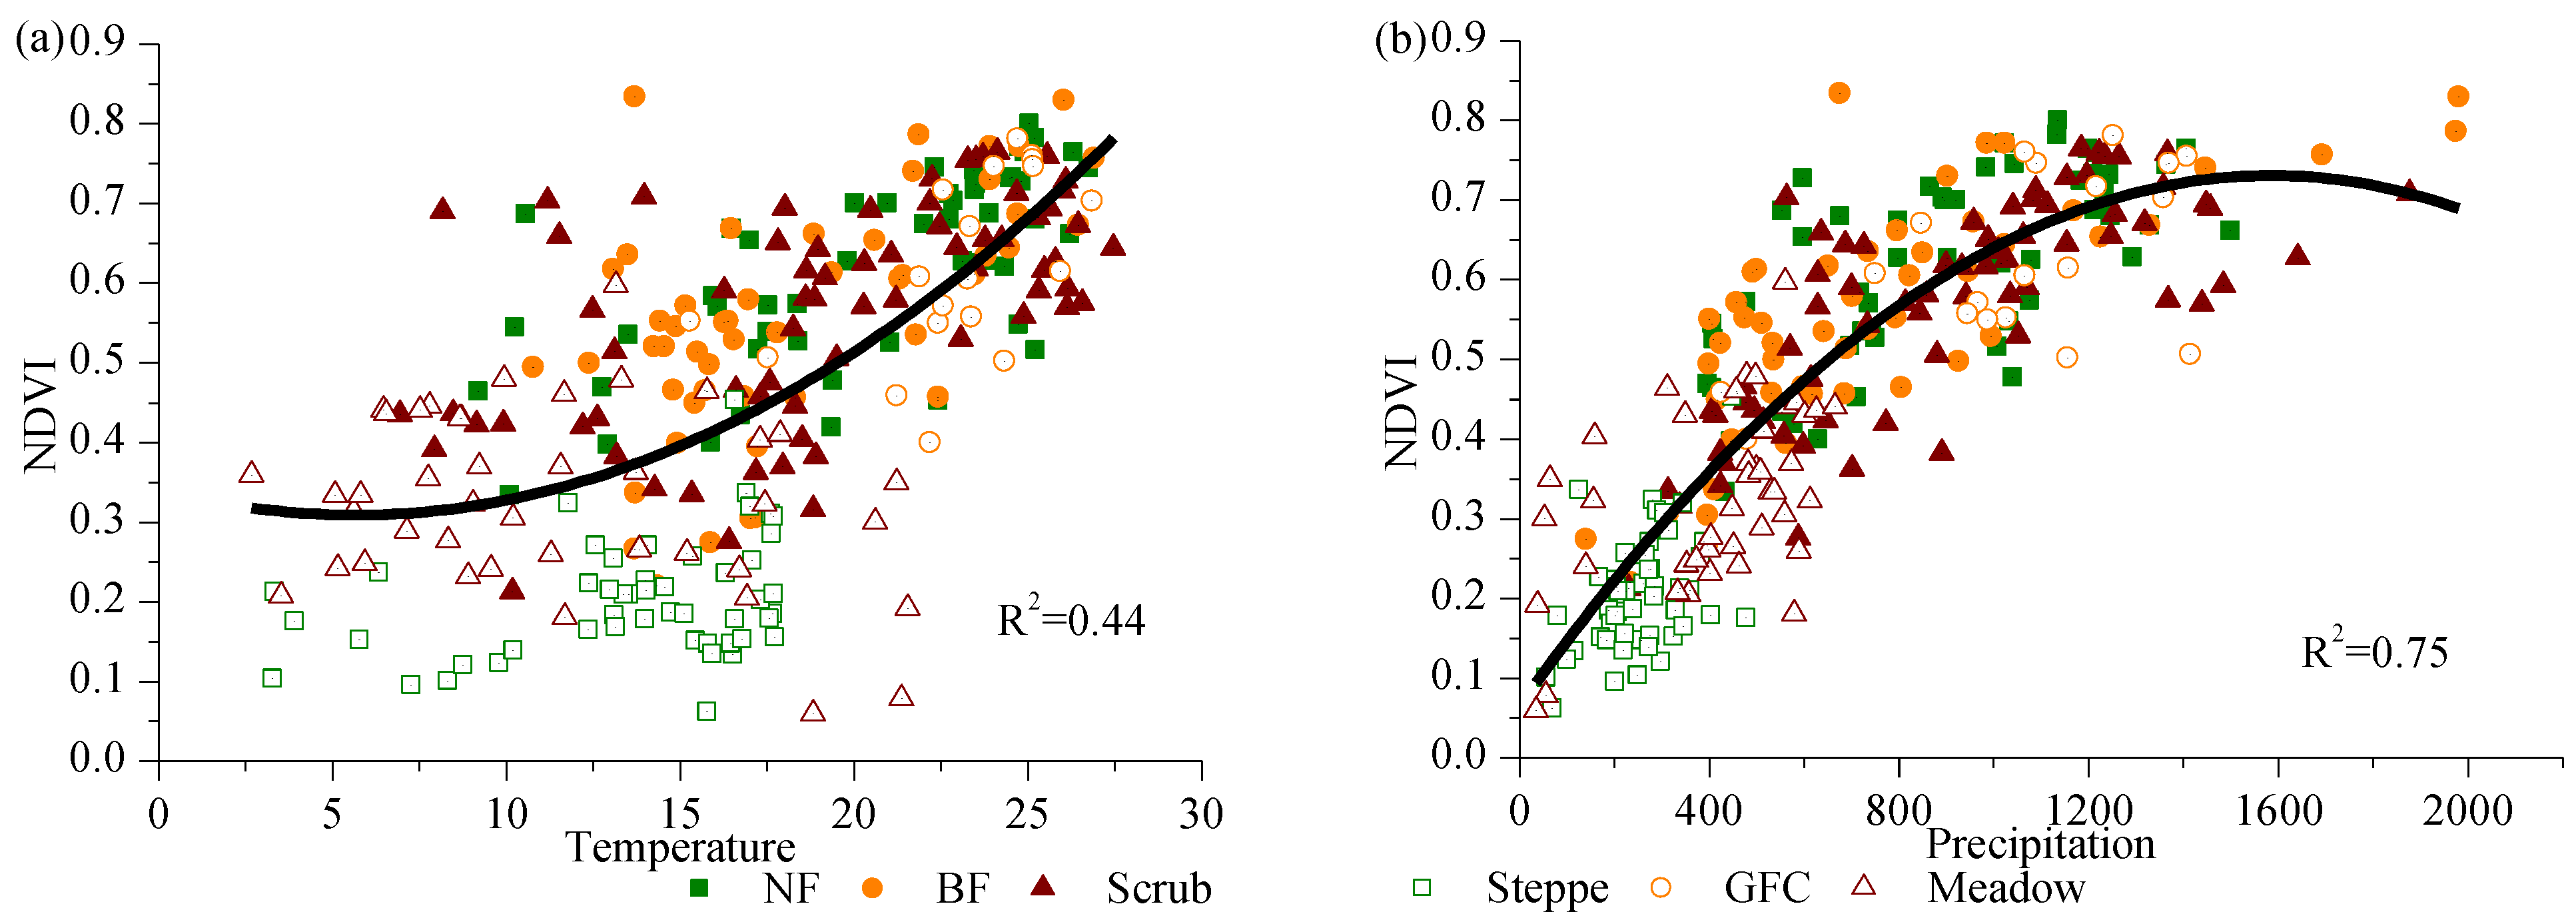
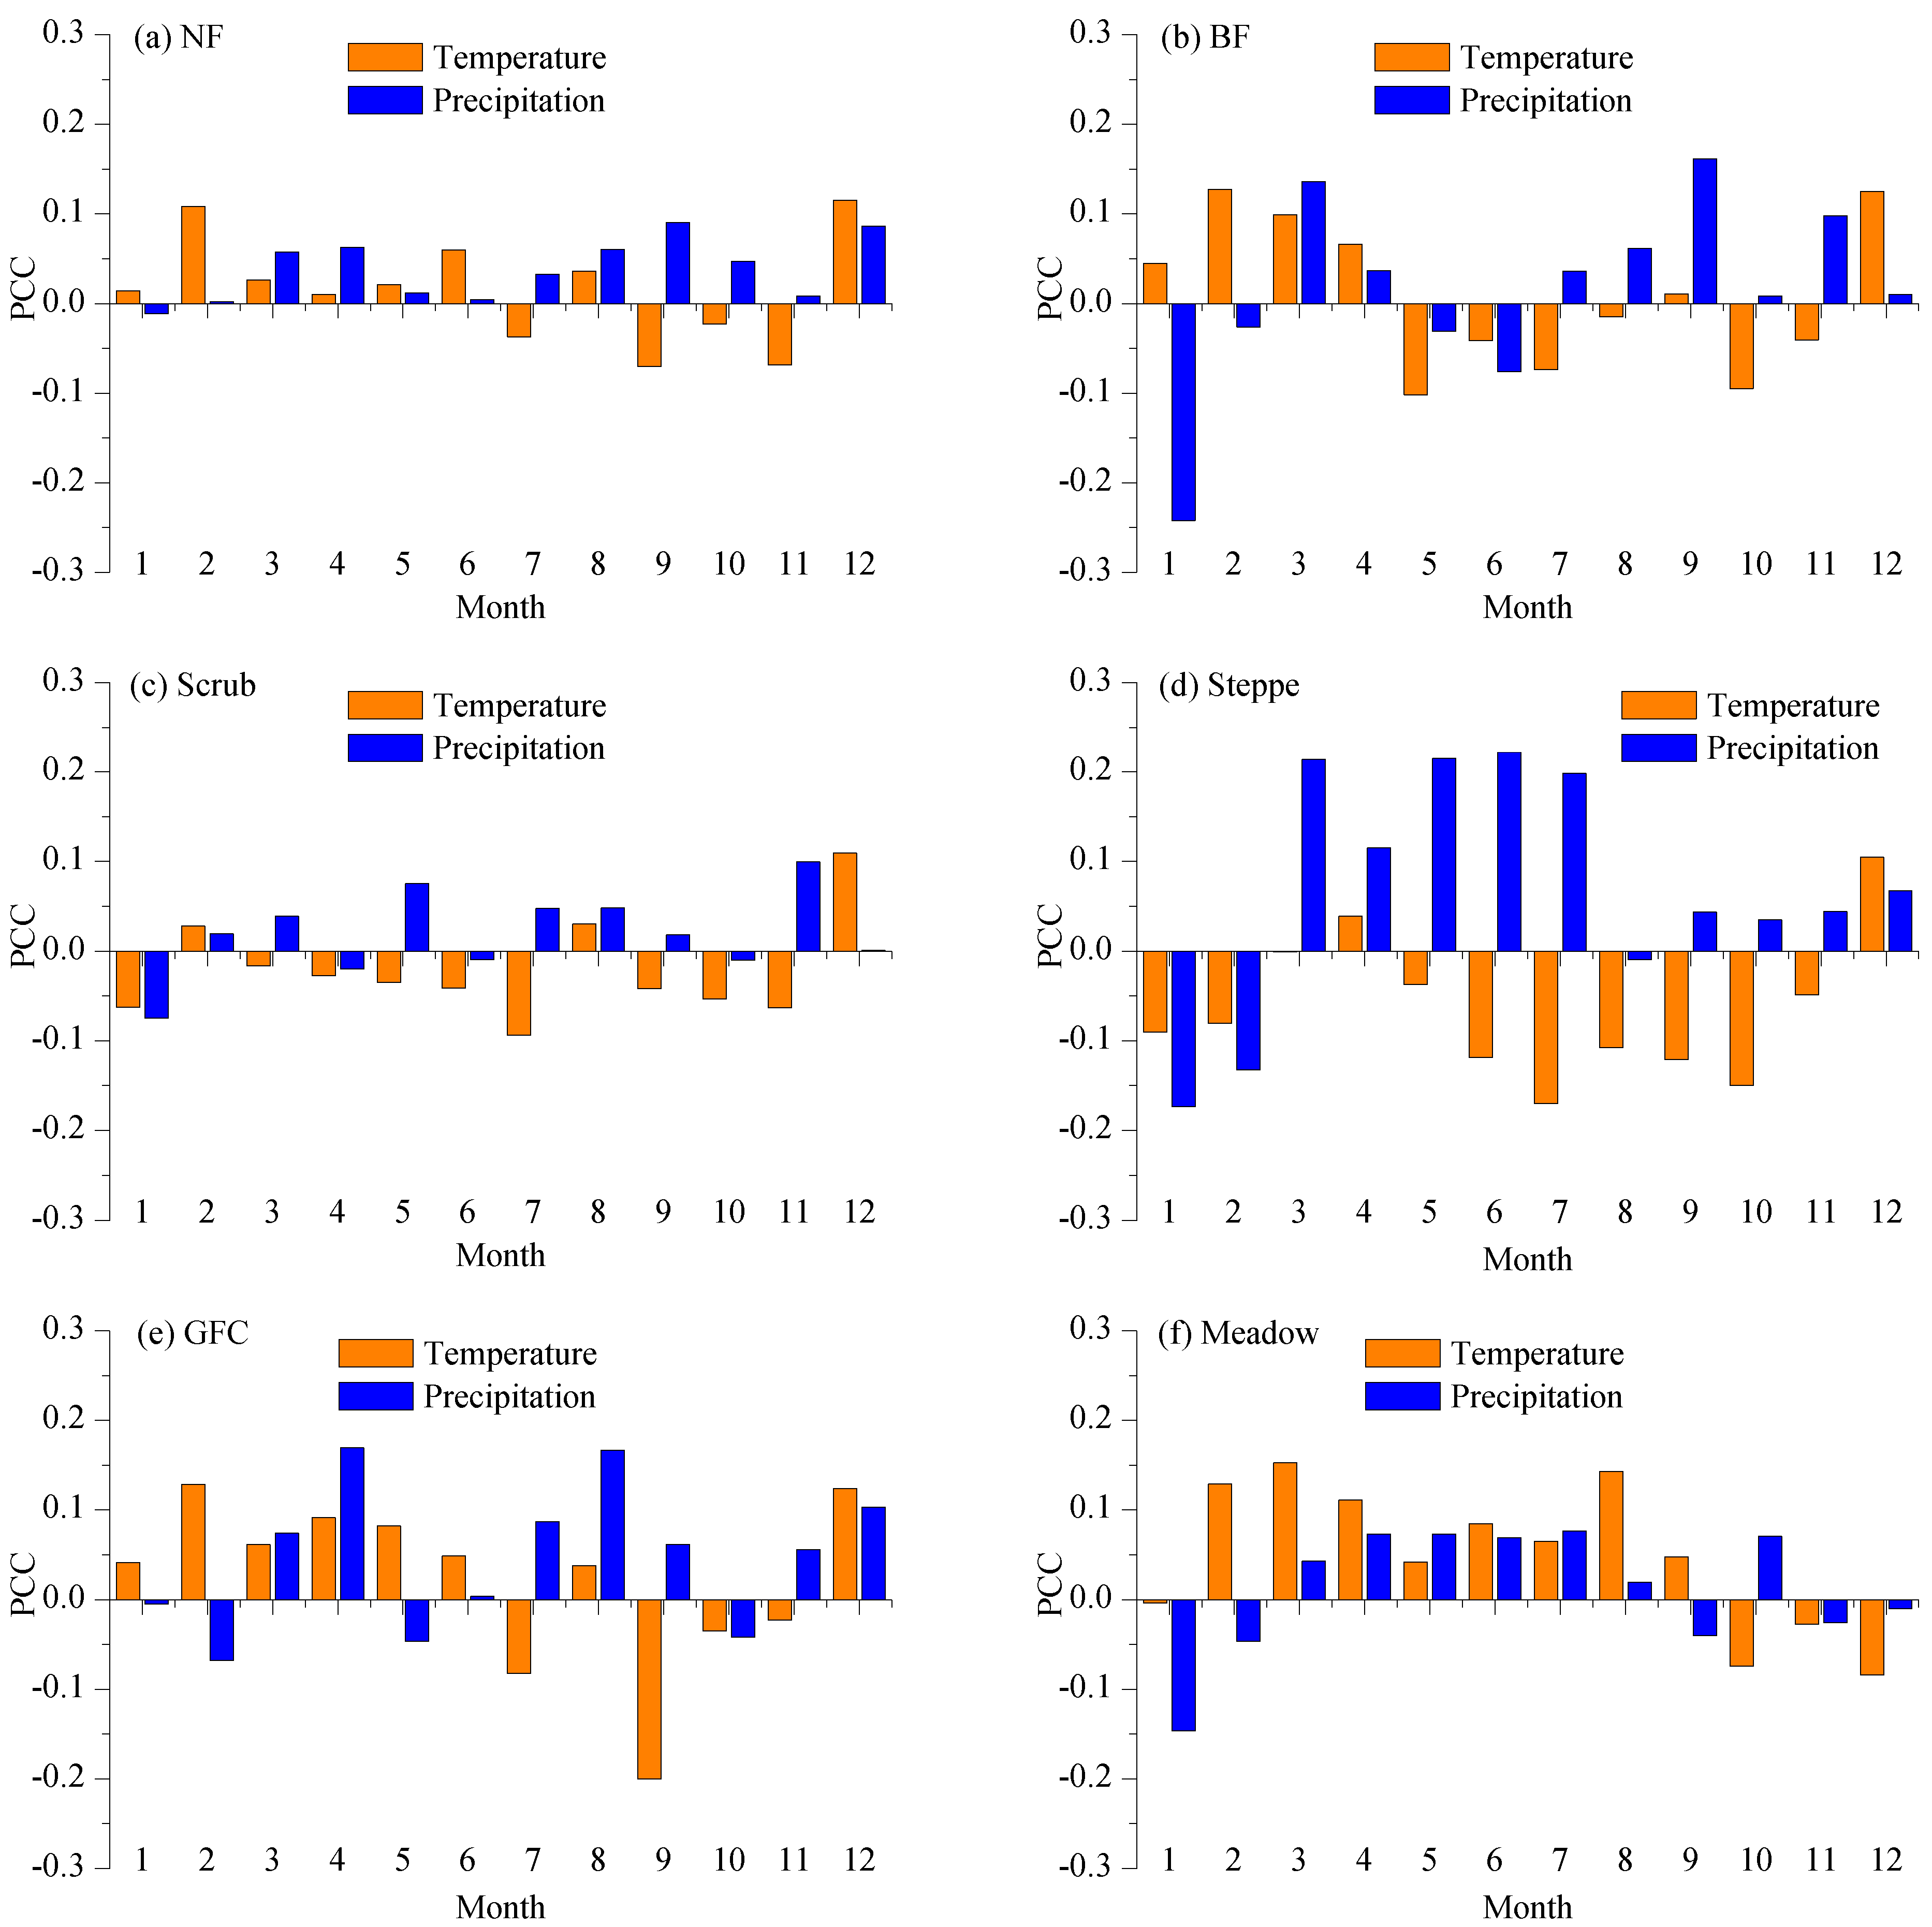
3.4. Correlation between Vegetation Dynamics and Climate Factors

Global climate change has changed the regional patterns of temperature and precipitation, thereby influencing vegetation growth [12]. In order to understand the driving forces that underlie vegetation dynamics, we analyzed the correlations between NDVI, temperature, and precipitation. The results showed that the cumulative precipitation in the growing season had a dominant effect on the vegetation dynamics compared with temperature for all six vegetation types, which agreed well with recent studies [37]. In addition, nonlinear responses of vegetation to climate factors were also detected in the relationships between NDVI, temperature, and precipitation (Figure 7). At the biome scale, clear differences were detected in the responses of vegetation growth to climate variability. For instance, 64.42% and 65.85% of the vegetation dynamics could be explained by precipitation in BF and scrub, respectively, which were higher than those for the other four biomes. In terms of temperature, the strongest correlation was found with NF with an R2 of 0.4626, whereas the other vegetation types all had weak correlations with temperature (Table 2).
Figure 6. Intensity of the vegetation dynamics for different vegetation types: (a) NF; (b) BF; (c) scrub; (d) steppe; (e) GFC; and (f) meadow.
Remotesensing 07 15517 g006
Figure 7. Correlations between NDVI, temperature (a), and precipitation (b) for six vegetation types. The solid black curve indicates the fitted curve for all available stations without consideration of vegetation types.
Remotesensing 07 15517 g007
Table 2. Correlations between NDVI, temperature, and precipitation for different vegetation types.
Vegetation TypesNDVI-TemperatureNDVI-Precipitation
Fitting ModelR2Fitting ModelR2
NFquadratic polynomial0.4626quadratic polynomial0.4598
BFquadratic polynomial0.3745logarithm0.6442
Scrubquadratic polynomial0.3368quadratic polynomial0.6585
Steppequadratic polynomial0.1143power function0.2627
GFCquadratic polynomial0.3797power function0.4388
Meadowquadratic polynomial0.1715power function0.3507
In addition to the correlation analysis described above, we further performed a partial correlation analysis between NDVI, temperature, and precipitation. The statistical analysis showed that the average partial correlation coefficients (PCCs) at the 569 meteorological stations between NDVI and temperature, and between NDVI and precipitation, during the study period were 0.08 and 0.18, respectively. Overall, the areas with positive PCCs between NDVI and temperature were distributed mainly in the northeast of China, the north of Xinjiang, the east of China, and most areas of Qinghai and Sichuan provinces. Areas with negative PCCs were located mainly in arid and semi-arid regions, such as Inner Mongolia, Tibet, and Shaanxi, Shanxi, and Xinjiang provinces. Areas with positive PCCs between NDVI and precipitation were concentrated mainly in Inner Mongolia, Gansu, Shanxi, Xinjiang, and the northeast of China because these are mainly arid and semi-arid regions where the soil moisture is a critical factor that affects vegetation growth (Supplementary Figure S2).
On a monthly scale, positive PCCs between NDVI and temperature were obtained mainly during the winter and spring, and negative PCCs were found mainly in summer and autumn. This may be related to the relatively low temperature during the winter and spring because temperature is the dominant limiting factor for vegetation growth, whereas the temperature is more favorable for vegetation growth during the summer and autumn, when other climate factors such as precipitation and solar radiation are the main limiting factors. Furthermore, the maximum PCC during the entire year was extracted for every meteorological station (Supplementary Figure S3), where the values for 198 and 170 stations, which accounted for 34.8% and 29.9% of the total, were found to be dominant in the spring and winter, respectively, thereby demonstrating that the spring and winter temperatures have the main effects on growing season vegetation. By contrast, there was a positive PCC between NDVI and precipitation during March to December, where the highest values occurred between March and September, which is consistent with the growing season (Supplementary Figure S3). We found that 179 and 159 stations, which accounted for 31.5% and 27.9% of the total, were dominant during the spring and summer, respectively, thereby demonstrating that precipitation during the growing season has an important effect on vegetation growth. Thus, it can be concluded that the temperature and precipitation during the spring are the principal factors that influence vegetation growth in China.
For different vegetation types, the PCCs between the growing season NDVI and monthly accumulative precipitation were higher than those between the growing season NDVI and monthly mean temperature, especially during the growing season, which was consistent with the conclusions based on the annual scale analysis in Figure 7. However, different vegetation types also had various relationships among vegetation and climatic factors. Overall, the correlation between NDVI and climate factor in NF and scrub was lower than that for the other vegetation types. For NF, the correlation between NDVI and precipitation exhibited an increasing trend (Figure 8a). The steppe type had a high positive correlation between NDVI and precipitation in spring and summer, and a negative correlation between NDVI and temperature in summer and autumn (Figure 8d). The PCCs for the meadow type between NDVI and temperature and between NDVI and precipitation were mostly positive during the growing season, but the PCC between NDVI and temperature was higher than that between NDVI and precipitation (Figure 8f).

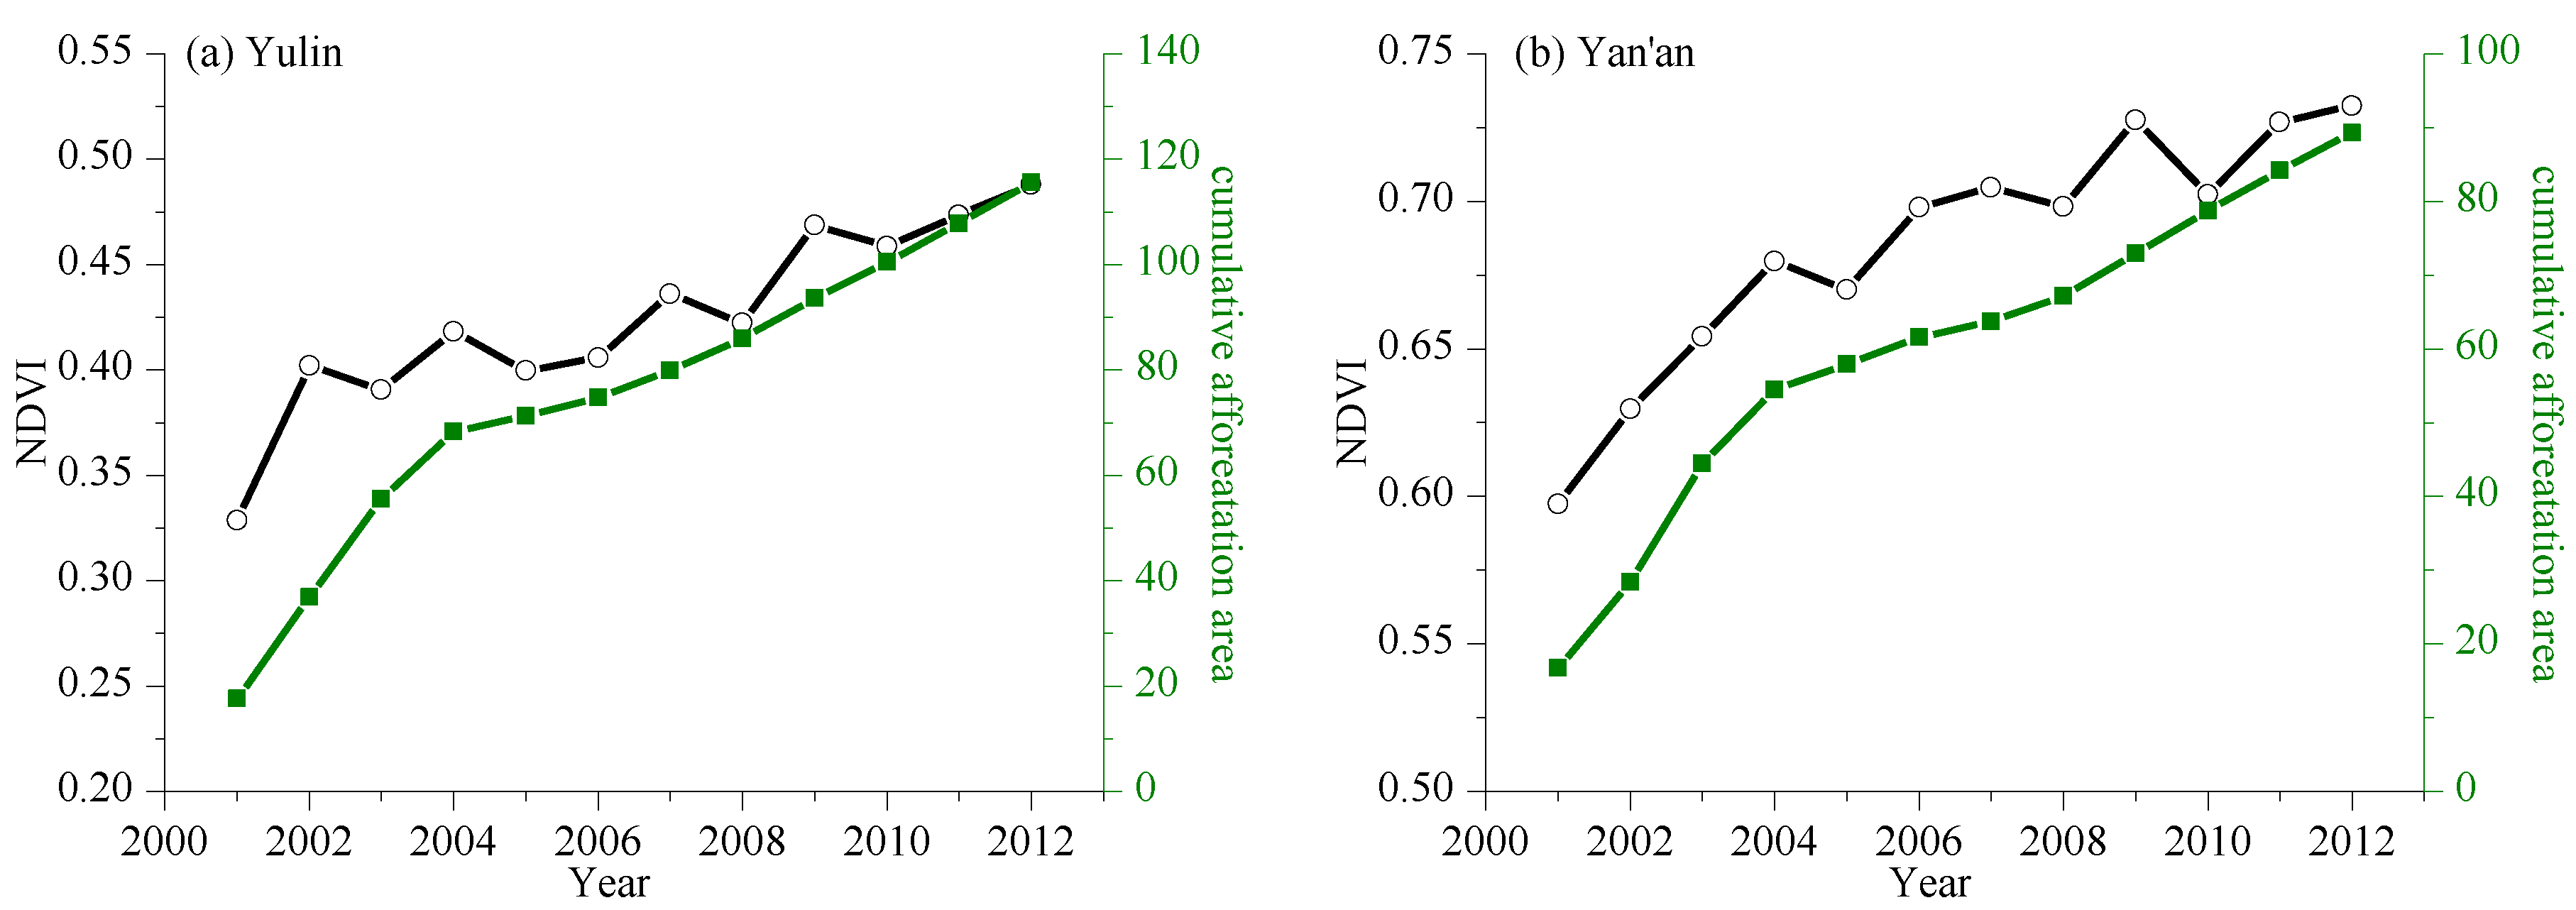
3.5. Role of Ecological Restoration in Vegetation Dynamics

In addition to the influence of climate change on vegetation, ecological restoration programs have also been major driving forces in China, especially since 2000. The Chinese Government has made great efforts towards protection and ecological construction, and several ecological restoration projects have been implemented, including the Three-North Shelter Forest Program (TNSFP), the Natural Forest Protection Program (NFPP), and the Grain for Green Program (GGP), to combat water loss and soil erosion, thereby facilitating ecosystem recovery from a degraded situations [28,29,38]. In this section, we focused on the role of ecological restoration in vegetation dynamics during recent decades.
The TNSFP is the largest ecological afforestation program in the world. It has made great achievements since its initiation in 1978 and will continue for 75 years until 2050 [39]. Many research and assessment efforts linked to the TNSFP have focused on vegetation dynamics, and previous studies has reported that vegetation have greatly improved in the TNSFP region, while it varied dramatically outside the TNSFP region during 1981–1998 [40], indicating a positive effect of the TNSFP on vegetation growth. Meanwhile, regional study results also showed a substantial forest increase in Yulin district from 1974 to 2010 [41]. According to the latest national forest inventory, China’s forest area increased by about 3.1 × 10⁵ km2 from the early 1980s (1977–1981) until the early 2000s (2004–2008) [42]. A long-term investigation of vegetation dynamics in the TNSFP region based on the AVHRR NDVI3g dataset showed that the overall state of vegetation in the study region has improved over the past three decades [43]. It should be noted that although extensive studies have documented the positive influence of the TNSFP, decadal evolution characteristics regarding the effect of the TNSFP on vegetation coverage are still unclear and need further investigation.
Figure 8. Partial correlation coefficients for the six vegetation types between NDVI and climate factors: (a) NF; (b) BF; (c) scrub; (d) steppe; (e) GFC; and (f) meadow.
Remotesensing 07 15517 g008
Besides the TNSFP, another large-scale ecological restoration program, NFPP, was launched by the Chinese Government in 1998. The purpose of the NFPP is to reduce timber harvestings, conserve natural forests, and increase afforestation via mountain closure, aerial seeding, and artificial planting [39]. In recent years, there have been increasing concerns regarding the effectiveness of the NFPP. For example, a recent study on vegetation dynamics in China during 2000–2010 assessed the effectiveness of the NFPP and concluded that the NFPP is a more effective ecological restoration program than TNSFP and the Nature Reserves [29], highlighting the important role of the NFPP in ecological protection and restoration. Meanwhile, they also noted out that the effectiveness of the NFPP varies geographically, and thus attention must be paid to spatial heterogeneity during implementation of large-scale ecological restoration efforts [29]. Unfortunately, the GGP, launched in 1999, was not included in the above analysis. It should be noted that the GGP has contributed considerably to vegetation greening in north China. Therefore, the effect of the GGP on vegetation dynamics was primarily investigated in the current study.
In general, the NDVI is higher in forest areas than on cropland or bare land, and thus the increased forest area may have contributed to the satellite-observed greening of vegetation throughout China in recent decades [44]. Moreover, our statistical analyses detected a strong correlation between the cumulative afforestation areas measured by the GGP and NDVI during the study period (Supplementary Figure S4), thereby suggesting that GGP plays a key role in vegetation greening. This was also supported by regional statistics that showed that vegetation changes tended to be significantly correlated with cumulative afforestation areas in the pilot regions for ecological restoration (Figure 9). It is worth noting that although significant increases in NDVI were detected in many regions, such as Yulin and Yan’an, because of widespread ecological restoration in these regions, a fluctuation was observed during 2003–2005 after a sharp increase between 2001 and 2002. This phenomenon was discussed in a previous study, and it was primarily attributed to the widespread die-off of trees, such as sea buckthorn, because of a water supply deficit [45]. These findings emphasize the importance of selecting suitable trees for the local environment when designing programs. In addition, there is a time-lag effect of afforestation on vegetation greening.
It should be noted that large-scale afforestation has improved the regional ecological environment, but it has also considerably affected biogeographical processes between the land ecosystem and atmospheric system via energy, water, or element cycles. The feedback between land cover change and regional climate has attracted much attention in recent studies on regional climate variability caused by afforestation [46], and conclusions vary at regional to global scales. Understanding the interactions between the land and atmosphere can facilitate sustainable development of the ecological environment.
Figure 9. Correlations between NDVI and cumulative afforestation in Yulin (a) and Yan’an (b).
Remotesensing 07 15517 g009

3.6. Uncertainty

It should be noted that several uncertainties remain in our study. First, reliable datasets are fundamental to understanding variations in vegetation growth due to climate change and ecological restoration. However, satellite datasets are often subject to retrieval and sensor uncertainties, which are often unquantified [47]. Multisensor NDVI datasets have been used widely in local to global scale modeling and analysis [48], but the outcomes of these studies suggest that there is considerable bias in multisensor NDVI records [48,49]. In our study, we employed MODIS NDVI to investigate the vegetation dynamics throughout China. We captured more spatial details of the vegetation dynamics and concluded that the overall trend has improved in China, which is consistent with a previous study [29]. Although the more recent NDVI dataset from Terra MODIS is considered an improvement over GIMMS NDVI [27], multi-dataset analysis allows more robust conclusions to be drawn. Second, the response of a certain vegetation type to climate factors may vary from region to region across China, but we considered them as a whole when analyzing the correlation between different vegetation types and climate factors. Thus, more details may be revealed by performing this experiment in different regions. Third, we analyzed the driving forces of vegetation dynamics by climate change and ecological restoration, but the specific contributions of each remain unclear. Additional experiments are still needed. Nevertheless, although the aforementioned drawbacks exist in our study, our findings are still valuable for understanding changes in growing season vegetation as well as different vegetation types.

4. Conclusions

In this study, we combined satellite-derived NDVI with climate factors to explore the spatiotemporal patterns in vegetation change during the growing season, as well as their driving forces in China from 2001 to 2012. Our results showed that the growing season NDVI increased continuously during 2001–2012. In north China, the NDVI mainly exhibited an increasing spatial trend, whereas a decreasing trend was dominant in south China. In addition, the vegetation dynamics were mainly of a moderate intensity in the increasing and decreasing areas. The significantly increasing trend in the NDVI in the arid and semi-arid areas of northwest China was attributed mainly to the increasing trend in the NDVI during the spring, but there was an increasing trend in the NDVI during the summer and autumn in the north and northeast of China. There were considerable differences in the trends for different vegetation types, where GFC had the highest linear trend of 2%/10 years (p < 0.05), followed by meadow, and NF had the lowest increasing trend. Our results also suggested that the cumulative precipitation in the growing season had a dominant effect on the vegetation dynamics compared with temperature for all six vegetation types. The response of different vegetation types to climate variability also differed considerably. In terms of anthropological activity, our statistical analyses demonstrated that there was a strong correlation between the cumulative afforestation area and NDVI during the study period, especially in the pilot regions for ecological restoration, thereby suggesting that ecological restoration programs have been important for ecological recovery throughout China in recent decade.

Supplementary Files

Supplementary File 1

Acknowledgments

This study is financially supported by the “High-resolution Earth Observation System” project of China and the National Natural Science Foundation for the Youth (Grant No. 41401479).

Author Contributions

Xianfeng Liu and Xiufang Zhu designed the research; Xianfeng Liu performed the research; Xianfeng Liu, Xiufang Zhu, Shuangshuang Li, Yanxu Liu and Yaozhong Pan analyzed the data; and Xianfeng Liu and Xiufang Zhu wrote the paper.

Conflicts of Interest

The authors declare no conflict of interest.

References

  1. Krishnaswamy, J.; John, R.; Joseph, S. Consistent response of vegetation dynamics to recent climate change in tropical mountain regions. Glob. Chang. Biol. 2014, 1, 203–215. [Google Scholar] [CrossRef] [PubMed]
  2. Zhou, L.; Tian, Y.; Myneni, R.B.; Ciais, P.; Saatchi, S.; Liu, Y.Y.; Piao, S.; Chen, H.; Vermote, E.F.; Song, C. Widespread decline of Congo rainforest greenness in the past decade. Nature 2014, 509, 86–90. [Google Scholar] [CrossRef] [PubMed]
  3. Zhang, Y.; Gao, J.; Liu, L.; Wang, Z.; Ding, M.; Yang, X. NDVI-based vegetation changes and their responses to climate change from 1982 to 2011: A case study in the Koshi River Basin in the middle Himalayas. Glob. Planet Chang. 2013, 108, 139–148. [Google Scholar] [CrossRef]
  4. Piao, S.; Wang, X.; Ciais, P.; Zhu, B.; Wang, T.; Liu, J. Changes in satellite-derived vegetation growth trend in temperate and boreal Eurasia from 1982 to 2006. Glob. Chang. Biol. 2011, 10, 3228–3239. [Google Scholar] [CrossRef]
  5. Solomon, S.; Qin, D.; Manning, M.; Chen, Z.; Marquis, M.; Averyt, K.B.; Tignor, M.; Miller, H.L. Contribution of working group I to the fourth assessment report of the intergovernmental panel on climate change. In Climate Change 2007: The Physical Science Basis; Cambridge University Press: Cambridge, UK, 2007; p. 996. [Google Scholar]
  6. Barichivich, J.; Briffa, K R.; Myneni, R B.; Osborn, T J.; Melvin, T M.; Ciais, P.; Piao, S.; Tucker, C. Large-scale variations in the vegetation growing season and annual cycle of atmospheric CO2 at high northern latitudes from 1950 to 2011. Glob. Chang. Biol. 2013, 10, 3167–3183. [Google Scholar] [CrossRef] [PubMed]
  7. Macias-Fauria, M.; Forbes, B.C.; Zetterberg, P.; Kumpula, T. Eurasian Arctic greening reveals teleconnections and the potential for structurally novel ecosystems. Nat. Clim. Chang. 2012, 8, 613–618. [Google Scholar] [CrossRef] [Green Version]
  8. Parmesan, C. Ecological and evolutionary responses to recent climate change. Annu. Rev. Ecol. Evol. S 2006, 37, 637–669. [Google Scholar] [CrossRef]
  9. Piao, S.; Friedlingstein, P.; Ciais, P.; Zhou, L.; Chen, A. Effect of climate and CO2 changes on the greening of the Northern Hemisphere over the past two decades. Geophys. Res. Lett. 2006, 23. [Google Scholar] [CrossRef]
  10. Walther, G.; Post, E.; Convey, P.; Menzel, A.; Parmesan, C.; Beebee, T.J.; Fromentin, J.; Hoegh-Guldberg, O.; Bairlein, F. Ecological responses to recent climate change. Nature 2002, 416, 389–395. [Google Scholar] [CrossRef] [PubMed]
  11. Bi, J.; Xu, L.; Samanta, A.; Zhu, Z.; Myneni, R. Divergent Arctic-Boreal Vegetation Changes between North America and Eurasia over the Past 30 Years. Remote Sens. 2013, 5, 2093–2112. [Google Scholar] [CrossRef]
  12. Liu, X.; Pan, Y.; Zhu, X.; Li, S. Spatiotemporal variation of vegetation coverage in Qinling-Daba Mountains in relation to environmental factors. Acta Geogr. Sin. 2015, 5, 705–716. (In Chinese) [Google Scholar]
  13. Huang, M.; Piao, S.; Sun, Y.; Ciais, P.; Cheng, L.; Mao, J.; Poulter, B.; Shi, X.; Zeng, Z.; Wang, Y. Change in terrestrial ecosystem water–use efficiency over the last three decades. Glob. Chang. Biol. 2015, 6, 2366–2378. [Google Scholar] [CrossRef] [PubMed]
  14. Piao, S.; Yin, G.; Tan, J.; Cheng, L.; Huang, M.; Li, Y.; Liu, R.; Mao, J.; Myneni, R.B.; Peng, S. Detection and attribution of vegetation greening trend in China over the last 30 years. Glob. Chang. Biol. 2015, 4, 1601–1609. [Google Scholar] [CrossRef] [PubMed]
  15. Horion, S.; Cornet, Y.; Erpicum, M.; Tychon, B. Studying interactions between climate variability and vegetation dynamic using a phenology based approach. Int. J. Appl. Earth Obs. 2013, 20, 20–32. [Google Scholar] [CrossRef]
  16. Goetz, S.J.; Bunn, A.G.; Fiske, G.J.; Houghton, R.A. Satellite-observed photosynthetic trends across boreal North America associated with climate and fire disturbance. Proc. Natl. Acad. Sci. USA 2005, 38, 13521–13525. [Google Scholar] [CrossRef] [PubMed]
  17. Mohammat, A.; Wang, X.; Xu, X.; Peng, L.; Yang, Y.; Zhang, X.; Myneni, R.B.; Piao, S. Drought and spring cooling induced recent decrease in vegetation growth in Inner Asia. Agr. Forest Meteorol. 2013, 178–179, 21–30. [Google Scholar] [CrossRef]
  18. Myneni, R.B.; Tucker, C.J.; Asrar, G.; Keeling, C.D. Interannual variations in satellite-sensed vegetation index data. J. Geophys. Res. 1998, D6, 6145–6160. [Google Scholar] [CrossRef]
  19. Piao, S.; Nan, H.; Huntingford, C.; Ciais, P.; Friedlingstein, P.; Sitch, S.; Peng, S.; Ahlström, A.; Canadell, J.G.; Cong, N. Evidence for a weakening relationship between interannual temperature variability and northern vegetation activity. Nat. Commun. 2014, 5. [Google Scholar] [CrossRef] [PubMed] [Green Version]
  20. Committee, N.A.R.O. Second National Assessment Report on Climate Change; Science Press: Beijing, China, 2011. [Google Scholar]
  21. Wang, W.; Wang, W.; Li, J.; Wu, H.; Xu, C.; Liu, T. The impact of sustained drought on vegetation ecosystem in Southwest China based on remote sensing. Proc. Environ. Sci. 2010, 2, 1679–1691. [Google Scholar] [CrossRef]
  22. Liu, Y.; Lei, H. Responses of natural vegetation dynamics to climate drivers in China from 1982 to 2011. Remote Sens. 2015, 8, 10243–10268. [Google Scholar] [CrossRef]
  23. Yuan, X.; Li, L.; Chen, X.; Shi, H. Effects of precipitation intensity and temperature on NDVI-based grass change over Northern China during the period from 1982 to 2011. Remote Sens. 2015, 8, 10164–10183. [Google Scholar] [CrossRef]
  24. Yi, C.; Pendall, E.; Ciais, P. Focus on extreme events and the carbon cycle. Environ. Res. Lett. 2015, 7, 70201–70208. [Google Scholar] [CrossRef]
  25. Ciais, P.; Reichstein, M.; Viovy, N.; Granier, A.; Ogée, J.; Allard, V.; Aubinet, M.; Buchmann, N.; Bernhofer, C.; Carrara, A.; et al. Europe-wide reduction in primary productivity caused by the heat and drought in 2003. Nature 2005, 437, 529–533. [Google Scholar] [CrossRef] [PubMed]
  26. Zhao, M.; Running, S.W. Drought-induced reduction in global terrestrial net primary production from 2000 through 2009. Science 2010, 329, 940–943. [Google Scholar] [CrossRef] [PubMed]
  27. Tucker, C.J.; Pinzon, J.E.; Brown, M.E.; Slayback, D.A.; Pak, E.W.; Mahoney, R.; Vermote, E.F.; El Saleous, N. An extended AVHRR 8-km NDVI dataset compatible with MODIS and SPOT vegetation NDVI data. Int. J. Remote Sens. 2005, 20, 4485–4498. [Google Scholar] [CrossRef]
  28. Xiao, J. Satellite evidence for significant biophysical consequences of the “Grain for Green” Program on the Loess Plateau in China. J. Geophys. Res. 2014, 12, 2261–2275. [Google Scholar] [CrossRef]
  29. Lü, Y.; Zhang, L.; Feng, X.; Zeng, Y.; Fu, B.; Yao, X.; Li, J.; Wu, B. Recent ecological transitions in China: Greening, browning, and influential factors. Sci. Rep. 2015, 5. [Google Scholar] [CrossRef] [PubMed]
  30. Xiao, J.; Sun, G.; Chen, J.; Chen, H.; Chen, S.; Dong, G.; Gao, S.; Guo, H.; Guo, J.; Han, S. Carbon fluxes, evapotranspiration, and water use efficiency of terrestrial ecosystems in China. Agric. Forest Meteorol. 2013, 182, 76–90. [Google Scholar] [CrossRef]
  31. Hou, X. Vegetation Atlas of China; Chinese Academy of Science; The Editorial Board of Vegetation Map of China; Scientific Press: Beijing, China, 2001. (In Chinese) [Google Scholar]
  32. Stow, D.; Daeschner, S.; Hope, A.; Douglas, D.; Petersen, A.; Myneni, R.; Zhou, L.; Oechel, W. Variability of the seasonally integrated normalized difference vegetation index across the north slope of Alaska in the 1990s. Int. J. Remote Sens. 2003, 5, 1111–1117. [Google Scholar] [CrossRef]
  33. Liu, X.; Zhang, J.; Zhu, X.; Pan, Y.; Liu, Y.; Zhang, D.; Lin, Z. Spatiotemporal changes in vegetation coverage and its driving factors in the Three-River Headwaters Region during 2000–2011. J. Geogr. Sci. 2014, 2, 288–302. [Google Scholar] [CrossRef]
  34. Lotsch, A. Response of terrestrial ecosystems to recent Northern Hemispheric drought. Geophys. Res. Lett. 2005, 6. [Google Scholar] [CrossRef]
  35. Xu, X.; Piao, S.; Wang, X.; Chen, A.; Ciais, P.; Myneni, R.B. Spatio-Temporal Patterns of the Area Experiencing Negative Vegetation Growth Anomalies in China over the Last Three Decades. Available online: http://0-iopscience-iop-org.brum.beds.ac.uk/article/10.1088/1748-9326/7/3/035701/meta;jsessionid=944705D6F373D847E393AB49E834ABB3.c1.iopscience.cld.iop.org#top (accessed on 13 November 2015).
  36. Xu, J. Mathematical Method in Modern Geography, 2nd ed.; Higher Education Press: Beijing, China, 2002. (In Chinese) [Google Scholar]
  37. Liang, W.; Yang, Y.; Fan, D.; Guan, H.; Zhang, T.; Long, D.; Zhou, Y.; Bai, D. Analysis of spatial and temporal patterns of net primary production and their climate controls in China from 1982 to 2010. Agric. Forest Meteorol. 2015, 204, 22–36. [Google Scholar] [CrossRef]
  38. Ouyang, Z.; Wang, Q.; Zheng, H.; Zhang, F.; Hou, P. National ecosystem survey and assessment of China (2000–2010). Bull. Chin. Acad. Sci. 2014, 29, 462–466. (In Chinese) [Google Scholar]
  39. Yin, R. An Integrated Assessment of China’s Ecological Restoration Programs; Springer: Dordrecht, The Netherlands, 2009. [Google Scholar]
  40. Tan, M.; Li, X. Does the Green Great Wall effectively decrease dust storm intensity in China? A study based on NOAA NDVI and weather station data. Land Use Policy 2015, 43, 42–47. [Google Scholar] [CrossRef]
  41. Liu, L.; Tang, H.; Caccetta, P.; Lehmann, E.; Hu, Y.; Wu, X. Mapping afforestation and deforestation from 1974 to 2012 using Landsat time-series stacks in Yulin District, a key region of the Three-North Shelter region, China. Environ. Monit. Assess. 2013, 185, 9949–9965. [Google Scholar] [CrossRef] [PubMed]
  42. Guo, Z.; Hu, H.; Li, P.; Li, N.; Fang, J. Spatio-temporal changes in biomass carbon sinks in China’s forests from 1977 to 2008. Sci. China Life Sci. 2013, 7, 661–671. [Google Scholar] [CrossRef] [PubMed]
  43. He, B.; Chen, A.; Wang, H.; Wang, Q. Dynamic response of Satellite-Derived vegetation growth to climate change in the three north shelter forest region in china. Remote Sens. 2015, 7, 9998–10016. [Google Scholar] [CrossRef]
  44. Pan, Y.; Birdsey, R.A.; Fang, J.; Houghton, R.; Kauppi, P.E.; Kurz, W.A.; Phillips, O.L.; Shvidenko, A.; Lewis, S.L.; Canadell, J.G. A large and persistent carbon sink in the world’s forests. Science 2011, 333, 988–993. [Google Scholar] [CrossRef] [PubMed]
  45. Bai, J.; Bai, J.; Wang, L. Spatiotemporal change of vegetation NDVI and Its Relations with Regional Climate in Northern Shaanxi Province in 2000–2010. Sci. Geogr. Sin. 2014, 7, 882–888. (In Chinese) [Google Scholar]
  46. Peng, S.; Piao, S.; Zeng, Z.; Ciais, P.; Zhou, L.; Li, L.Z.; Myneni, R.B.; Yin, Y.; Zeng, H. Afforestation in China cools local land surface temperature. Proc. Natl. Acad. Sci. USA 2014, 8, 2915–2919. [Google Scholar] [CrossRef] [PubMed] [Green Version]
  47. Mehran, A.; AghaKouchak, A. Capabilities of satellite precipitation datasets to estimate heavy precipitation rates at different temporal accumulations. Hydrol. Process 2014, 4, 2262–2270. [Google Scholar] [CrossRef]
  48. Tarnavsky, E.; Garrigues, S.; Brown, M.E. Multiscale geostatistical analysis of AVHRR, SPOT-VGT, and MODIS global NDVI products. Remote Sens. Environ. 2008, 2, 535–549. [Google Scholar] [CrossRef]
  49. Fensholt, R.; Proud, S.R. Evaluation of Earth Observation based global long term vegetation trends—Comparing GIMMS and MODIS global NDVI time series. Remote Sens. Environ. 2012, 119, 131–147. [Google Scholar] [CrossRef]

