
Application of InSAR and Gravimetry for Land Subsidence Hazard Zoning in Aguascalientes, Mexico

 , and
, and
Abstract
:
1. Introduction

2. Methods
2.1. Identification of Factors Contributing to Subsidence Hazard
2.2. InSAR and Gravimetry for Determining Areas Having Subsidence Hazard Factors
3. Case Study: Subsidence Hazard Zoning of Aguascalientes, Mexico
3.1. Study Area

3.2. Determination of Deformable Sediment Distribution


3.3. Determination of the Subsidence-Affected Area

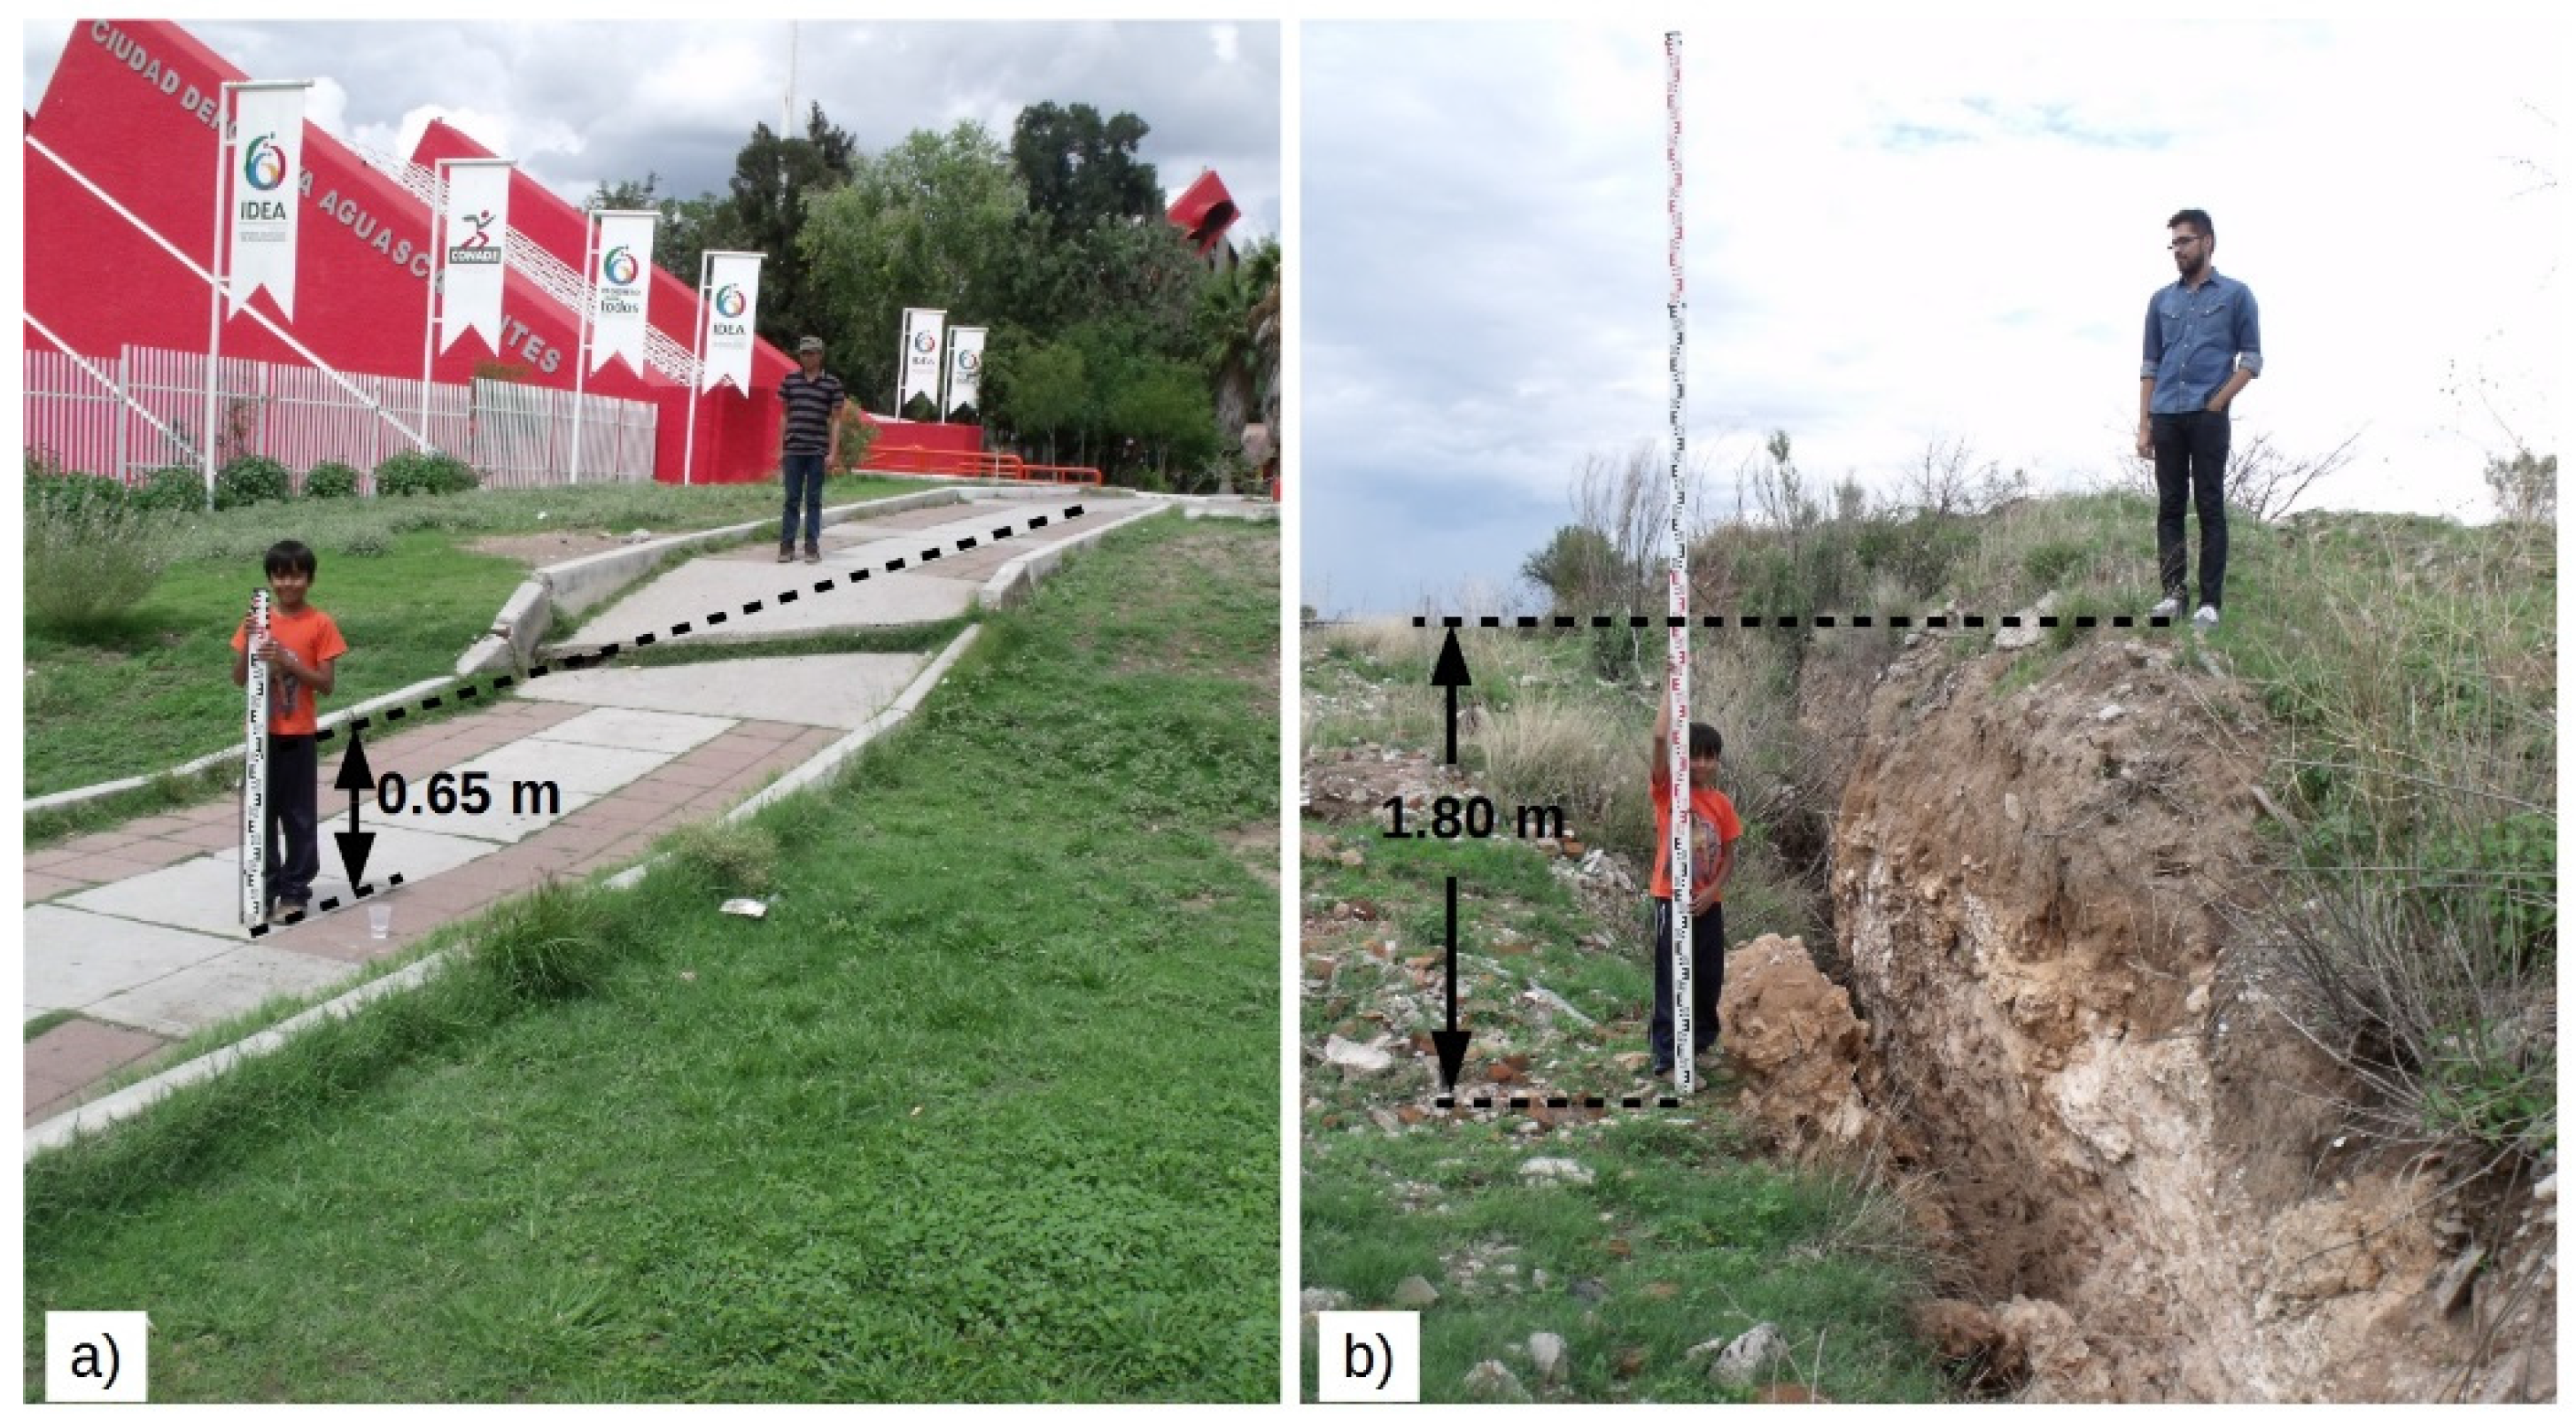
3.4. Surface Faults Mapping
4. Results
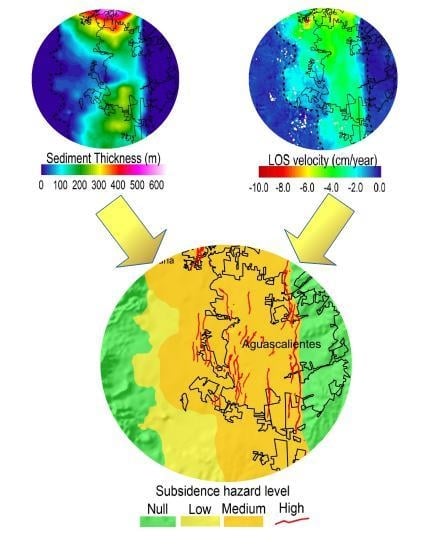
Subsidence Hazard Zoning


| Hazard Factors | Hazard Level | |||
|---|---|---|---|---|
| High | Medium | Low | Null | |
| Unconsolidated sediments existence | Yes | Yes | Yes | No |
| Subsidence detected by InSAR | Yes | Yes | No | No |
| Observed damages by subsidence-related surface faults | Yes | No | No | No |
5. Discussion
6. Conclusions
Acknowledgments
Author Contributions
Conflicts of Interest
References
- United Nations Development Programme (UNDP). Reducing Disaster Risk; United Nations Development Programme: New York, NY, USA, 2004. [Google Scholar]
- Peduzzi, P.; Dao, H.; Herold, C.; Mouton, F. Assessing global exposure and vulnerability towars natural hazards: The Disaster Risk Index. Nat. Hazards Earth Syst. Sci. 2009, 9, 1149–1159. [Google Scholar] [CrossRef]
- Zhang, A.; Gong, S.; Carbognin, L.; Johnson, A.I. Proceedings of the Seventh International Symposium on Land Subsidence, Shanghai, China, 23–28 October 2005; IAHS Press: Rotterdam, The Netherlands, 2005. Publication No. 234.
- Carreón-Freyre, D.; Cerca, M.; Galloway, D.L. Proceedings of the Eighth International Symposium on Land Subsidence, Querétaro, Mexico, 17–22 October 2010; IAHS Press: Wallingford, UK, 2010. Publication No. 339.
- Ovando-Shelley, E.; Ossa, A.; Santoyo, E. Effects of regional subsidence and earthquakes on architectural monuments in Mexico City. Bol. Soc. Geol. Mex. 2013, 65, 157–167. [Google Scholar]
- López-Alvarez, B.; Ramos-Leal, J.A.; Santacruz-De-León, G.; Morán-Ramírez, J.; Carranco-Lozada, S.E.; Noyola-Medrano, C. Subsidence associated with land use changes in urban aquifers with intensive extraction. Nat. Sci. 2013, 5, 291–295. [Google Scholar] [CrossRef]
- Pacheco-Martínez, J.; Hernandez-Marín, M.; Burbey, T.J.; González-Cervantes, N.; Ortíz-Lozano, J.Á.; Zermeño-de-Leon, M.E.; Solís-Pinto, A. Land subsidence and ground failure associated to groundwater exploitation in the Aguascalientes Valley, Mexico. Eng. Geol. 2013, 164, 172–186. [Google Scholar] [CrossRef]
- Aranda-Gómez, J.J.; Levresse, G.; Pacheco-Martínez, J.; Ramos-Leal, J.A.; Carrasco-Núñez, G.; Chacón-Baca, E.; González-Naranjo, G.; Chávez-Cabello, G.; Vega-González, M.; Origel-Gutierrez, G.; et al. Active subsidence at the bottom of a recently desiccated crater-lake (Guanajuato, Mexico) and its probable relation with subsidence faults at Salamanca and Celaya. Bol. Soc. Geol. Mex. 2013, 65, 169–188. [Google Scholar]
- Holzer, T.; Johnson, A.I. Land subsidence caused by ground water withdrawal in urban areas. GeoJournal 1985, 11, 245–255. [Google Scholar] [CrossRef]
- Feng, Q.; Liu, G.; Meng, L.; Fu, E.; Zhang, H.; Zhang, K. Land subsidence induced by groundwater extraction and building damage level assessment—A case study of Datun, China. J. China Univ. Min. Technol. 2008, 18, 556–560. [Google Scholar] [CrossRef]
- Chaussard, E.; Wdowinski, S.; Cabral-Cano, E.; Amelung, F. Land subsidence in central Mexico detected by ALOS InSAR time-series. Remote Sens. Environ. 2014, 140, 94–106. [Google Scholar] [CrossRef]
- Osmanoğlu, B.; Dixon, T.H.; Wdowinski, S.; Cabral-Cano, E.; Jiang, Y. Mexico City subsidence observed with persistent scatterer InSAR. Int. J. Appl. Earth Obs. Geoinf. 2011, 13, 1–12. [Google Scholar] [CrossRef]
- Cigna, F.; Osmanoğlu, B.; Cabral-Cano, E.; Dixon, T.H.; Ávila-Olivera, J.A.; Garduño-Monroy, V.H.; DeMets, C.; Wdowinski, S. Monitoring land subsidence and its induced geological hazard with Synthetic Aperture Radar Interferometry: A case study in Morelia, Mexico. Remote Sens. Urban Environ. 2012, 117, 146–161. [Google Scholar] [CrossRef]
- Cabral-Cano, E.; Dixon, T.H.; Miralles-Wilhelm, F.; Díaz-Molina, O.; Sánchez-Zamora, O.; Carande, R.E. Space geodetic imaging of rapid ground subsidence in Mexico City. Geol. Soc. Am. Bull. 2008, 120, 1556–1566. [Google Scholar] [CrossRef]
- Cabral-Cano, E.; Osmanoglu, B.; Dixon, T.; Wdowinski, S.; Demets, C.; Cigna, F.; Díaz-Molina, O. Subsidence and fault hazard maps using PSI and permanent GPS networks in central Mexico. In Proceedings of the Eighth International Symposium on Land Subsidence, Querétaro, Mexico, 17–22 October 2010; Carreón-Freyre, D., Cerca, M., Galloway, D., Eds.; IAHS Press: Wallingford, UK, 2010; pp. 255–259, Publication No. 339. [Google Scholar]
- Hoffmann, J.; Zebker, H.A.; Galloway, D.L.; Amelung, F. Seasonal subsidence and rebound in Las Vegas Valley, Nevada, observed by Synthetic Aperture Radar Interferometry. Water Resour. Res. 2001, 37, 1551–1566. [Google Scholar] [CrossRef]
- Amelung, F.; Galloway, D.L.; Bell, J.W.; Zebker, H.A.; Laczniac, R.J. Sensing the ups and downs of Las Vegas: InSAR revelas structural control of land subsidence and aquifer-system deformation. Geology 1999, 27, 483–486. [Google Scholar] [CrossRef]
- Raspini, F.; Loupasakis, C.; Rozos, D.; Adam, N.; Moretti, S. Ground subsidence phenomena in the Delta municipality region (Northern Greece): Geotechnical modeling and validation with Persistent Scatterer Interferometry. Int. J. Appl. Earth Obs. Geoinf. 2014, 28, 78–89. [Google Scholar] [CrossRef]
- Hung, W.-C.; Hwang, C.; Liou, J.-C.; Lin, Y.-S.; Yang, H.-L. Modeling aquifer-system compaction and predicting land subsidence in central Taiwan. Eng. Geol. 2012, 147–148, 78–90. [Google Scholar] [CrossRef]
- Hernández-Marín, M.; Burbey, T. Controls on initiation and propagation of pumping-induced earth fissures: Insights from numerical simulations. Hydrogeol. J. 2010, 18, 1773–1785. [Google Scholar] [CrossRef]
- Ortiz-Zamora, D.; Ortega-Guerrero, A. Evolution of long-term land subsidence near Mexico City: Review, field investigations, and predictive simulations. Water Resour. Res. 2010, 46, W01513. [Google Scholar] [CrossRef]
- Kihm, J.-H.; Kim, J.-M.; Song, S.-H.; Lee, G.-S. Three-dimensional numerical simulation of fully coupled groundwater flow and land deformation due to groundwater pumping in an unsaturated fluvial aquifer system. J. Hydrol. 2007, 335, 1–14. [Google Scholar] [CrossRef]
- Pacheco-Martínez, J.; Arzate-Flores, J.; Rojas, E.; Arroyo, M.; Yutsis, V.; Ochoa, G. Delimitation of ground failure zones due to land subsidence using gravity data and finite element modeling in the Querétaro Valley, Mexico. Eng. Geol. 2006, 84, 143–160. [Google Scholar] [CrossRef]
- Solano-Rojas, D.; Cabral-Cano, E.; Wdowinski, S.; Hernández-Espriú, A.; Falorni, G.; Bohane, A. Subsidence hazard an risk assessments for Mexico City: An interdisciplinary analysis of satellite-derived subsidence mapp (PSInSAR) and census data. In Proceedings of the 2014 AGU Fall Meeting, San Francisco, CA, USA, 15–19 December 2014. Abstract NH53B-3894.
- Hernández-Espriú, A.; Reyna-Gutiérrez, J.A.; Sánchez-León, E.; Cabral-Cano, E.; Carrera-Hernández, J.; Martínez-Santos, P.; Macías-Medrano, S.; Falorni, G.; Colombo, D. The DRASTIC-Sg model: An extension to the DRASTIC approach for mapping groundwater vulnerability in aquifers subject to differential land subsidence, with application to Mexico City. Hydrogeol. J. 2014, 22, 1469–1485. [Google Scholar] [CrossRef]
- Cabral-Cano, E.; Díaz-Molina, O.; Delgado-Granados, H. Subsidencia y sus mapas de peligro: Un ejemplo en el área nororiental de la zona Metropolitana de la Ciudad de Mexico. Bol. Soc. Geol. Mex. 2011, 63, 53–60. [Google Scholar]
- Cabral-Cano, E.; Solano-Rojas, D.; Oliver-Cabrera, T.; Salazar-Tlaczani, L.; Wdowinski, S.; DeMets, C.; Pacheco-Martínez, J. Subsidence and associated shallow faulting hazard assessment in central Mexico using InSAR and GPS. In Proceedings of the 2014 AGU Fall Meeting, San Francosnco, CA, USA, 15–19 December 2014. Abstract G41A-0471.
- Hu, B.; Zhou, J.; Wang, J.; Chen, Z.; Wang, D.; Xu, S. Risk assessment of land subsidence at Tianjin coastal area in China. Environ. Earth Sci. 2009, 59, 269–276. [Google Scholar] [CrossRef]
- Huang, B.; Shu, L.; Yang, Y.S. Groundwater Overexploitation Causing Land Subsidence: Hazard Risk Assessment Using Field Observation and Spatial Modelling. Water Resour. Manag. 2012, 26, 4225–4239. [Google Scholar] [CrossRef]
- Douglas, J. Physical vulnerability modelling in natural hazard risk assessment. Nat. Hazards Earth Syst. Sci. 2007, 7, 283–288. [Google Scholar] [CrossRef] [Green Version]
- Bründl, M.; Romang, H.E.; Bischof, N.; Rheinberger, C.M. The risk concept and its application in natural hazard risk management in Switzerland. Nat. Hazards Earth Syst. Sci. 2009, 9, 801–813. [Google Scholar] [CrossRef]
- Ovando-Shelley, E.; Lermo-Samaniego, J.; Auvinet, G.; Méndez-Sánchez, E. Microtremor measurements to identify zones of potential fissuring in the basin of Mexico. Geofís. Int. 2012, 51, 143–156. [Google Scholar]
- Lermo, J.; Ovando, E.; Espinoza, L. Microtremor measurements to detect zones of potential cracking in the basin of Mexico. In Proceedings of Eighth International Symposium on Land Subsidence, Querétaro, Mexico, 17–22 October 2010; Carreón-Freyre, D., Cerca, M., Galloway, D., Eds.; IAHS Press: Querétaro, Mexico, 2010; pp. 51–33, Publication No. 339. [Google Scholar]
- Pacheco-Martínez, J.; Arzate-Flores, J.A.; López-Doncel, R.; Barboza-Gudiño, R.; Mata-Segura, J.L.; Del-Rosal-Pardo, A.; Aranda-Gómez, J.J. Zoning map of ground failure risk due to land susbidence of San Luís Potosí, Mexico. In Proceedings of Eighth International Symposium on Land Subsidence, Querétaro, Mexico, 17–22 October 2010; Carreón-Freyre, D., Cerca, M., Galloway, D.L., Eds.; IAHS Press: Querétaro, Mexico, 2010; pp. 179–184, Publication No. 339. [Google Scholar]
- Abbasnejad, A.; Abbasnejad, B. Subsidence hazard zoning of Jiroft Plain, Southeast Iran. Int. J. Eng. Res. Dev. 2013, 7, 61–68. [Google Scholar]
- Holzer, T.L. Ground failure in areas of subsidence due to ground-water decline in the United States. In Proceedings of the International Symposium on Land Subsidence, Anaheim, CA, USA, 13–17 December 1976; Jhonson, A.I., Yamamoto, S., Eds.; IAHS Press: Paris, France, 1976; pp. 423–433, Publication No. 121. [Google Scholar]
- Holzer, T.L. Ground failure induced by ground-water withdrawal from unconsolidated sediments. Geol. Soc. Am. Rev. Eng. Geol. 1984, VI, 67–105. [Google Scholar]
- Galloway, D.L.; Burbey, T.J. Review: Regional land subsidence accompanying groundwater extraction. Hydrogeol. J. 2011, 19, 1459–1486. [Google Scholar] [CrossRef]
- Budhu, M. Earth Fissure Formation from the Mechanics of Groundwater Pumping. Int. J. Geomech. 2011, 11, 1–11. [Google Scholar] [CrossRef]
- Wang, G.Y.; You, G.; Shi, B.; Yu, J.; Li, H.Y.; Zong, K.H. Earth fissures triggered by groundwater withdrawal and coupled by geological structures in Jiangsu Province, China. Environ. Geol. 2009, 57, 1047–1054. [Google Scholar] [CrossRef]
- National Research Council (NRC). Mitigation Losses from Land Subsidence in the United States; National Academy Press: Wachington, DC, USA, 1991. [Google Scholar]
- Pacheco-Martínez, J.; Ortiz-Lozano, J.A.; Zermeño-De-León, M.; Mendoza-Otero, E. Líneas de investigación vigentes y pertinentes en subsidencia y generación de agrietamientos. In Convergencias del Diseño y la Construcción; Acosta-Collazo, A., Ed.; Universidad Autónoma de Aguascalientes: Aguascalientes, Mexico, 2011; Volume I, pp. 186–197. [Google Scholar]
- Budhu, M.; Adiyaman, I.B. Mechanics of land subsidence due to groundwater pumping. Int. J. Numer. Anal. Methods Geomech. 2010, 34, 1459–1478. [Google Scholar] [CrossRef]
- Bouwer, H. Land Subsidence and Cracking due to ground-water depletion. Ground Water 1977, 15, 358–364. [Google Scholar] [CrossRef]
- Jachens, R.C.; Holzer, T.L. Differential compaction mechanism for earth fissures near Casa Grande, Arizona. Geol. Soc. Am. Bull. 1982, 93, 998–1012. [Google Scholar] [CrossRef]
- Yutsis, V.; Aranda-Gómez, J.J.; Arzate Flores, J.; Harald, B.; Pacheco Martínez, J.; López-Loera, H. Maar geophysics: Valle de Santiago study. In Proceedings of the 5th International MAAR Conference, Querétaro, Mexico, 17–22 November 2014; pp. 32–33.
- Jachens, R.C.; Holzer, T.L. Geophysical investigation of ground failure related to ground water withdrawal-Picacho Basin, Arizona. Ground Water 1979, 17, 574–585. [Google Scholar] [CrossRef]
- Galloway, D.L.; Hudnut, K.W.; Ingebritsen, S.E.; Phillips, S.P.; Peltzer, G.; Rogez, F.; Rosen, P.A. Detection of aquifer system compaction and land subsidence using interferometric synthetic aperture radar, Antelope Valley, Mojave Desert, California. Water Resour. Res. 1998, 34, 2573–2585. [Google Scholar] [CrossRef]
- Bell, J.W.; Amelung, F.; Ferretti, A.; Bianchi, M.; Novali, F. Permanent scatterer InSAR reveals seasonal and long-term aquifer-system response to groundwater pumping and artificial recharge. Water Resour. Res. 2008, 44, W02407. [Google Scholar] [CrossRef]
- Instituto Nacional de Estadística e Informática. Censo de Población y Vivienda 2010, Panorama Socioeconómico de Aguascalientes; INEGI: Aguascalientes, Mexico, 2011. [Google Scholar]
- Aranda-Gómez, J.J. Geología preliminar del graben de Aguascalientes. Rev. Mex. Cienc. Geol. 1989, 8, 22–32. [Google Scholar]
- Lermo, J.; Nieto-Obregón, J.; Zermeño, M. Faults and fractures in the valley of Aguascalientes. Preliminary microzonification. In Proceedings of the Eleventh World Conference on Earthquake Engineering, Acapulco, Mexico, 23–28 June 1996.
- Romero-Navarro, M.A.; Pacheco-Martínez, J.; Ortiz-Lozano, J.A.; Zermeño-De-León, M.E.; Araiza-Garaygordobil, G.; Mendoza-Otero, E. Land subsidence in Aguascalientes Valley, Mexico. Historical Review and present situation. In Proceedings of Eighth International Symposium on Land Subsidence, Querétaro, Mexico, 17–22 October 2010; Carreón-Freyre, D., Cerca, M., Galloway, D., Eds.; IAHS Press: Wallingford, UK, 2010; pp. 207–209, Publication No. 339. [Google Scholar]
- SIFAGG Sistema de Información de Fallas Geológicas y Grietas. Available online: http://www.aguascalientes.gob.mx/sop/sifagg/web/mapa.asp. (accessed on 15 July 2015).
- Telford, W.M.; Geldart, L.P.; Sheriff, R.E. Applied Geophysics; Cambridge University Press: New York, NY, USA, 1990. [Google Scholar]
- Singh, B.; Guptasarma, D. New method for fast computation of gravity and magnetic anomalies from arbitrary polyhedral. Geophysics 2001, 66, 521–526. [Google Scholar] [CrossRef]
- Cole, P. PyGMI-Python Geophysical Modeling and Interpretation Software; Council for Geosciences. Geological Survey of South Africa: Silverton, Pretoria, South Africa, 2015. [Google Scholar]
- Loza-Aguirre, I.; Nieto-Samaniego, Á.F.; Alaniz-Álvarez, S.A.; Iriondo, A. Relaciones estratigráfico-estructurales en la intersección del sistema de fallas San Luis-Tepehuanes y el graben de Aguascalientes, Mexico central. Rev. Mex. Cienc. Geol. 2008, 25, 533–548. [Google Scholar]
- Pacheco Martínez, J.; Zermeño de León, M.; Mendoza Otero, E.; de Alba Obregón, R. Zonificación del Peligro Por Subsidencia: Caso Aguascalientes, 1a edición; Universidad Autónoma de Aguascalientes: Aguascalientes, Mexico, 2012. [Google Scholar]
- Rosen, P.A.; Hensley, S.; Peltzer, G. Updated repeated orbit interferometry package released. Eos Trans. Am. Geophys. Union 2004, 85, 47. [Google Scholar] [CrossRef]
- Rosen, P.A.; Hensley, S.; Joughin, I.R.; Li, F.K.; Madsen, S.N.; Rodríguez, E.; Goldstein, R.M. Synthetic Aperure Radar Interferometry. Proc. IEEE 2000, 88, 333–382. [Google Scholar] [CrossRef]
- Berardino, P.; Fornaro, G.; Lanari, R.; Sansosti, E. A new algorithm for surface deformation monitoring based on small baseline differential SAR Interferograms. IEEE Trans. Geosci. Remote Sens. 2002, 40, 2375–2383. [Google Scholar] [CrossRef]
- Lanari, R.; Mora, O.; Manunta, M.; Mallorqui, J.J.; Berardino, P.; Sansosti, E. A small-baseline approach for investigating deformations on full-resolution differential SAR interferograms. IEEE Trans. Geosci. Remote Sens. 2004, 42, 1377–1386. [Google Scholar] [CrossRef]
- Fattahi, H.; Amelung, F. DEM error correction in InSAR time series. IEEE Trans. Geosci. Remote Sens. 2013, 51, 4249–4259. [Google Scholar] [CrossRef]
- Hernández-Castillo, L.A.; Ortiz-Lozano, J.A.; Hernández-Marín, M.; Pacheco-Martínez, J.; Zermeño-De-León, M.E.; Soto-Bernal, J.J.; Ramos-Ruiz-Flores, J.; Soto-Zamora, M.A. Fragility curves for thin-walled cold-formed steel wall frames affected by ground settlements due to land subsidence. Thin-Walled Struct. 2015, 87, 66–75. [Google Scholar] [CrossRef]
- Ortiz-Lozano, J.A.; Pacheco-Martínez, J.; Zermeño de León, M.; Alonso-Farrera, F.A.; Soto-Bernal, J.J.; Moreno-Virgen, M.R.; Correa-Zúñiga, L.O. Application of cold formed steel Framing Structures for construction in zones affected by Land Subsidence. MATEC Web Conf. 2012, 2, 1–7. [Google Scholar]
© 2015 by the authors; licensee MDPI, Basel, Switzerland. This article is an open access article distributed under the terms and conditions of the Creative Commons by Attribution (CC-BY) license (http://creativecommons.org/licenses/by/4.0/).
Share and Cite
Pacheco-Martínez, J.; Cabral-Cano, E.; Wdowinski, S.; Hernández-Marín, M.; Ortiz-Lozano, J.Á.; Zermeño-de-León, M.E. Application of InSAR and Gravimetry for Land Subsidence Hazard Zoning in Aguascalientes, Mexico. Remote Sens. 2015, 7, 17035-17050. https://0-doi-org.brum.beds.ac.uk/10.3390/rs71215868
Pacheco-Martínez J, Cabral-Cano E, Wdowinski S, Hernández-Marín M, Ortiz-Lozano JÁ, Zermeño-de-León ME. Application of InSAR and Gravimetry for Land Subsidence Hazard Zoning in Aguascalientes, Mexico. Remote Sensing. 2015; 7(12):17035-17050. https://0-doi-org.brum.beds.ac.uk/10.3390/rs71215868
Chicago/Turabian StylePacheco-Martínez, Jesús, Enrique Cabral-Cano, Shimon Wdowinski, Martín Hernández-Marín, José Ángel Ortiz-Lozano, and Mario Eduardo Zermeño-de-León. 2015. "Application of InSAR and Gravimetry for Land Subsidence Hazard Zoning in Aguascalientes, Mexico" Remote Sensing 7, no. 12: 17035-17050. https://0-doi-org.brum.beds.ac.uk/10.3390/rs71215868