
Dynamics of Land Cover/Land Use Changes in the Mekong Delta, 1973–2011: A Remote Sensing Analysis of the Tran Van Thoi District, Ca Mau Province, Vietnam

Abstract
:
1. Introduction

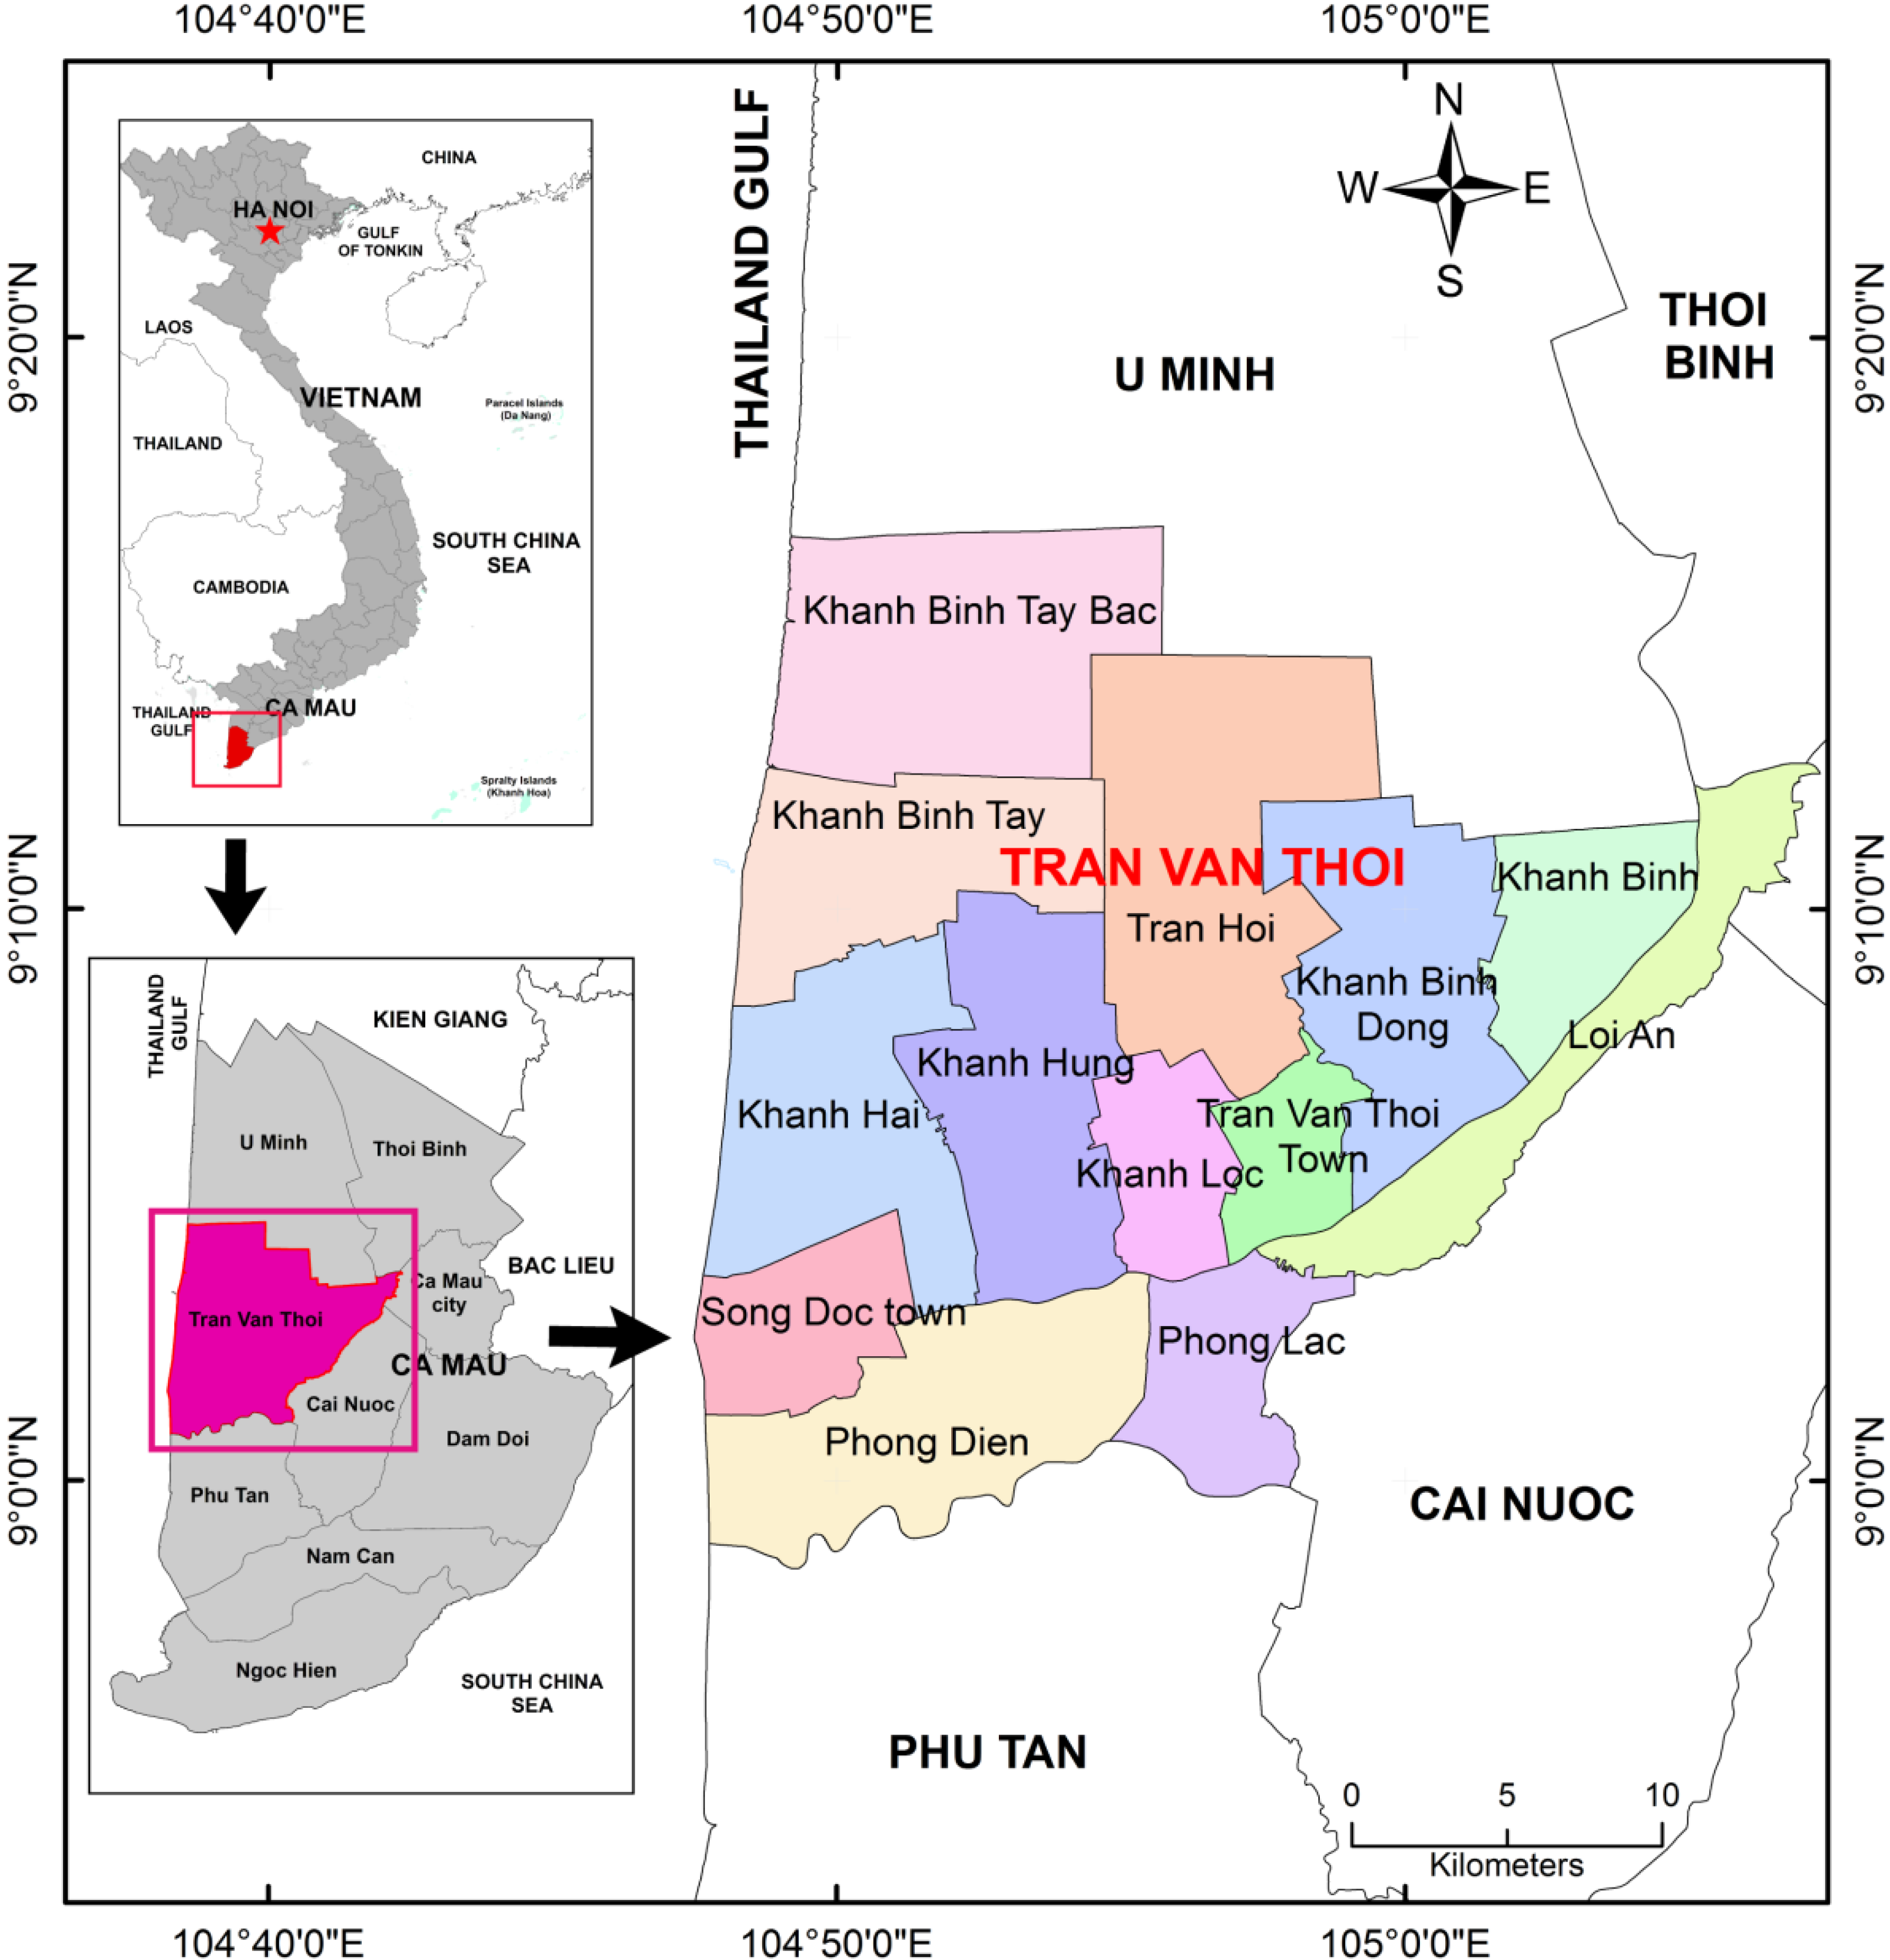
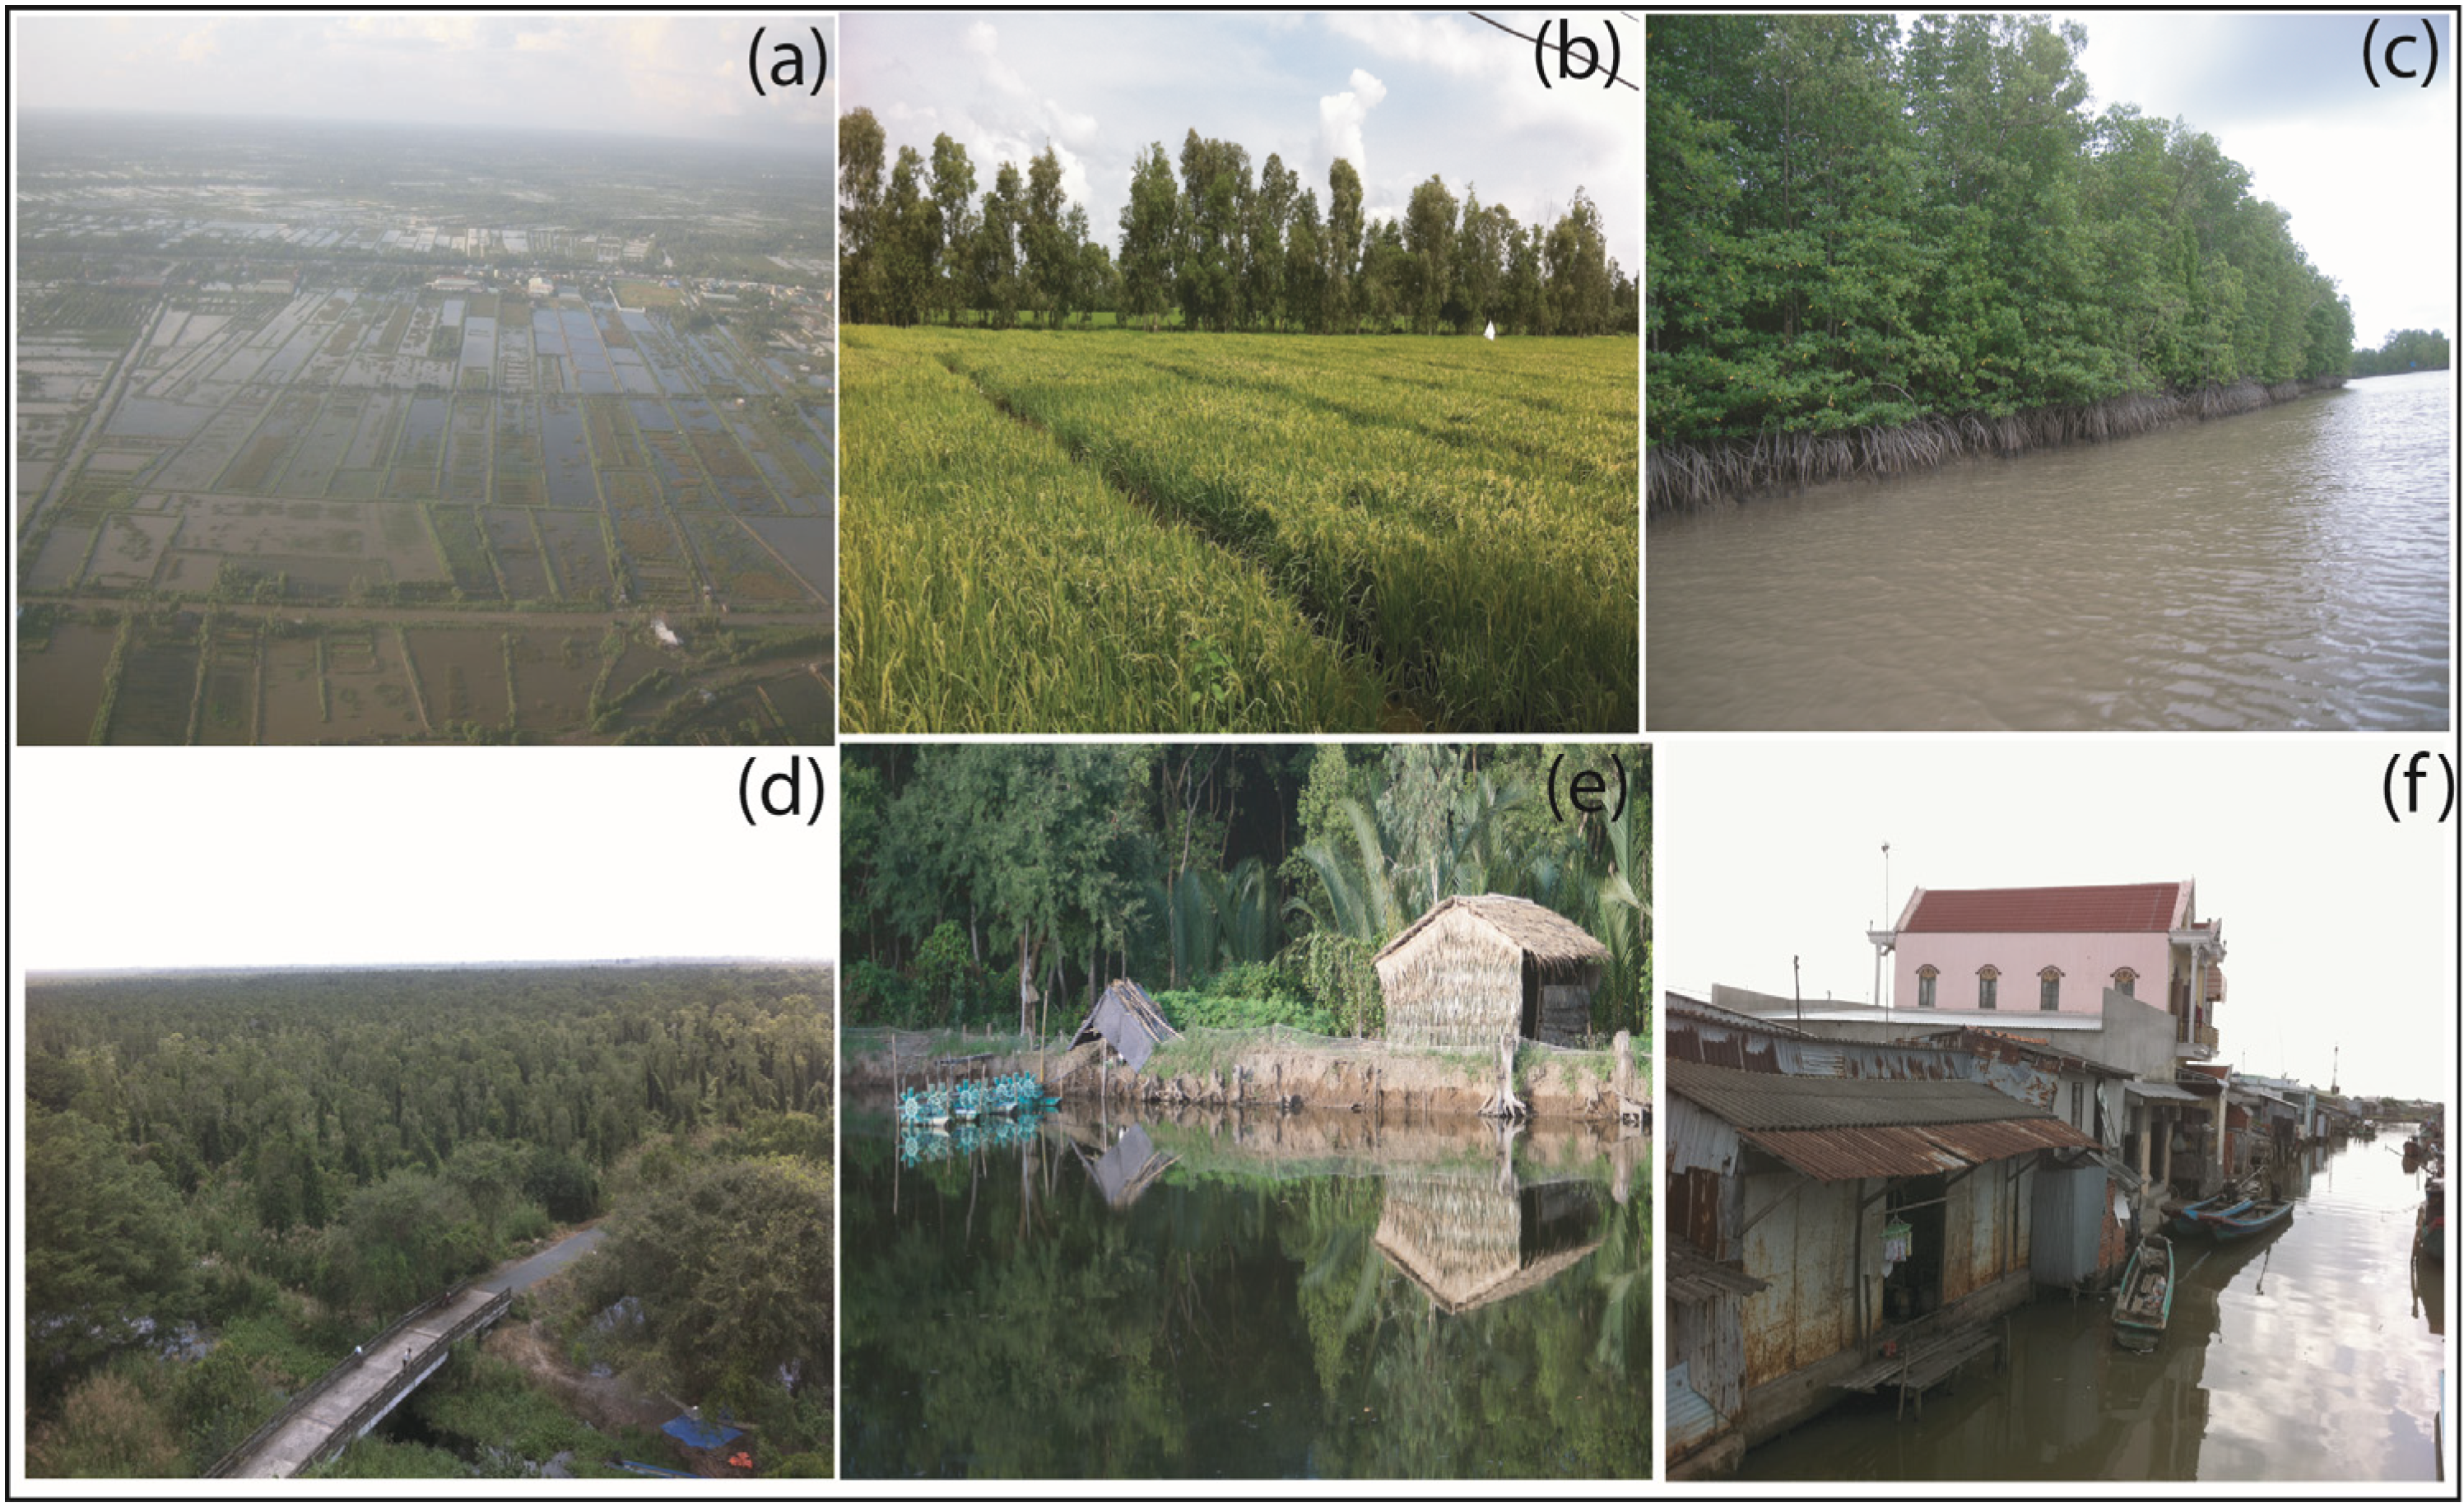
2. Study Area
3. Materials and Methods
3.1. Datasets

| Type | Data (Scale) | Date of Acquisition | Spatial Scale; Numbers of Bands; Spectral Bands | Source |
|---|---|---|---|---|
| Remote sensing satellite images | Landsat 1 MSS (District) | 3 January 1973 | 60 × 60 m; 4; Green-Red-NIR-MIR | United States Geological Survey (USGS) (http://earthexplorer.usgs.gov) |
| Landsat 1 MSS (Province) | 14 March 1975 | 60 × 60 m; 4; Green-Red-NIR-MIR | ||
| Landsat 3 MSS (District) | 6 February 1979 | 60 × 60 m; 4; Green-Red-NIR-MIR | ||
| Landsat 4 TM (District) | 31 January 1989 | 30 × 30 m; 6; Blue-Green-Red-NIR-SWIR-SWIR | ||
| SPOT3 XS (District) | 8 January 1995 | 20 × 20 m; 3; Green-Red-NIR | National Remote Sensing Department (http://rsc.gov.vn) | |
| SPOT5 HI (District) | 19 March 2004 | 10 × 10 m; 4; Green-Red-NIR-SWIR | ||
| SPOT5 HI (Province, District) | 3 January 2011 | 10 × 10 m; 4; Green-Red-NIR-SWIR | ||
| Ancillary data | Topographic maps | 1965, 1969 (3rd edition) | 1:50,000 | Department of Defense (published by the US) (http://monre.gov.vn) |
| 1988, 2006 | 1:50,000 | Department of Defense (http:// monre.gov.vn) | ||
| 2010 | 1:5,000 | |||
| 2002 | 1:50,000 | Ministry of Natural Resources and Environment (http://monre.gov.vn) | ||
| Land use maps | 2005 | 1:25,000 | Ministry of Natural Resources and Environment (http://monre.gov.vn) | |
| 2010 | 1:25,000 | |||
| Google Earth Imagery | - | - | Google Inc. | |
| Statistic data | - | - | Ca Mau Statistic Office (http://cucthongke.camau.gov.vn/) | |
| Field data | December 2012 | Sampling unit: 10 × 10 m | Field trip (93 field observations) |
3.2. Pre-Processing

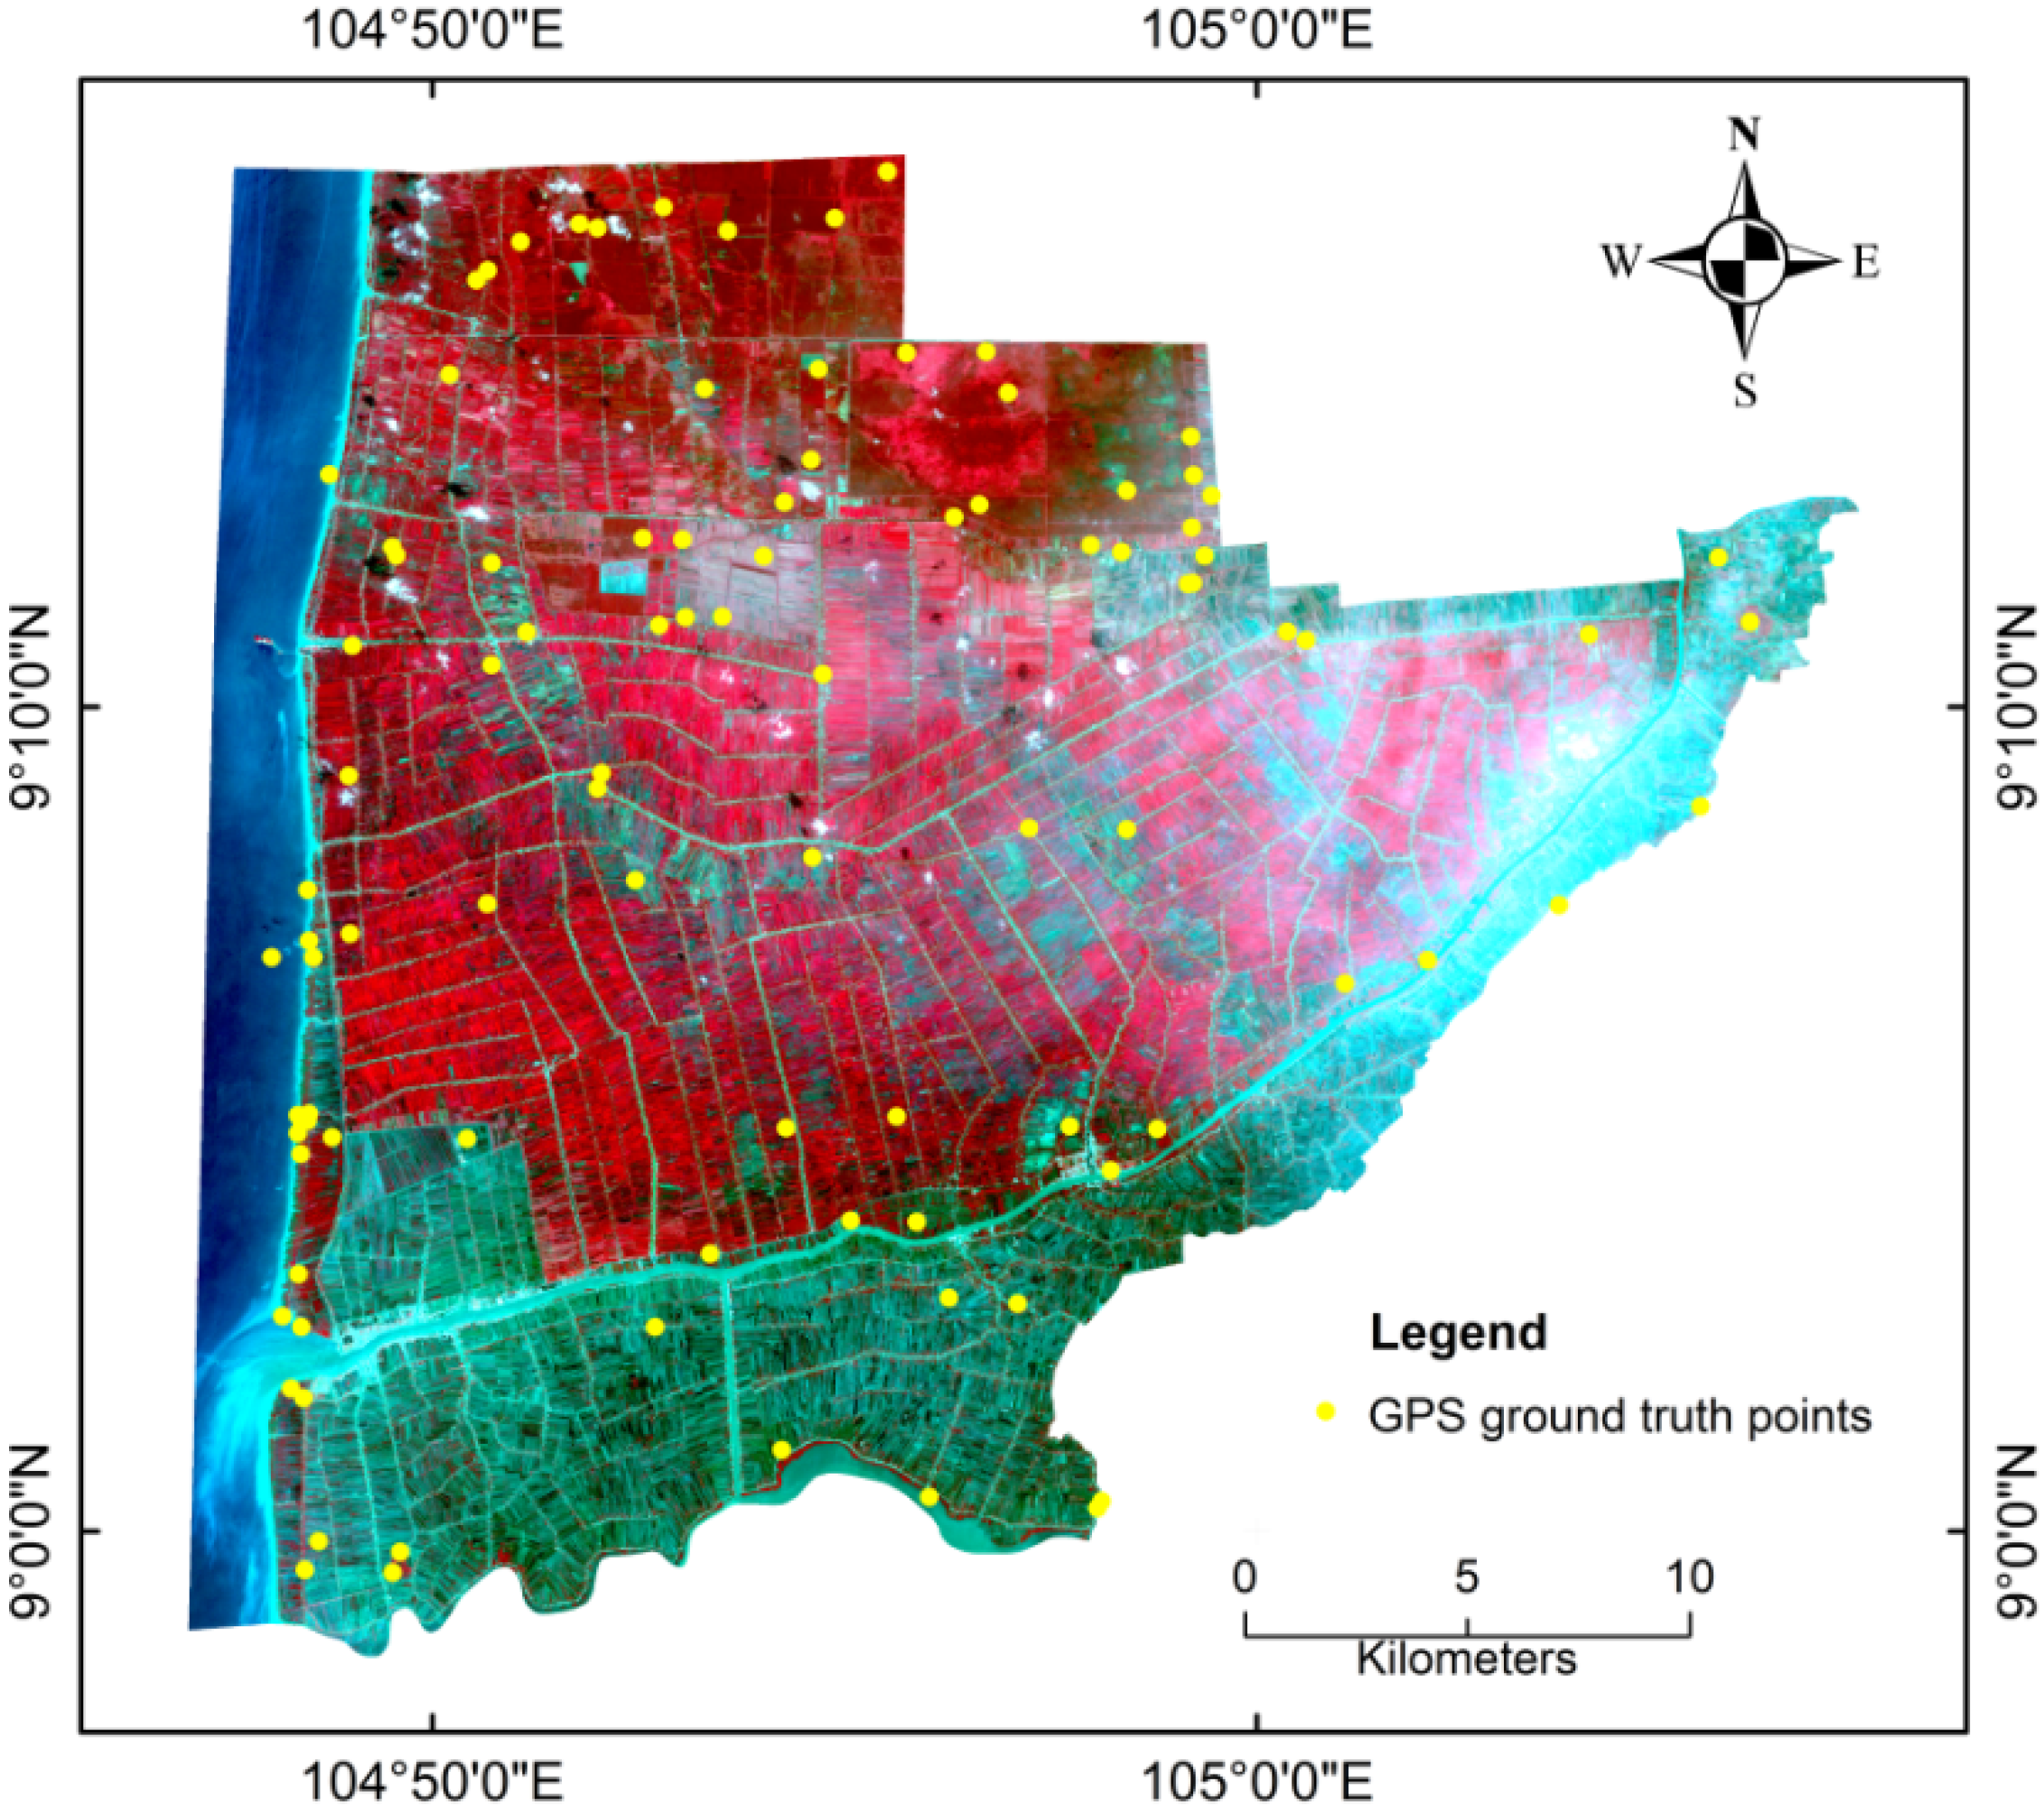
3.3. Field Survey


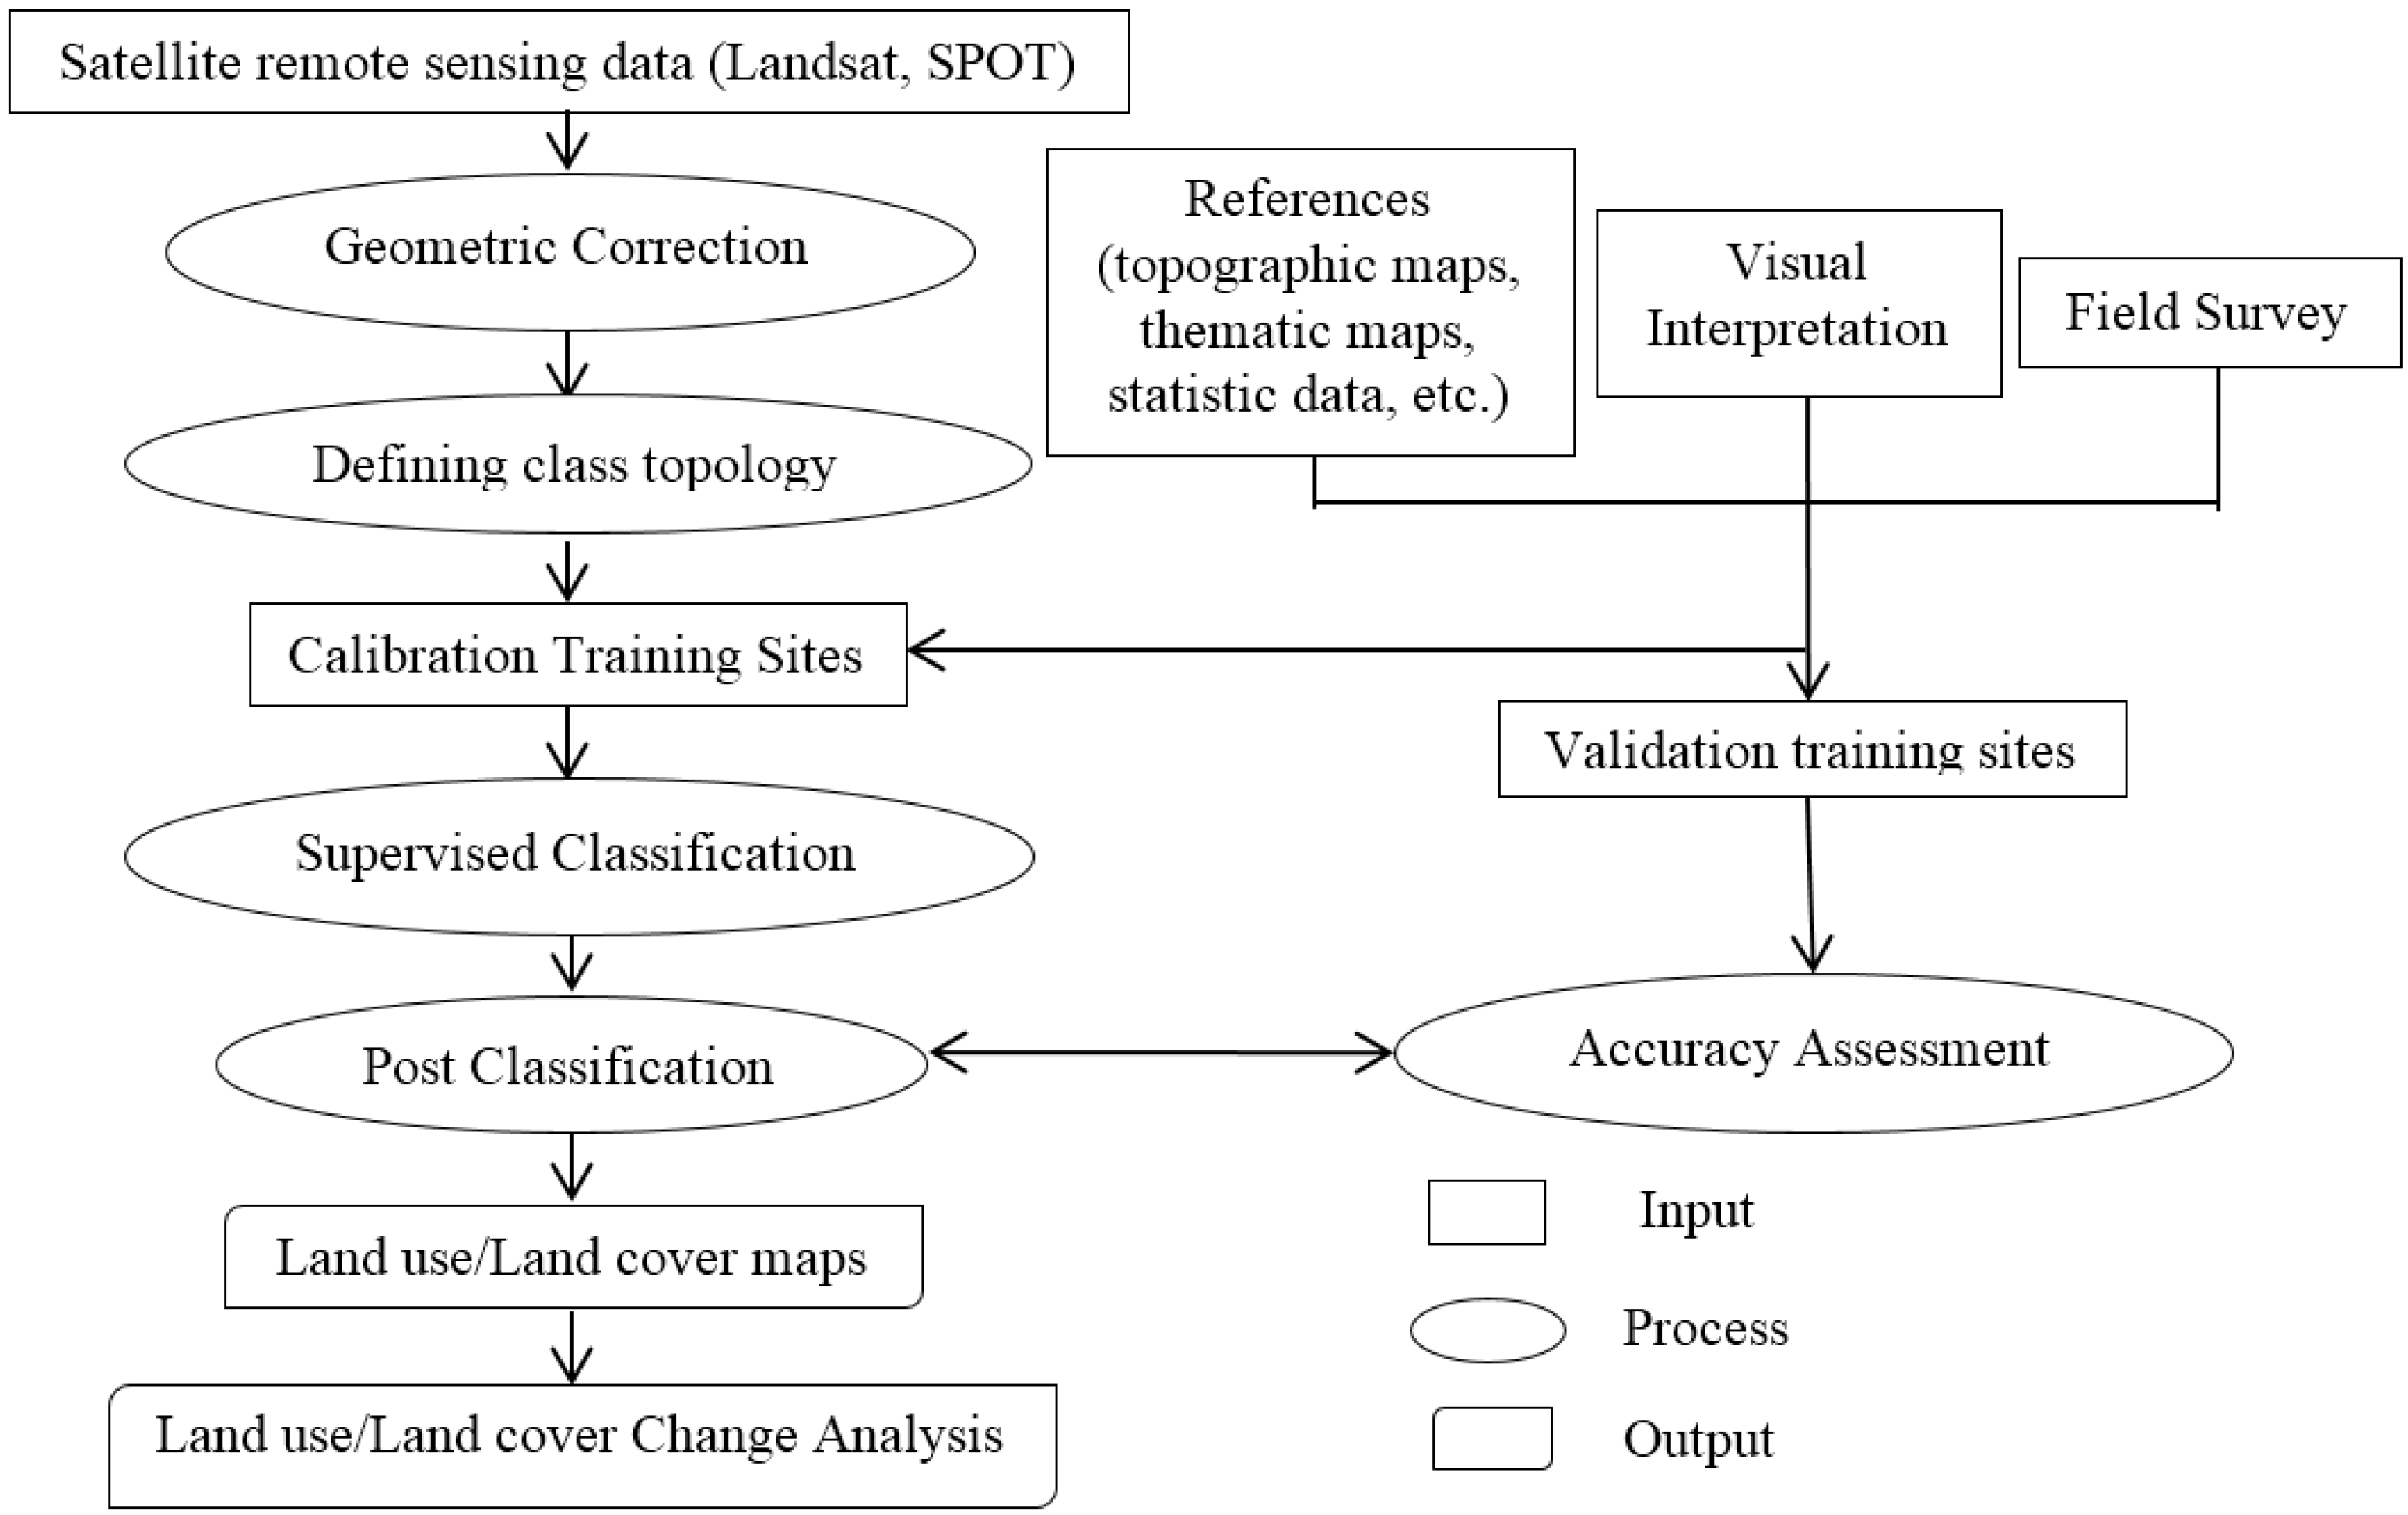
3.4. Classification
3.5. Change Detection Analysis
4. Results
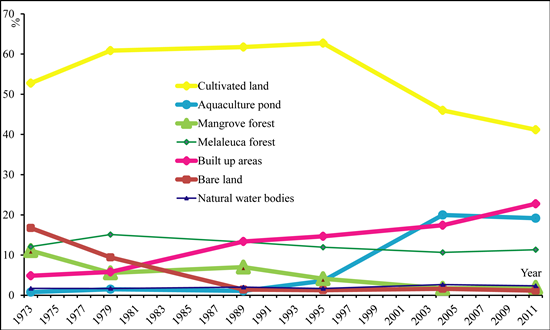
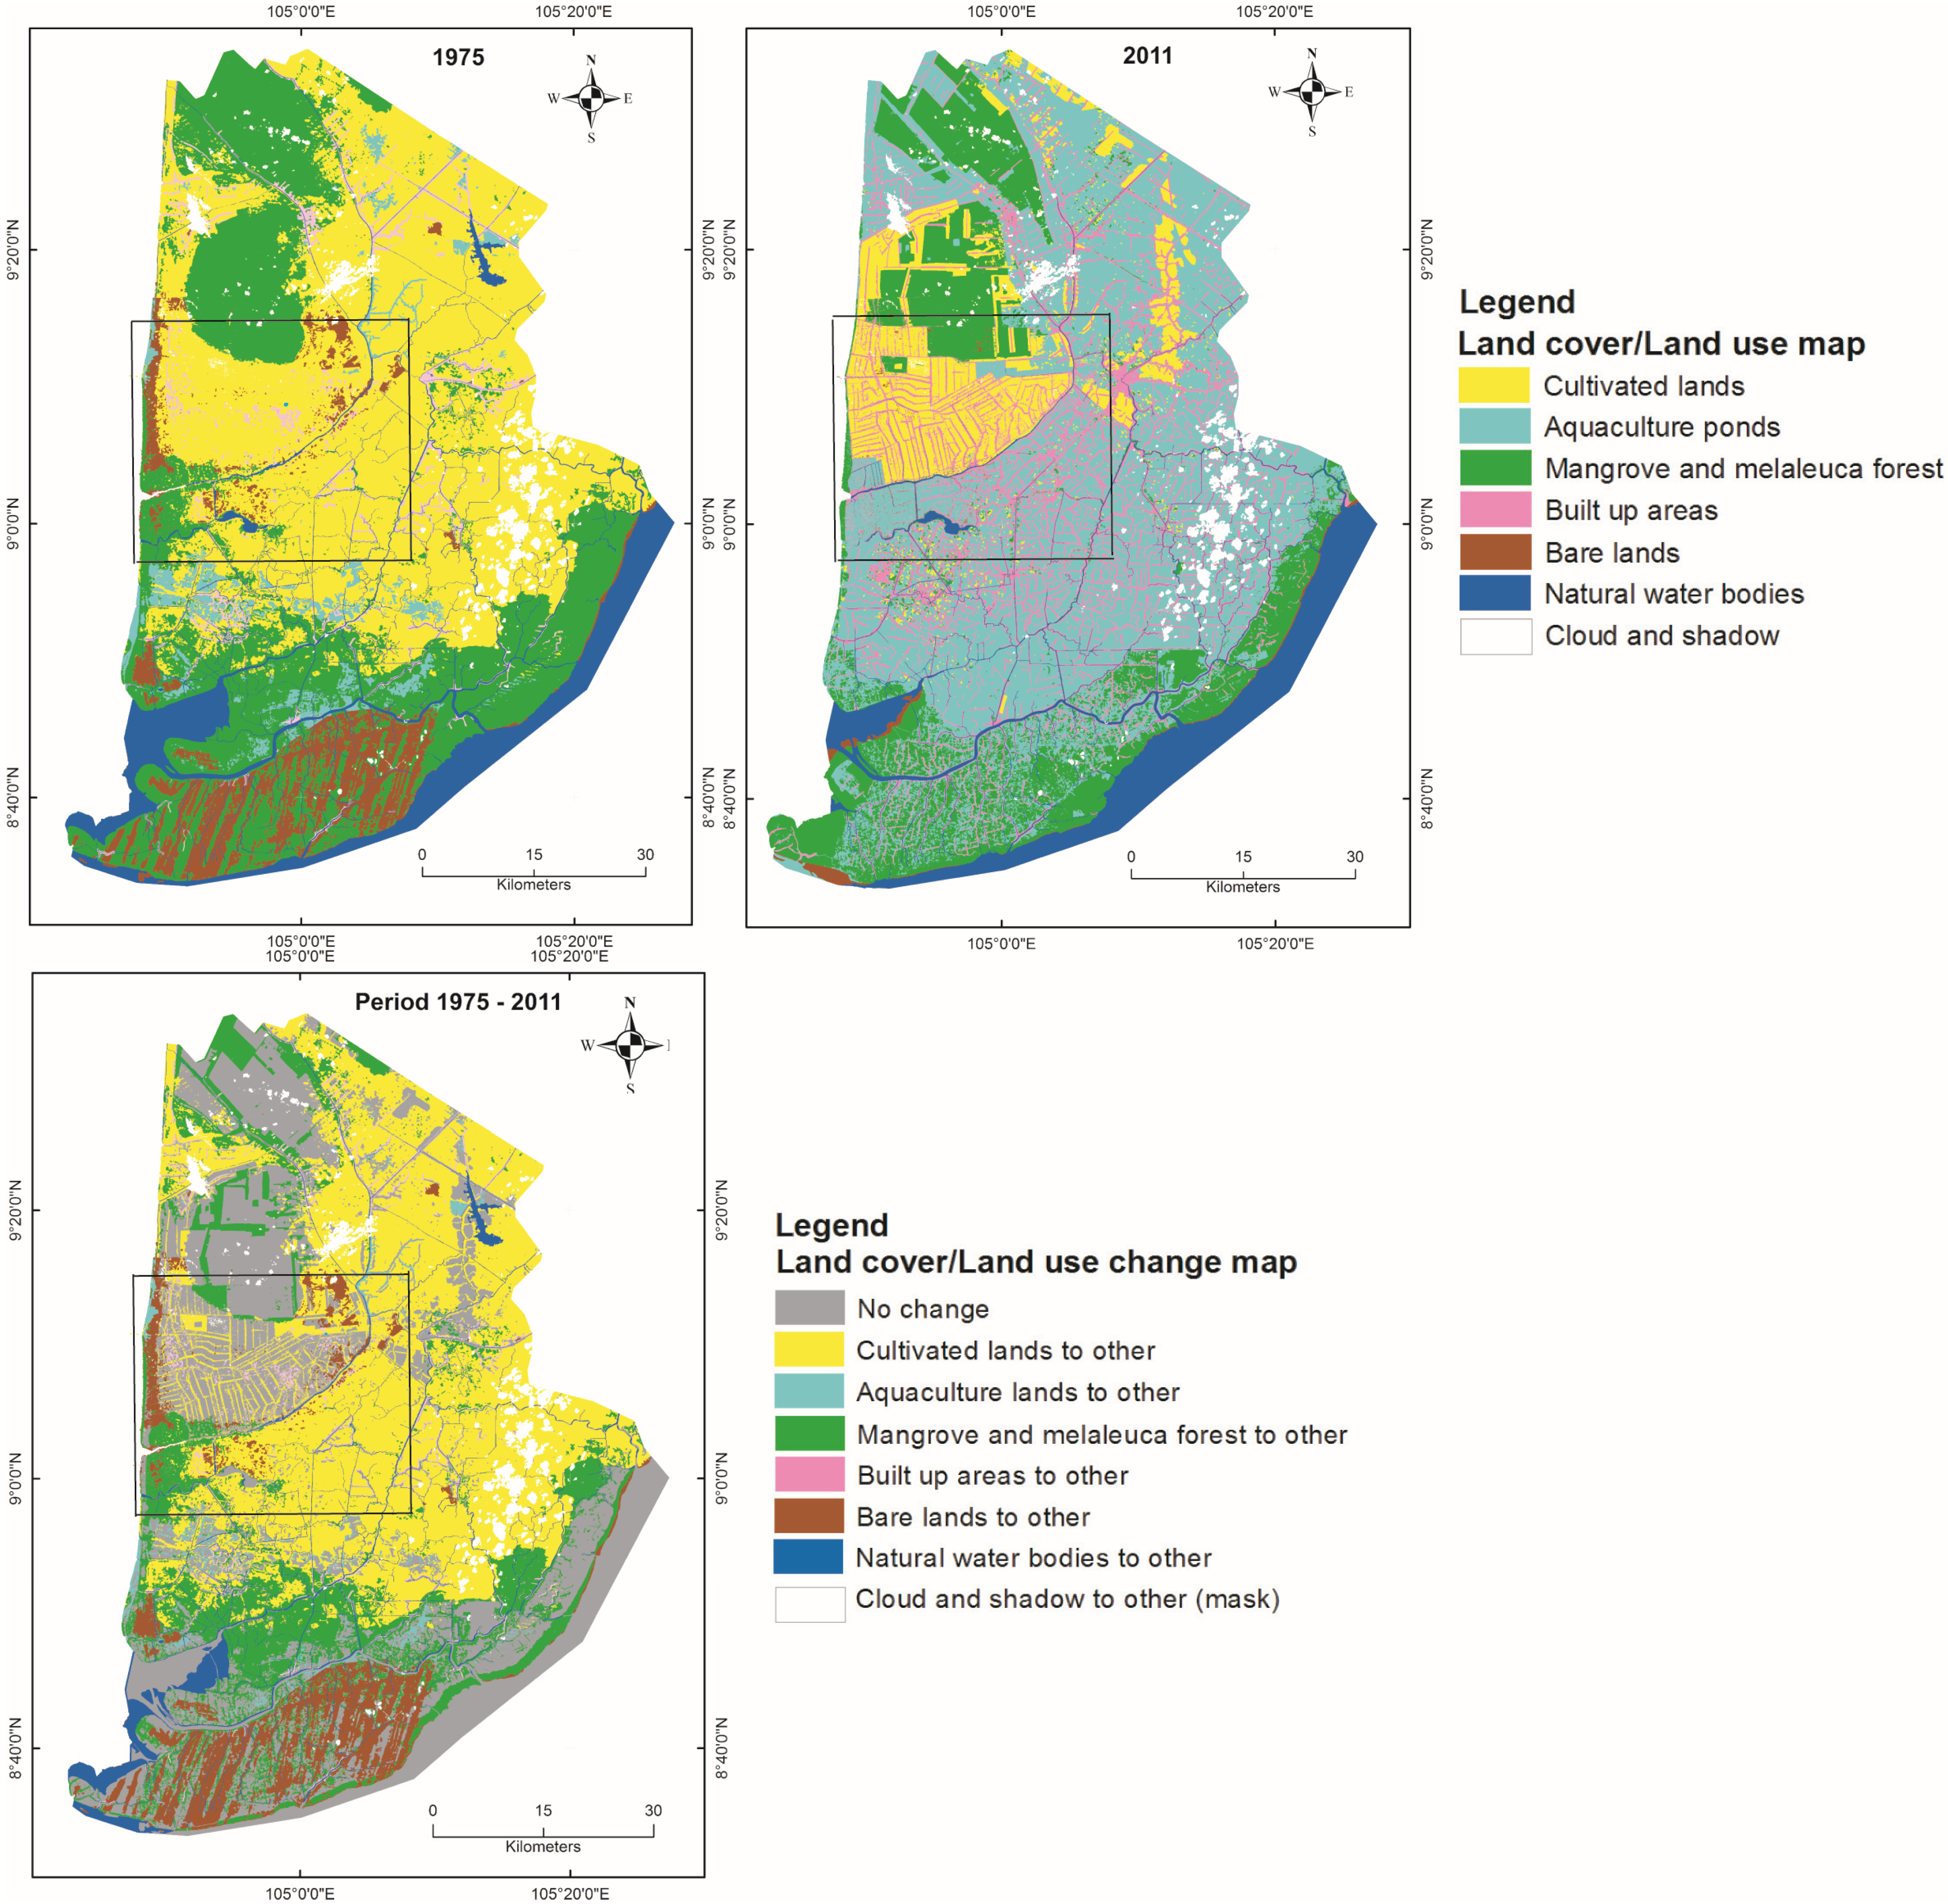
4.1. Land Cover/Land Use in Ca Mau Province

| Land Cover/Land Use Categories | Cu | Aq | Ma | Me | Bu | Ba | Na | Overall Accuracy | Overall Kappa | |
|---|---|---|---|---|---|---|---|---|---|---|
| 1973 | Producer | 72 | 90 | 92 | 67 | 74 | 82 | 89 | 81 | 0.77 |
| User | 91 | 76 | 67 | 84 | 68 | 73 | 100 | |||
| 1979 | Producer | 75 | 90 | 92 | 86 | 94 | 82 | 94 | 82 | 0.79 |
| User | 63 | 82 | 70 | 84 | 86 | 67 | 98 | |||
| 1989 | Producer | 97 | 85 | 76 | 77 | 100 | 74 | 90 | 86 | 0.83 |
| User | 100 | 83 | 82 | 74 | 100 | 100 | 100 | |||
| 1995 | Producer | 100 | 84 | 79 | 98 | 84 | 62 | 93 | 87 | 0.85 |
| User | 100 | 86 | 97 | 75 | 100 | 80 | 73 | |||
| 2004 | Producer | 100 | 92 | 100 | 77 | 65 | 93 | 100 | 89 | 0.87 |
| User | 92 | 89 | 98 | 92 | 66 | 86 | 100 | |||
| 2011 | Producer | 77 | 77 | 100 | 100 | 88 | 85 | 92 | 89 | 0.86 |
| User | 95 | 69 | 100 | 78 | 97 | 78 | 99 | |||
| 1975 | 85 | 88 | 81 | 71 | 73 | 82 | 81 | 0.75 | ||
| User | 67 | 86 | 84 | 89 | 93 | 98 | ||||
| 2011 | Producer | 84 | 94 | 95 | 83 | 76 | 88 | 88 | 0.86 | |
| User | 93 | 85 | 81 | 90 | 100 | 96 | ||||
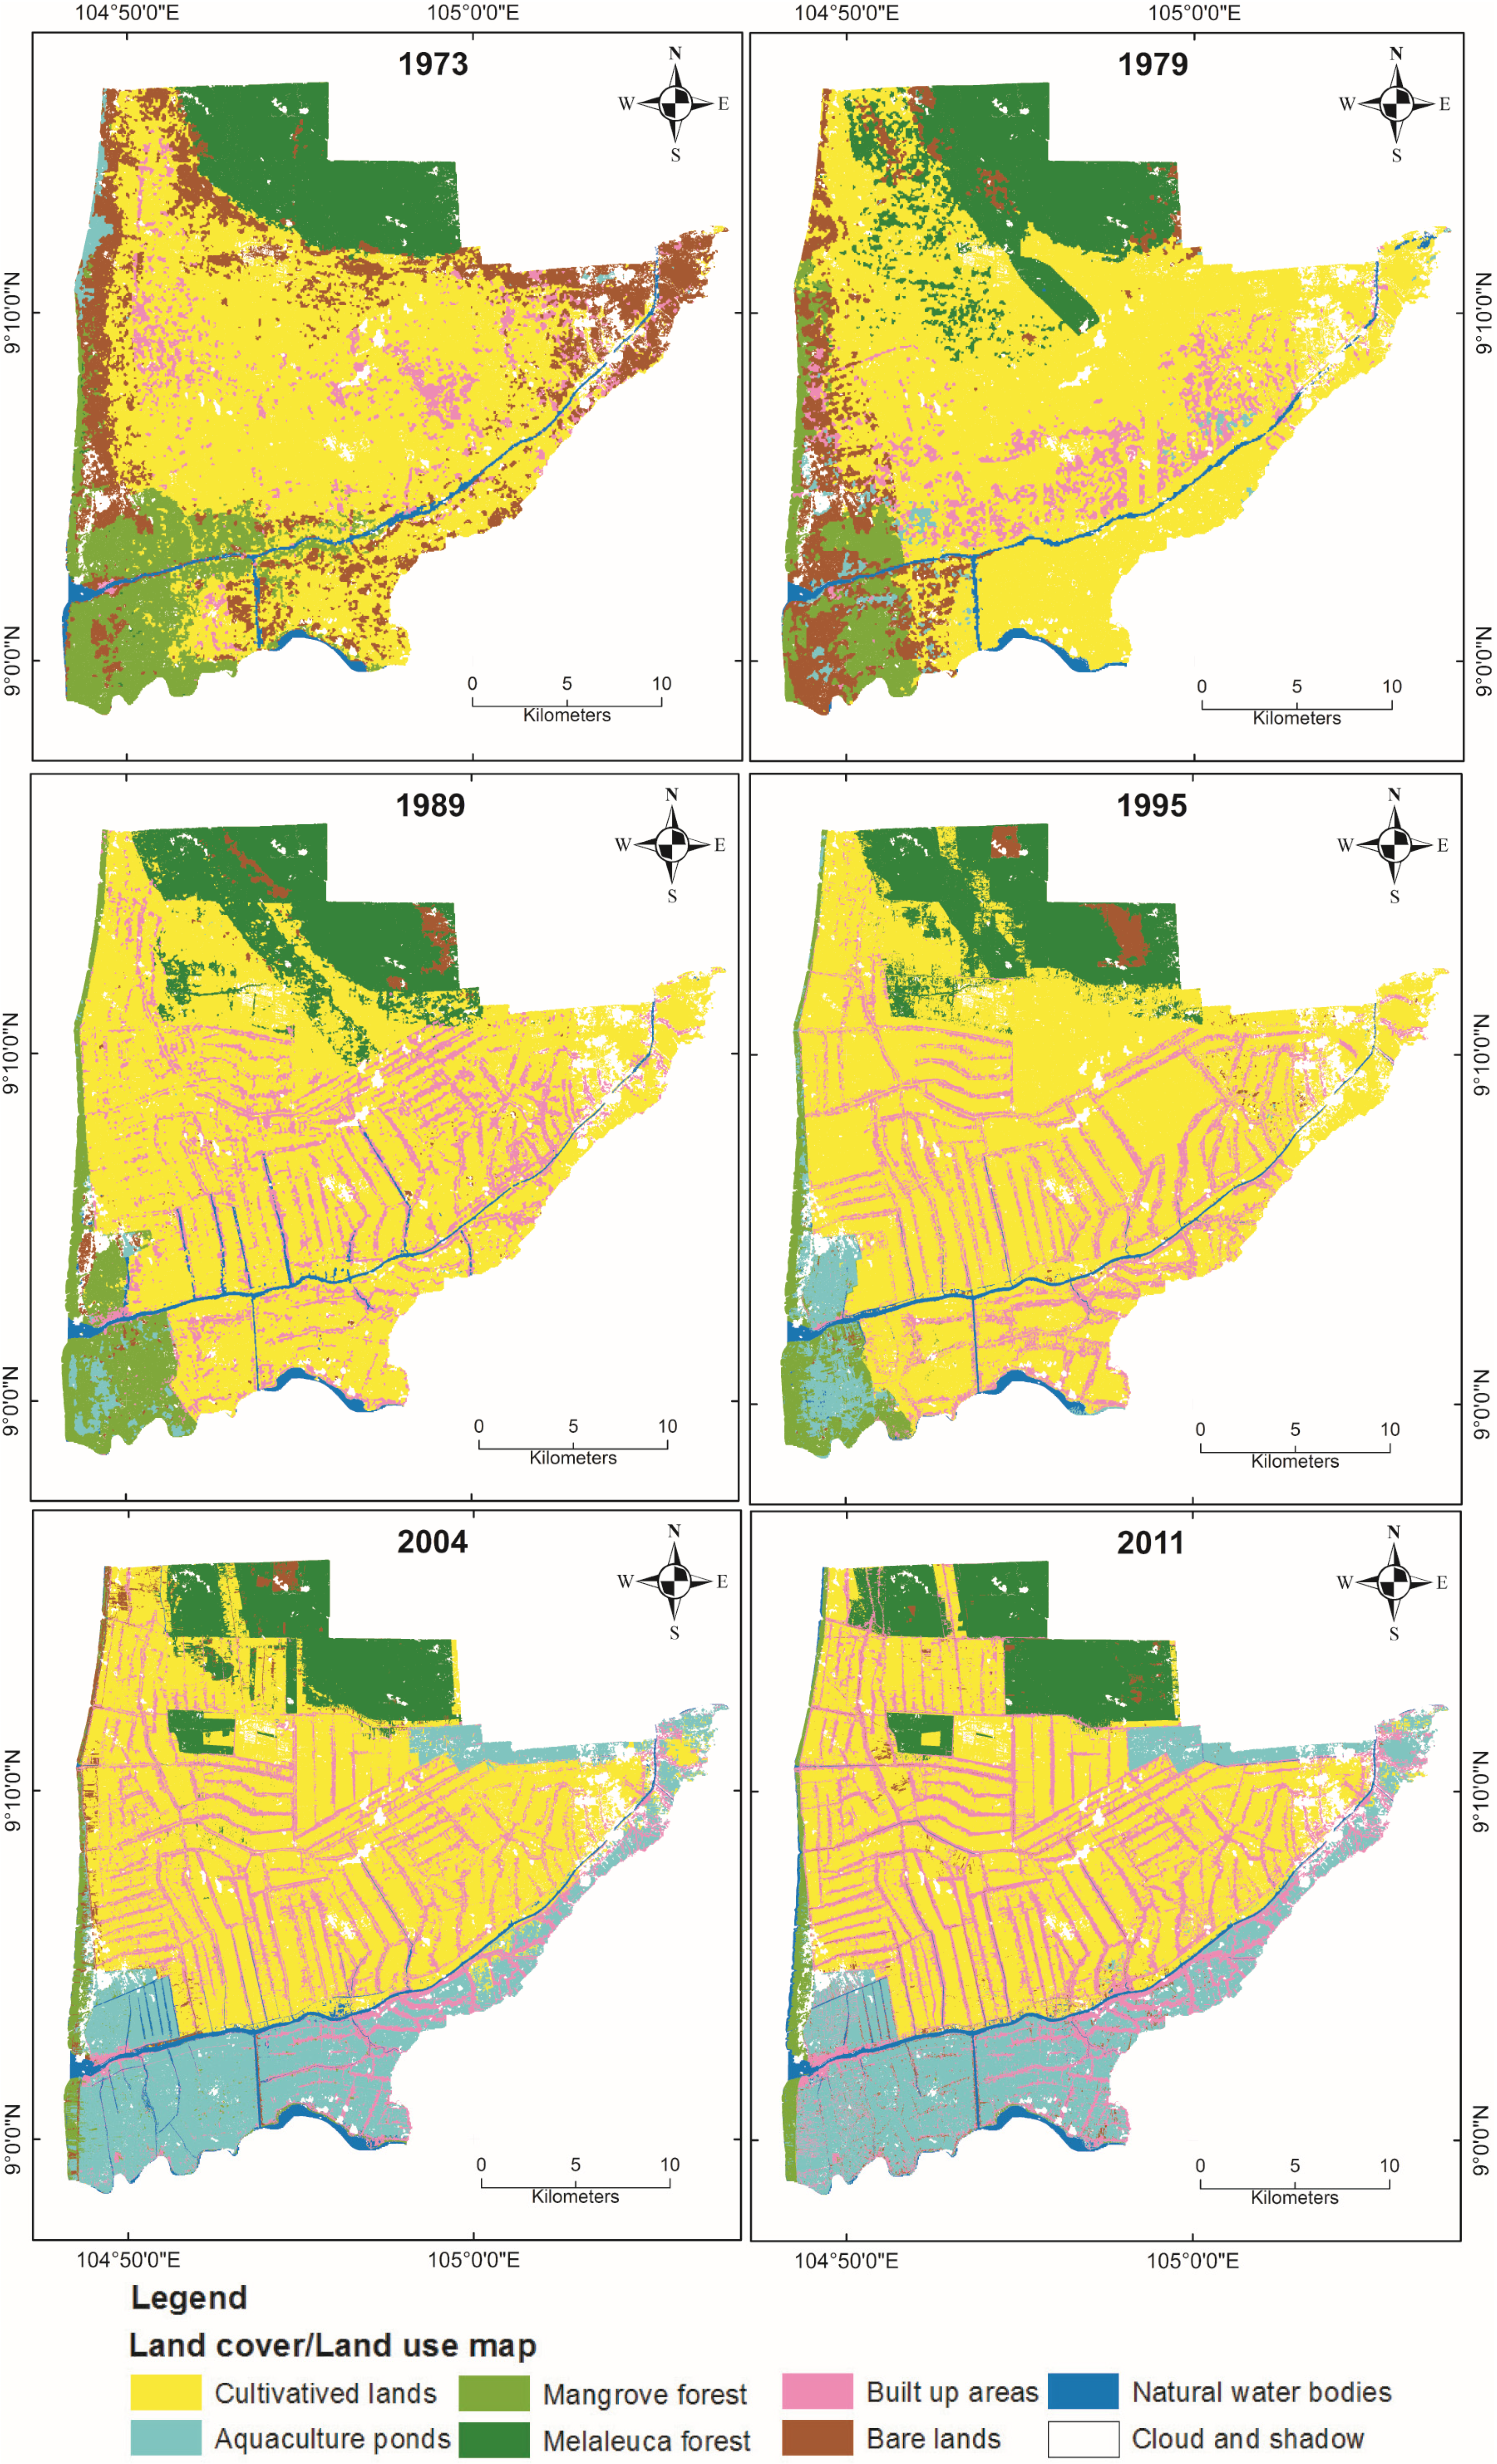
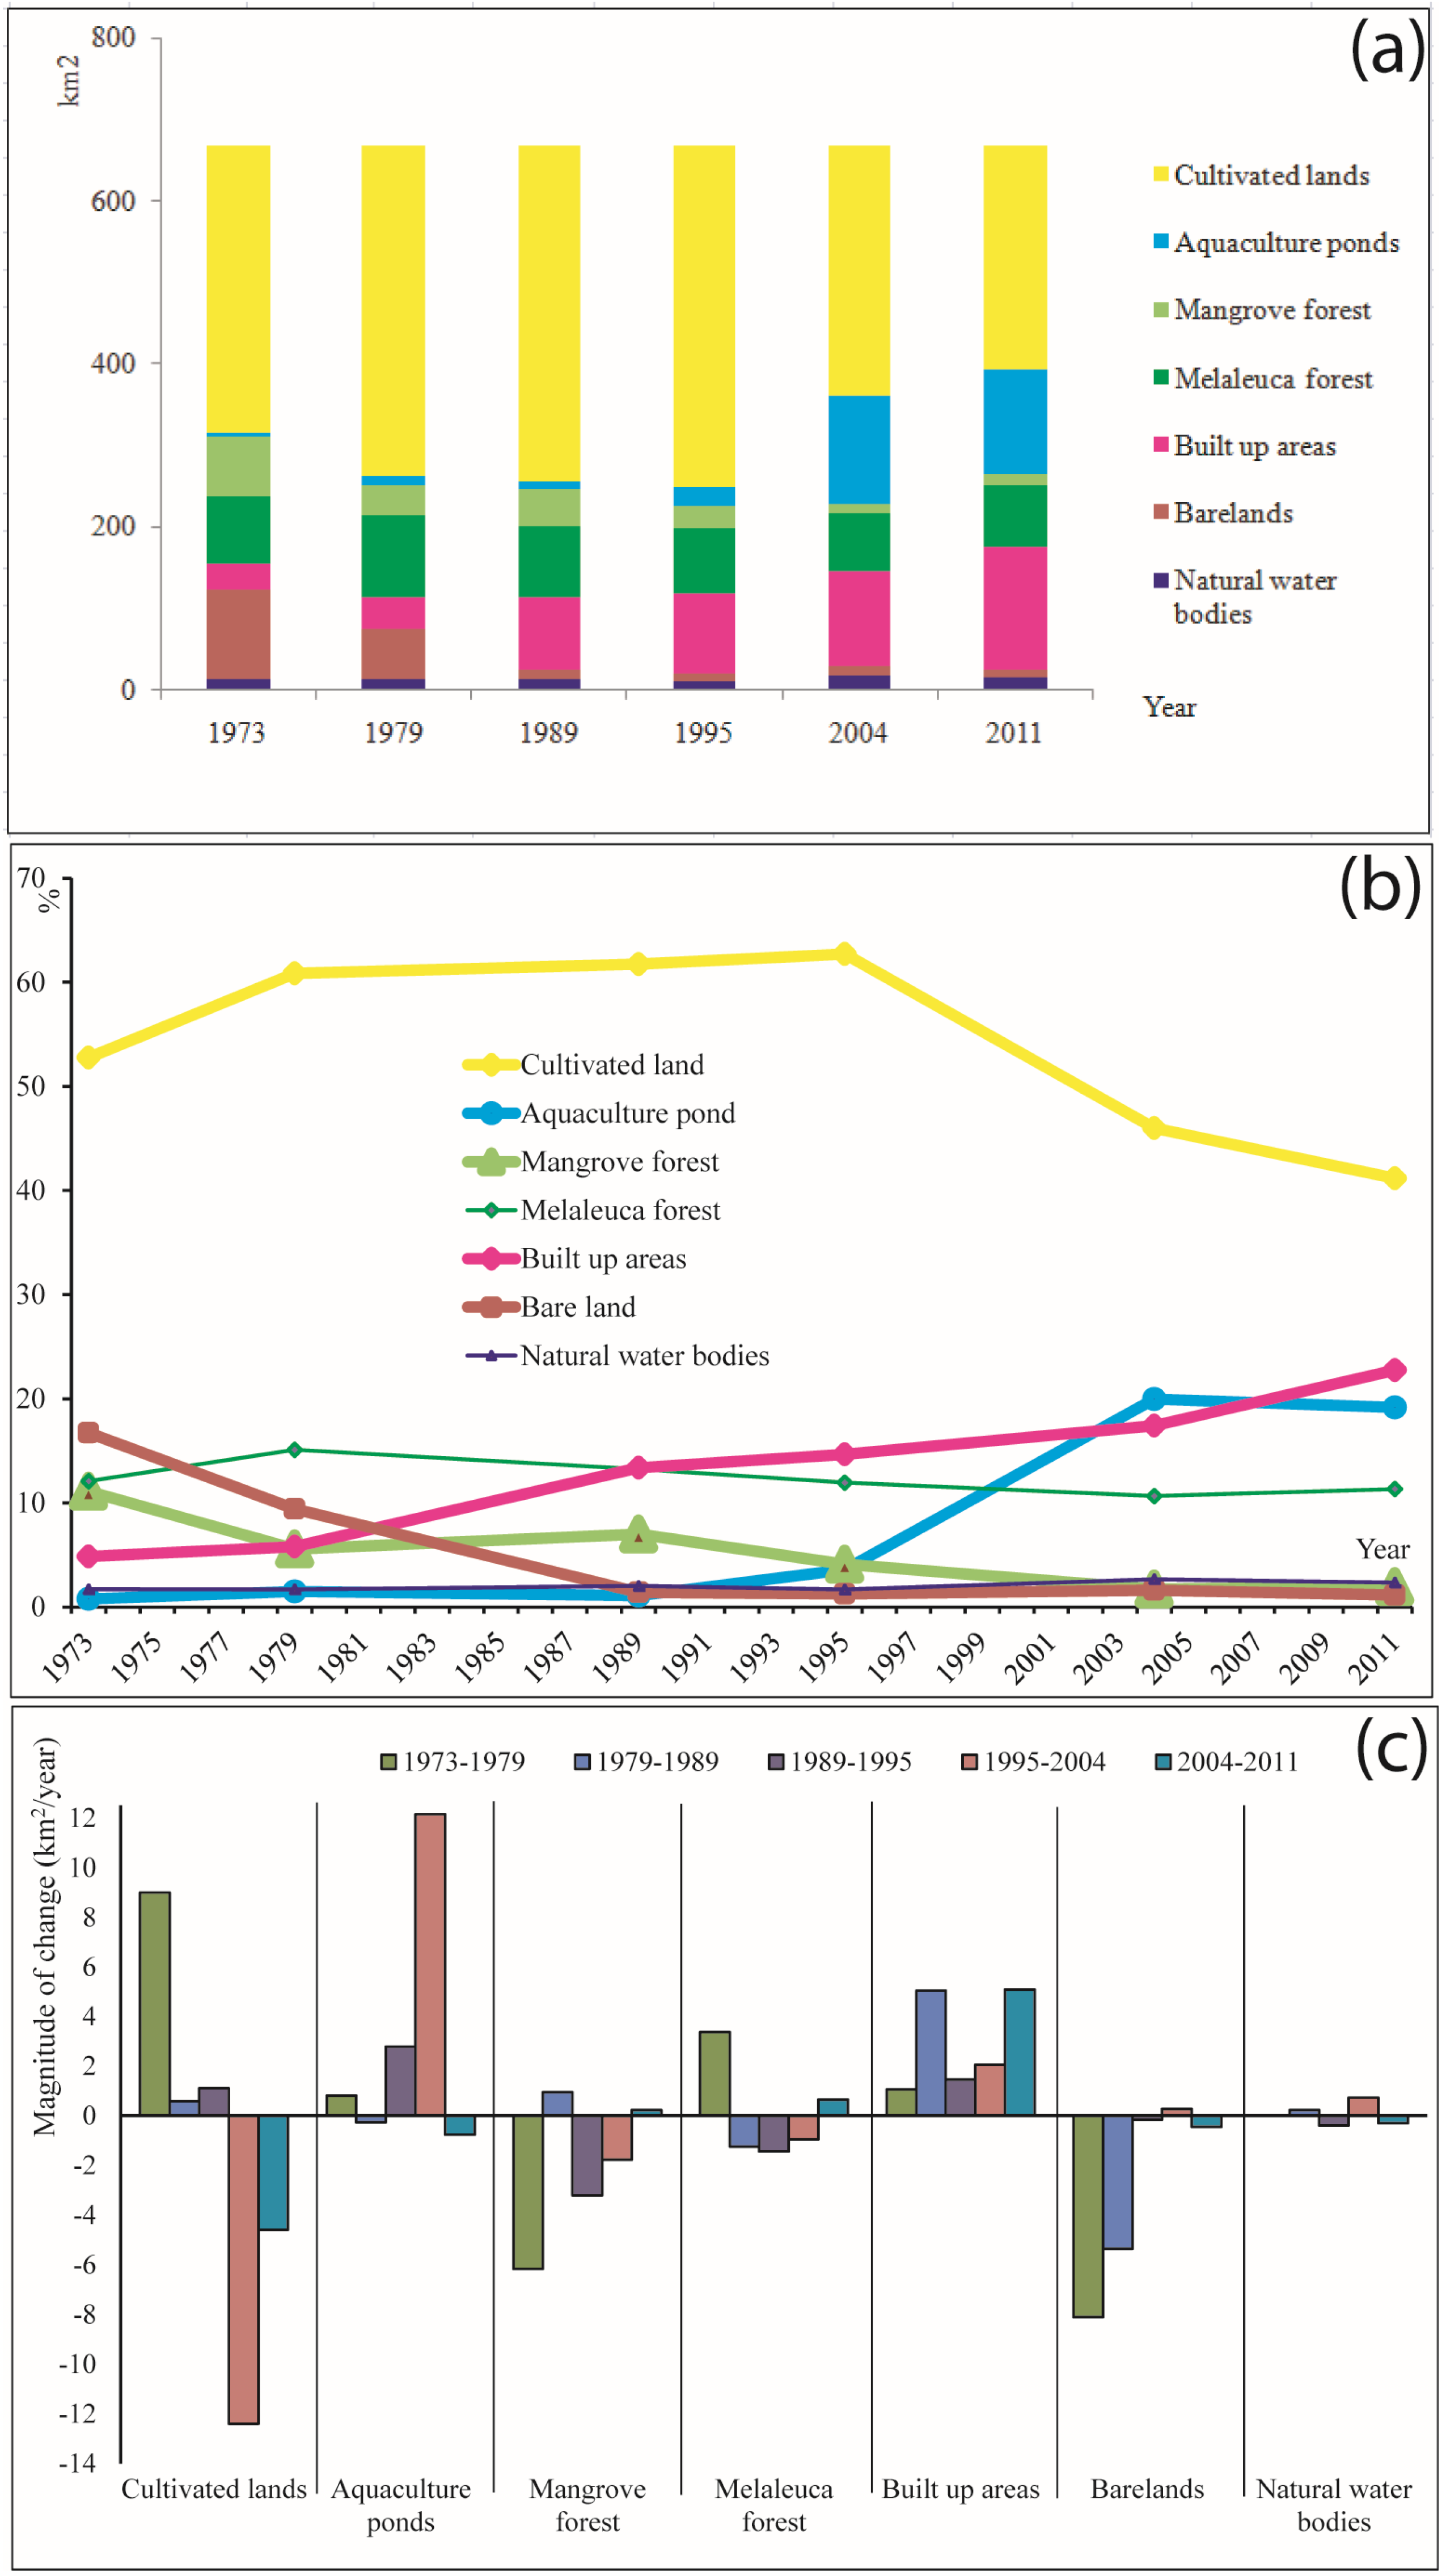
4.2. Tran Van Thoi District
4.2.1. Land Cover/Land Use Classification and Accuracy Assessment

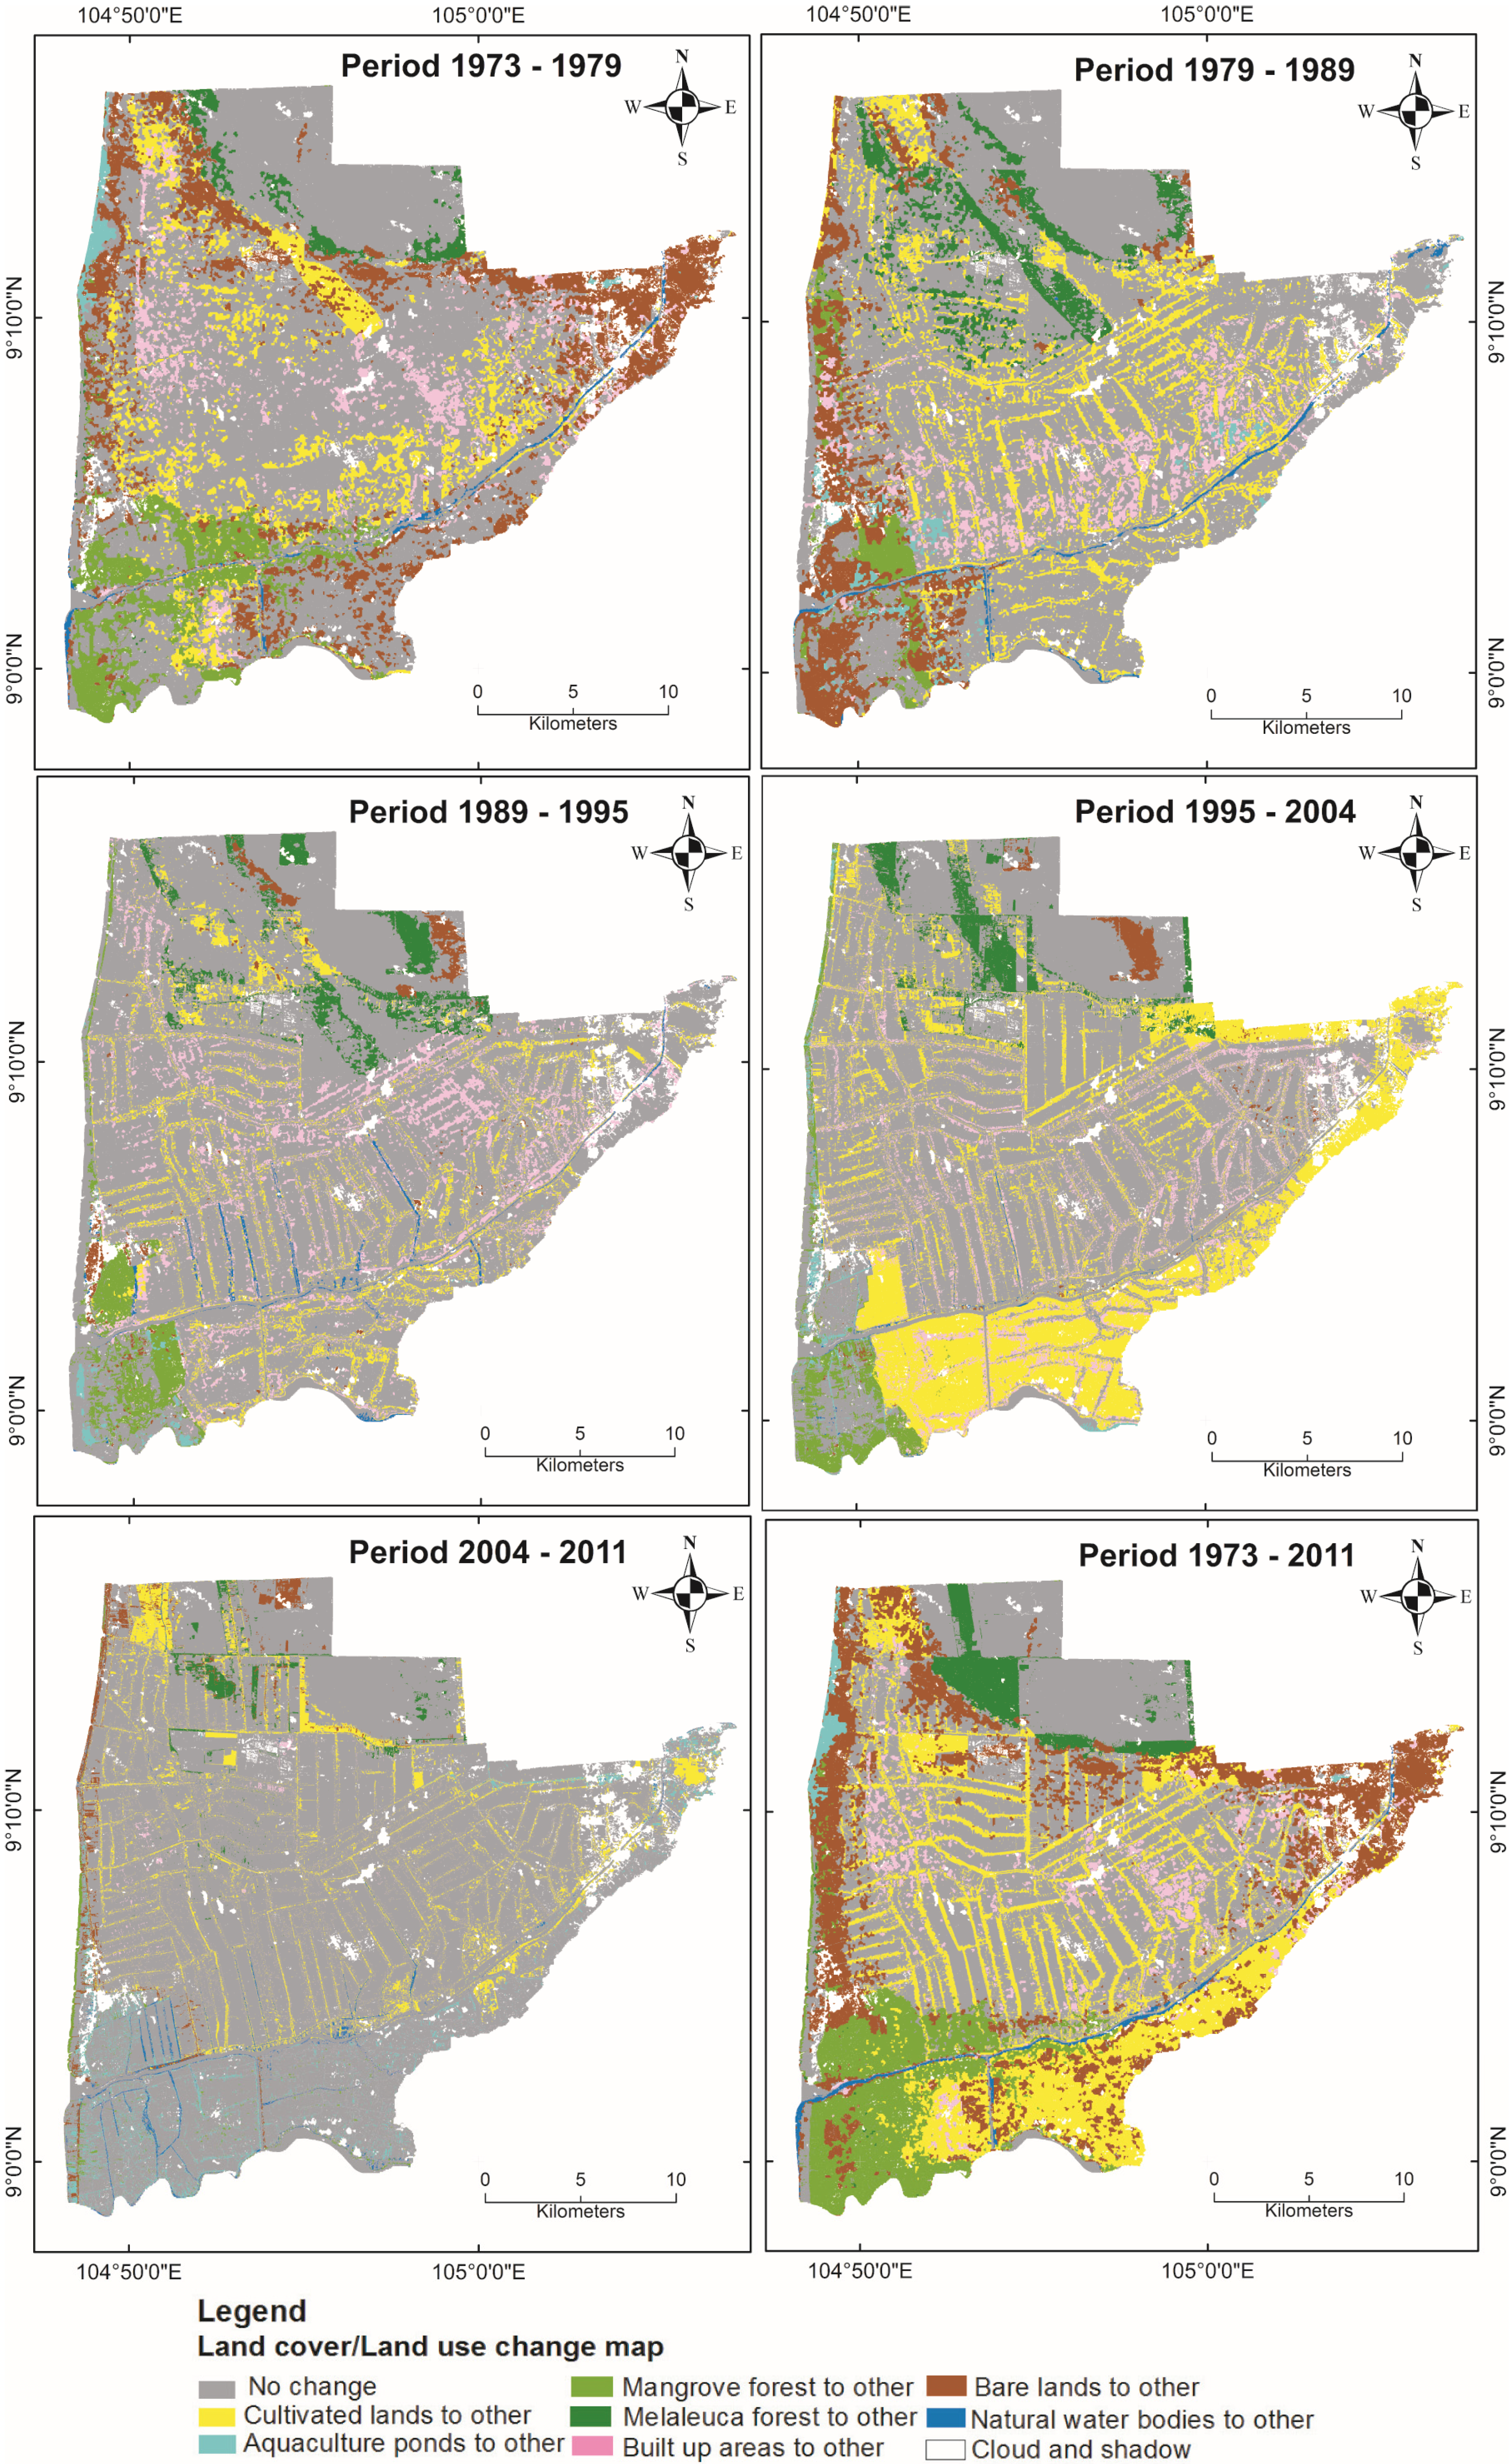
4.2.2. Land Cover/Land Use Change Detection


| Period 1973–1979 | Cu | Aq | Ma | Me | Bu | Ba | Na | Total | Expansion | |
| 1979 | Cultivated lands (Cu) | 303 | 2 | 14 | 5 | 7 | 74 | 3 | 406 | 103 |
| Aquaculture ponds (Aq) | 3 | 0 | 4 | 0 | 0 | 2 | 0 | 10 | 10 | |
| Mangrove forest (Ma) | 2 | 1 | 29 | 0 | 0 | 4 | 1 | 37 | 8 | |
| Melaleuca forest (Me) | 22 | 0 | 0 | 70 | 1 | 7 | 0 | 101 | 31 | |
| Built up areas (Bu) | 9 | 0 | 3 | 0 | 22 | 5 | 0 | 39 | 17 | |
| Bare lands (Ba) | 11 | 3 | 23 | 6 | 1 | 18 | 1 | 63 | 45 | |
| Natural water bodies (Na) | 2 | 0 | 0 | 0 | 0 | 1 | 7 | 11 | 4 | |
| Total | 352 | 5 | 74 | 81 | 32 | 112 | 11 | 667 | ||
| Reduction | 49 | 5 | 45 | 11 | 10 | 93 | 4 | |||
| Period 1979–1989 | Cu | Aq | Ma | Me | Bu | Ba | Na | Total | Expansion | |
| 1989 | Cultivated lands (Cu) | 334 | 5 | 9 | 28 | 6 | 26 | 3 | 412 | 78 |
| Aquaculture ponds (Aq) | 0 | 1 | 2 | 0 | 0 | 4 | 0 | 7 | 7 | |
| Mangrove forest (Ma) | 1 | 2 | 23 | 0 | 1 | 19 | 1 | 47 | 24 | |
| Melaleuca forest (Me) | 16 | 0 | 0 | 65 | 0 | 6 | 0 | 88 | 23 | |
| Built up areas (Bu) | 49 | 1 | 2 | 2 | 31 | 4 | 1 | 89 | 58 | |
| Bare lands (Ba) | 1 | 0 | 1 | 6 | 0 | 2 | 0 | 9 | 7 | |
| Natural water bodies (Na) | 5 | 0 | 0 | 0 | 1 | 1 | 6 | 13 | 7 | |
| Total | 406 | 10 | 37 | 101 | 39 | 63 | 11 | 667 | ||
| Reduction | 72 | 9 | 14 | 35 | 8 | 61 | 5 | |||
| Period 1989–1995 | Cu | Aq | Ma | Me | Bu | Ba | Na | Total | Expansion | |
| 1995 | Cultivated lands (Cu) | 387 | 0 | 6 | 17 | 4 | 2 | 3 | 419 | 32 |
| Aquaculture ponds (Aq) | 1 | 4 | 15 | 0 | 1 | 2 | 1 | 24 | 20 | |
| Mangrove forest (Ma) | 0 | 2 | 24 | 0 | 1 | 0 | 0 | 27 | 4 | |
| Melaleuca forest (Me) | 10 | 0 | 0 | 64 | 0 | 5 | 0 | 79 | 15 | |
| Built up areas (Bu) | 12 | 0 | 1 | 0 | 83 | 0 | 1 | 98 | 15 | |
| Bare lands (Ba) | 1 | 0 | 0 | 7 | 0 | 0 | 0 | 8 | 8 | |
| Natural water bodies (Na) | 2 | 0 | 0 | 0 | 1 | 0 | 8 | 11 | 3 | |
| Total | 412 | 7 | 47 | 88 | 89 | 9 | 14 | 667 | ||
| Reduction | 26 | 3 | 23 | 24 | 6 | 9 | 5 | |||
| Period 1995–2004 | Cu | Aq | Ma | Me | Bu | Ba | Na | Total | Expansion | |
| 2004 | Cultivated lands (Cu) | 284 | 0 | 0 | 17 | 4 | 1 | 1 | 307 | 23 |
| Aquaculture ponds (Aq) | 86 | 19 | 13 | 1 | 12 | 1 | 0 | 133 | 114 | |
| Mangrove forest (Ma) | 1 | 2 | 8 | 0 | 1 | 0 | 0 | 11 | 3 | |
| Melaleuca forest (Me) | 7 | 0 | 0 | 58 | 0 | 6 | 0 | 71 | 13 | |
| Built up areas (Bu) | 33 | 1 | 2 | 1 | 79 | 0 | 1 | 116 | 37 | |
| Bare lands (Ba) | 3 | 1 | 3 | 2 | 0 | 1 | 0 | 11 | 9 | |
| Natural water bodies (Na) | 5 | 1 | 1 | 0 | 1 | 0 | 9 | 18 | 8 | |
| Total | 419 | 24 | 27 | 80 | 98 | 8 | 11 | 667 | ||
| Reduction | 135 | 5 | 20 | 21 | 19 | 7 | 2 | |||
| Period 2004–2011 | Cu | Aq | Ma | Me | Bu | Ba | Na | Total | Expansion | |
| 2011 | Cultivated lands (Cu) | 261 | 1 | 0 | 5 | 3 | 3 | 1 | 275 | 14 |
| Aquaculture ponds (Aq) | 6 | 116 | 1 | 0 | 2 | 0 | 3 | 128 | 12 | |
| Mangrove forest (Ma) | 0 | 2 | 8 | 0 | 0 | 3 | 0 | 13 | 5 | |
| Melaleuca forest (Me) | 9 | 0 | 0 | 63 | 0 | 3 | 0 | 76 | 12 | |
| Built up areas (Bu) | 26 | 10 | 1 | 1 | 111 | 1 | 2 | 152 | 41 | |
| Bare lands (Ba) | 3 | 3 | 0 | 1 | 0 | 0 | 1 | 8 | 7 | |
| Natural water bodies (Na) | 1 | 1 | 2 | 0 | 0 | 0 | 12 | 16 | 4 | |
| Total | 307 | 133 | 11 | 71 | 116 | 11 | 18 | 667 | ||
| Reduction | 45 | 17 | 4 | 8 | 5 | 11 | 6 | |||
| Period 1973–2011 | Cu | Aq | Ma | Me | Bu | Ba | Na | Total | Expansion | |
| 2011 | Cultivated lands (Cu) | 196 | 2 | 9 | 15 | 6 | 46 | 0 | 275 | 79 |
| Aquaculture ponds (Aq) | 46 | 0 | 42 | 1 | 4 | 33 | 1 | 128 | 128 | |
| Mangrove forest (Ma) | 0 | 1 | 7 | 0 | 0 | 3 | 1 | 13 | 6 | |
| Melaleuca forest (Me) | 10 | 0 | 0 | 59 | 0 | 6 | 0 | 76 | 16 | |
| Built up areas (Bu) | 93 | 1 | 10 | 4 | 21 | 20 | 3 | 152 | 131 | |
| Bare lands (Ba) | 3 | 0 | 2 | 1 | 0 | 1 | 0 | 8 | 7 | |
| Natural water bodies (Na) | 3 | 0 | 4 | 0 | 0 | 2 | 6 | 16 | 9 | |
| Total | 352 | 5 | 74 | 81 | 32 | 112 | 11 | 667 | ||
| Reduction | 155 | 5 | 67 | 21 | 11 | 111 | 5 | |||
5. Discussion
5.1. Accuracy and Limitations of the Method
5.2. Comparison with Previous Studies in Ca Mau Province
5.3. Potential Drivers of Land Cover/Land Use Changes
5.3.1. Reduction in Forest Land Covers
5.3.2. Increase in Aquaculture Ponds
5.3.3. Increase in Built Up Areas
5.3.4. Decrease in Cultivated Land
5.3.5. Environmental Drivers of Land Cover Changes
6. Conclusions and Perspectives
Acknowledgments
Author Contributions
Conflicts of Interest
References
- Overmars, K.P.; Verburg, P.H. Analysis of land use drivers at the watershed and household level: Linking two paradigms at the Philippine forest fringe. Int. J. Geogr. Inf. Sci. 2005, 19, 125–152. [Google Scholar] [CrossRef]
- Foody, G.M. Status of land cover classification accuracy assessment. Remote Sens. Environ. 2002, 80, 185–201. [Google Scholar] [CrossRef]
- Intergovernmental Panel on Climate Change (IPCC). Climate Change 2007: Impacts, Adaptation and Vulnerability; Cambridge University Press: New York, NY, USA, 2007. [Google Scholar]
- Intergovernmental Panel on Climate Change (IPCC). Climate Change 2014: Impacts, Adaptation and Vulnerability; Cambridge University Press: New York, NY, USA, 2014. [Google Scholar]
- Lambin, E.R.; Geist, H.J.; Lepers, E. Dynamics of land-use and land-cover change in tropical regions. Ann. Rev. Environ. Resour. 2003, 28, 205–241. [Google Scholar] [CrossRef]
- Manandhar, R.; Odeh, I.O.A.; Ancev, T. Improving the accuracy of land use and land cover classification of Landsat data using post-classification enhancement. Remote Sens. 2009, 1, 330–344. [Google Scholar] [CrossRef]
- Potter, C.; Genovese, V.; Gross, P.; Boriah, S.; Steinbach, M.; Kumar, V. Revealing land cover change in California with satellite data. EOS Trans. Am. Geophys. Union 2007, 88, 269–276. [Google Scholar] [CrossRef]
- Sala, O.E.; Chapin, F.S.; Armesto, J.J.; Berlow, E.; Bloomfield, J.; Dirzo, R.; Sanwald, E.H.; Huenneke, L.F.; Jackson, R.B.; Kinzig, A.; et al. Global biodiversity scenarios for the year 2100. Science 2000, 287, 1770–1774. [Google Scholar] [CrossRef] [PubMed]
- Tian, Y.; Yin, K.; Lu, D.; Hua, L.; Zhao, Q.; Wen, M. Examining land use and land cover spatiotemporal change and driving forces in Beijing from 1978 to 2010. Remote Sens. 2014, 6, 10593–10611. [Google Scholar] [CrossRef]
- Trimble, S.W.; Crosson, P.U.S. soil erosion rates—Myth and reality. Science 2000, 289, 248–250. [Google Scholar] [CrossRef] [PubMed]
- Millennium Ecosystem Assessment. Ecosystem and Human Well-Being; Island Press: Washington, DC, USA, 2003. [Google Scholar]
- Lambin, E.F.; Geist, H.J. Land Use and Land Cover Change: Local Processes and Global Impacts; Springer: Berlin, Germany, 2006. [Google Scholar]
- Binh, T.N.K.D.; Vromant, N.; Hung, N.T.; Hens, L.; Boon, E.K. Land cover changed between 1968 and 2003 in Cai Nuoc, Ca Mau penisula, Vietnam. Environ. Dev. Sustain. 2005, 7, 519–536. [Google Scholar] [CrossRef]
- Lam-Dao, N.; Pham-Bach, V.; Nguyen-Thanh, M.; Pham-Thi, M.; Hoang-Phi, P. Change detection of land use and river bank in Mekong Delta, Vietnam using time series remotely sensed data. J. Resour. Ecol. 2011, 2, 370–374. [Google Scholar]
- Thu, P.M. Application of remote sensing and GIS tools for recognizing changes of mangrove forests in Ca Mau province. In Proceedings of the International Symposium on Geoinformatics for Spatial Infrastructure Development in Earth and Allied Sciences, Ho Chi Minh City, Vietnam, 9–11 November 2006.
- Karila, K.; Nevalainen, O.; Krooks, A.; Karjalainen, M.; Kaasalainen, S. Monitoring changes in rice cultivated area from SAR and optical satellite images in Ben Tre and Tra Vinh provinces in Mekong delta, Vietnam. Remote Sens. 2014, 6, 4090–4108. [Google Scholar] [CrossRef]
- Sakamoto, T.; Nguyen, N.V.; Ohno, H.; Ishitsuka, N.; Yokozawa, M. Spatio-temporal distribution of rice phenology and cropping systems in the Mekong Delta with special reference to the seasonal water flow of the Mekong and Bassac rivers. Remote Sens. Environ. 2006, 100, 1–16. [Google Scholar] [CrossRef]
- Sohail, A. Mapping Landcover/Landuse and Coastline Change in the Eastern Mekong Delta (Viet Nam) from 1989 to 2002 using Remote Sensing. Master’s Thesis, Royal Institute of Technology, Stockholm, Sweden, 2012. [Google Scholar]
- Giri, C.; Defourny, P.; Shrestha, S. Land cover characterization and mapping of continental Southeast Asia using multi-resolution satellite sensor data. Int. J. Remote Sens. 2003, 24, 4181–4196. [Google Scholar] [CrossRef]
- Sakamoto, T.; Phung, C.V.; Kotera, A.; Nguyen, K.D.; Yokozawa, M. Analysis of rapid expansion of inland aquaculture and triple rice-cropping areas in a coastal area of the Vietnamese Mekong Delta using MODIS time-series imagery. Landsc. Urban Plan. 2009, 92, 34–46. [Google Scholar] [CrossRef]
- Dahdouh-Guebas, F.; Jayatissa, L.P.; Di Nitto, D.; Bosire, J.O.; Lo Seen, D.; Koedam, N. How effective were mangroves as a defence against the recent tsunami? Current Boil. 2005, 15, 443–447. [Google Scholar] [CrossRef]
- Suzuki, K. An ecological study of melaleuca communities in littoral swamps. Eco-Habitat 1999, 6, 133–141. [Google Scholar]
- Abdulaziz, A.M.; Hurtado, J.M.; Al-Douri, R. Application of multitemporal Landsat data to monitor land cover changes in the Eastern Nile Delta region, Egypt. Int. J. Remote Sens. 2009, 30, 2977–2996. [Google Scholar] [CrossRef]
- Gitau, M.; Bailey, N. Multi-layer assessment of land use and related changes for decision support in a coastal zone watershed. Land 2012, 1, 5–31. [Google Scholar] [CrossRef]
- Prabaharan, S.; Srinivasa Raju, K.; Lakshumanan, C.; Ramalingam, M. Remote sensing and GIS applications on change detection study in coastal zone using multi temporal satellite data. Int. J. Geomat. Geosci. 2010, 1, 159–166. [Google Scholar]
- Shalaby, A.; Tateishi, R. Remote sensing and GIS for mapping and monitoring land cover and land-use changes in the Northwestern coastal zone of Egypt. Appl. Geogr. 2007, 27, 28–41. [Google Scholar] [CrossRef]
- Sheeja, R.V.; Joseph, S.; Jaya, D.S.; Baiju, R.S. Land use and land cover changes over a century (1914–2007) in the Neyyar River Basin, Kerala: A remote sensing and GIS approach. Int. J. Digit. Earth 2010, 4, 258–270. [Google Scholar] [CrossRef]
- Weng, Q. Land use change analysis in the Zhujiang Delta of China using satellite remote sensing, GIS and stochastic modelling. J. Environ. Manag. 2002, 64, 273–284. [Google Scholar] [CrossRef]
- Yang, X.; Liu, Z. Using satellite imagery and GIS for land-use and land-cover change mapping in an estuarine watershed. Int. J. Remote Sens. 2005, 26, 5275–529. [Google Scholar] [CrossRef]
- Rodriguez-Galiano, V.; Chica-Olmo, M. Land cover change analysis of a mediterranean area in Spain using different sources of data: Multi-seasonal Landsat images, land surface temperature, digital terrain models and texture. Appl. Geogr. 2012, 35, 208–218. [Google Scholar] [CrossRef]
- Pham, H.M.; Yamaguchi, Y. Urban growth and change analysis using remote sensing and spatial metrics from 1975 to 2003 for Hanoi, Vietnam. Int. J. Remote Sens. 2011, 32, 1901–1915. [Google Scholar] [CrossRef]
- Pham, H.M.; Yamaguchi, Y.; Bui, T.Q. A case study on the relation between city planning and urban growth using remote sensing and spatial metrics. Landsc. Urban Plan. 2011, 100, 223–230. [Google Scholar] [CrossRef]
- Hai, P.M.; Yamaguchi, Y. Characterizing the urban growth of Hanoi, Nagoya, and Shanghai city using remote sensing and spatial metrics. In Proceedings of Geoscience and Remote Sensing Symposium, Boston, MA, USA, 7–11 July 2008.
- Shi, Y.; Sun, X.; Zhu, X.; Li, Y.; Mei, L. Characterizing growth types and analyzing growth density distribution in response to urban growth patterns in peri-urban areas of Lianyungang City. Landsc. Urban Plan. 2012, 105, 425–433. [Google Scholar] [CrossRef]
- Corner, R.J.; Ongee, E.T.; Dewan, A.M. Spatiotemporal patterns of population distribution. In Dhaka Megacity; Springer Netherlands: Dordrecht, The Netherlands, 2014; pp. 45–60. [Google Scholar]
- Dewan, A.M.; Kabir, M.H.; Nahar, K.; Rahman, M.Z. Urbanisation and environmental degradation in Dhaka Metropolitan Area of Bangladesh. Int. J. Environ. Sustain. Dev. 2012, 11, 118–147. [Google Scholar] [CrossRef]
- Dewan, A.M.; Yamaguchi, Y. Land use and land cover change in Greater Dhaka, Bangladesh: Using remote sensing to promote sustainable urbanization. Appl. Geogr. 2009, 29, 390–401. [Google Scholar] [CrossRef]
- Dewan, A.M.; Yamaguchi, Y. Using remote sensing and GIS to detect and monitor land use and land cover change in Dhaka Metropolitan of Bangladesh during 1960–2005. Environ. Mornit. Assess. 2009, 150, 237–249. [Google Scholar] [CrossRef]
- Byomkesh, T.; Nakagoshi, N.; Dewan, A.M. Urbanization and green space dynamics in Greater Dhaka, Bangladesh. Landscape Ecol. Eng. 2012, 8, 45–58. [Google Scholar] [CrossRef]
- Yin, Z.Y.; Stewart, D.J.; Bullard, S.; MacLachlan, J.T. Changes in urban built-up surface and population distribution patterns during 1986–1999: A case study of Cairo, Egypt. Comput. Environ. Urban Syst. 2005, 29, 595–616. [Google Scholar] [CrossRef]
- Dewan, A.M.; Yamaguchi, Y.; Rahman, M.Z. Dynamics of land use/cover changes and the analysis of landscape fragmentation in Dhaka Metropolitan, Bangladesh. GeoJournal 2012, 77, 315–330. [Google Scholar] [CrossRef]
- Ca Mau Province Statistics Office. Ca Mau. Statistical Yearbook 2011; Ca Mau Province Statistics Office: Ca Mau, Vietnam, 2011.
- Hien, T.T.; Minh, V.Q.; Huong, H.T.T.; Dan, T.T.; Chien, H.V.; An, N.H.; Thanh, N.P. Theo Dõi Hiện Trạng Trà Lúa Phục Vụ Cảnh Báo Dịch Hại Lúa Trên Cơ Sở sử Dụng Công Nghệ viễn Thám và Hệ Thống Thông Tin Địa Lý GIS. Available online: http://tapchikhoahoc.ctu.edu.vn/index.php/nam2013/cat_view/128-t-p-chi-kh-dhct/141-nam-2013/156-s-chuyen-d (accessed on 9 January 2015).
- Nguyen, T.T.H.; de Bie, C.A.J.M.; Ali, A.; Smaling, E.M.A.; Chu, T.H. Mapping the irrigated rice cropping patterns of the Mekong delta, Vietnam, through hyper-temporal SPOT NDVI image analysis. Int. J. Remote Sens. 2012, 33, 415–434. [Google Scholar] [CrossRef]
- FAO Statistical Database (FAOSTAT). Available online: http://faostat3.fao.org (accessed on 5 May 2014).
- Gebhardt, S.; Huth, J.; Nguyen, L.D.; Roth, A.; Kuenzer, C. A comparison of TerraSAR-X Quadpol backscattering with RapidEye multispectral vegetation indices over rice fields in the Mekong Delta, Vietnam. Int. J. Remote Sens. 2012, 33, 7644–7661. [Google Scholar] [CrossRef]
- Steward, M.A.; Coclanis, P.A. Environmental Change and Agricultural Sustainability in the Mekong Delta; Springer Dordrecht Heidelberg: London, UK, 2011. [Google Scholar]
- Hong, P.N.; San, H.T. Mangroves in Vietnam; IUCN (The International Union for Conservation of Nature and Natural Resources): Bangkok, Thailand, 1993. [Google Scholar]
- Nhu, O.L.; Thuy, N.T.T.; Wilderspin, I.; Coulier, M. A Preliminary Analysis of Flood and Storm Disaster Data in Viet Nam. Available online: http://www.desinventar.net/doc/Viet_Nam_2011.pdf (accessed on 9 January 2015).
- Herold, M.; Goldstein, N.C.; Clarke, K.C. The spatiotemporal form of urban growth: Measurement, analysis and modeling. Remote Sens. Environ. 2003, 86, 286–302. [Google Scholar] [CrossRef]
- Serra, P.; Pons, X.; Sauri, D. Land cover and land use change in a Mediterranean landscape. Appl. Geogr. 2008, 28, 189–209. [Google Scholar] [CrossRef]
- Anderson, J.R.; Hardy, E.E.; Roach, J.T.; Witmer, R.E. A Land Use and Land Cover Classification System for Use with Remote Sensor Data; United States Government Printing Office: Washington, DC, USA, 1976. [Google Scholar]
- Campbell, J.B.; Wynne, R.H. Introduction to Remote Sensing, 5th ed.; The Guiford Press: New York, NY, USA, 2011. [Google Scholar]
- Coppin, P.; Jonckheere, I.; Nackaerts, K.; Muys, B.; Lambin, E. Review ArticleDigital change detection methods in ecosystem monitoring: A review. Int. J Remote Sens. 2004, 25, 1565–1596. [Google Scholar] [CrossRef]
- Were, K.O.; Dick, O.B.; Singh, B.R. Remotely sensing the spatial and temporal land cover changes in Eastern Mau forest reserve and Lake Nakuru drainage basin, Kenya. Appl. Geogr. 2013, 41, 75–86. [Google Scholar] [CrossRef]
- Lillesand, T.M.; Kiefer, R.W.; Chipman, J.W. Remote Sensing and Image Presentation, 5th ed.; Wiley: New Jersey, NJ, USA, 2004. [Google Scholar]
- Lu, D.; Mausel, P.; Brondízio, E.; Moran, E. Change detection techniques. Int. J. Remote Sens. 2004, 25, 2365–2407. [Google Scholar] [CrossRef]
- Singh, A. Digital change detection techniques using remotely-sensed data. Int. J. Remote Sens. 1989, 10, 989–1003. [Google Scholar] [CrossRef]
- Knudby, A.; Newman, C.; Shaghude, Y.; Muhando, C. Simple and effective monitoring of historic changes in nearshore environments using the free archive of Landsat imagery. Int. J. Appl. Earth Obs. Geoinf. 2010, 12, S116–S122. [Google Scholar] [CrossRef]
- Roy, D.P.; Ju, J.; Kline, K.; Scaramuzza, P.L.; Kovalskyy, V.; Hansen, M.; Loveland, T.R.; Vermote, E.; Zhang, C. Web-enabled LANDSAT Data (WELD): LANDSAT ETM+ composited mosaics of the conterminous United States. Remote Sens. Environ. 2010, 114, 35–49. [Google Scholar] [CrossRef]
- Vo, Q.T.; Oppelt, N.; Leinenkugel, P.; Kuenzer, C. Remote sensing in mapping mangrove ecosystems—An object-based approach. Remote Sens. 2013, 5, 183–201. [Google Scholar] [CrossRef]
- Perkins, T.; Adler-Golden, S.; Matthew, M.; Berk, A.; Anderson, G.; Gardner, J.; Felde, G. Retrieval of atmospheric properties from hyper and multispectral imagery with the FLAASH atmospheric correction algorithm. In Proceedings of SPIE 5979, Remote Sensing of Clouds and the Atmosphere X, Bruges, Belgium, 1 November 2005.
- FAO Corporate Document Repository. Land Cover Classification System—Classification Concepts and User Manual Software Version (2); Natural Resources Management and Environment Department of FAO: Rome, Italy, 2005. [Google Scholar]
- U.S. Geological Survey (USGS). National Land Cover Database (NLCD). Available online: http://www.mrlc.gov/nlcd2006.php (accessed on 16 August 2012).
- Bolstad, P.V.; Lillesand, T.M. Rapid maximum likelihood classification. Photogramm. Eng. Remote Sens. 1991, 57, 67–74. [Google Scholar]
- Richards, J.A.; Jia, X. Remote Sensing Digital Image Analysis, 4th ed.; Springer-Verlag: Berlin/Heidelberg, Germany, 2006. [Google Scholar]
- Owojori, A.O.; Xie, H. Landsat image-based land use land cover changes of San Antonio, Texas using advanced atmospheric correction and object-oriented image analysis approaches. In Proceedings of the 5th International Symposium on Remote Sensing of Urban Areas, Tempe, AZ, USA, 14–16 March 2005.
- Congalton, R.S. A review of assessing the accuracy of classifications of remotely sensed data. Remote Sens. Environ. 1991, 37, 35–46. [Google Scholar]
- Treitz, P.; Rogan, J. Remote sensing for mapping and monitoring land-cover and land-use change: An introduction. Progress Plan. 2004, 61, 269–279. [Google Scholar] [CrossRef]
- Lan, N.T.P. From rice to shrimp: Ecological change and human adaptation in the Mekong delta of Vietnam. Environ. Change Agr. Sustain. Mekong Delta Adv. Glob. Change Res. 2011, 45, 271–285. [Google Scholar]
- Hatfield Consultants Ltd. Using Radarsat Imagery to Assess Residual Environmental Effects of the Vietnam War (1961–1975); Hatfield Consultants Ltd.: West Vancouver, BC, Canada, 1998. [Google Scholar]
- Carrier, J.M. The Effects of Herbicides in South Vietnam; National Academy of Sciences: Washington, DC, USA, 1974. [Google Scholar]
- Teas, H.J.; Kelly, J. Effects of herbicides on mangroves of South Vietnam and Florida. In Proceedings of the International Symposium on Biology and Management of Mangroves, Gainesville, FL, USA, 8–11 October 1974.
- War Remnants Museum. Available online: http://warremnantsmuseum.com/ (accessed on 9 January 2015).
- Arnaud-Haond, S.; Duarte, C.M.; Teixeira, S.; Massa, S.I.; Terrados, J.; Tri, N.H.; Hong, P.N.; Serrão, E.A. Genetic recolonization of mangrove: genetic diversity still increasing in the Mekong Delta 30 years after Agent Orange. Mar. Ecol. Prog. Ser. 2009, 390, 129–135. [Google Scholar] [CrossRef]
- Boothroyd, P.; Nam, P.X. Socioeconomic Renovation in Vietnam: The Origin, Evolution and Impact of Doi Moi; International Development Research Centre: Ottawa, ON, Canada; Institute of Southeast Asian Studies: Pasir Panjang, Singapore, 2000. [Google Scholar]
- Irvin, G. Vietnam: Assessing the achievements of Doi Moi. J. Dev. Stud. 1995, 31, 725–750. [Google Scholar] [CrossRef]
- Resolution No 09/2000/NQ-CP of Vietnam Government. Available online: http://thuvienphapluat.vn/archive/Nghi-quyet-09-2000-NQ-CP-chu-truong-va-chinh-sach-ve-chuyen-dich-co-cau-kinh-te-va-tieu-thu-san-pham-nong-nghiep-vb8415.aspx (accessed on 18 October 2013).
- Resolution 1116/QĐ-CTUB of People’s Committee of Ca Mau Province (Ca Mau Province, Vietnam). Unpublished work. 2001.
- Sathirathai, S.; Barbier, E.B. Valuing mangrove conservation in southern Thailand. Contemp. Econ. Policy 2001, 19, 109–122. [Google Scholar] [CrossRef]
- Asian Development Bank (ADB). Socialist Republic of Viet Nam: Climate Change Impact and Adaptation Study in the Mekong Delta; Asian Development Bank: Manila, Philippines, 2011. [Google Scholar]
- Carew-Reid, J. Rapid Assessment of the Extent and Impact of Sea Level Rise in Viet Nam; International Centre for Environmental Management (ICEM): Brisbane, Australia, 2007. [Google Scholar]
- Ca Mau Province Statistics Office. Ca Mau. Statistical Yearbook 2000; Ca Mau Province Statistics Office: Ca Mau, Vietnam, 2000.
- Cao, L.; Wang, W.; Yang, Y.; Yang, C.; Yuan, Z.; Xiong, S.; Diana, J. Environmental impact of aquaculture and countermeasures to aquaculture pollution in China. Env. Sci. Pollut. Res. 2007, 14, 452–462. [Google Scholar] [CrossRef]
- Eng, C.T.; Paw, J.N.; Guarin, F.Y. The environmental impact of aquaculture and the effects of pollution on coastal aquaculture development in Southeast Asia. Mar. Pollut. Bull. 1989, 20, 335–343. [Google Scholar] [CrossRef]
- Ca Mau Province Statistics Office. Ca Mau. Statistical Yearbook 2008; Ca Mau Province Statistics Office: Ca Mau, Vietnam, 2008.
- Grimm, N.B.; Faeth, S.H.; Golubiewski, N.E.; Redman, C.L.; Wu, J.; Bai, X.; Briggs, J.M. Global change and the ecology of cities. Science 2008, 319, 756–760. [Google Scholar] [CrossRef] [PubMed]
- Hansen, A.J.; Rasker, R.; Maxwell, B.; Rotella, J.; Johnson, J.D.; Parmenter, A.W.; Langner, U.; Cohen, W.B.; Lawrence, R.L.; Kraska, P.V. Ecological causes and consequences of demographic change in the New West. BioScience 2002, 52, 151–162. [Google Scholar] [CrossRef]
- Bhatta, B.; Saraswati, S.; Bandyopadhyay, D. Quantifying the degree-of-freedom, degree-of-sprawl, and degree-of-goodness of urban growth from remote sensing data. Appl. Geogr. 2010, 30, 96–111. [Google Scholar] [CrossRef]
- Stewart, D.J.; Yin, Z.Y.; Bullard, S.M.; MacLachlan, J.T. Assessing the spatial structure of urban and population growth in the Greater Cairo area, Egypt: A GIS and imagery analysis approach. Urban Stud. 2004, 4, 95–116. [Google Scholar] [CrossRef]
- Chi, T.T.N. Factors affecting technology adoption among rice farmers in the Mekong Delta through the lens of the local authorial managers: An analysis of qualitative data. Omonrice 2008, 16, 107–112. [Google Scholar]
- Asian Disaster Preparedness Center (ADPC). Climate Protection Programme: Climate Change and Development in Vietnam: Agriculture and Adaptation for the Mekong Delta Region; Deutsche Gesellschaft für Technische Zusammenarbeit: Eschborn, Germany, 2003; pp. 1–30. [Google Scholar]
- Be, T.T.; Sinh, B.T.; Miller, F. Challenges to Sustainable Development in the Mekong Delta: Regional and National Policy Issues and Research Needs; The Sustainable Mekong Research Network: Bangkok, Thailand, 2007. [Google Scholar]
- Doyle, T.W.; Day, R.H.; Michot, T.C. Development of Sea Level Rise Sciennarios for Climate Change Assessments of the Mekong Delta, Vietnam; U.S. Geological Survey: Denver, CO, USA, 2010.
- Hens, L.; Vromant, N.; Tho, N.; Hung, N.T. Salination of surface water, groundwater, and soils in the shrimp farming areas of the coastal Cai Nuoc district, South Vietnam. Int. J. Environ. Stud. 2009, 66, 69–81. [Google Scholar] [CrossRef]
- Vietnamese Ministry of Natural Resources and Envinronment (MONRE). Scienarios for Climate Change and Sea Level Rise for Vietnam; Vietnam Publishing House of Natural Resources, Environment, and Cartography: Hanoi, Vietnam, 2012.
- Tho, N.; Vromant, N.; Hung, N.T.; Hens, L. Soil salinity and sodicity in a shrimp farming coastal area of the Mekong Delta, Vietnam. Environ. Geol. 2008, 54, 1739–1746. [Google Scholar] [CrossRef]
- WISDOM Project, A German-Vietnamese Initiative. Available online: http://www.wisdom.caf.dlr.de/en/content/mekong-delta-vietnam.html (accessed on 27 June 2013).
© 2015 by the authors; licensee MDPI, Basel, Switzerland. This article is an open access article distributed under the terms and conditions of the Creative Commons Attribution license (http://creativecommons.org/licenses/by/4.0/).
Share and Cite
Tran, H.; Tran, T.; Kervyn, M. Dynamics of Land Cover/Land Use Changes in the Mekong Delta, 1973–2011: A Remote Sensing Analysis of the Tran Van Thoi District, Ca Mau Province, Vietnam. Remote Sens. 2015, 7, 2899-2925. https://0-doi-org.brum.beds.ac.uk/10.3390/rs70302899
Tran H, Tran T, Kervyn M. Dynamics of Land Cover/Land Use Changes in the Mekong Delta, 1973–2011: A Remote Sensing Analysis of the Tran Van Thoi District, Ca Mau Province, Vietnam. Remote Sensing. 2015; 7(3):2899-2925. https://0-doi-org.brum.beds.ac.uk/10.3390/rs70302899
Chicago/Turabian StyleTran, Hanh, Thuc Tran, and Matthieu Kervyn. 2015. "Dynamics of Land Cover/Land Use Changes in the Mekong Delta, 1973–2011: A Remote Sensing Analysis of the Tran Van Thoi District, Ca Mau Province, Vietnam" Remote Sensing 7, no. 3: 2899-2925. https://0-doi-org.brum.beds.ac.uk/10.3390/rs70302899