
Validation of a Simplified Model to Generate Multispectral Synthetic Images


Abstract
:
1. Introduction
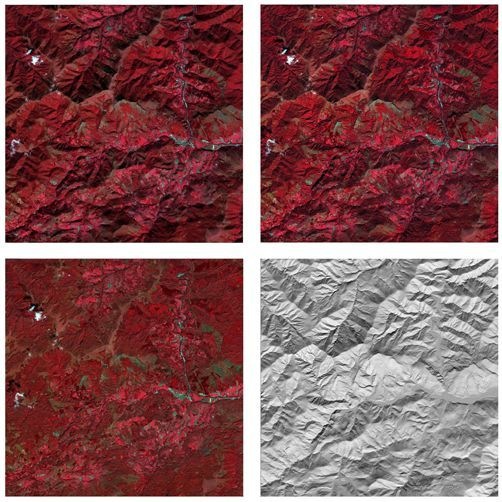
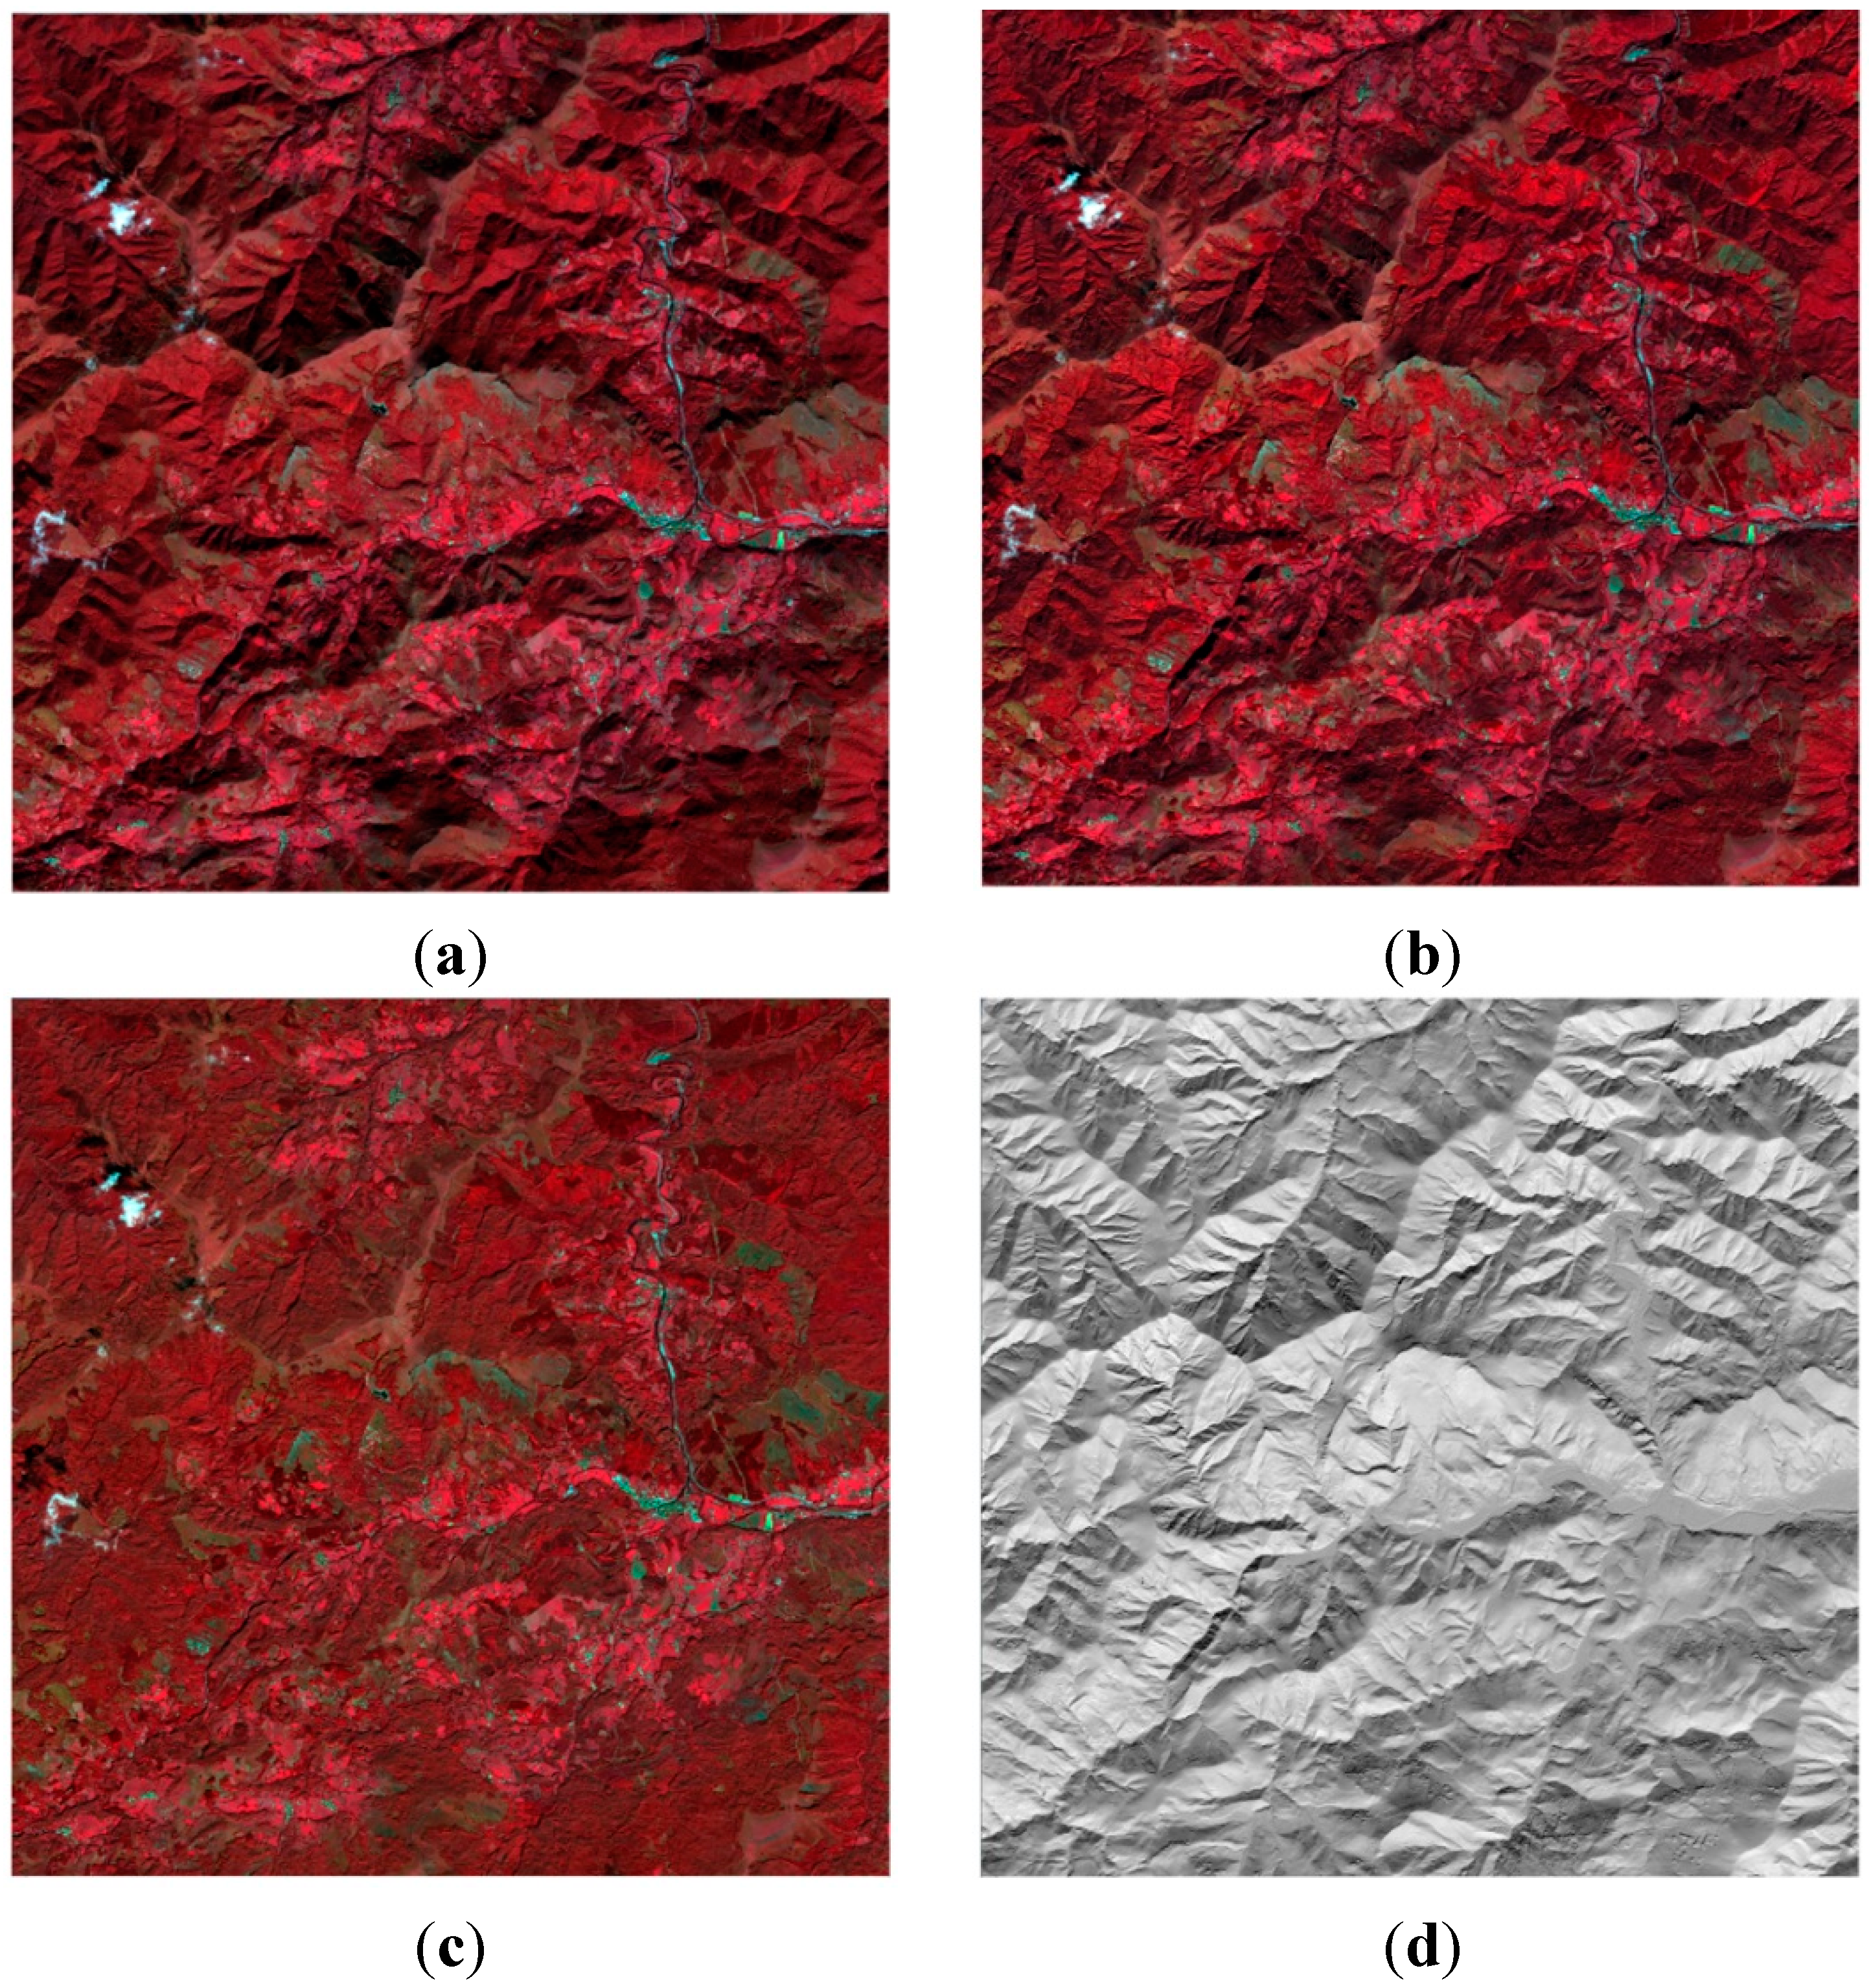
2. Study Area

| Area | Center Lat/Long | Sensor Zenith | Date | Time | Sun Elevation | Sun Azimuth |
|---|---|---|---|---|---|---|
| 1 | 43°08'35"N/1°42'54"W | 12.6 | 15/10/2009 | 11:13 | 37.66 | 167.58 |
| 2 | 42°46'40"N/1°19'09"W | −24.3 | 15/08/2009 | 10:45 | 56.44 | 140.70 |
| 3 | 42°43'28"N/0°49'55"W | 14.5 | 19/08/2009 | 11:08 | 57.97 | 152.54 |
| 4 | 43°06'06"N/2°06'33"W | 15.0 | 30/08/2008 | 11:11 | 53.53 | 155.01 |
3. Methods
3.1. Extension of the Model to Multispectral Images
3.2. SPOT5 Imagery
3.3. Validation
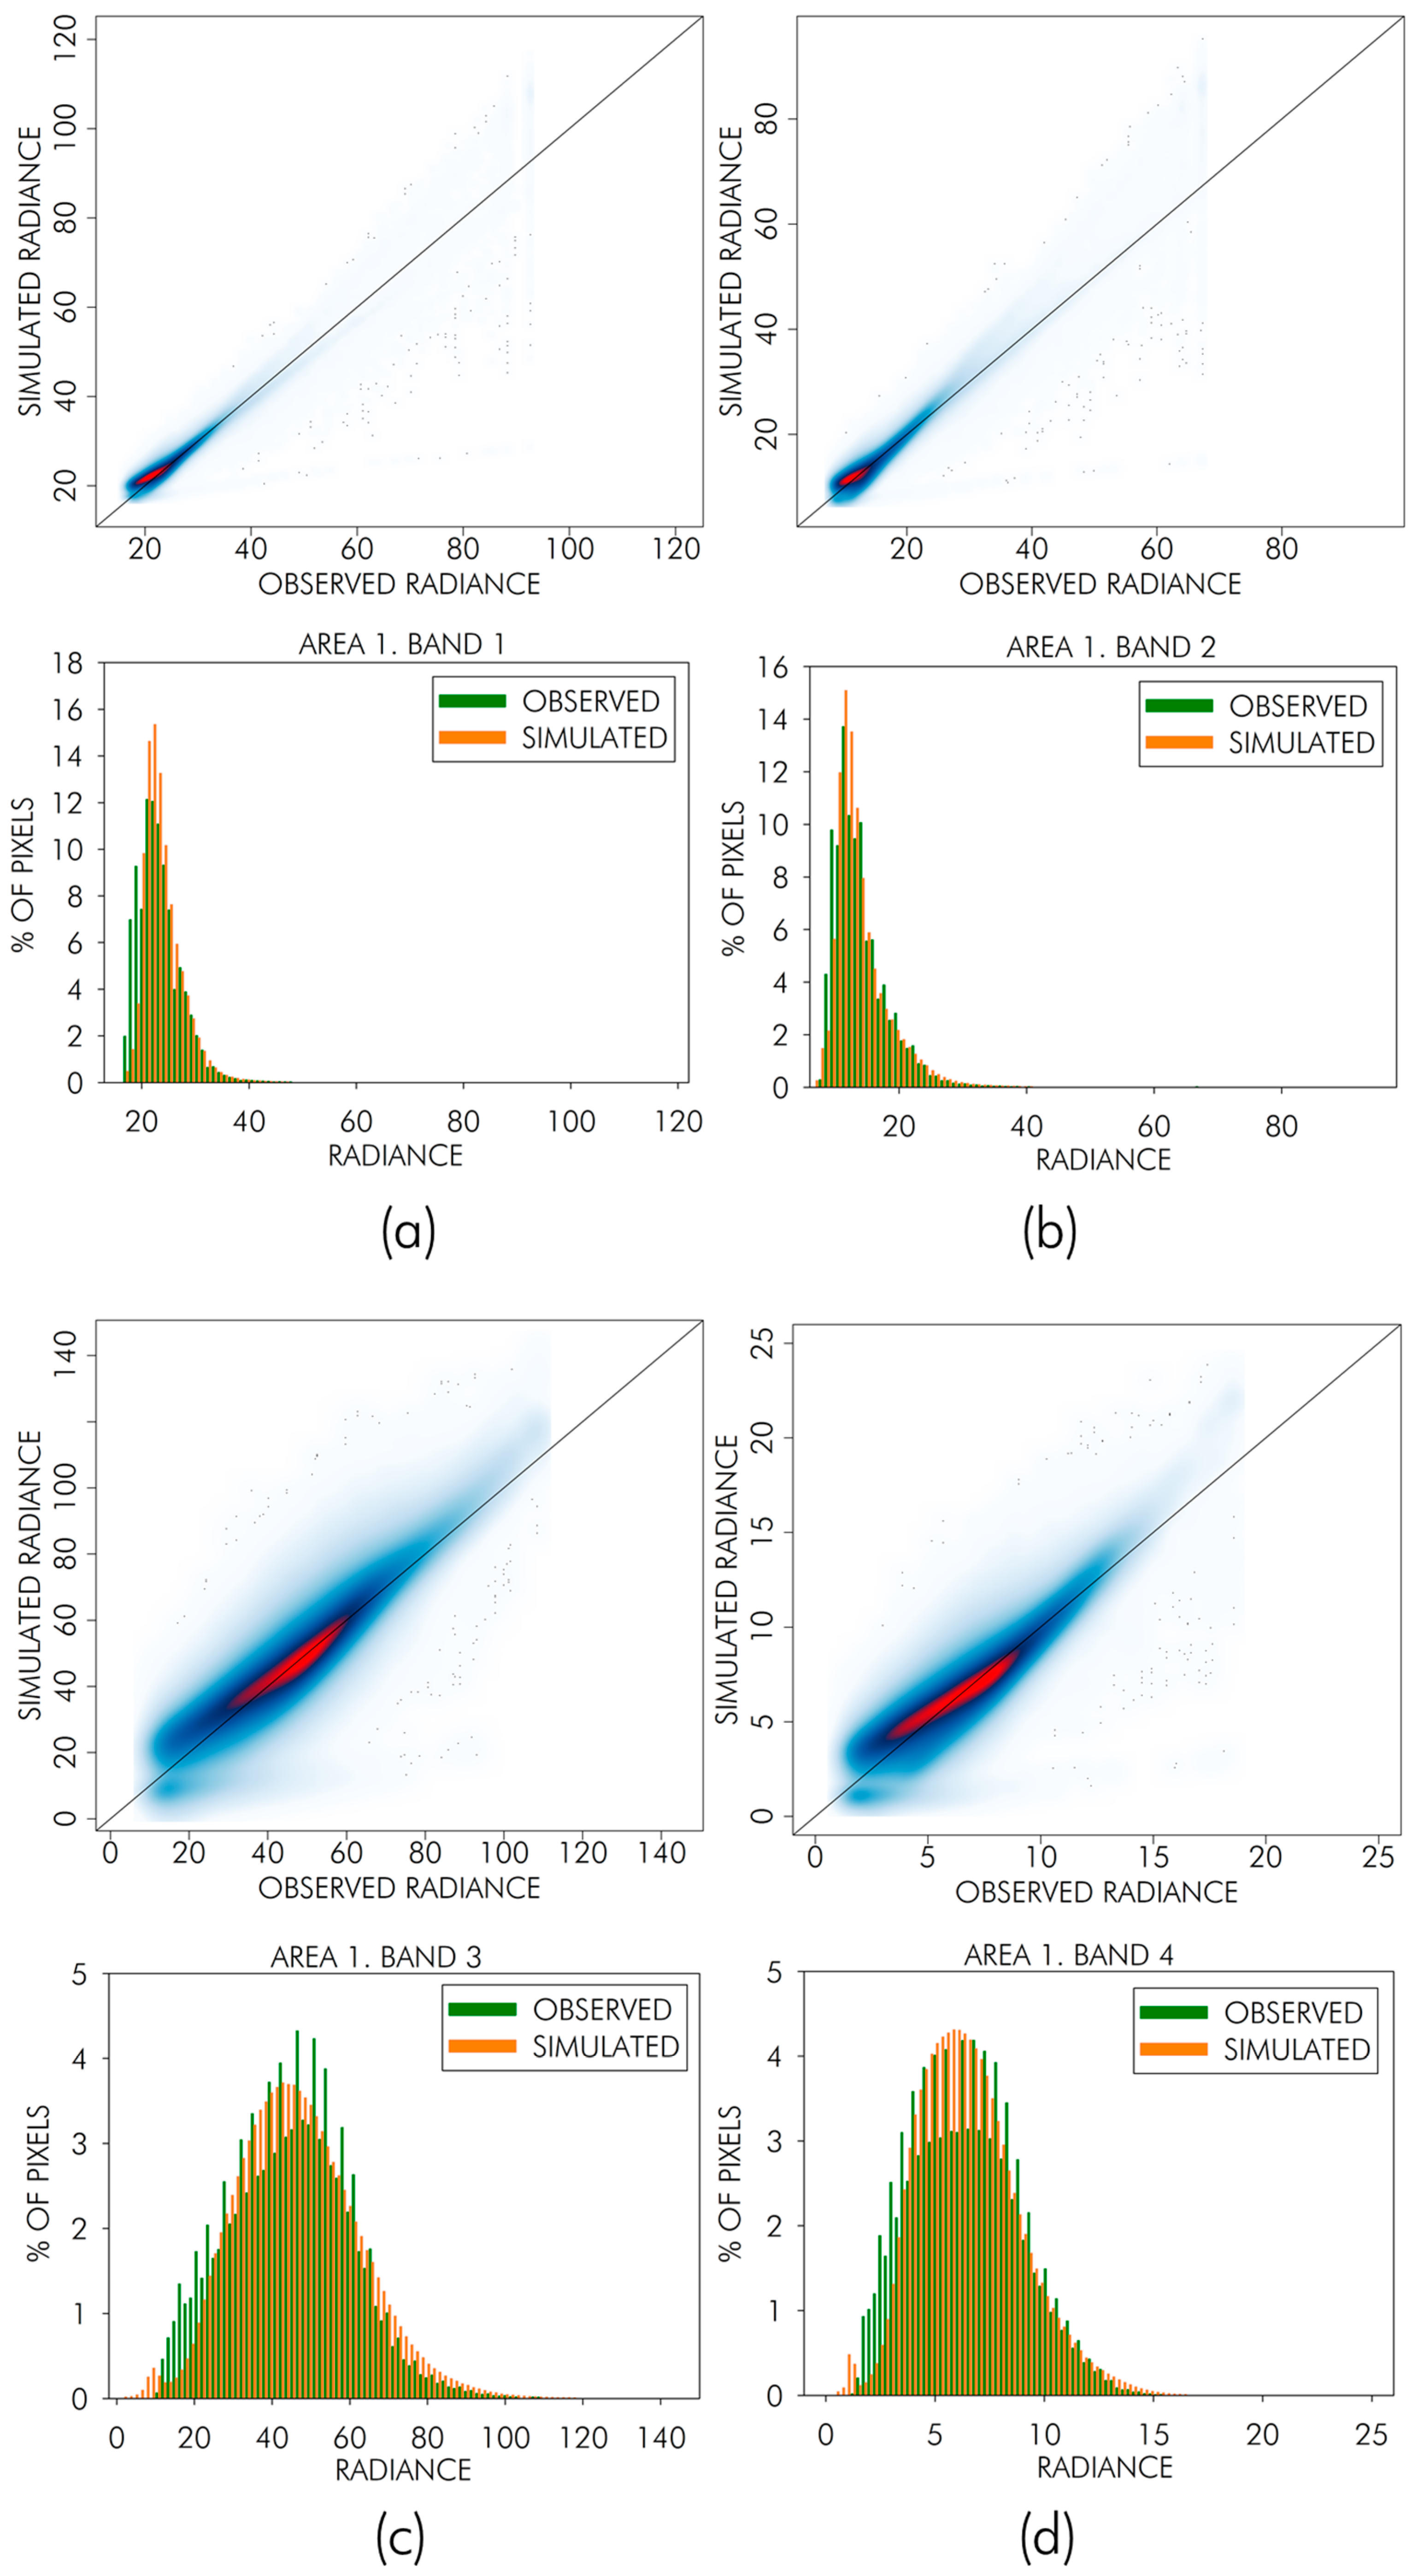
4. Results and Discussion


| AREA | B1 | B2 | B3 | B4 | ||||||||
|---|---|---|---|---|---|---|---|---|---|---|---|---|
| R2 | RMSE | MSSIM | R2 | RMSE | MSSIM | R2 | RMSE | MSSIM | R2 | RMSE | MSSIM | |
| 1 | 0.92 | 1.38 (6.1%) | 0.848 | 0.92 | 1.38 (10.6%) | 0.802 | 0.87 | 5.93 (11.5%) | 0.787 | 0.86 | 0.95 (14.1%) | 0.633 |
| 2 | 0.96 | 2.85 (5.1%) | 0.840 | 0.95 | 4.07 (9.1%) | 0.806 | 0.86 | 4.10 (6.2%) | 0.807 | 0.93 | 1.41 (9.9%) | 0.681 |
| 3 | 0.92 | 2.51 (5.3%) | 0.876 | 0.90 | 2.25 (9.9%) | 0.803 | 0.97 | 2.15 (3.9%) | 0.966 | 0.87 | 1.14 (14.3%) | 0.701 |
| 4 | 0.99 | 1.09 (3.2%) | 0.977 | 0.99 | 1.19 (5.8%) | 0.966 | 0.98 | 3.75 (5.8%) | 0.961 | 0.97 | 0.65 (7.5%) | 0.911 |
5. Conclusions
Supplementary Files
Supplementary File 1Acknowledgments
Author Contributions
Conflicts of Interest
References
- Soenen, S.A.; Peddle, D.R.; Coburn, C.A. SCS+C: A modified sun-canopy-sensor topographic correction in forested terrain. IEEE Trans. Geosci. Remote Sens. 2005, 43, 2148–2159. [Google Scholar] [CrossRef]
- Lu, D.; Ge, H.; He, S.; Xu, A.; Zhou, G.; Du, H. Pixel-based minnaert correction method for reducing topographic effects on a Landsat 7 ETM+ image. Photogramm. Eng. Remote Sens. 2008, 74, 1343–1350. [Google Scholar] [CrossRef]
- Smith, J.A.; Lin, T.L.; Ranson, K.J. The lambertian assumption and landsat data. Photogramm. Eng. Remote Sens. 1980, 46, 1183–1189. [Google Scholar]
- Teillet, P.M.; Guindon, B.; Goodenough, D.G. On the slope-aspect correction of multispectral scanner data. Can. J. Remote Sens. 1982, 8, 84–106. [Google Scholar] [CrossRef]
- Civco, D.L. Topographic normalization of landsat thematic mapper digital imagery. Photogramm. Eng. Remote Sens. 1989, 55, 1303–1309. [Google Scholar]
- Meyer, P.; Itten, K.I.; Kellenberger, T.; Sandmeier, S.; Sandmeier, R. Radiometric corrections of topographically induced effects on landsat tm data in an alpine environment. ISPRS J. Photogramm. Remote Sens. 1993, 48, 17–28. [Google Scholar] [CrossRef]
- Minnaert, M. The reciprocity principle in lunar photometry. Astrophys. J. 1941, 93, 403–410. [Google Scholar] [CrossRef]
- Richter, R. Correction of satellite imagery over mountainous terrain. Appl. Opt. 1998, 37, 4004–4015. [Google Scholar] [CrossRef] [PubMed]
- Gu, D.; Gillespie, A. Topographic normalization of landsat tm images of forest based on subpixel sun-canopy-sensor geometry. Remote Sens. Environ. 1998, 64, 166–175. [Google Scholar] [CrossRef]
- Itten, K.I.; Meyer, P. Geometric and radiometric correction of TM-data of mountainous forested areas. IEEE Trans. Geosci. Remote Sens. 1993, 31, 764–770. [Google Scholar] [CrossRef]
- Conese, C.; Gilabert, M.A.; Maselli, F.; Bottai, L. Topographic normalization of TM scenes through the use of an atmospheric correction method and digital terrain models. Photogramm. Eng. Remote Sens. 1993, 59, 1745–1753. [Google Scholar]
- Zhang, W.C.; Gao, Y.N. LULC classification and topographic correction of Landsat-7 ETM+ imagery in the yangjia river watershed: The influence of DEM resolution. Sensors 2009, 9, 1980–1995. [Google Scholar] [CrossRef] [PubMed]
- Riano, D.; Chuvieco, E.; Salas, J.; Aguado, I. Assessment of different topographic corrections in Landsat-TM data for mapping vegetation types. IEEE Trans. Geosci. Remote Sens. 2003, 41, 1056–1061. [Google Scholar] [CrossRef]
- Shepherd, J.D.; Dymond, J.R. Correcting satellite imagery for the variance of reflectance and illumination with topography. Int. J. Remote Sens. 2003, 24, 3503–3514. [Google Scholar] [CrossRef]
- Baraldi, A.; Gironda, M.; Simonetti, D. Operational two-stage stratified topographic correction of spaceborne multispectral imagery employing an automatic spectral-rule-based decision-tree preliminary classifier. IEEE Trans. Geosci. Remote Sens. 2010, 48, 112–146. [Google Scholar] [CrossRef]
- Sola, I.; González de Audícana, M.; Álvarez-Mozos, J.; Torres, J.L. Synthetic images for evaluating topographic correction algorithms. IEEE Trans. Geosci. Remote Sens. 2014, 52, 1799–1810. [Google Scholar] [CrossRef]
- Hantson, S.; Chuvieco, E. Evaluation of different topographic correction methods for landsat imagery. Int. J. Appl. Earth Obs. Geoinf. 2011, 13, 691–700. [Google Scholar] [CrossRef]
- Moran, M.S.; Jackson, R.D.; Slater, P.N.; Teillet, P.M. Evaluation of simplified procedures for retrieval of land surface reflectance factors from satellite sensor output. Remote Sens. Environ. 1992, 41, 169–184. [Google Scholar] [CrossRef]
- Bird, R.E.; Hulstrom, R.L. A Simplified Clear Sky Model for Direct and Diffuse Insolation on Horizontal Surfaces. Solar Energy Research Institute; Technical Report SERI/TR-642–761. Available online: http://www.nrel.gov/rredc/pdfs/761.pdf (accessed on 10 November 2014).
- Chen, W.-T.; Zhang, Z.; Wang, Y.-X.; Wen, X.-P. Atmospheric correction of SPOT5 land surface imagery. In Proceedings of 2nd International Congress on Image and Signal Processing (CISP), Tianjin, China, 17–19 October 2009.
- Chavez, P.S. An improved dark-object subtraction technique for atmospheric scattering correction of multispectral data. Remote Sens. Environ. 1988, 24, 459–479. [Google Scholar] [CrossRef]
- Sandmeier, S.; Itten, K.I. A physically-based model to correct atmospheric and illumination effects in optical satellite data of rugged terrain. IEEE Trans. Geosci. Remote Sens. 1997, 35, 708–717. [Google Scholar] [CrossRef]
- Hay, J.E.; McKay, D.C. Estimating solar irradiance on inclined surfaces: A review and assessment of methodologies. Int. J. Solar Energy 1985, 3, 230–240. [Google Scholar] [CrossRef]
- Zakšek, K.; Oštir, K.; Kokalj, Ž. Sky-view factor as a relief visualization technique. Remote Sens. 2011, 3, 398–415. [Google Scholar] [CrossRef]
- Gueymard, C.A. A Simple Model of the Atmospheric Radiative Transfer of Sunshine, Version 2 (Smarts2): Algorithms Description and Performance Assessment; Report FSEC-PF-270-95; Florida Solar Energy Center: Cocoa, FL, USA, 1995. [Google Scholar]
- SPOT. Resolution and Spectral Bands. Available online: http://www.Geo-airbusds.Com/en/194-resolution-and-spectral-bands (accessed on 6 November 2014).
- Wang, Z.; Bovik, A.C.; Sheikh, H.R.; Simoncelli, E.P. Image quality assessment: From error visibility to structural similarity. IEEE Trans. Image Process. 2004, 13, 600–612. [Google Scholar] [CrossRef] [PubMed]
- Zhang, Y.; Yan, G.; Bai, Y. Sensitivity of topographic correction to the DEM spatial scale. IEEE Geosci. Remote Sens. Lett. 2015, 12, 53–57. [Google Scholar] [CrossRef]
- Richter, R.; Schläpfer, D. Geo-atmospheric processing of airborne imaging spectrometry data. Part 2: Atmospheric/topographic correction. Int. J. Remote Sens. 2002, 23, 2631–2649. [Google Scholar] [CrossRef]
- Datcu, M.; Holecz, F. Generation of synthetic images for the alleviation of radiometric influence induced by the topography. Proc. SPIE 1993, 1938. [Google Scholar] [CrossRef]
- Borner, A.; Wiest, L.; Keller, P.; Reulke, R.; Richter, R.; Schaepman, M.; Schlapfer, D. Sensor: A tool for the simulation of hyperspectral remote sensing systems. ISPRS J. Photogramm. Remote Sens. 2001, 55, 299–312. [Google Scholar] [CrossRef]
- Verhoef, W.; Bach, H. Simulation of Sentinel-3 images by four-stream surface-atmosphere radiative transfer modeling in the optical and thermal domains. Remote Sens. Environ. 2012, 120, 197–207. [Google Scholar] [CrossRef]
© 2015 by the authors; licensee MDPI, Basel, Switzerland. This article is an open access article distributed under the terms and conditions of the Creative Commons Attribution license (http://creativecommons.org/licenses/by/4.0/).
Share and Cite
Sola, I.; González-Audícana, M.; Álvarez-Mozos, J. Validation of a Simplified Model to Generate Multispectral Synthetic Images. Remote Sens. 2015, 7, 2942-2951. https://0-doi-org.brum.beds.ac.uk/10.3390/rs70302942
Sola I, González-Audícana M, Álvarez-Mozos J. Validation of a Simplified Model to Generate Multispectral Synthetic Images. Remote Sensing. 2015; 7(3):2942-2951. https://0-doi-org.brum.beds.ac.uk/10.3390/rs70302942
Chicago/Turabian StyleSola, Ion, María González-Audícana, and Jesús Álvarez-Mozos. 2015. "Validation of a Simplified Model to Generate Multispectral Synthetic Images" Remote Sensing 7, no. 3: 2942-2951. https://0-doi-org.brum.beds.ac.uk/10.3390/rs70302942