1. Introduction
Plant architecture is a key issue for the understanding of many aspects of plant ecology and is also one of the most important traits for the characterization and monitoring of fruit trees [
1]. This is especially important in fruit breeding programs aimed at developing new cultivars adapted to specific growing systems [
2]. In the case of olive tree, breeding could be conducted to produce cultivars suitable either to discontinuous canopy (open vase configuration) or continuous canopy (hedgerow) [
3,
4,
5]. For such purposes, reliable, cost-efficient and robust methods able to characterize the tree crown of the genotypes under selection are desirable. Few attempts have been reported to characterize tree architecture in olive breeding [
6,
7,
8] aiming at a precise characterization of the tree crown. An accurate 3D model representing the shape and size of the tree crowns can provide information about critical aspects of plant growth and development [
9] and, therefore, about its suitability for the mentioned training systems.
In the last few decades, a number of alternatives to the traditional manual-based measurement of morphological parameters for the characterization of 3D structure of trees and canopies has emerged. Most of these alternatives are based on the use of remote sensors, both indirectly by modelling 3D features from the spectral response recorded by passive sensors in the visible and infrared spectral regions or directly by active or passive sensors operating in different wavelengths capable of recording 3D information. Even if the former are particularly suited for monitoring crop condition, canopy density,
etc., due to their relatively easy acquisition and analysis and their sensitivity to canopy cover and vegetation density, they tend to suffer from several shortcomings when used for the modelling of structural parameters, particularly regarding their reliability and accuracy [
10,
11]. Among the latter, ultrasonic sensors, stereo images, radar and LIDAR or even X-ray [
12,
13] have been proposed, with LIDAR (light detection and ranging) laser pulse technology (both on terrestrial or airborne platforms) one of the most sound and accepted approaches for detailed measurement and monitoring of tree architecture [
14,
15], along with stereo vision techniques [
13].
Despite the widespread use of LIDAR for the retrieval of structure parameters, it suffers from a series of shortcomings. Most of these shortcomings are related to its relative high costs of acquisition and processing, but also to the difficulties in the retrieval of the high density returns required for the accurate crown reconstruction in screening and/or phenotyping, particularly on small plots with high density tree rows. Traditional photogrammetric analyses also require high-cost cameras and platforms and rigorous processing chains for accurate results [
11]. Yet, the emerging techniques of computer vision enable the generation of reliable 2D and 3D imagery from collections of multi-angle imagery acquired from standard (non-metric) cameras by using 3D photo-reconstruction algorithms based on structure-from-motion (SfM) and multi-view-stereo analysis algorithms [
16,
17]. One of the main advantages of these approaches lies in their potential for performing accurate 3D imagery reconstructions from datasets with a large number of images and a high overlap percentage, even if accurate internal and external camera orientation parameters are not available [
18].
In fact, the new methods based on photo reconstruction enable the generation of very high resolution (VHR) digital surface models (DSM) and orthophotograph mosaics with high spatial and temporal resolution [
18,
19,
20,
21], and they have proven their applicability for environmental monitoring [
22] and tree crown height quantification [
11], being an attractive alternative to LIDAR technology, due to its performance, flexibility and relative low cost.
The simplicity, low weight and low cost of the sensors required for SfM image reconstruction, along with the development of miniaturized and low-cost inertial sensors, GPS devices and embedded computers, has enhanced the possibilities of the integration of these devices on light-weight unmanned aerial vehicles (UAVs) [
23], currently referred to as unmanned aerial systems (UAS) and remotely-piloted aircraft systems (RPAS). In fact, the civil applications of UAV, such as high-resolution image acquisition, have emerged as an attractive option for agriculture and environment monitoring (see, e.g., [
24,
25,
26]). Hence, they have been widely used in recent studies involving quantitative remote sensing applications due to their versatility. For example, [
23,
27,
28] monitored several aspects of vegetation by using miniature thermal cameras, while [
29,
30,
31] used narrow-band multispectral imagery for crop monitoring. Even more complex micro-hyperspectral sensors were successfully installed on board UAV platforms for crop monitoring purposes by [
32,
33,
34].
Taking into account such progress, the present work aims at the development, assessment of the performance and potential uses of low-cost image acquisition systems on board UAV platforms for the estimation of olive crown parameters. More precisely, we integrated SfM image reconstruction techniques to derive digital surface models and ortho-mosaics and GIS and geographical object-based image analysis (GEOBIA) for the automatic estimation of crown diameter and tree height as two of the main variables of interest for tree crown architecture in plant phenotyping studies. We tested the performance of the above-mentioned methods against ground reference data obtained on two olive breeding trials designed to form a discontinuous canopy (open vase configuration) or continuous canopy (hedgerow). Special attention was paid to the assessment of the potential of the method for characterizing small differences in crown structure among the genotypes of those trials.
2. Material and Methods
2.1. Study Area and Experimental Design
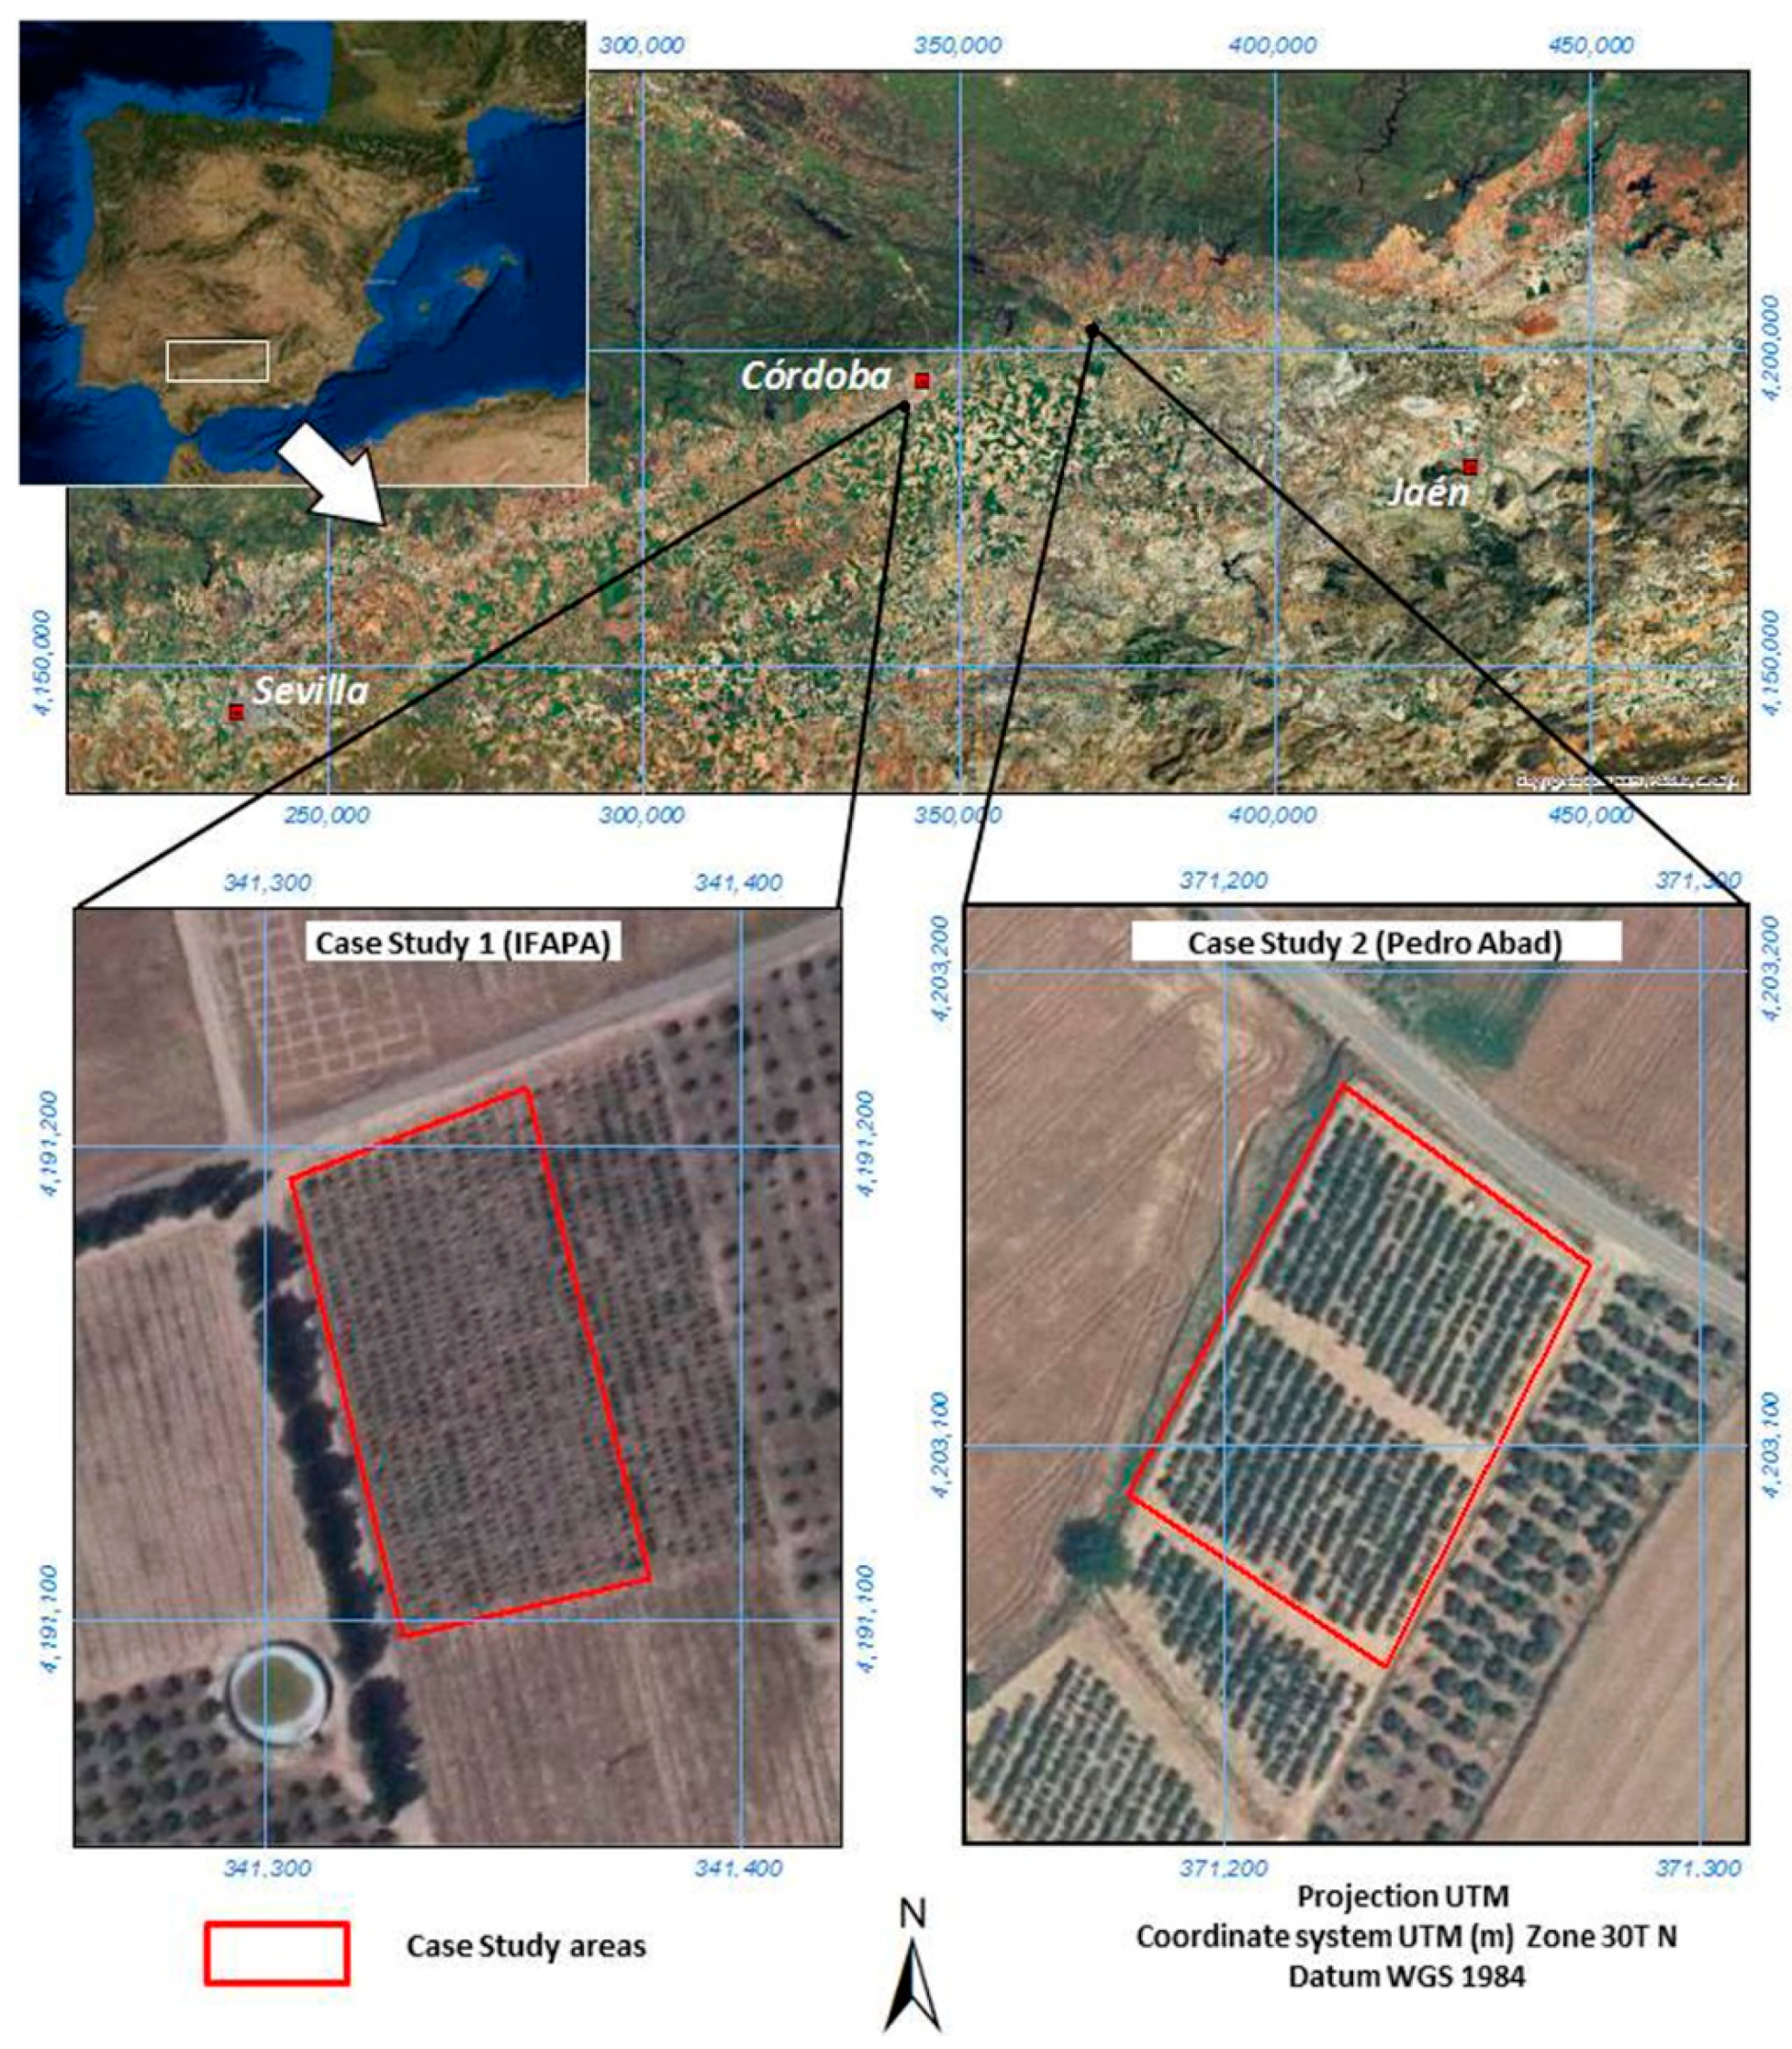
Two different field trials of the Córdoba breeding program were included in the present study (
Figure 1).
The first trial (Study Area 1) was located at the Institute of Agricultural and Fishery Research and Training (IFAPA) Alameda del Obispo experimental farm in Córdoba, Spain (37°51′15′′N, 4°48′16′′W), and was planted in 2009. It consists of an intermediate breeding trial [
35] arranged in a randomize design with four blocks and one tree per elementary plot. Trees were planted at 4 m × 2 m and trained as single trunk open vase at 1-m height to form a discontinuous canopy of scattered trees. Standard cultural practices, including drip irrigation, were followed in the orchard to ensure adequate tree growth. For the present study, 29 genotypes (4 trees per genotype) were randomly selected, and additional guard trees were also included for initial estimation of the parameters at the tree level for a total number of 150 individual trees.
Figure 1.
Study area and location of case study areas. Image source: Esri Inc.; PNOA, National Program of Aerial Orthophotograph-Ministerio de Fomento; IFAPA, Institute of Agricultural and Fishery Research and Training.
Figure 1.
Study area and location of case study areas. Image source: Esri Inc.; PNOA, National Program of Aerial Orthophotograph-Ministerio de Fomento; IFAPA, Institute of Agricultural and Fishery Research and Training.
The second trial (Study Area 2) was located in commercial farm property of Todolivo S.L. cooperative in Pedro Abad, Córdoba, Spain (37°58′00′′N, 4°27′56′′W), and was planted in 2007. Three cultivars “Arbequina”, “Arbosana” and “Sikitita” [
36], and three selections of the cooperative breeding program carried out by the University of Cordoba (UC) and IFAPA (I) (UC-I6-9, UC-I7-8 and UC-I2-35) were arranged in a randomized design with 4 blocks. The elementary plot consists of 30 trees planted at 3.75 × 1.35-m spacing (1975 plants/ha) designed to form a continuous canopy (narrow hedgerow) to be harvested by over-the-row straddle harvesting machines. Trees were trained in a central leader up to 2.2 m. Irrigation and fertilization were performed to maximize accumulated yield. Additional guard hedgerows were also included for initial estimation of the parameters for a total number of 28 individual hedgerows.
2.2. Analysis Overview
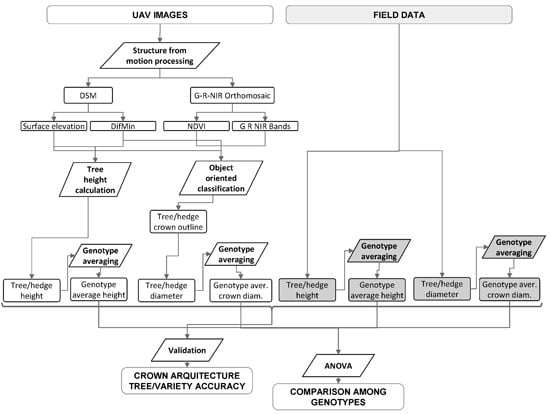
The main steps of the research are summarized in
Figure 2. The study was based on the analyses of collections of images acquired by consumer-grade cameras on board UAV platform for two study sites using the SfM image reconstruction approach. As detailed in the following sections, images were processed to obtain digital surface model and color infrared (CIR) orthomosaics. Data were analyzed to estimate tree heights and average crown diameters for the discontinuous canopy in Study Area 1 and hedgerow heights and widths in Study Area 2, respectively. These results were compared against field measures of these variables in order to assess the accuracies of the method, both at the individual tree and hedgerow level for the two study areas. Finally, ANOVA analyses were performed on the tree and hedgerow variables estimated and measured in order to assess the validity of the remote sensing method for comparison among genotypes.
Figure 2.
Flowchart illustrating the main analysis steps and outputs. Elements shaded in grey indicate field data and the processes used as a reference for validation. These datasets and processes were replicated in two olive orchards, one with discontinuous canopy and the other with continuous hedgerows. DifMin, difference from the minimum value.
2.3. Field Measurements
In Study Area 1, canopy height and width (measured east-west and north-south) were recorded for each tree and canopy surface, allowing an eventual estimation of crown volume from these measurements [
37].
In Study Area 2, canopy height and maximum width were measured in three trees per elementary plot (hedgerow).
All of the measurements were made in the same week as the aerial images were taken.
2.4. Image Acquisition and Pre-Processing
The airborne campaigns were conducted using an UAV operated by the Laboratory for Research Methods in Quantitative Remote Sensing (Quanta-Lab, IAS-CSIC, Spain). The UAV carried an RGB camera modified for color infrared (CIR) detection by removing the internal infrared filter. The camera was a Panasonic Lumix DMC-GF1 with a 4000 × 3000 pixel detector that captured images at f/3.2 and 1/2500 s with an angular FOV of 47.6° × 36.3° and provided ∼7-cm/pixel resolution at an approximate altitude of 300 m above ground level (AGL). The UAV platform was a 2-m wingspan fixed-wing platform with up to a 1-h endurance at 5.8 kg take-off weight (TOW) and 63-km/h ground speed (mX-SIGHT, UAV Services and Systems, Germany) that took 45 min to complete the entire flight plan at the indicated flight altitude. It was operated in the field by two trained operators and controlled by an autopilot for fully-autonomous flying (AP04, UAV Navigation, Madrid, Spain). The autopilot had a dual CPU controlling an integrated attitude heading reference system (AHRS) based on an L1GPS board, 3-axis accelerometers, gyros and a 3-axis magnetometer [
23]. The ground control station and the UAV were radio linked, transmitting position, attitude and status data at a 20-Hz frequency. The imagery was synchronized using the GPS position and the triggering time recorded for each image. The study areas were flown following a grid of parallel and perpendicular flight lines to ensure that each ground object was imaged in the along- and across-track directions of the UAV platform, maximizing overlap. A cloud of images comprising the flight lines covered the entire area homogeneously at a rate of 2 s between consecutive images. At an average of a 63-km/h ground speed, FOV = 47.6° × 36.3° and an approximate altitude of 300 m, the resulting average overlap obtained during the flights was extremely large and was estimated at 80%–90% in most cases.
In the process of SfM image reconstruction, 387 out of the original set of 390 (Study Area 1) and the whole original set of 255 images (Study Area 2) were used to generate each orthomosaic and the digital surface model for each orchard using pix4UAV software (®Ecublens, Switzerland). The processing steps included automatic aerial triangulation (AAT), bundle block adjustment (BBA) and DSM and orthomosaic creation. GPS tags were used for each image acquired, and there was no requirement for geo-location or orientation data. As the compact cameras generally used on board UAV platforms are extremely sensitive to temperature differences, vibrations and shocks, one of the processing steps was camera auto-calibration. This involved using information from each pixel of the images to estimate the optimal camera and lens calibration for each flight.
The imagery and the synchronized GPS position for each single image were used as input. The point cloud densification was set to high in order to maximize the density of 3D points of the digital elevation model, and the grid sampling distance in the digital elevation model point cloud (i.e., the distance between two 3D points in the DSM) was set to 100 cm. The orthomosaics cover a total of 138 ha with a spatial resolution of 0.083 m/pixel and 82 ha with a spatial resolution of 0.077 m/pixel for Study Areas 1 and 2, respectively. The camera parameters were optimized internally during the first step conducted.
The orthomosaic and DSM datasets obtained in this process were used in the subsequent analyses. Prior to further calculations, a 3 × 3 square kernel (approximately 0.25 m × 0.25 m) low-pass filter was applied to the original DSM in order to remove both tree crown and ground artifacts.
In addition, two additional parameters were computed for their integration in the crown classification. Hence, the Normalized Difference Vegetation Index (NDVI, Equation (1)) was calculated from the raw red and NIR band radiance values of the generated orthomosaic as a measure of the greenness of the vegetation cover.
where:
The difference from the minimum value (DifMin) was also derived from the original DSM using a search circle of 2 m around the target pixel according Equation 2:
where:
2.5. Calculation of Tree Parameters
Tree height was retrieved from the DSM based on the identification of local maxima, likely to correspond to tree tops, and the measurement of their difference in height to a reference altitude of the ground in their neighborhood. The definition of the search window for the local maxima and ground reference varied according to the particular geometry and spatial pattern of the targeted trees for each case study, as described below.
For the IFAPA case study (discontinuous canopy), a square search window of 0.75 m was used for the identification of local maxima in the DSM corresponding to potential tree tops, and then, a circular neighborhood of 2 m was used for the calculation of the ground reference height as minimum DSM values.
For the Pedro Abad case study (continuous hedgerow canopy), a slightly different approach was used, due to the difficulties in identifying local maxima for trees in lines with closed crowns. Hence, and taking into account that each row was planted with 30 trees, the total length of each row was divided into 30 stripes of equal length. Then, the local maxima was computed for each stripe considering a rectangle of 1.80 m of across length, enough to capture the maxima of the tree height in the row, while avoiding being affected by the trees of the neighboring rows. The reference ground height for each tree was then computed as the local minimum in a circular neighborhood of a 3-m radius around the previously-identified tree top.
The crown diameter was also computed as a key variable in the estimation and prediction of olive tree productivity. Previous to diameter measurement, the tree crowns were delineated by means of an object-oriented classification using the software, eCognition Developer V 8.7 (®Trimble Germany Gmbh, Munich, Germany). We used this approach, as it was particularly suited to classification problems of high-resolution imagery where the target element is considerably larger than the image spatial resolution [
38]. In this object-oriented classification, the features to be classified are not single pixels, but spatial pixel clusters defined through an aggregation algorithm, known as “multi-resolution segmentation” [
39]. The segmentation process is controlled by the user by setting scale and homogeneity parameters. The classification was done on a multilayer image containing the three visible and IR multispectral layers of the orthoimage, the DSM along with the NDVI and the DifMin.
In the first stage, a simple level of segmentation was used, adjusting the parameters so that image objects would fit with real-world target elements. Segmentation parameter values were adjusted iteratively using a trial-error procedure, comparing segment edges against known reference areas (namely, different sections of tree crowns). A certain degree of over-segmentation was allowed in order to enable a good delineation of the elements in the image. All of the image data layers were equally weighted by one, and the scale parameter was set to 10 in the case of the IFAPA case study and to 15 in the Pedro Abad case study, due to the slight differences in the crown sizes and geometries. The shape parameter (i.e., shape vs. spectral importance, ranging from 0 to 1) was set to 0.2, and the compactness parameter (i.e., compactness vs. smoothness of segments, ranging from 0 to 1) was set to 0.5 for both study cases.
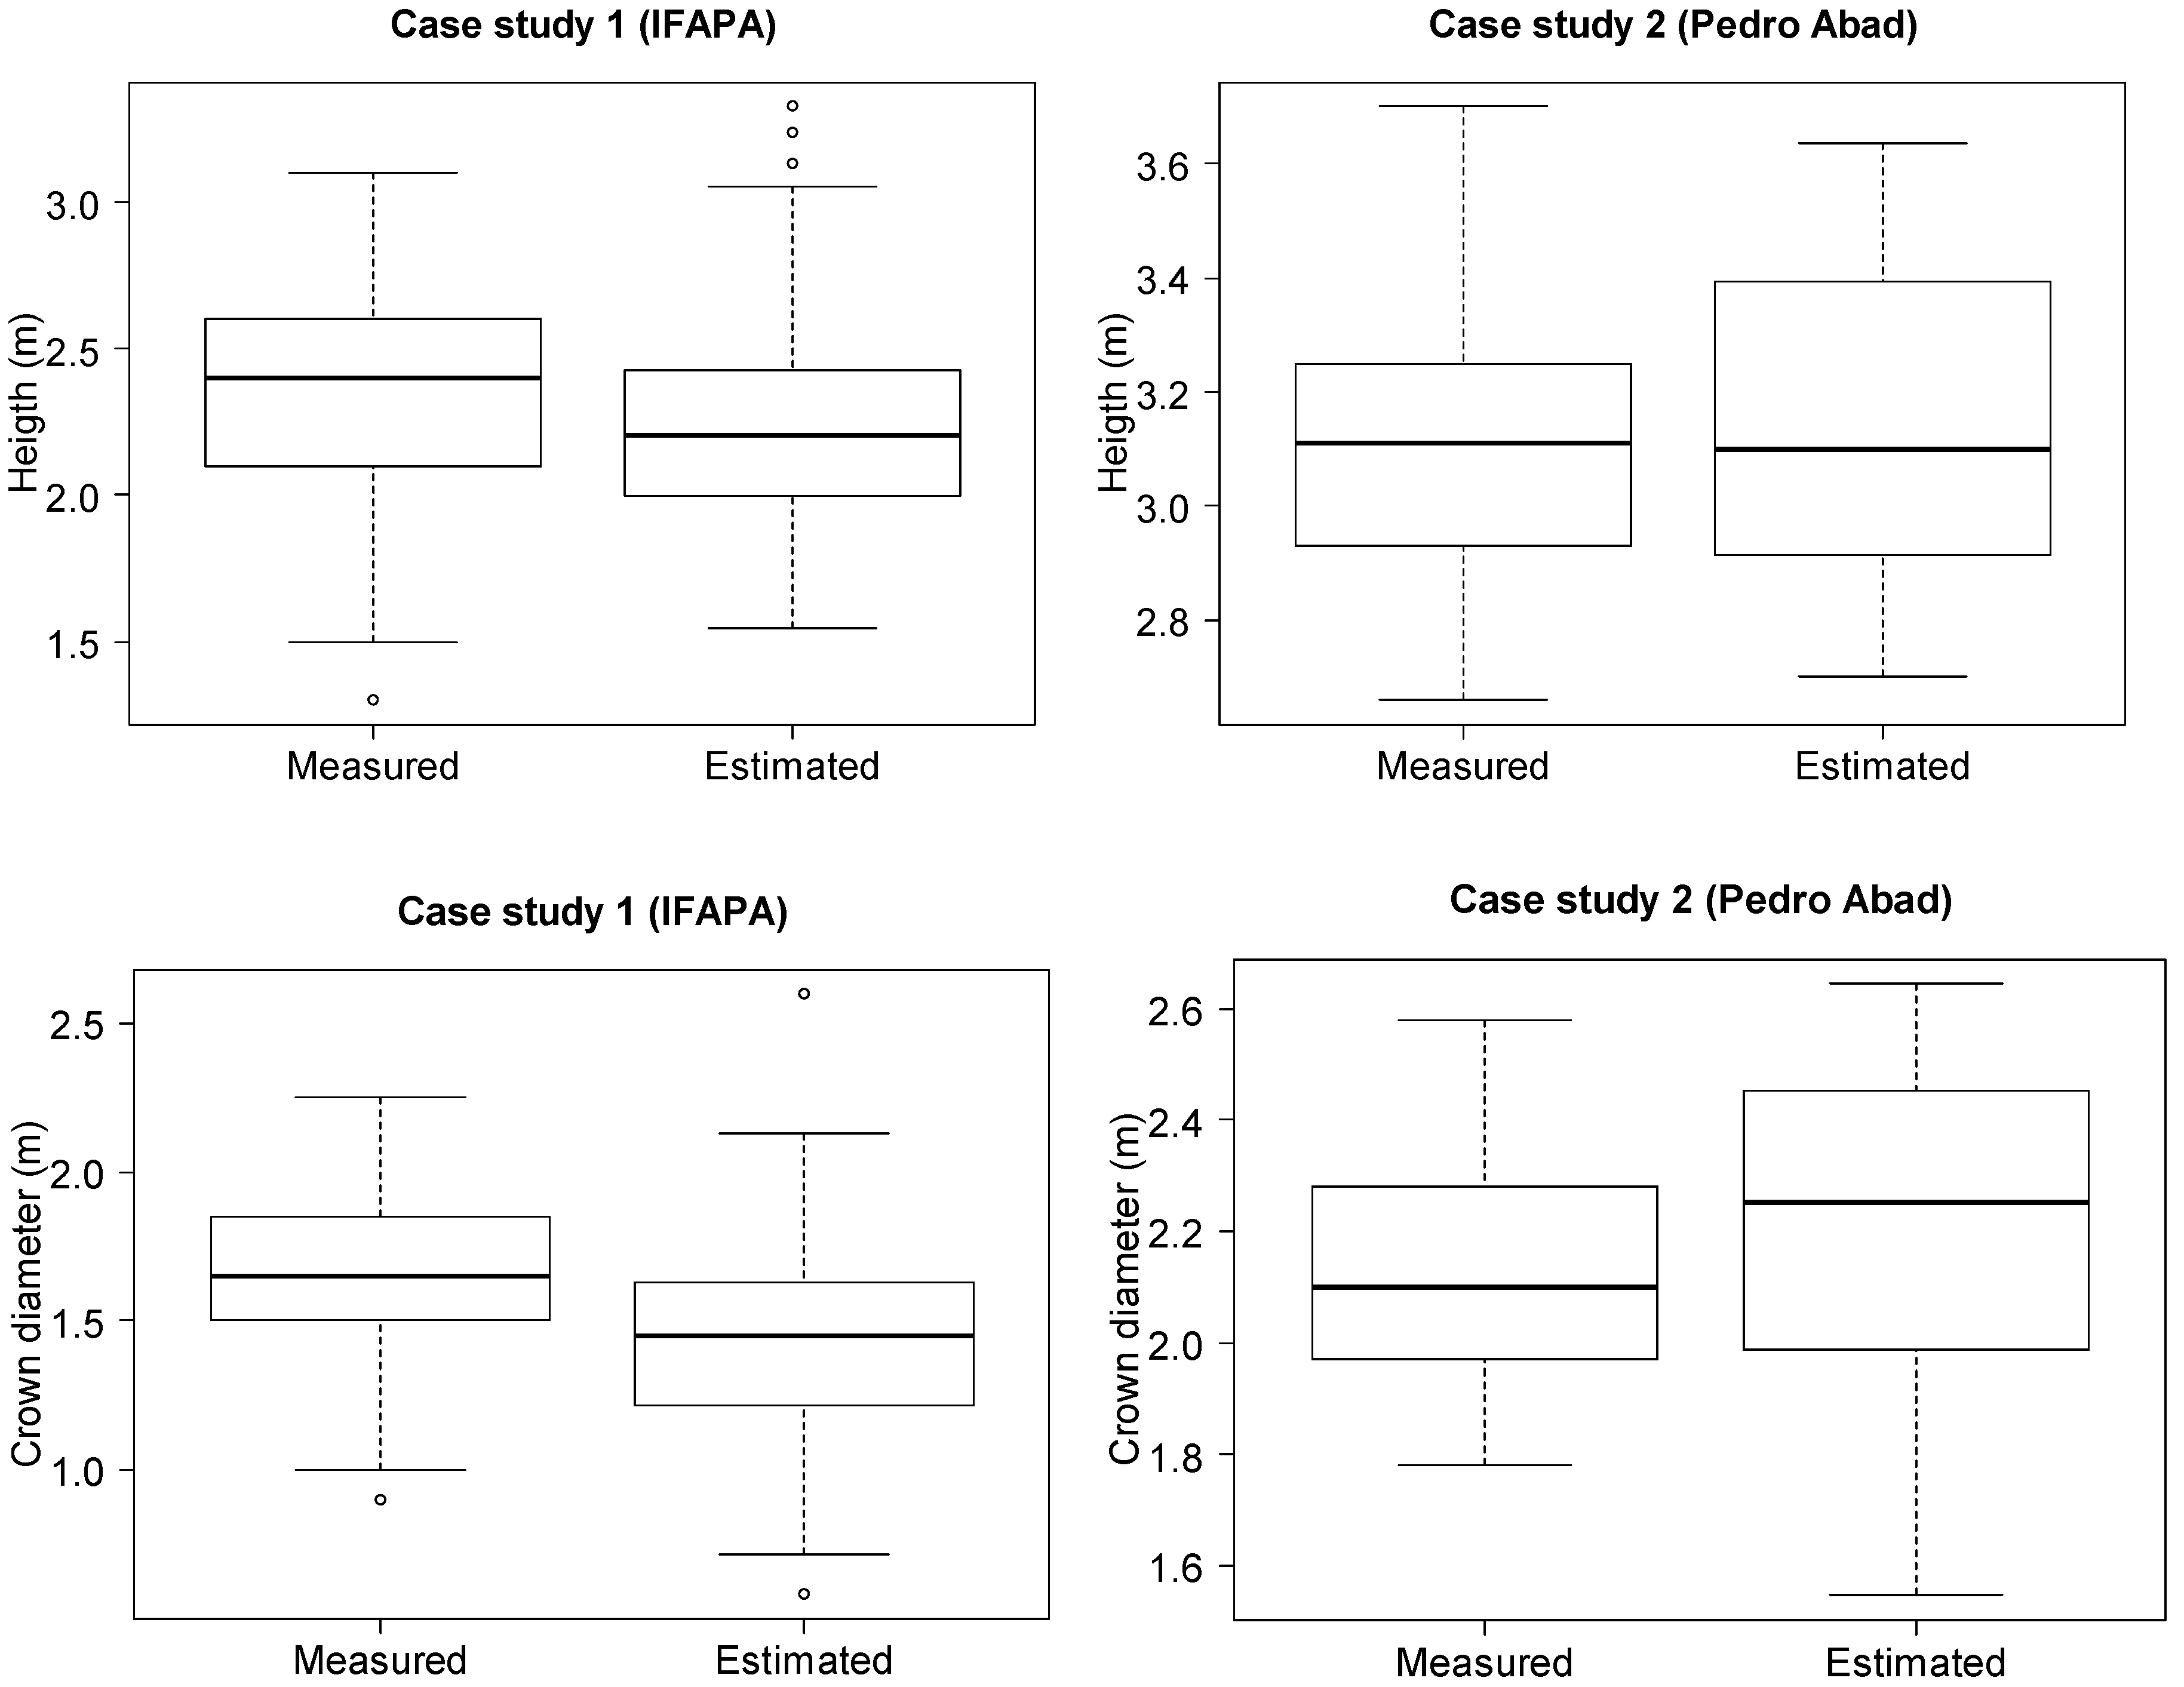
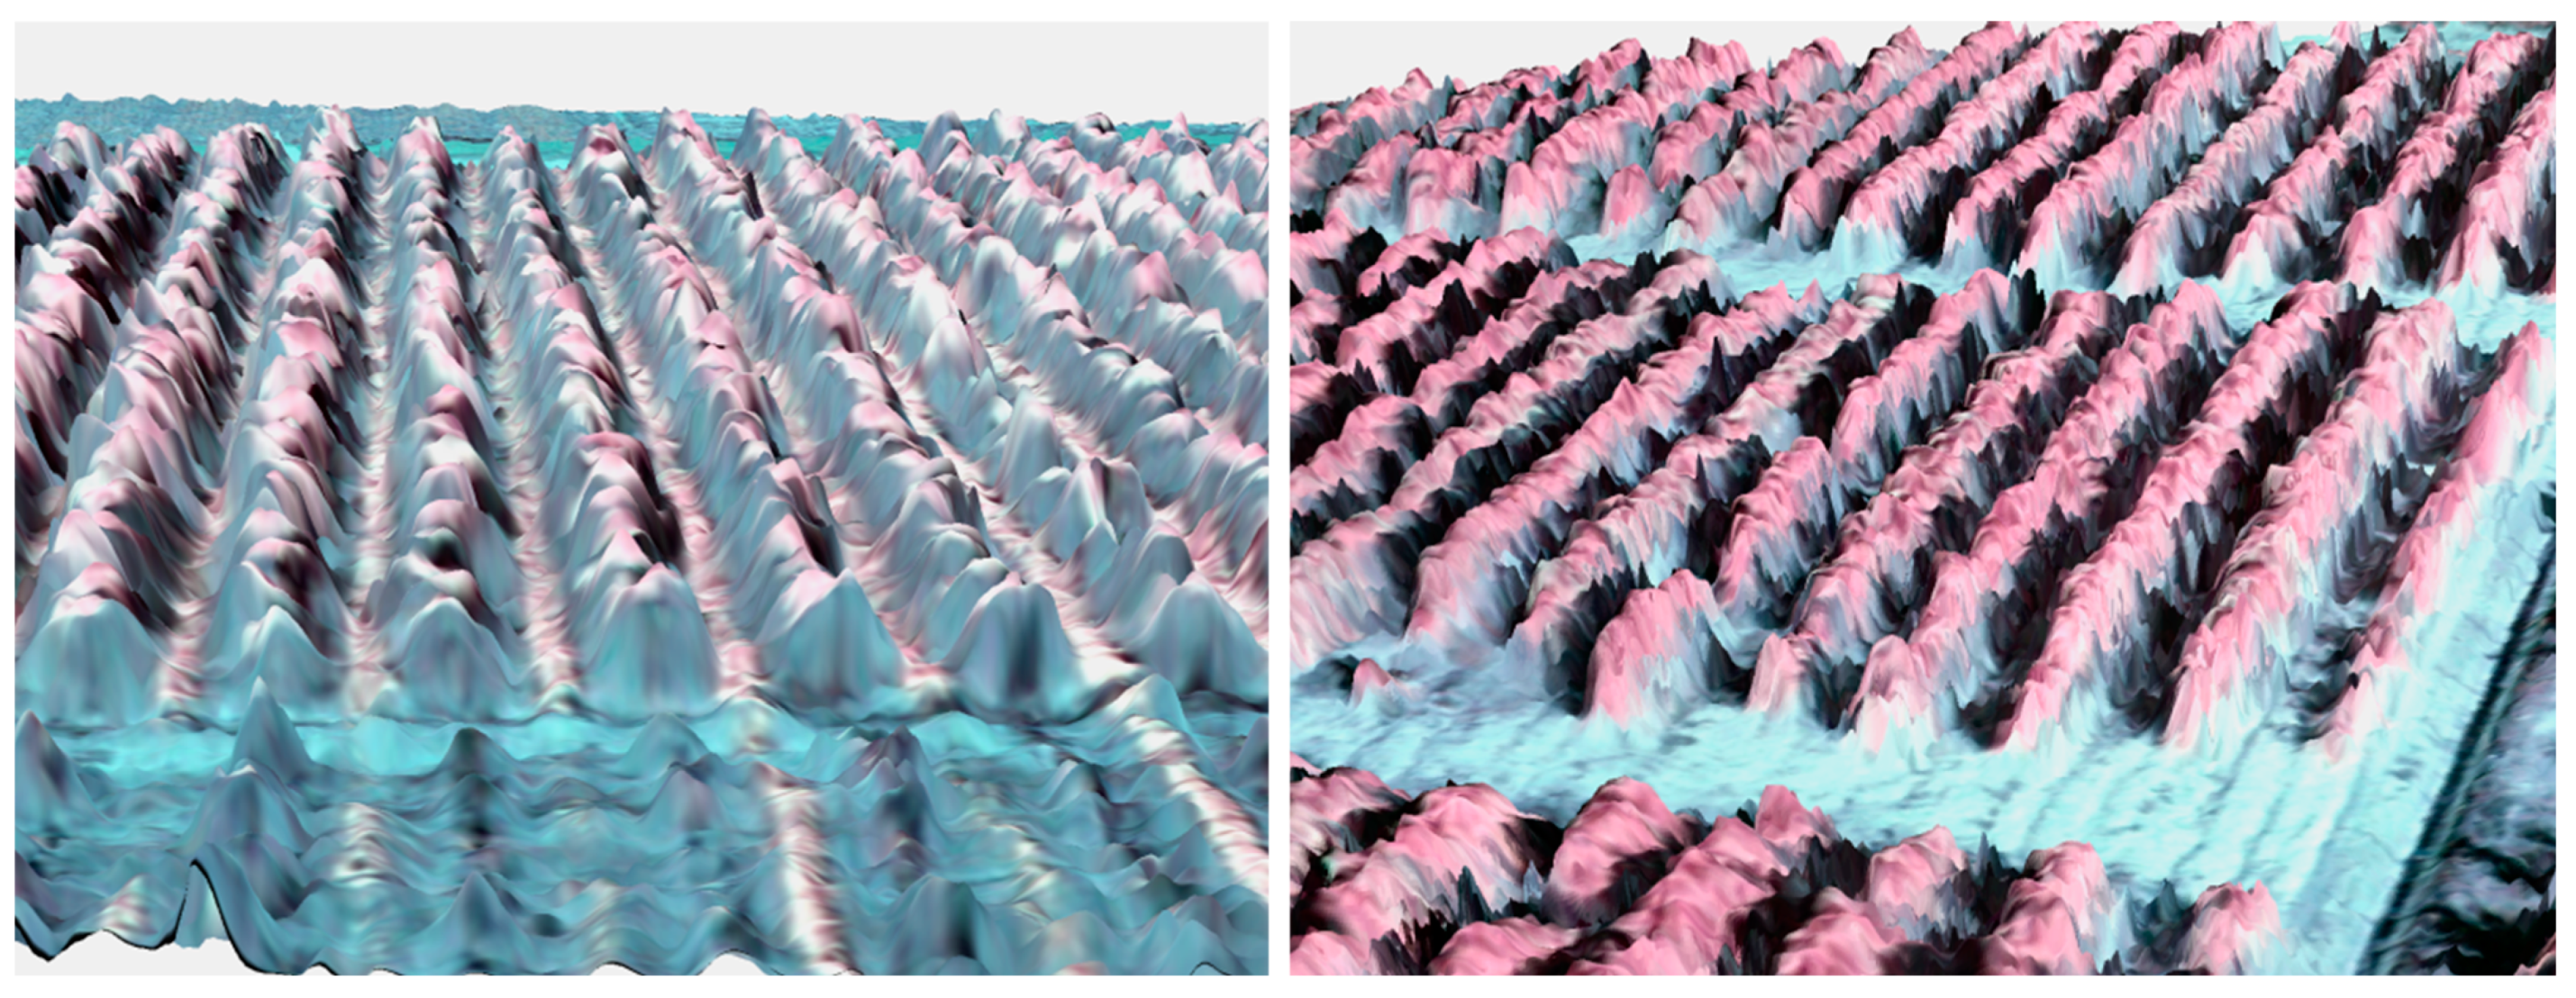
In the second stage, a set of training areas for the classes “tree crown”, “background vegetation”, “bare soil” and “shadow” was collected, and then, a supervised classification using the CaRT (classification and regression trees) algorithm was conducted. Finally, a classification refinement was done by applying a morphological opening filter, a threshold of object size and a watershed segmentation in order to delineate the individual tree crowns (
Figure 3).
Figure 3.
Examples of crown delineation by object-oriented analysis in the Study Area 1 (Left) and Study Area 2 (Right). In yellow, the trees or hedgerow sections, depending on the case, measured in the field and used for the comparison against image estimation of tree parameters.
Figure 3.
Examples of crown delineation by object-oriented analysis in the Study Area 1 (Left) and Study Area 2 (Right). In yellow, the trees or hedgerow sections, depending on the case, measured in the field and used for the comparison against image estimation of tree parameters.
Tree crown delineations were then exported as polygons, and the tree crown diameters were measured using the QGis V 2.2.0 (®Free Software Foundation, Inc., Boston, MA, USA) package. Measures were done following the same protocols as in the field measurements, i.e., cross measurements and averaging for the individual trees in the IFAPA case and width across the rows in the Pedro Abad case.
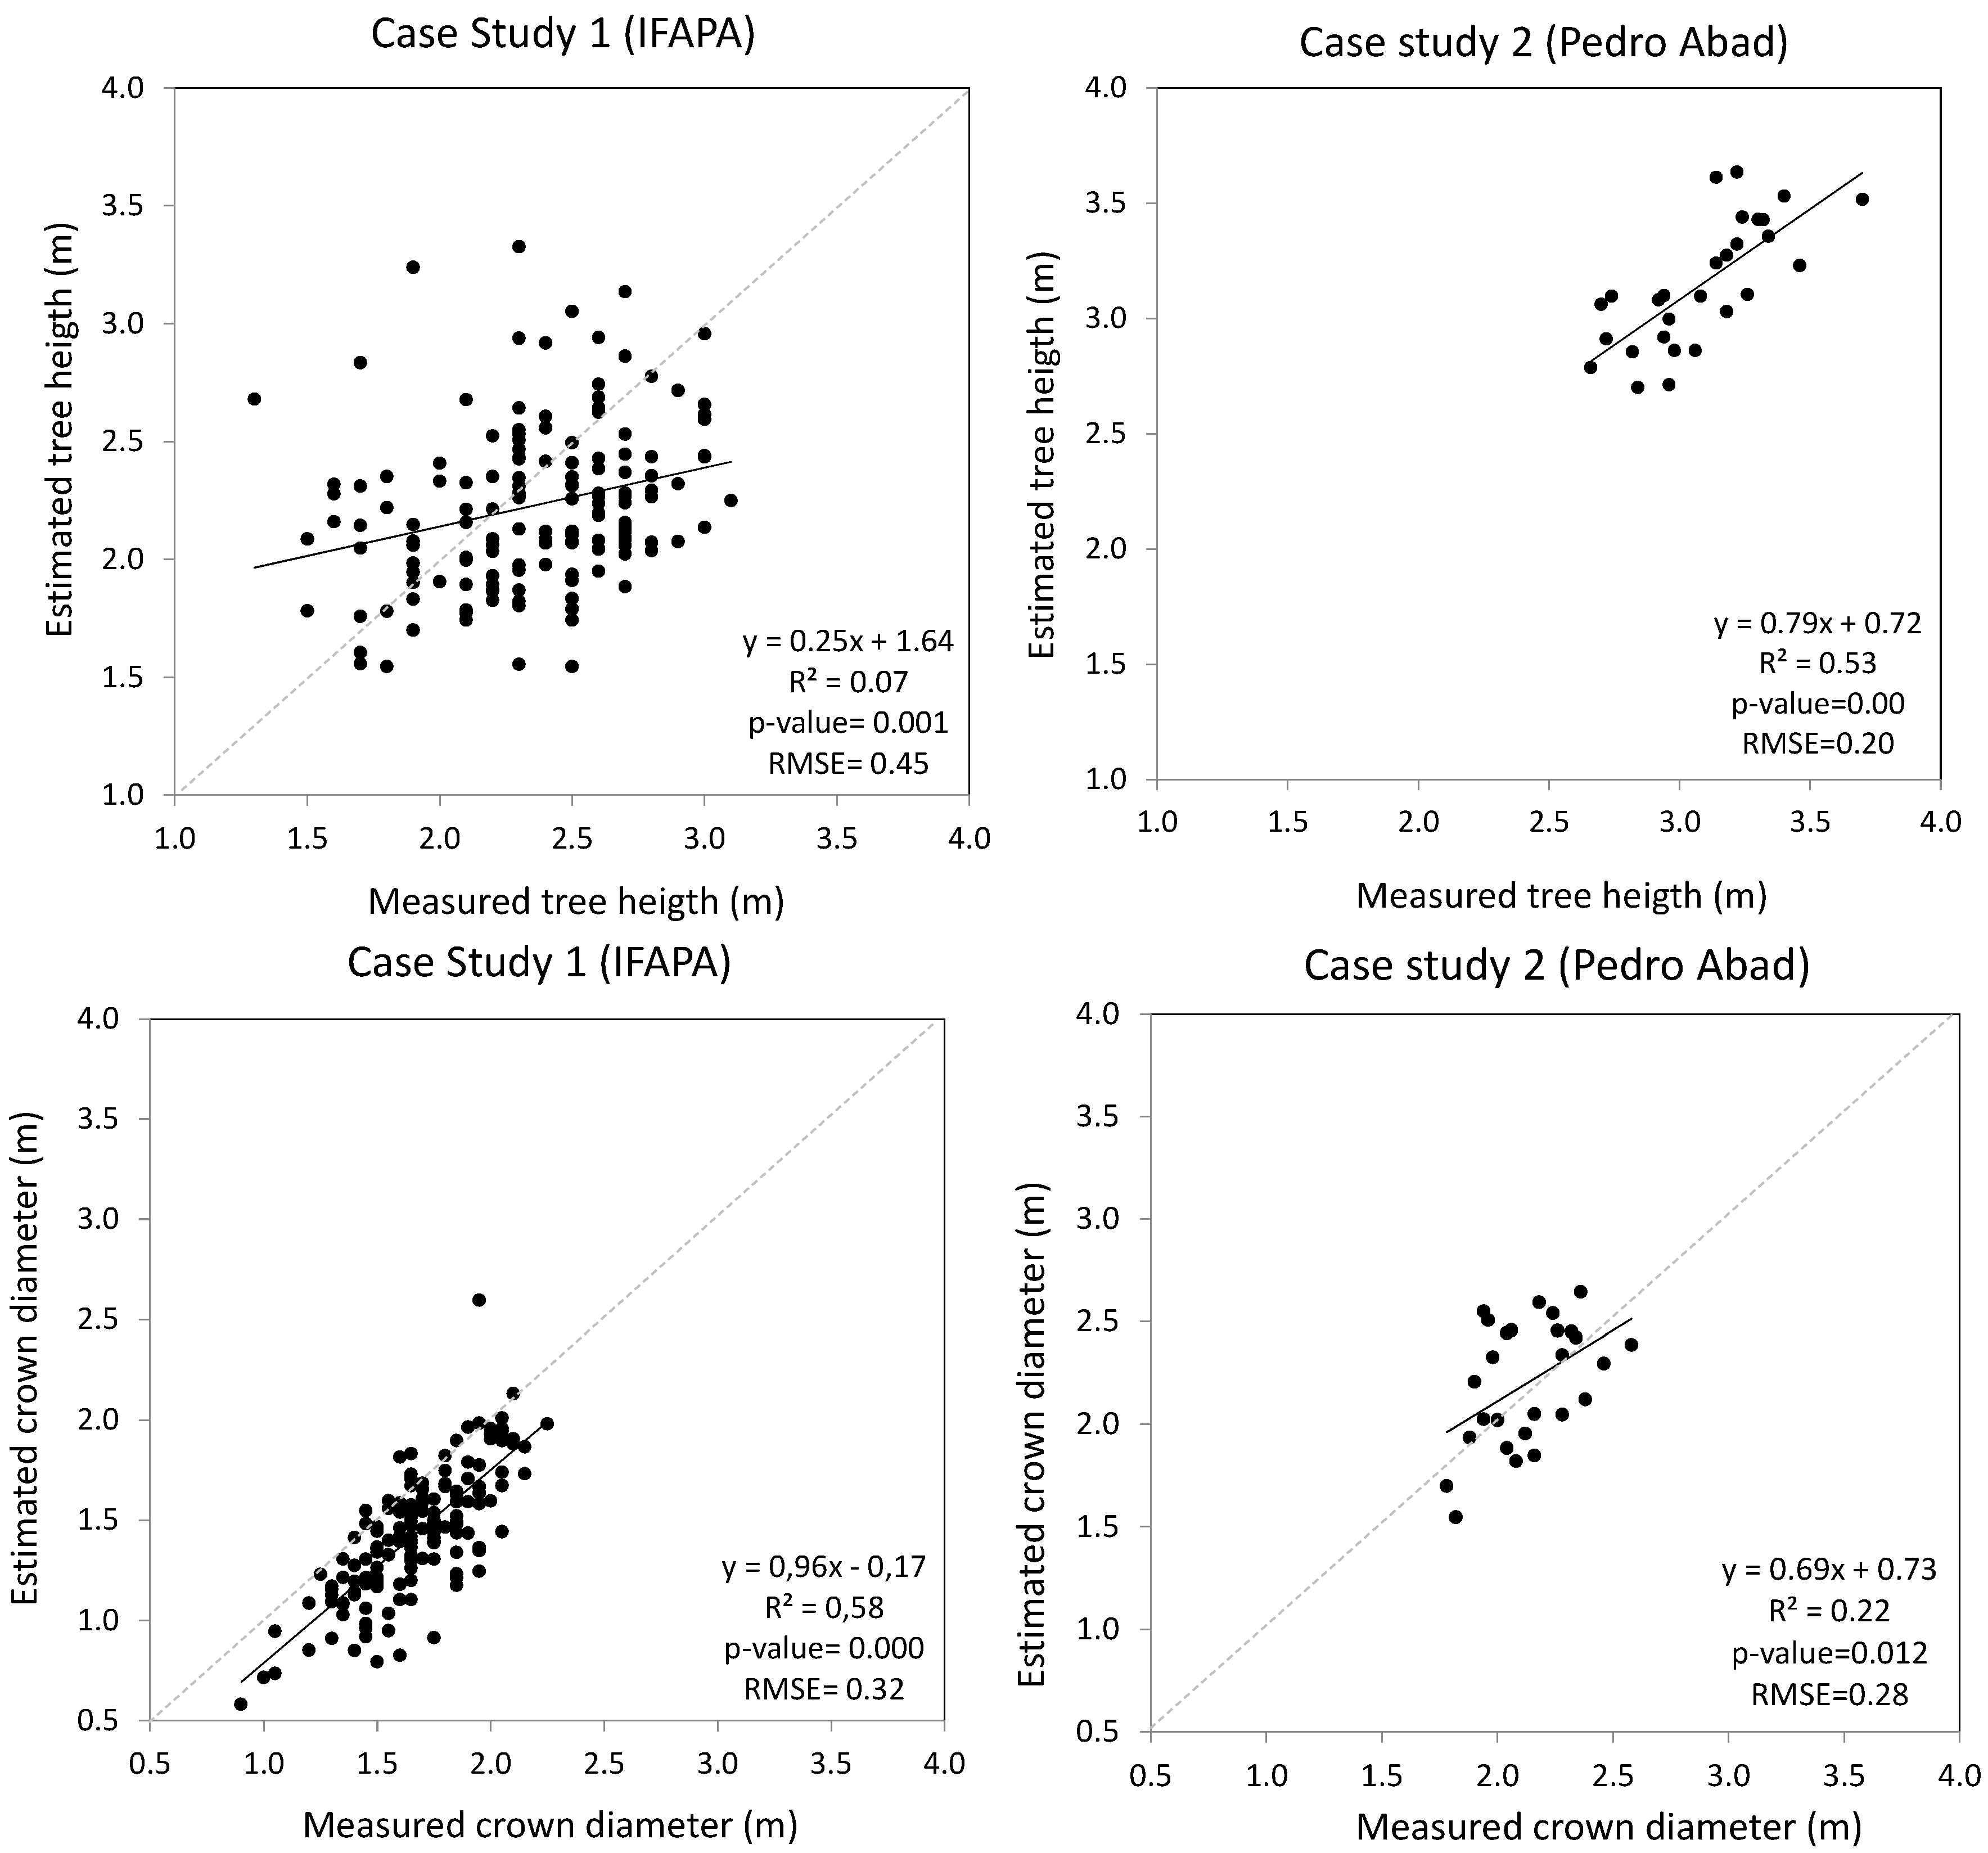
2.6. Tree Parameters Validation
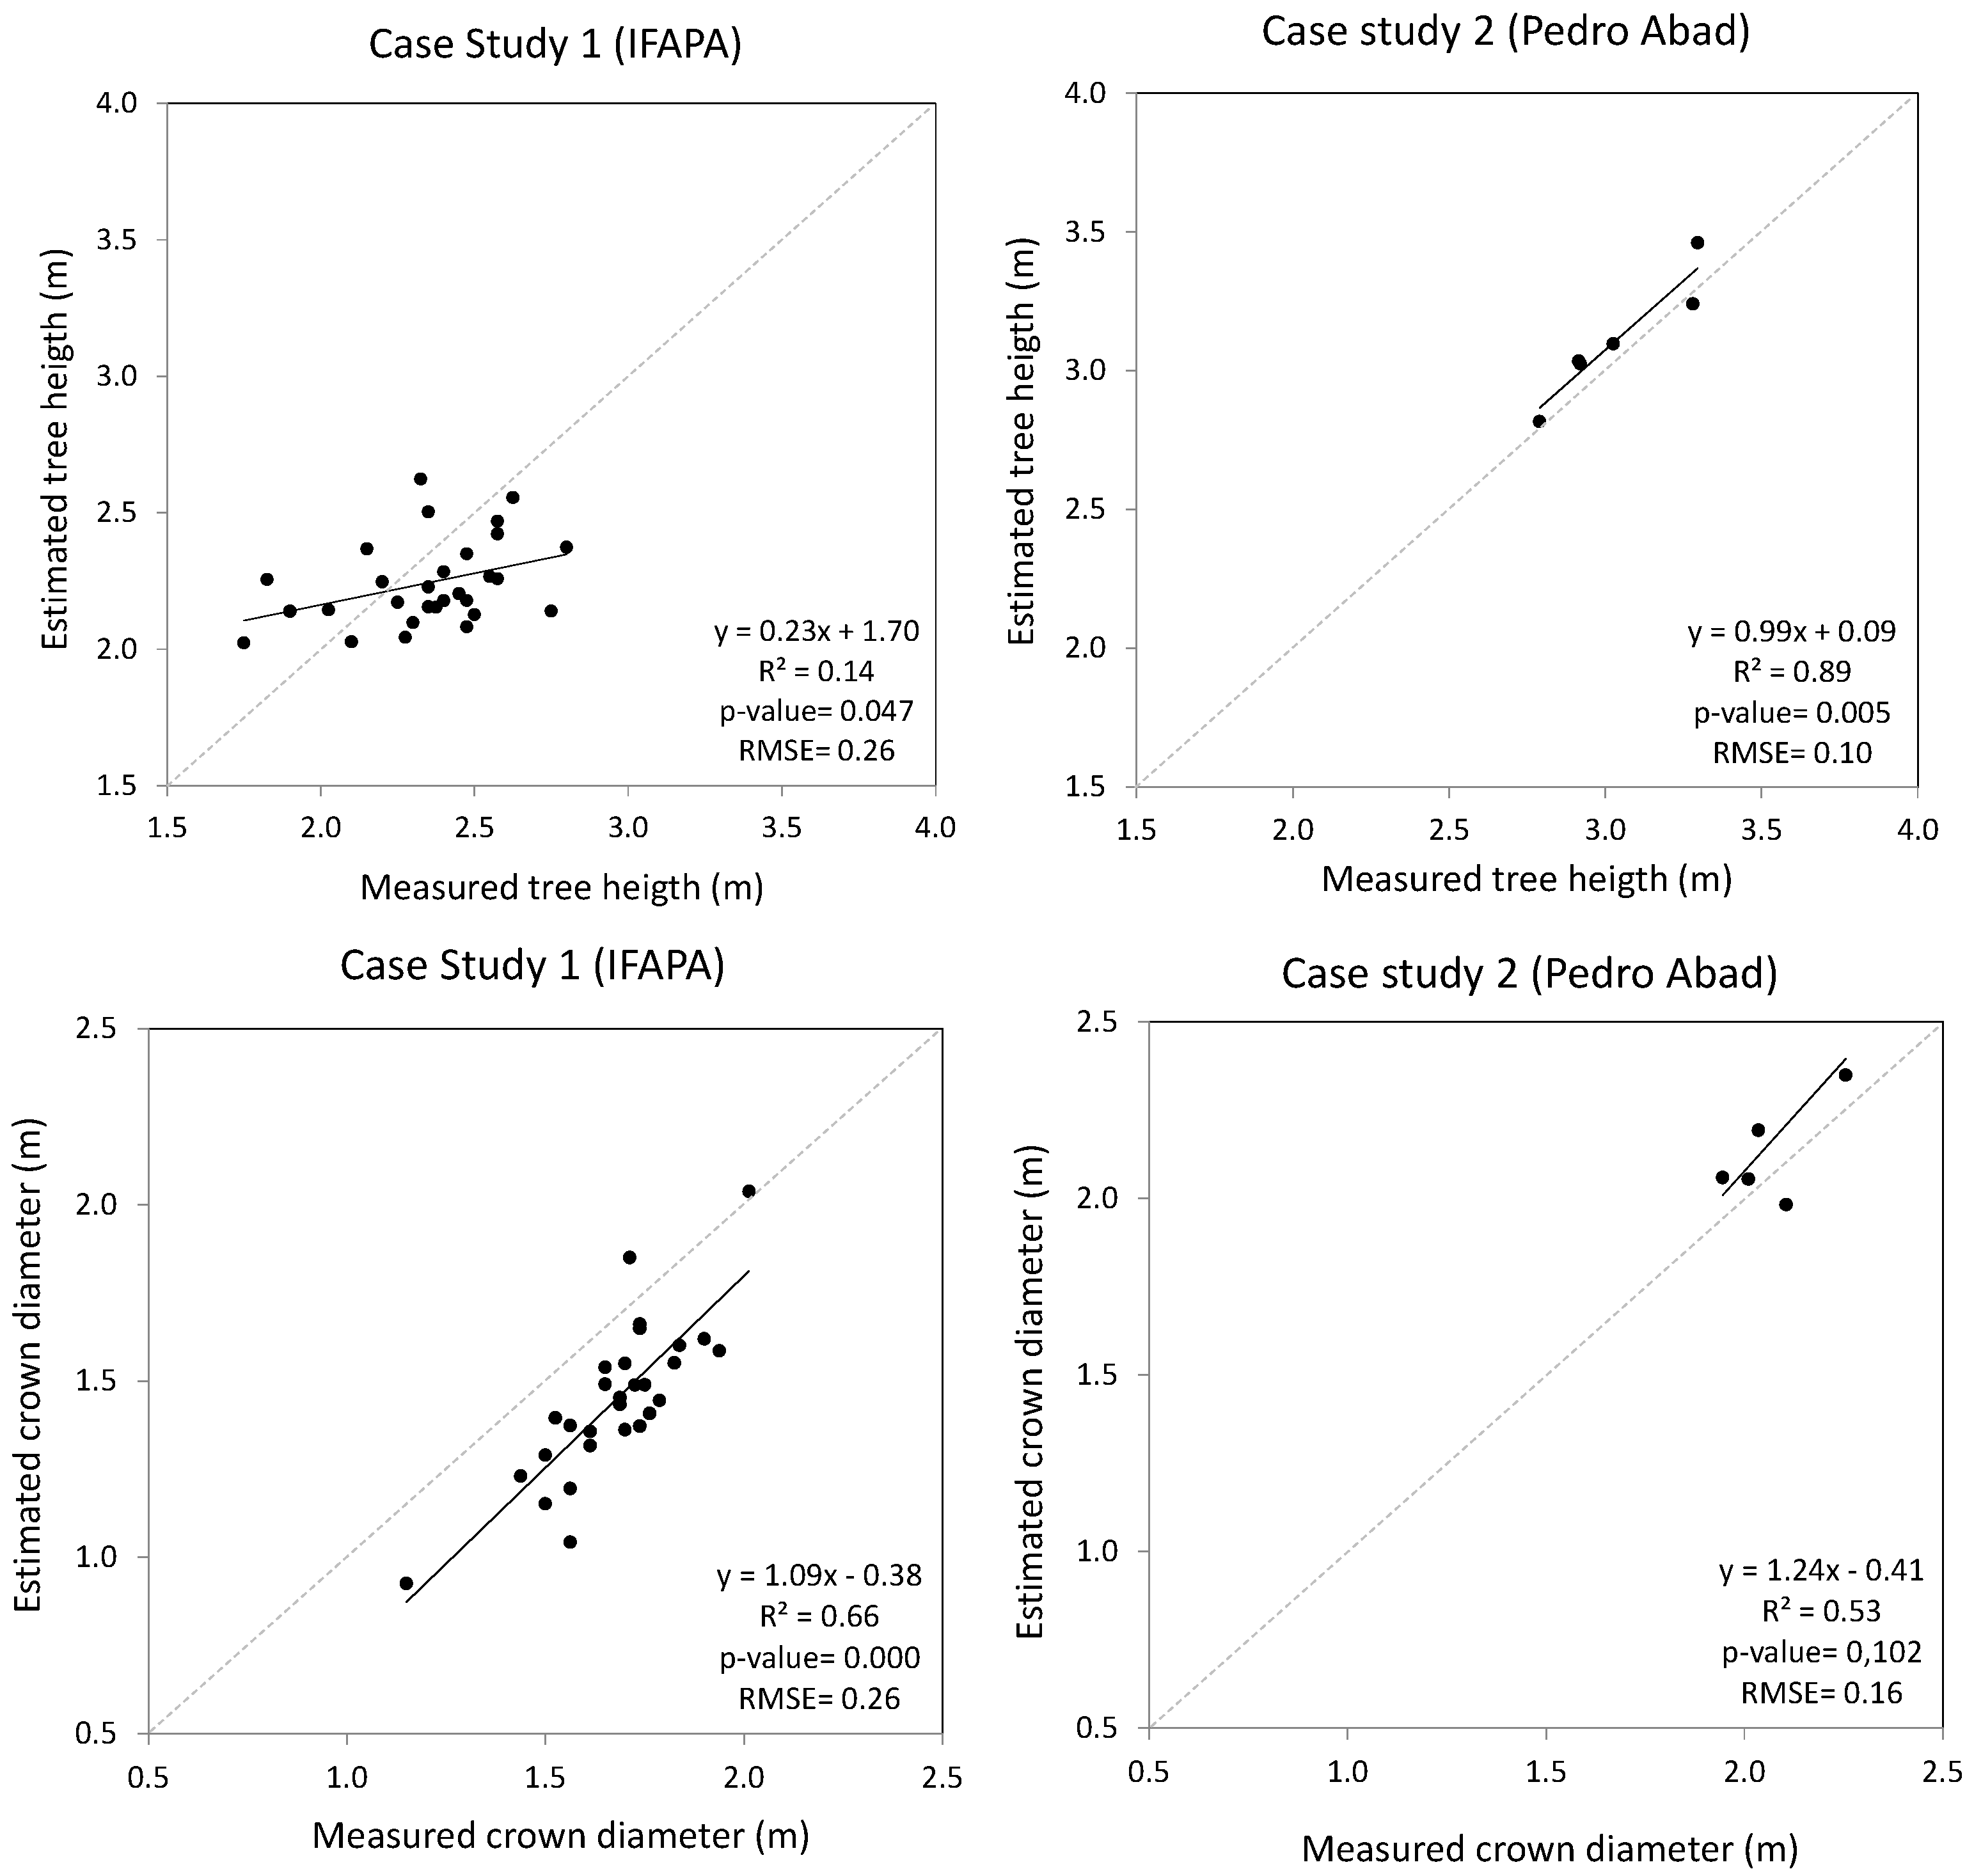
In order to check the applicability of UAV imagery to the estimation of tree parameters, the first level of analyses were conducted at the individual tree level for the case study IFAPA, whereas analyses were done at the hedgerow level for the study case Pedro Abad. Hence, for each study case set, the residuals were calculated as the difference between actual individual tree (IFAPA) or hedgerow (Pedro Abad) parameters measured in the field and estimated from the DSM. The root mean square error (RSME) of these residuals was calculated along with the regression fit and the squared correlation coefficient between measured and estimated tree parameters.
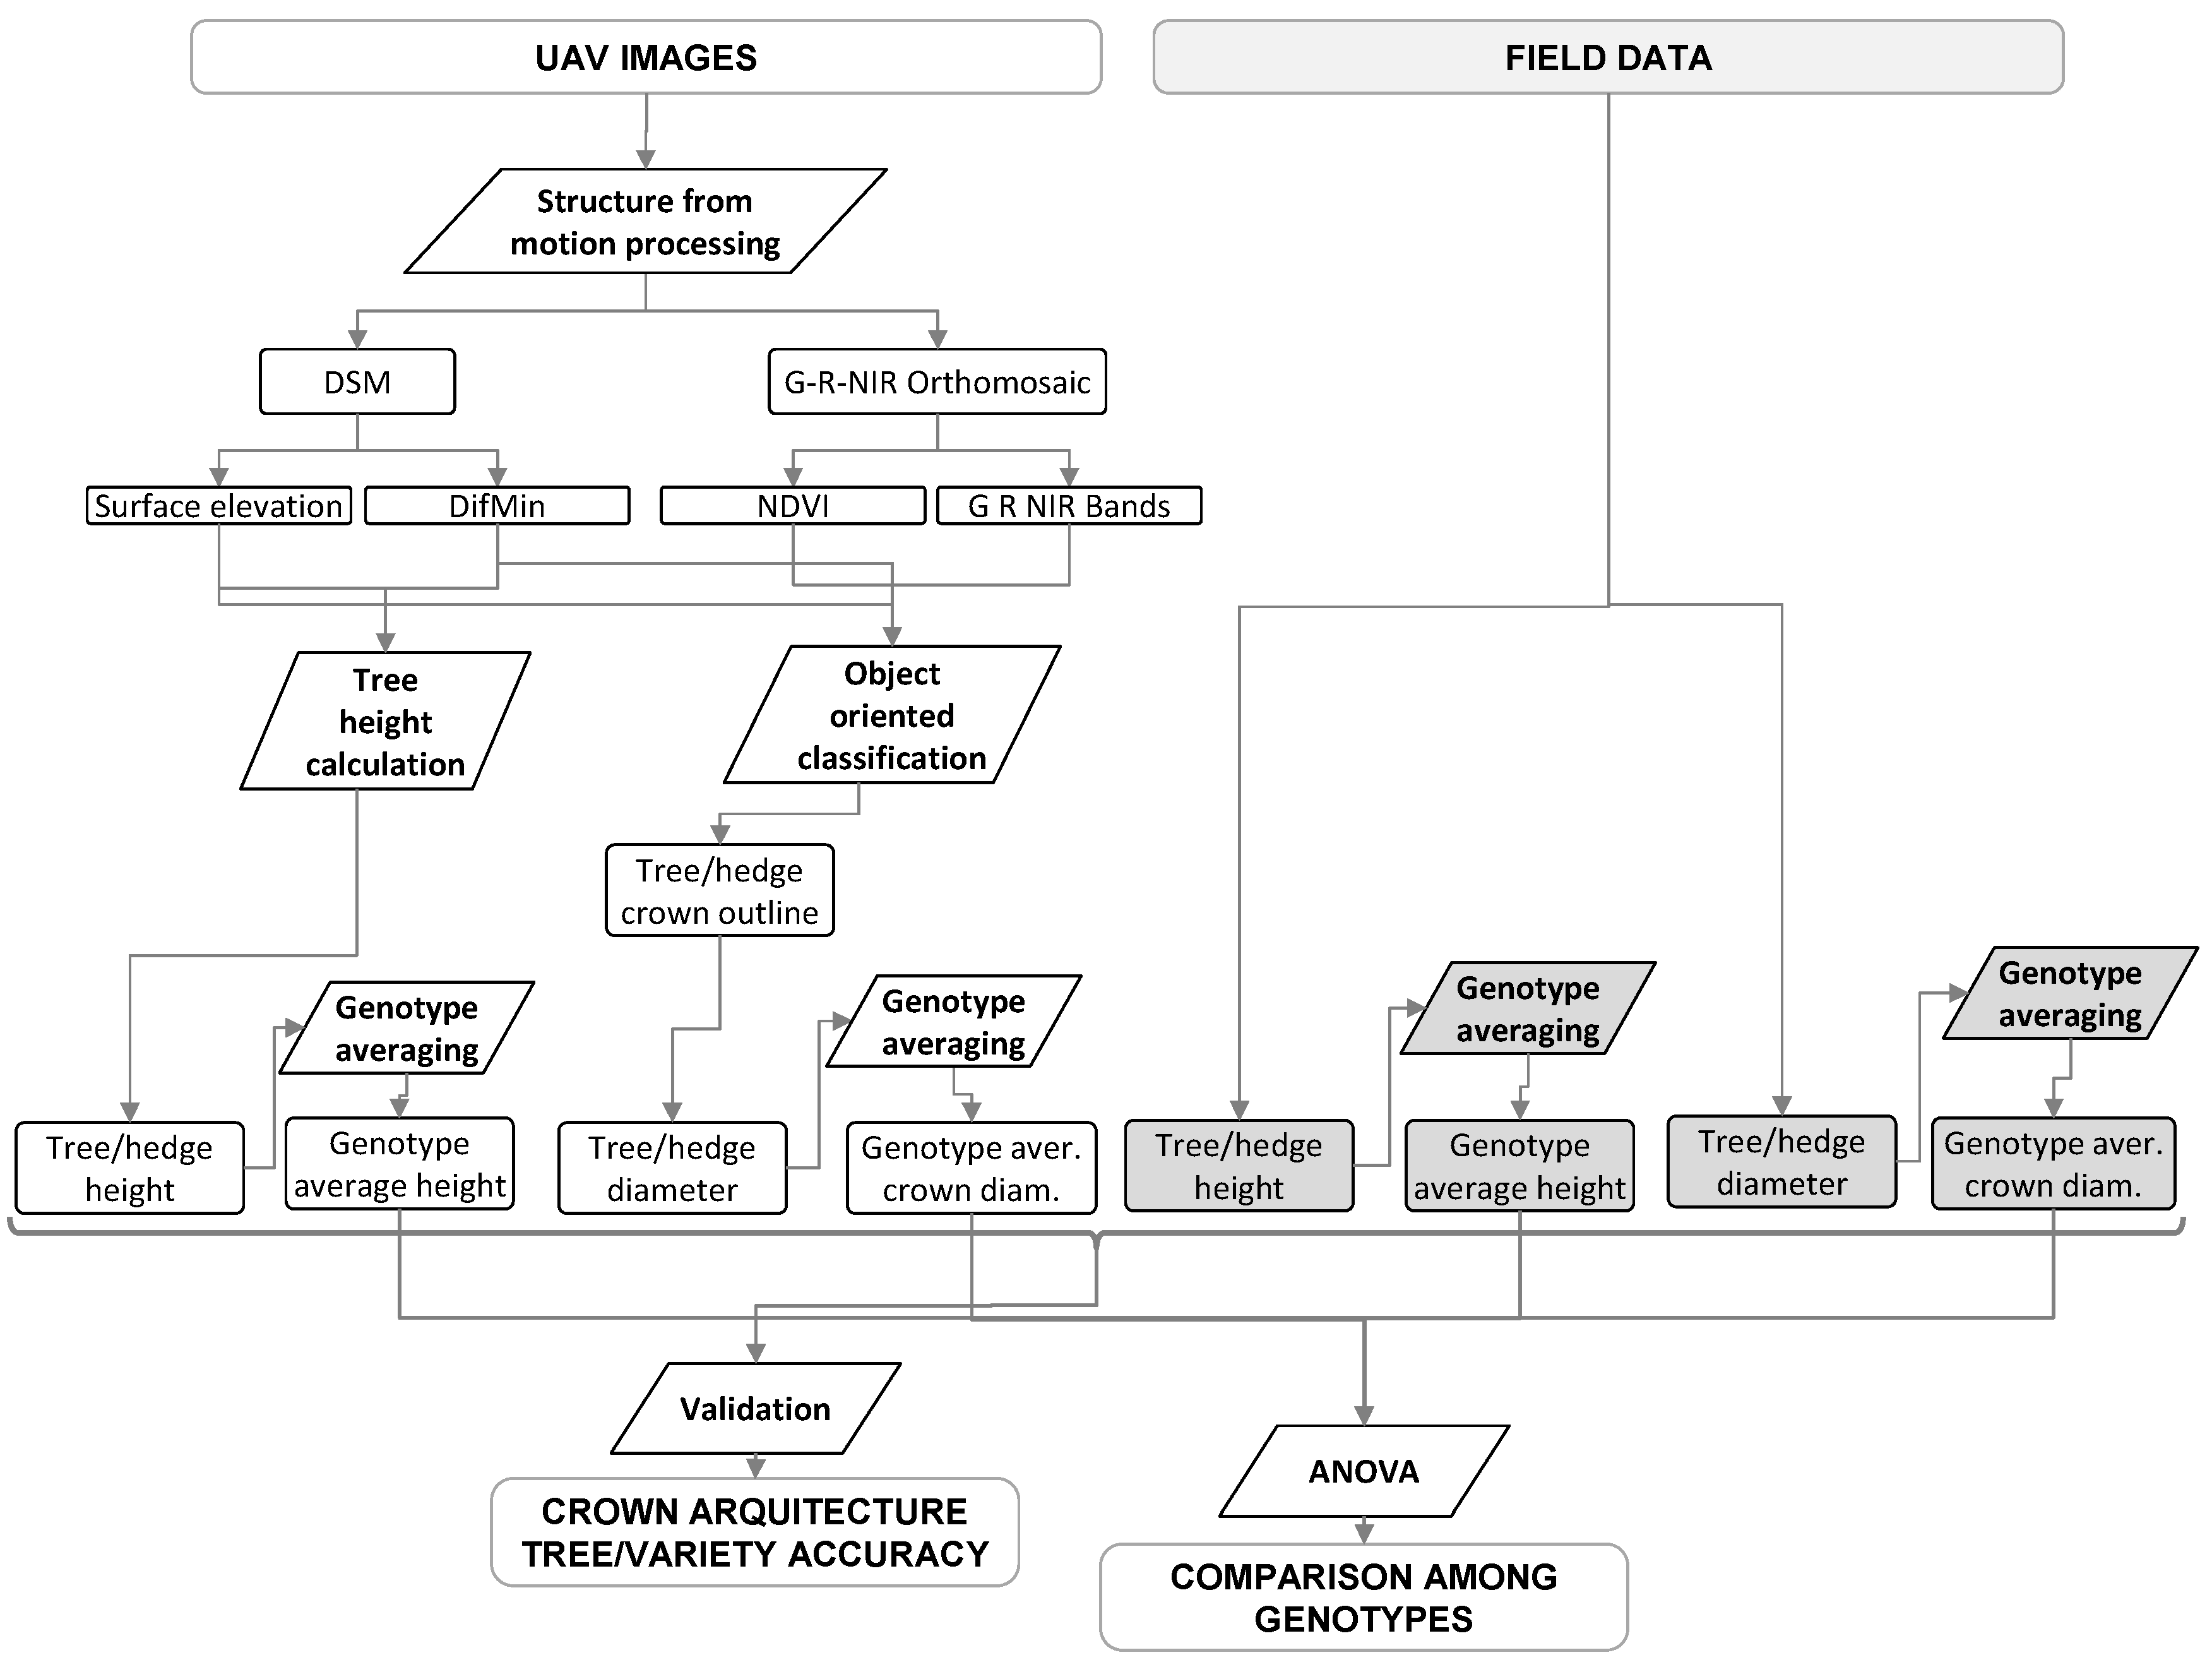
As one of the objectives of this experiment was to assess the performance of UAV imagery products for the monitoring of tree biometrics differences between genotypes, a second level of analyses was conducted averaging the tree parameters per genotype. Therefore, the RMSE, regression fits and squared correlation coefficients (R2) were also calculated at the genotype level for each study case. In addition, ANOVA analyses were conducted using the statistics package, R Studio V. 0.98.932 (® 2009–2013 R Studio, Inc., Boston, MA, USA), in order to check the significance of differences between the tree parameters for the different genotypes assessed in each study case. These analyses were done separately on the measured and estimated datasets, including only the genotypes represented in the randomized complete block design (i.e., not including the guard rows and hedgerows) in order to compare if the two methods led to similar conclusions.
4. Discussion
Plant architecture is one of the major traits of interest in fruit breeding in order to identify new cultivars adapted to a specific growing system [
2]. Therefore, the development of simple and reliable methods for the robust measurement and monitoring of plant morphological variables in the field, like height, biomass or leaf area [
11,
40,
41], is a topic of major interest. These variables are regarded as key factors in studies of tree breeding and phenotyping [
41,
42] in terms of the selection of optimum genotypes in different environments and, in general, for a better understanding of eco-physiological processes governing plant development [
40].
In the present work, we tested the performance of low-cost systems based on UAV imagery acquired with consumer-grade RGB cameras and image reconstruction techniques for measuring two of the main variables of olive tree architecture (namely tree height and crown diameter) in two breeding trials.
The results obtained confirmed the feasibility of the proposed methodology for an accurate and high throughput estimation of tree and crown parameters in two olive growing systems; particularly for the identification of differences in tree architecture between genotypes, which can be very useful in breeding programs. Yet, slightly lower accuracies were obtained at the individual tree/hedgerow scale.
In fact, height and crown diameter estimations showed an RMSE lower than 10% of the measured means in the case of trees in hedgerows at the genotype level. This is considered a low and acceptable error range for monitoring relevant traits between dates during tree development, taking into account the magnitude of potential errors inherent in manual measurements [
41,
43]. Errors were slightly higher for discontinuous canopies, but in any case, they were relatively low, namely 11 and 16% for height and crown diameter, respectively.
The accuracies obtained at the individual tree/hedgerow level also showed variations depending on the pattern of the tree orchard plantation. Results were again better in the case of hedgerows despite the theoretically higher difficulty in finding ground reference points due to the close canopy of hedgerows versus isolated trees. In fact, we obtained good agreements between the tree height and crown diameter estimations and measurements in this case (7% and 13% of relative RMSE, respectively). Therefore, the relatively even architecture of the crowns along the hedgerows might have compensated for the difficulty in finding ground references for the height calculation.
In turn, the estimation of the variables in discontinuous canopies gave less accurate results (relative RMSE of around 19% for both height and crown diameter). In these particular cases, we also obtained low correlations between the estimated and measured values, pointing out the existence of certain limitations in the method at this level. One of the possible reasons for the errors in height estimation in this case could be due to some particularities of the experimental plantation. In fact, the short distance between tress in the rows and the presence of vegetation stripes between rows (
cf.
Figure 3) could have masked the real value of the ground values in addition to the abovementioned potential effect of a more even crown architecture of the trees in hedgerows. In any case, the height estimation accuracy obtained was comparable, yet in some cases, somewhat lower than in previous works on tree crops in patterns. For example, [
11] reported an absolute RMSE between 0.3 and 0.4 m using a similar method; [
44] obtained absolute RMSEs between 0.42 and 0.52 m using UAV imagery reconstruction and a pouring algorithm for the delineation of tree crowns and apex; and [
7] reached an absolute RMSE of 0.4 m using a close-range Nadir ILRIS-3D sensor.
Results showed better accuracy for tree height estimation than for crown diameter in the case of hedgerows, both at the hedgerow and genotype level. In turn, this trend was not so clear in the case of discontinuous canopies, where only small differences in the accuracies of tree height and crown diameter were recorded, both at the isolated tree and genotype level. This difference between hedgerow height and diameter estimation could be due to the limitations of the remote sensing method. Yet, it could be argued, as we discuss below, that the inherent difficulties of the manual measurement of diameters across the hedgerows could compromise the validity of the reference data. It is also worth pointing out that such differences spans a few centimeters and that in experiments like the one conducted in the present work, the consideration or not of a single branch or shoot as indicative of the tree apex or crown diameter could explain these differences. In fact, some works consider that the tree height measurement is only possible to decimeter accuracy [
44], sub-decimeter differences being difficult to attribute to the real accuracy of the estimation or to uncertainties in the reference data acquisition.
Estimations from imagery tend to show a slightly higher dispersion of data that could be linked to image artifacts due to acquisition or processing errors, but could also be linked to human factors in the field measurement of reference data that could mask out irregularities (protruding branches) in manual measurement. In fact, the nadir view of the tree crown in the height estimation from remote sensors could take into account tree irregularities ignored by the operator in field measurements [
7]. It is also worth pointing out that the present method allows the reconstruction of the whole tree or hedgerow crown projection, solving the difficulties of the manual measurement of this variable in the field [
45], and it also provides a model of the 3D architecture of the upper part of the crown, which could be eventually used in modelling the whole crown shape.
Finally, the results also showed an overall agreement between the modelled and measured variables for both study cases in terms of finding statistically-significant differences between genotypes, pointing out a promising role of consumer-grade cameras on UAVs for field phenotyping purposes. In fact, the field and remote sensing methods disagreed only in the variable tree heights for discontinuous plantation, where field measurements showed significant differences between genotypes, while remote sensing estimations did not show such differences. For the other variables, the analysis of variance provided similar significant differences and distribution of sums of squares among sources of variation (genotype, block, residuals) in both measured and estimated parameters, which indicates that estimated results could be efficiently used for testing the genotype effect in olive breeding trials.
5. Conclusions
Breeding selection is in need of robust methods for the quantitative evaluation of a high number of genotypes and/or trials in an accurate way. In olive, as for other fruit trees, the characterization of the tree crown is a key issue to determine the adaptation of a genotype to a given growing system. In the present work, we tested the performance of a workflow based on low-cost UAV imagery for the estimation of tree crown parameters (namely, tree height and crown diameter) in the framework of olive tree breeding programs, both on discontinuous canopy (open vase configuration) and continuous canopy (hedgerow) orchards. The workflow involved image acquisition with consumer-grade cameras on board UAV platforms, orthomosaic and DSM generation using SfM image reconstruction and, eventually, GIS analyses and object-based classification for the calculation of tree parameters.
Comparison between reference field measurements and remote sensing estimation of crown parameters confirmed the performance of the workflow applied here as a quick and cost-effective alternative for the characterization of the olive tree crown, both in discontinuous canopy (open vase configuration) or continuous canopy (hedgerow). High accuracies were recorded at the individual hedgerow level (continuous canopy), both in height and crown diameter estimation. At the individual tree level (discontinuous canopy), accuracies were somehow lower, but in any case, satisfactory. These results were improved in the analyses at the genotype level for height and crown diameter, both on continuous and discontinuous canopy. With the exception of tree height for discontinuous canopy, the ANOVA analyses also showed the agreement between remote sensing estimation and field measurement in terms of the assessment of statistically-significant differences between genotypes in phenotyping studies, pointing out the interest in these data and techniques to be incorporated into the selection scheme in breeding programs.
It should be also noted that the image reconstruction processing was done without ground reference points, being a possibility for a potential improvement of the results. In any case, the ranges of disagreement between the remote sensing estimations and the field measurements were very close to the level of uncertainty in the field reference data acquisition, particularly in the case of analyses at the genotype level, and this fact could compromise the validation of further improvements in the methods. In this sense, further research could focus on the isolation of error sources, e.g., by adding an additional step in the validation as the manual measurement of the tree crown diameter, in order to identify and focus efforts on critical steps in the workflow (i.e., either on the orthomosaic and DSM production, on the image analysis or even in the reference data acquisition). Future research could also replicate the experiment using LIDAR data in order to compare its performance against the low-cost alternative of orthomosaics and DSM obtained by SfM image.


