Article

Comparative Assessment of Satellite-Retrieved Surface Net Radiation: An Examination on CERES and SRB Datasets in China

1
Key Laboratory of Watershed Geographic Sciences, Nanjing Institute of Geography and Limnology, Chinese Academy of Sciences, 73 East Beijing Road, Nanjing 210008, China
2
University of Chinese Academy of Sciences, 19 Yuquan Road, Beijing 100049, China
*
Author to whom correspondence should be addressed.
Remote Sens. 2015, 7(4), 4899-4918; https://0-doi-org.brum.beds.ac.uk/10.3390/rs70404899
Submission received: 27 January 2015 / Revised: 11 April 2015 / Accepted: 14 April 2015 / Published: 21 April 2015
(This article belongs to the Special Issue Remote Sensing of Solar Surface Radiation)

Abstract

:
Surface net radiation plays an important role in land–atmosphere interactions. The net radiation can be retrieved from satellite radiative products, yet its accuracy needs comprehensive assessment. This study evaluates monthly surface net radiation generated from the Clouds and the Earth’s Radiant Energy System (CERES) and the Surface Radiation Budget project (SRB) products, respectively, with quality-controlled radiation data from 50 meteorological stations in China for the period from March 2000 to December 2007. Our results show that surface net radiation is generally overestimated for CERES (SRB), with a bias of 26.52 W/m2 (18.57 W/m2) and a root mean square error of 34.58 W/m2 (29.49 W/m2). Spatially, the satellite-retrieved monthly mean of surface net radiation has relatively small errors for both CERES and SRB at inland sites in south China. Substantial errors are found at northeastern sites for two datasets, in addition to coastal sites for CERES. Temporally, multi-year averaged monthly mean errors are large at sites in western China in spring and summer, and in northeastern China in spring and winter. The annual mean error fluctuates for SRB, but decreases for CERES between 2000 and 2007. For CERES, 56% of net radiation errors come from net shortwave (NSW) radiation and 44% from net longwave (NLW) radiation. The errors are attributable to environmental parameters including surface albedo, surface water vapor pressure, land surface temperature, normalized difference vegetation index (NDVI) of land surface proxy, and visibility for CERES. For SRB, 65% of the errors come from NSW and 35% from NLW radiation. The major influencing factors in a descending order are surface water vapor pressure, surface albedo, land surface temperature, NDVI, and visibility. Our findings offer an insight into error patterns in satellite-retrieved surface net radiation and should be valuable to improving retrieval accuracy of surface net radiation. Moreover, our study on radiation data of China provides a case example for worldwide validation.

Graphical Abstract

1. Introduction

Surface net radiation is the net amount of radiative fluxes entering and leaving the Earth’s surface. It is composed of four components, including downward shortwave radiation (S↓), upward shortwave radiation (S↑), downward longwave radiation (L↓), and upward longwave radiation (L↑). Net shortwave radiation (NSW) is the difference between S↓ and S↑, whereas net longwave radiation (NLW) is the difference between L↓ and L↑. The net radiation controls sensible and latent heat fluxes, the main energy sources driving atmospheric movement and development of the planetary boundary layer [1,2]. It plays an important role in land–atmosphere interactions [3,4,5].
Surface net radiation can be directly measured with a pyrradiometer using an empirical relationship between the instrumental electric potentials and the radiation intensity, with an overall accuracy of 95% [6,7]. Now, worldwide ground-based measurements are readily available. Examples include Global Energy Balance Archive (GEBA) [8], Baseline Surface Radiation Network (BSRN) [9], Surface Radiation Budget Network (SURFRAD) [10], and FLUXNET [11]. The BSRN is estimated to have an overall accuracy of 5 W/m2 for shortwave and 10 W/m2 for longwave radiation [12]. The GEBA is reported to have an error within 5% in monthly shortwave radiation [13]. However, surface observations are generally distributed at inhabitable areas, but rarely at rural and oceanic regions [14]. The non-uniform distribution of site observations has impeded its application from global analysis of radiation change.
Alternatively, remote sensing provides an ideal way to obtain global radiation data in view of temporal continuity and spatial homogeneity [15]. Net radiation can be retrieved from the remotely sensed data with a retrieval algorithm, or calculated from its four radiative components with the principle of energy balance. The widely used satellite products of radiation include the Surface Radiation Budget project (SRB) [16], the Clouds and the Earth’s Radiant Energy System (CERES) [17], and the International Satellite Cloud Climatology Project (ISCCP) [18]. The products have been extensively evaluated with surface observations or inter-compared at a regional or global scale [19,20,21,22,23,24,25,26]. For example, Hinkelman et al. [21] compared SRB data with BSRN monthly data at six globally representative BSRN sites during 1992 to 2005, and reported that SRB had a bias of −7.49 W/m2 with a root mean square error (RMSE) of 23.28 W/m2. The latest version had a bias of −4.2 W/m2 (−0.1 W/m2) with an RMSE of 23.1 W/m2 (11.2 W/m2) for SRB S↓ (L↓) fluxes, compared to BSRN between 1992 and 2007 [23]. Kato et al. [25] claimed that CRERS monthly S↓ (L↓) data compared to ground observations at 24 sites had a bias of −1.70 (−1.00 W/m2) with an RMSE of 7.80 (7.60 W/m2) over the global land area. Koster et al. [26] used ISCCP-FD data to estimate SRB surface NSW radiation, and the uncertainty range is expected to be within ±10 W/m2 (about 8% of globally averaged surface net radiation). Overall, satellite products prove to have an acceptable accuracy for radiation at global scale, but their accuracies may be regionally different. As a result, regional-scale inter-comparison and site-based validation of satellite radiation data are in urgent need to ensure high-quality retrieval of other parameters, such as evapotranspiration [27,28].
This study uses nationwide surface observations of China’s meteorological sites to evaluate surface net radiation generated from the SRB and CERES products, respectively, and to identify main error sources in the net radiation for possible improvement. The sites are distributed between 18°N and 54°N, and 76°E and 128°E, with altitude ranges between 2.5 m and 4278.0 m. The observation sites represent a wide range of landscape, climatic, and hydrogeological conditions, and have been used to validate remote sensing radiation products such as insolation [29,30] and surface shortwave radiation [31]. This paper is organized as follows: Section 2 introduces data for accuracy evaluation and methods for data processing, and Section 3 presents spatial and temporal distribution of errors in surface net radiation, and discusses the main factors contributing to the errors. Section 4 comes to conclusions.

2. Data and Methods

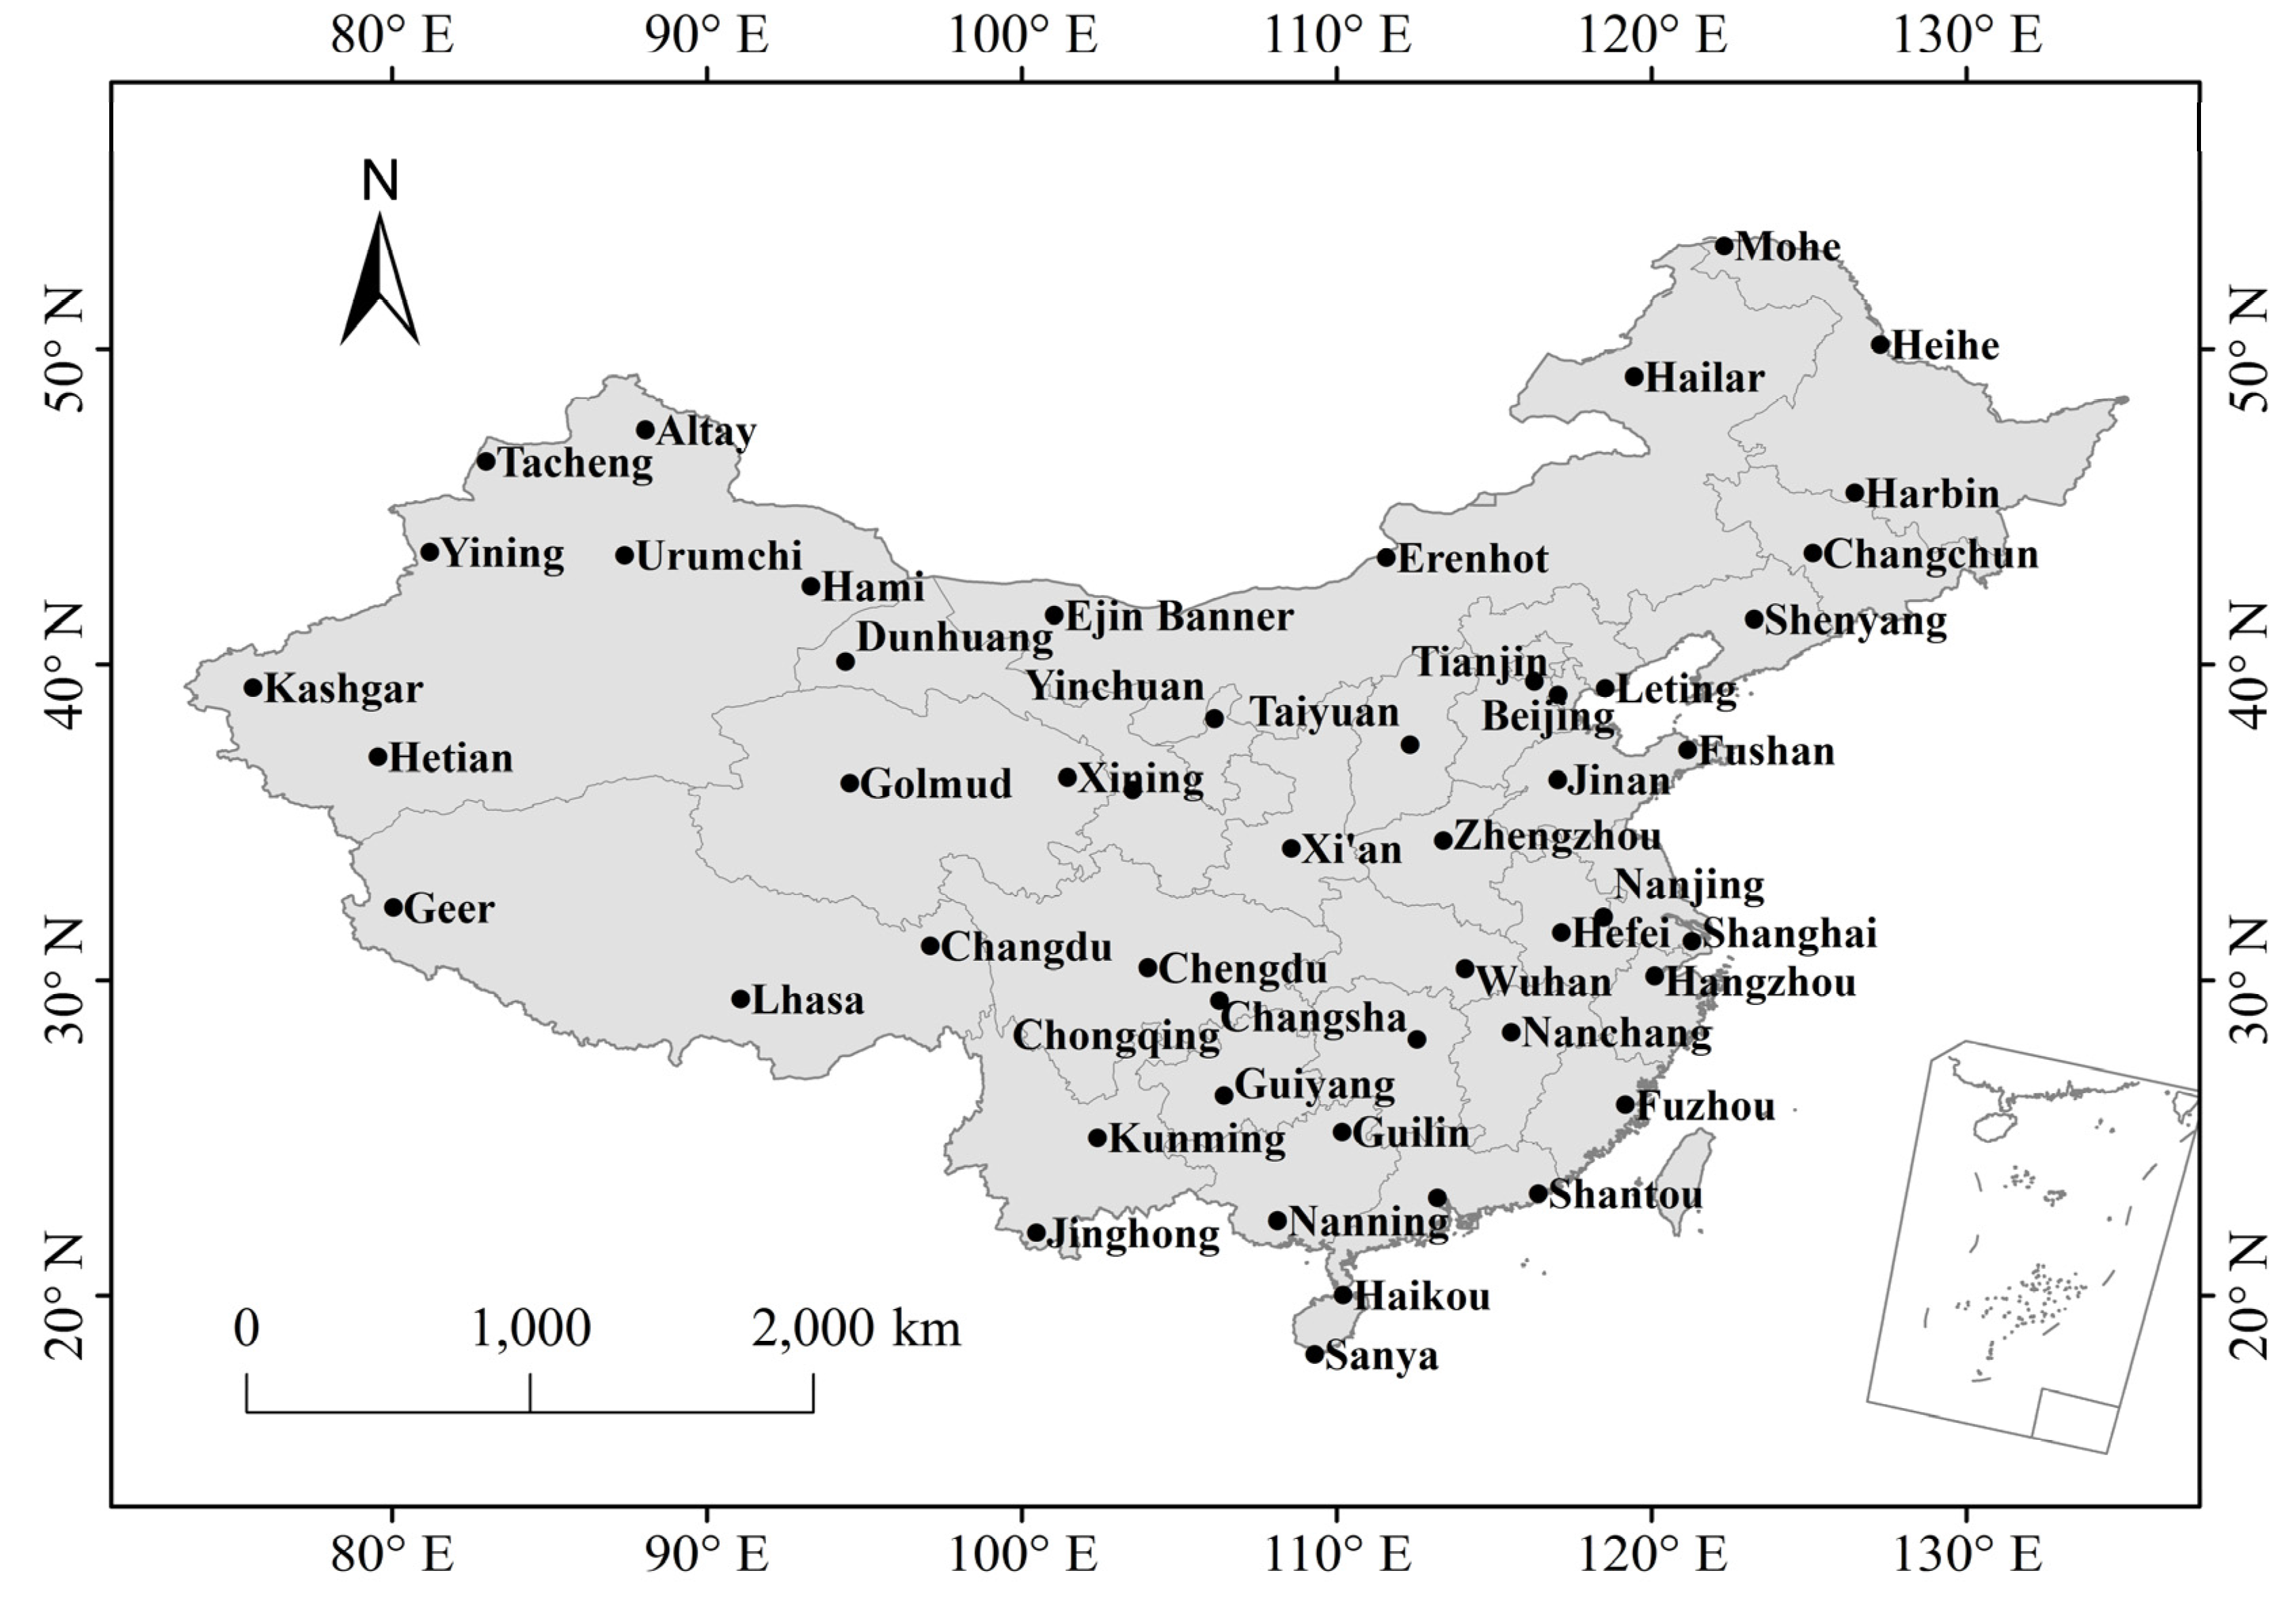
2.1. Ground-Measured Data

A total of 50 Chinese meteorological sites measuring surface radiation are used for data comparison and accuracy assessment (Figure 1). Radiation, land surface temperature (LST), surface water vapor pressure (WVP), cloud fraction (CF), and visibility are available from the sites. Acquired from the National Meteorological Information/Centre of Chinese Meteorological Administration, the data span from March 2000 to December 2007. All the data are quality controlled [32].
Figure 1. Distribution of Chinese meteorological sites used in the present study.
Remotesensing 07 04899 g001
The sites are classified into two levels (level-1 and level-2). S↓, net radiation, diffuse radiation, direct radiation (vertical and horizontal), and S↑ are available from level-1 sites. S↓ and net radiation are available from level-2 sites. Net radiation (Rn) can be described as follows
R n = S S + L L
In all the sites, automatic thermoelectric pyranometers (DFY-4) are used as a standard instrument for measuring radiative fluxes. All the radiative receivers were calibrated using a multistep method. All the radiometers were calibrated at least once per month at the stations against reference radiometers, and the reference radiometers were calibrated against regional reference radiometers. The regional reference radiometers were calibrated against the Chinese reference radiometers every two years, and the Chinese reference radiometers were calibrated at the World Radiation Center or Asia Regional Radiation Center every five years to ensure the consistency of China national radiation standard with international standard [7]. Shi et al. [33] declared that the measurement error of the pyrradiometer was less than 5%, and 3% for global radiation [30].

2.2. Satellite Data

Surface net radiation data are taken from the GEWEX-SRB products (version 3.0 for shortwave and version 3.1 for longwave) and the CERES EBAF-Surface Product (version 2.7), respectively. The SRB product has a spatial resolution of 1° × 1° and a temporal resolution of 3 h with an uncertainty of 10 W/m2 for net surface radiation [34]. The CERES product has a similar spatial and temporal resolution. The uncertainties of individual CERES radiation components are all within 20 W/m2 at monthly gridded scales [24]. The datasets are produced, archived, and made available to the scientific community by the Langley Research Center (LaRC), the Atmospheric Sciences Data Center (ASDC), and the National Aeronautics and Space Administration (NASA) [35,36,37]. The SRB radiation product spans from July 1983 to December 2007, while the CERES covers March 2000 to July 2013. The present study uses the monthly net radiation data for March 2000–December 2007, the overlapping time span of SRB and CERES products. The surface albedo is taken from SRB LPSA SW (version 3.0), which was produced by the NASA LaRC ASDC [38].
The SRB radiation product is generated from the Pinker/Laszlo’s shortwave algorithm [39,40] and the Fu et al. thermal infrared radiative transfer code [41]. The CERES radiation product is produced with the Li et al. shortwave algorithm [42] and the Gupta et al. longwave algorithm [43,44]. The Li et al. algorithm [42] is a simple parameterization for estimating surface-absorbed flux from satellite-measured reflected flux at the top of the atmosphere (TOA). Li’s extensive radiative transfer modeling for clear sky and four different kinds of cloud atmospheric conditions suggests a linear relationship between the TOA-reflected flux and the flux absorbed at the surface for a fixed solar zenith angle (SZA). The linear relationship is independent of cloud-optical thickness and surface albedo, and depends strongly on SZA and moderately on precipitable water and cloud type. The Gupta et al. algorithm [43,44] is a parameterization of radiative transfer equation for surface longwave radiation. The algorithm requires the atmospheric humidity and temperature profiles as input provided by satellite retrieval products. The Pinker et al. algorithm [39,40] uses the δ-Eddington approximation to parameterize the optical properties of Rayleigh scattering, water vapor and ozone absorption, aerosol absorption and scattering, and cloud absorption and scattering. Broadband albedo is obtained from lookup table with the knowledge of surface albedo, ozone and water vapor content for estimating radiation. The Fu et al. algorithm [41] uses the δ-two- and four-stream combination approximation to iteratively calculate the diffuse intensity in order to obtain the surface longwave radiation.
Since all the retrieval algorithms require input data for the production, input errors may result in output errors. For example, surface albedo may impose direct impact on NSW [39,40] and visibility is related to aerosol optical depth, both of which may introduce uncertainty in NSW radiation [45]. Land surface temperature affects air temperature, and both of them control NLW radiation [46,47,48]. Cloudiness may have an influence on both NSW and NLW radiation [49]. Water vapor pressure affects S↓ and NLW radiation [50,51]. In order to identify error sources in the SRB and CERES products, the necessary input data to the retrieval algorithms are also acquired as follows. CERES shortwave algorithm inputs include TOA insolation, TOA upward flux, SZA, and total water vapor amount. CERES longwave algorithm inputs include surface temperature, fractional cloud cover, effective emitting temperature of the atmosphere, cloud-base temperature, water vapor burden below the cloud base, total water vapor amount, and surface emissivity. SRB shortwave algorithm inputs include SZA, ozone amount, surface albedo, aerosol optical depth, water vapor amount, cloud, atmosphere humility profile, and TOA insolation. SRB longwave algorithm inputs include SZA, atmosphere profile (optical depth in normal direction, single-scattering albedo, and air temperature), surface temperature, surface emissivity, and H2O/CO2/O3/CH4/NO2 content [39,40,41,42,43,44].
For SRB product, cloud parameters are available from the ISCCP-DX data products [52]. Temperature and moisture profiles are obtained from the 4-D data assimilation of the Goddard EOS Data Assimilation System level-4 (GEOS-4), available from the Global Modeling and Assimilation Office (GMAO) at the NASA Goddard Space Flight Center (GSFC) [53]. Column ozone data are obtained from the Total Ozone Mapping Spectrometer (TOMS) archive. Surface emissivity is taken from a global map developed at NASA LaRC [54]. For the CERES product, aerosol, cloud, and atmospheric profile information are acquired from the Moderate Resolution Imaging Spectroradiometer (MODIS)/the Model of Atmospheric Transport and Chemistry (MATCH), MODIS/GEOS-4, and GEOS-4, respectively. Solar insolation and TOA broadband fluxes are available from the Solar Radiation & Climate Experiment (SORCE) Total Irradiance Monitor (TIM) [55].
In addition, 1-km monthly SPOT Normalized Difference Vegetation Index (NDVI) data were obtained from the Cold and Arid Regions Sciences Data Center of Chinese Academy of Sciences. NDVI has been used as a proxy of the nature of underlying surface. It has a high linear correlation with surface emissivity, which determines NLW [56].

2.3. Metrics for Accuracy Assessment

Mean error (ME) and RMSE are used to quantify errors in surface net radiation generated from the CERES and SRB products. ME quantifies the average absolute difference between pixel values (pi) and surface observations (si), where i=1, …, n and n is the number of pair data for comparison. RMSE is the standard deviation of the pixel values around surface observations, quantifying the uncertainty of satellite retrievals [57]. It represents a combination of standard deviation and bias. Basically, the RMSE represents the sample standard deviation of the differences between pixel values and observed values. Their definitions are described as follows:
M E = i = 1 n ( p i s i ) n
R M S E = i = 1 n ( p i s i M E ) 2 n 1
In addition, linear regression approach is used. Correlation coefficient (R2), slope, and intercept of the linear fit between the SRB, the CERES, and the surface observations are subsequently obtained. The regression analysis is used in combination with a statistical test to determine whether the slope of the fitted trend is significant (95%). Similar linear fitting and significance testing are performed between radiation errors and potential influencing factors.

3. Result and Discussions

With regard to spatial representativeness of point measurements for radiation validation, the coarse resolution of CERES and SRB do likely contribute to the errors of satellite retrieval products. Hakuba et al. [58] proved that the radiation within 1° × 1° deviated by only several percent (2% or 3%) from site-centered measurements. However, in mountainous regions as well as many coastlines, higher errors may occur. Kato et al. [24] also pointed out that the difference of monthly mean S↓ and L↓ observed at mountain and coastal sites can be greater than, respectively, 20 W/m2 and 40 W/m2 compared to the monthly gridded values where the surface site is located. Overall, the uncertainty is within the accuracy limit of pyrradiometer measurements (less than 5% for monthly value) at the inland sites in China [33].
Figure 2. Comparison of monthly net radiation derived from the CERES and the SRB products with surface observations at 50 meteorological sites in China. (a) Surface observations versus CERES data; (b) surface observations versus SRB data; and (c) SRB versus CERES.
Remotesensing 07 04899 g002

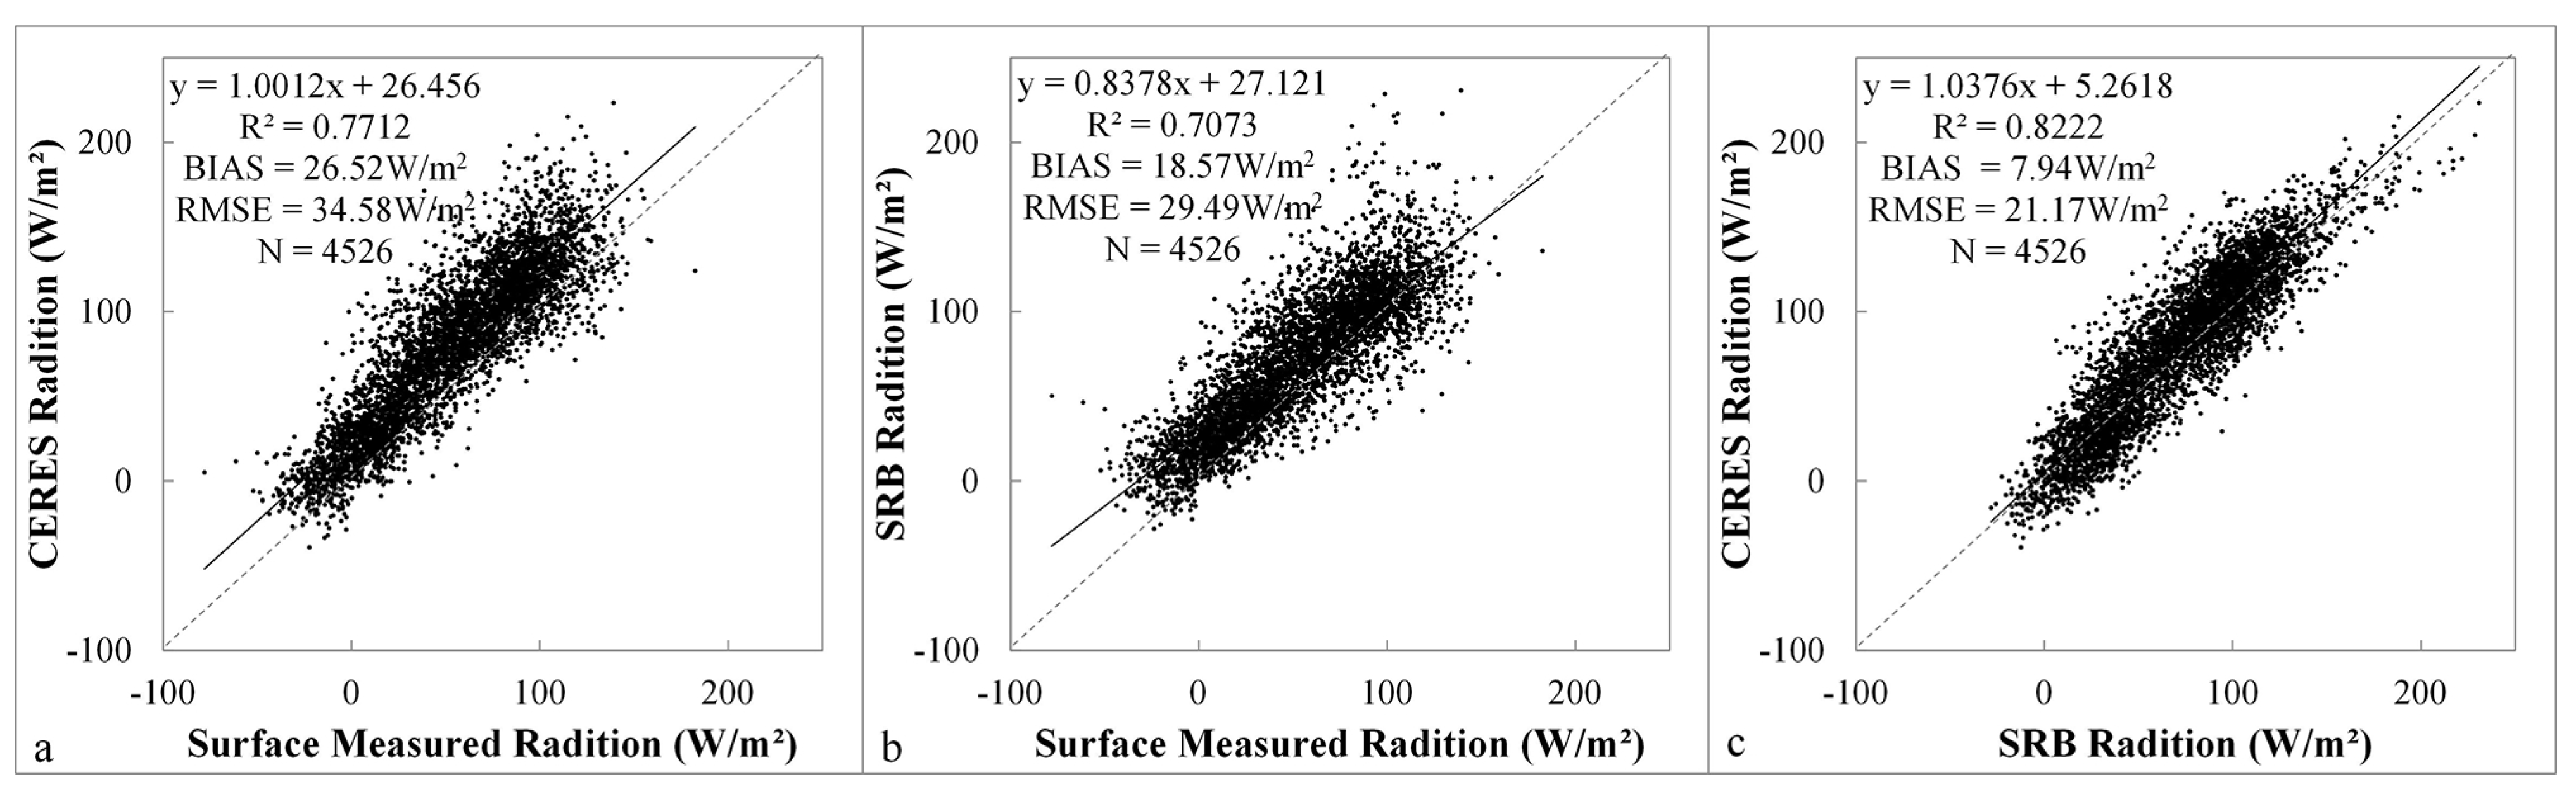
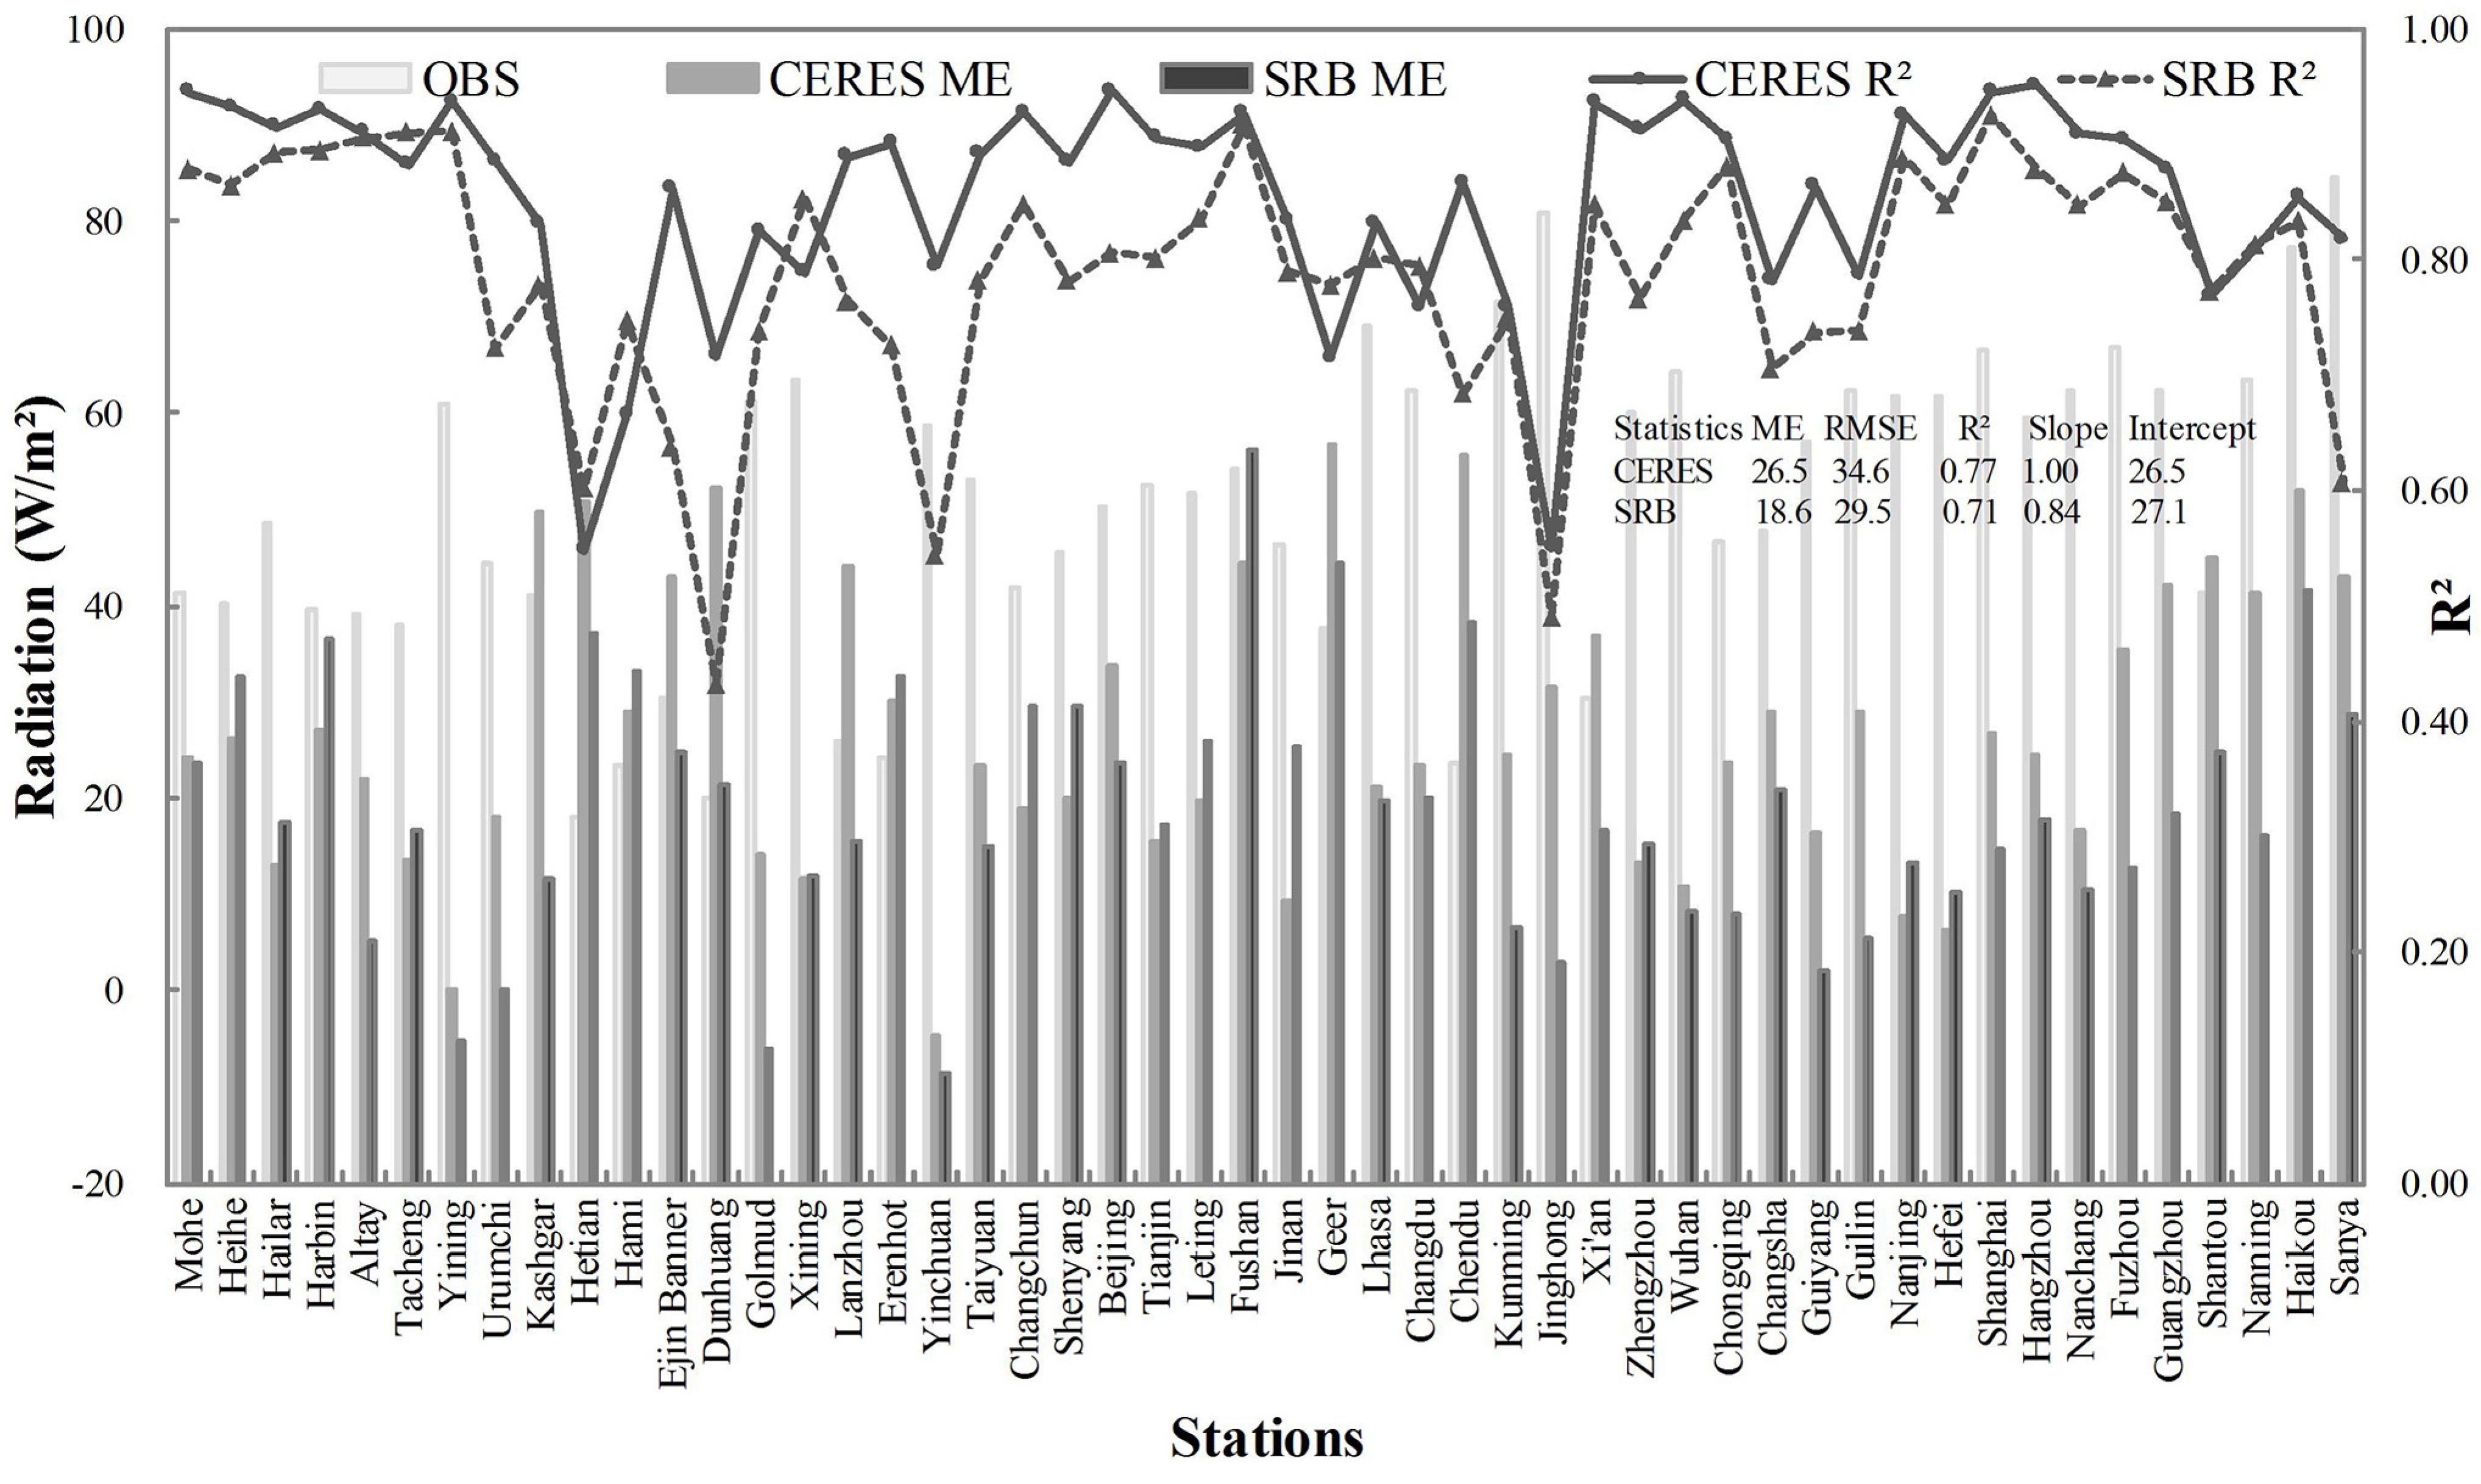
3.1. Overall Accuracy

Figure 2 compares the monthly surface net radiation generated from the CERES and SRB products with surface observation. The CERES and the SRB radiation are in agreement with surface observation by a correlation coefficient of 0.77 and 0.71 (at 95% confidence level), respectively. The regression line between the CERES (SRB) and observed radiation shows a slight deviation from the 1:1 line, with a slope of 1.00 (0.84) and an intercept of 26.46 W/m2 (27.12 W/m2). It demonstrates that the CERES data have a better consistency with surface observation than the SRB data. Furthermore, the ME is 26.52 W/m2 (18.57 W/m2) and the RMSE is 34.58 W/m2 (29.49 W/m2) between the CERES (SRB) and surface observation. It indicates that the CERES data have relatively larger errors than the SRB.
The CERES and the SRB data are highly correlated with an R2 of 0.82, indicating a high degree of consistency. Notably, the CERES data are generally 7.94 W/m2 higher than the SRB. Their overall differences are 21.17 W/m2 in terms of RMSE, suggesting considerable discrepancies between the two datasets.

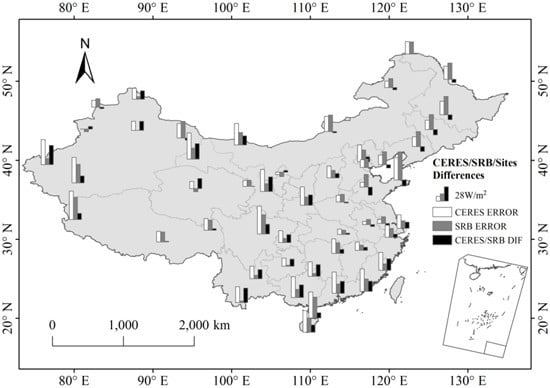
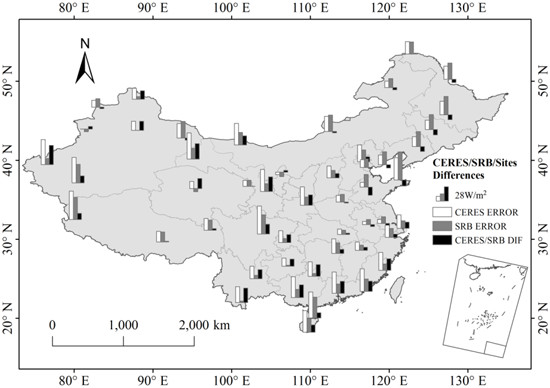
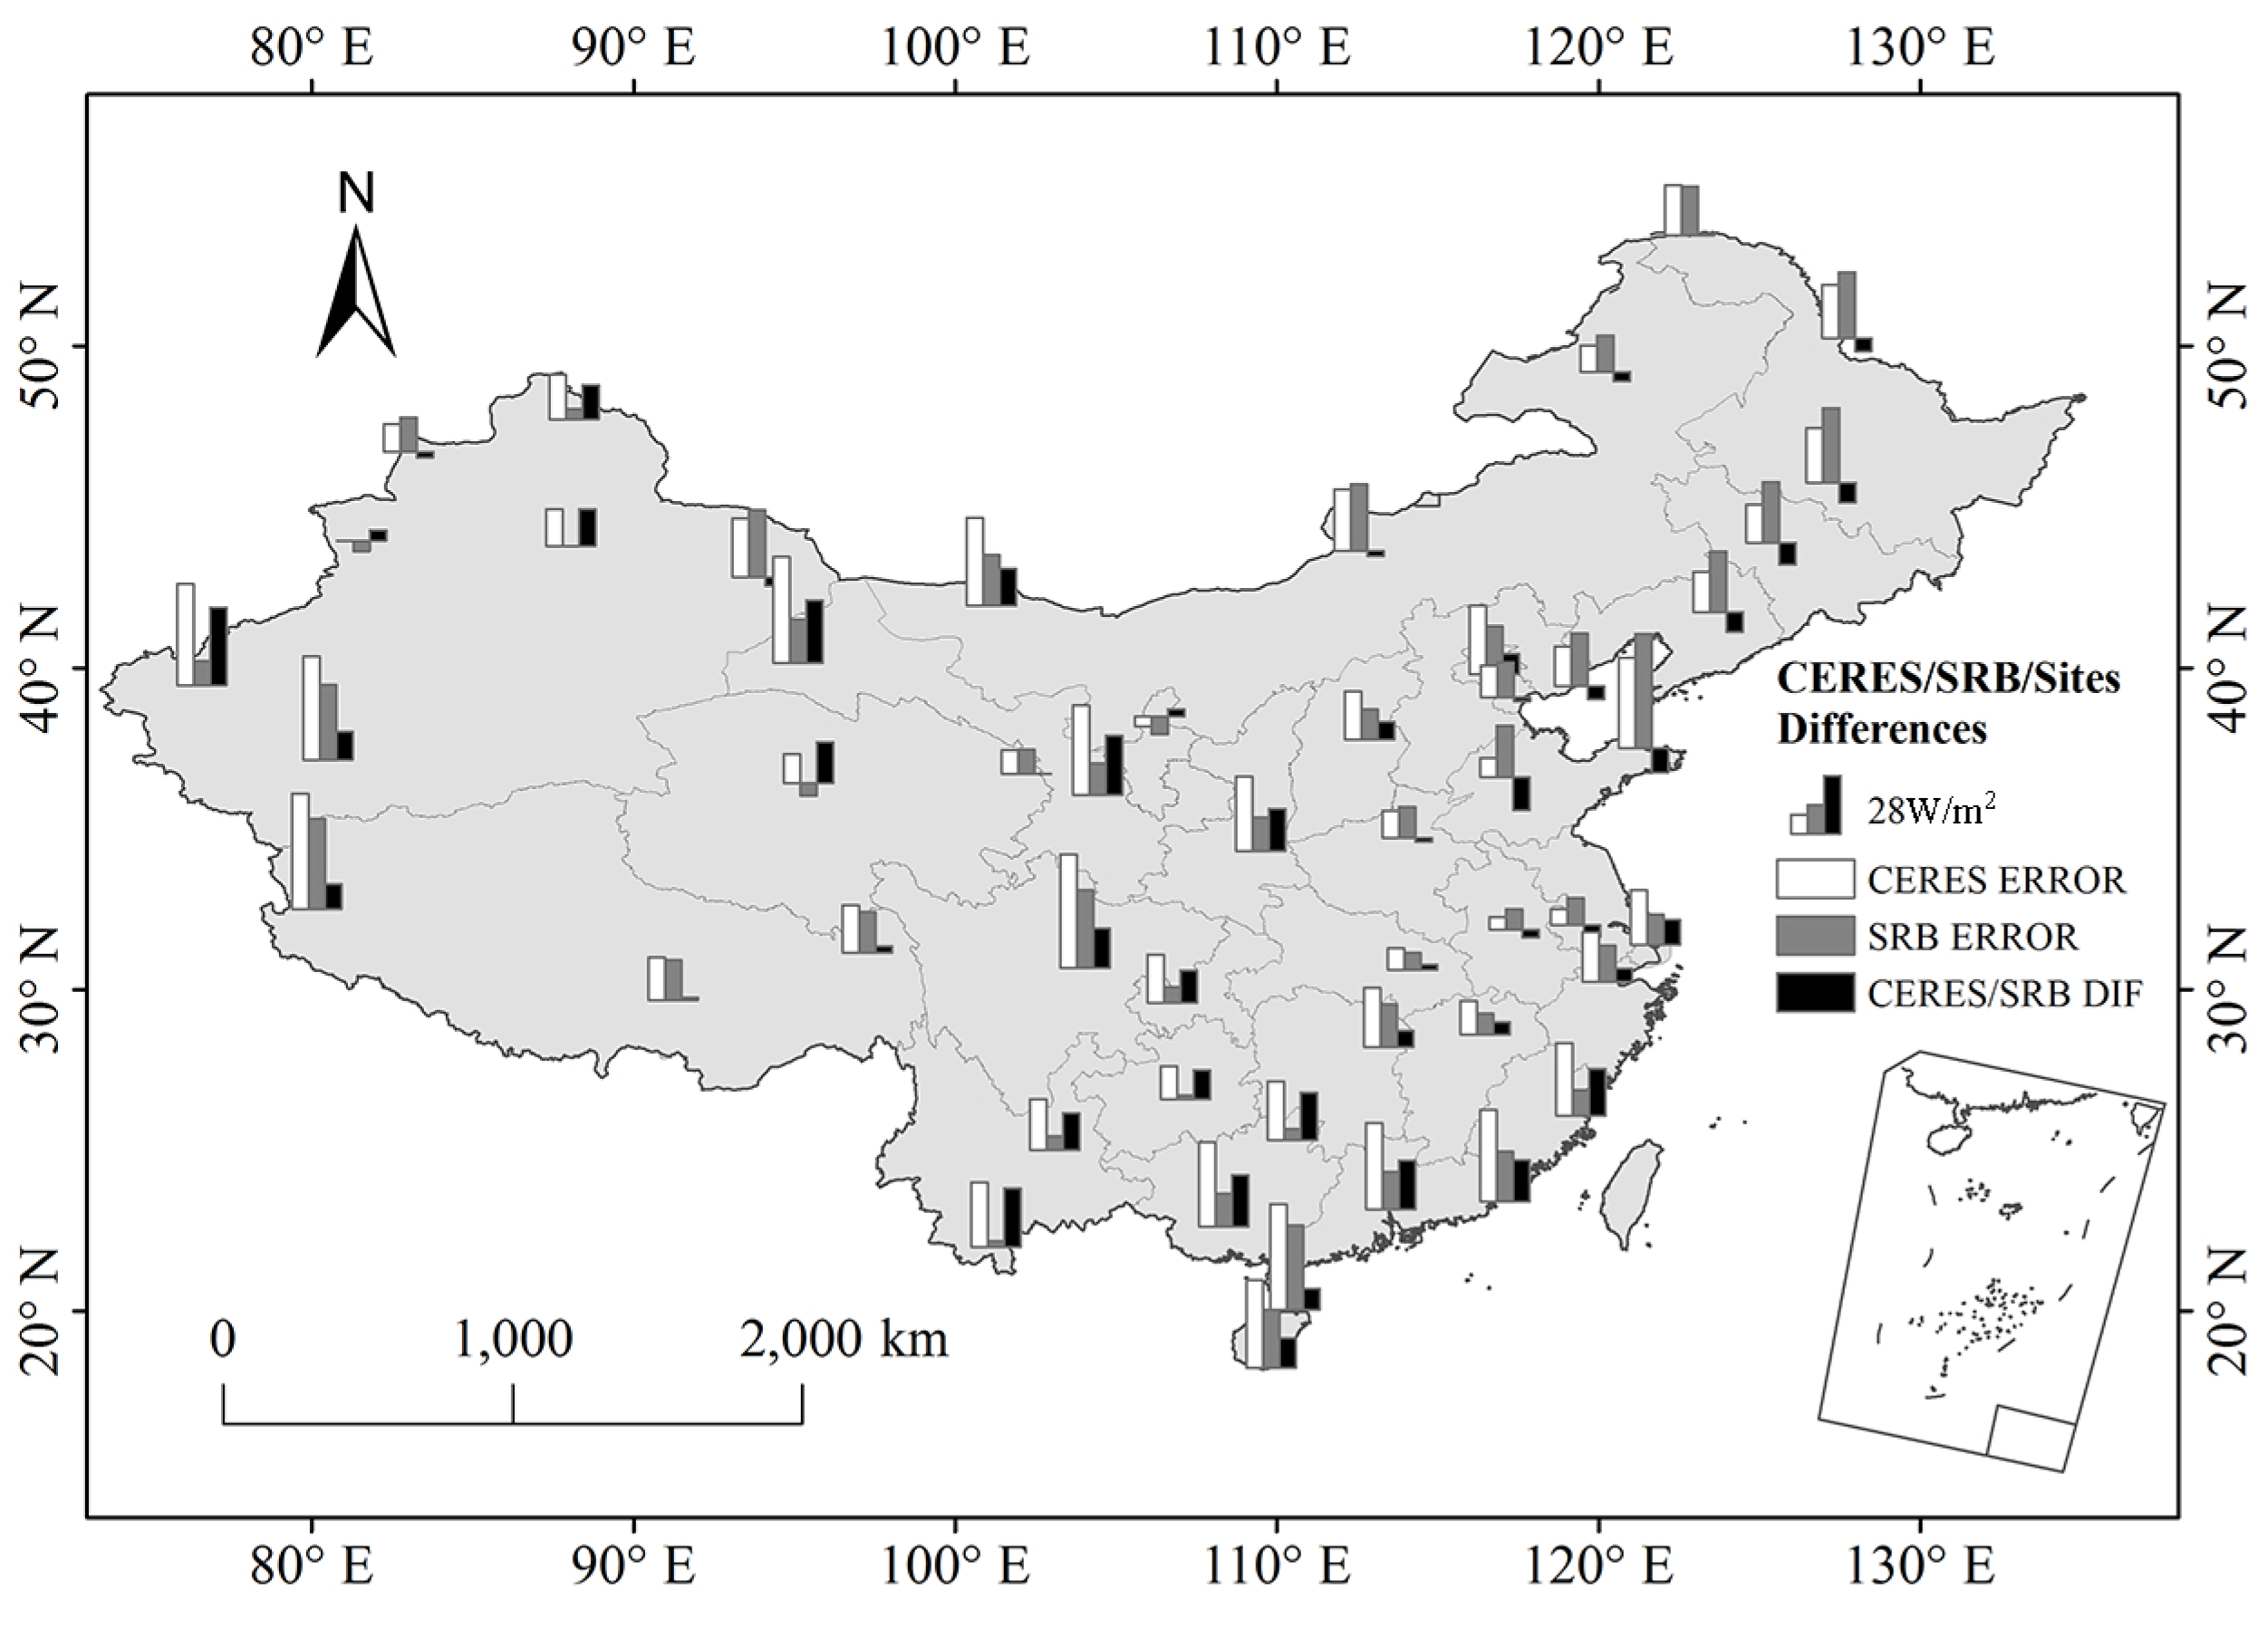
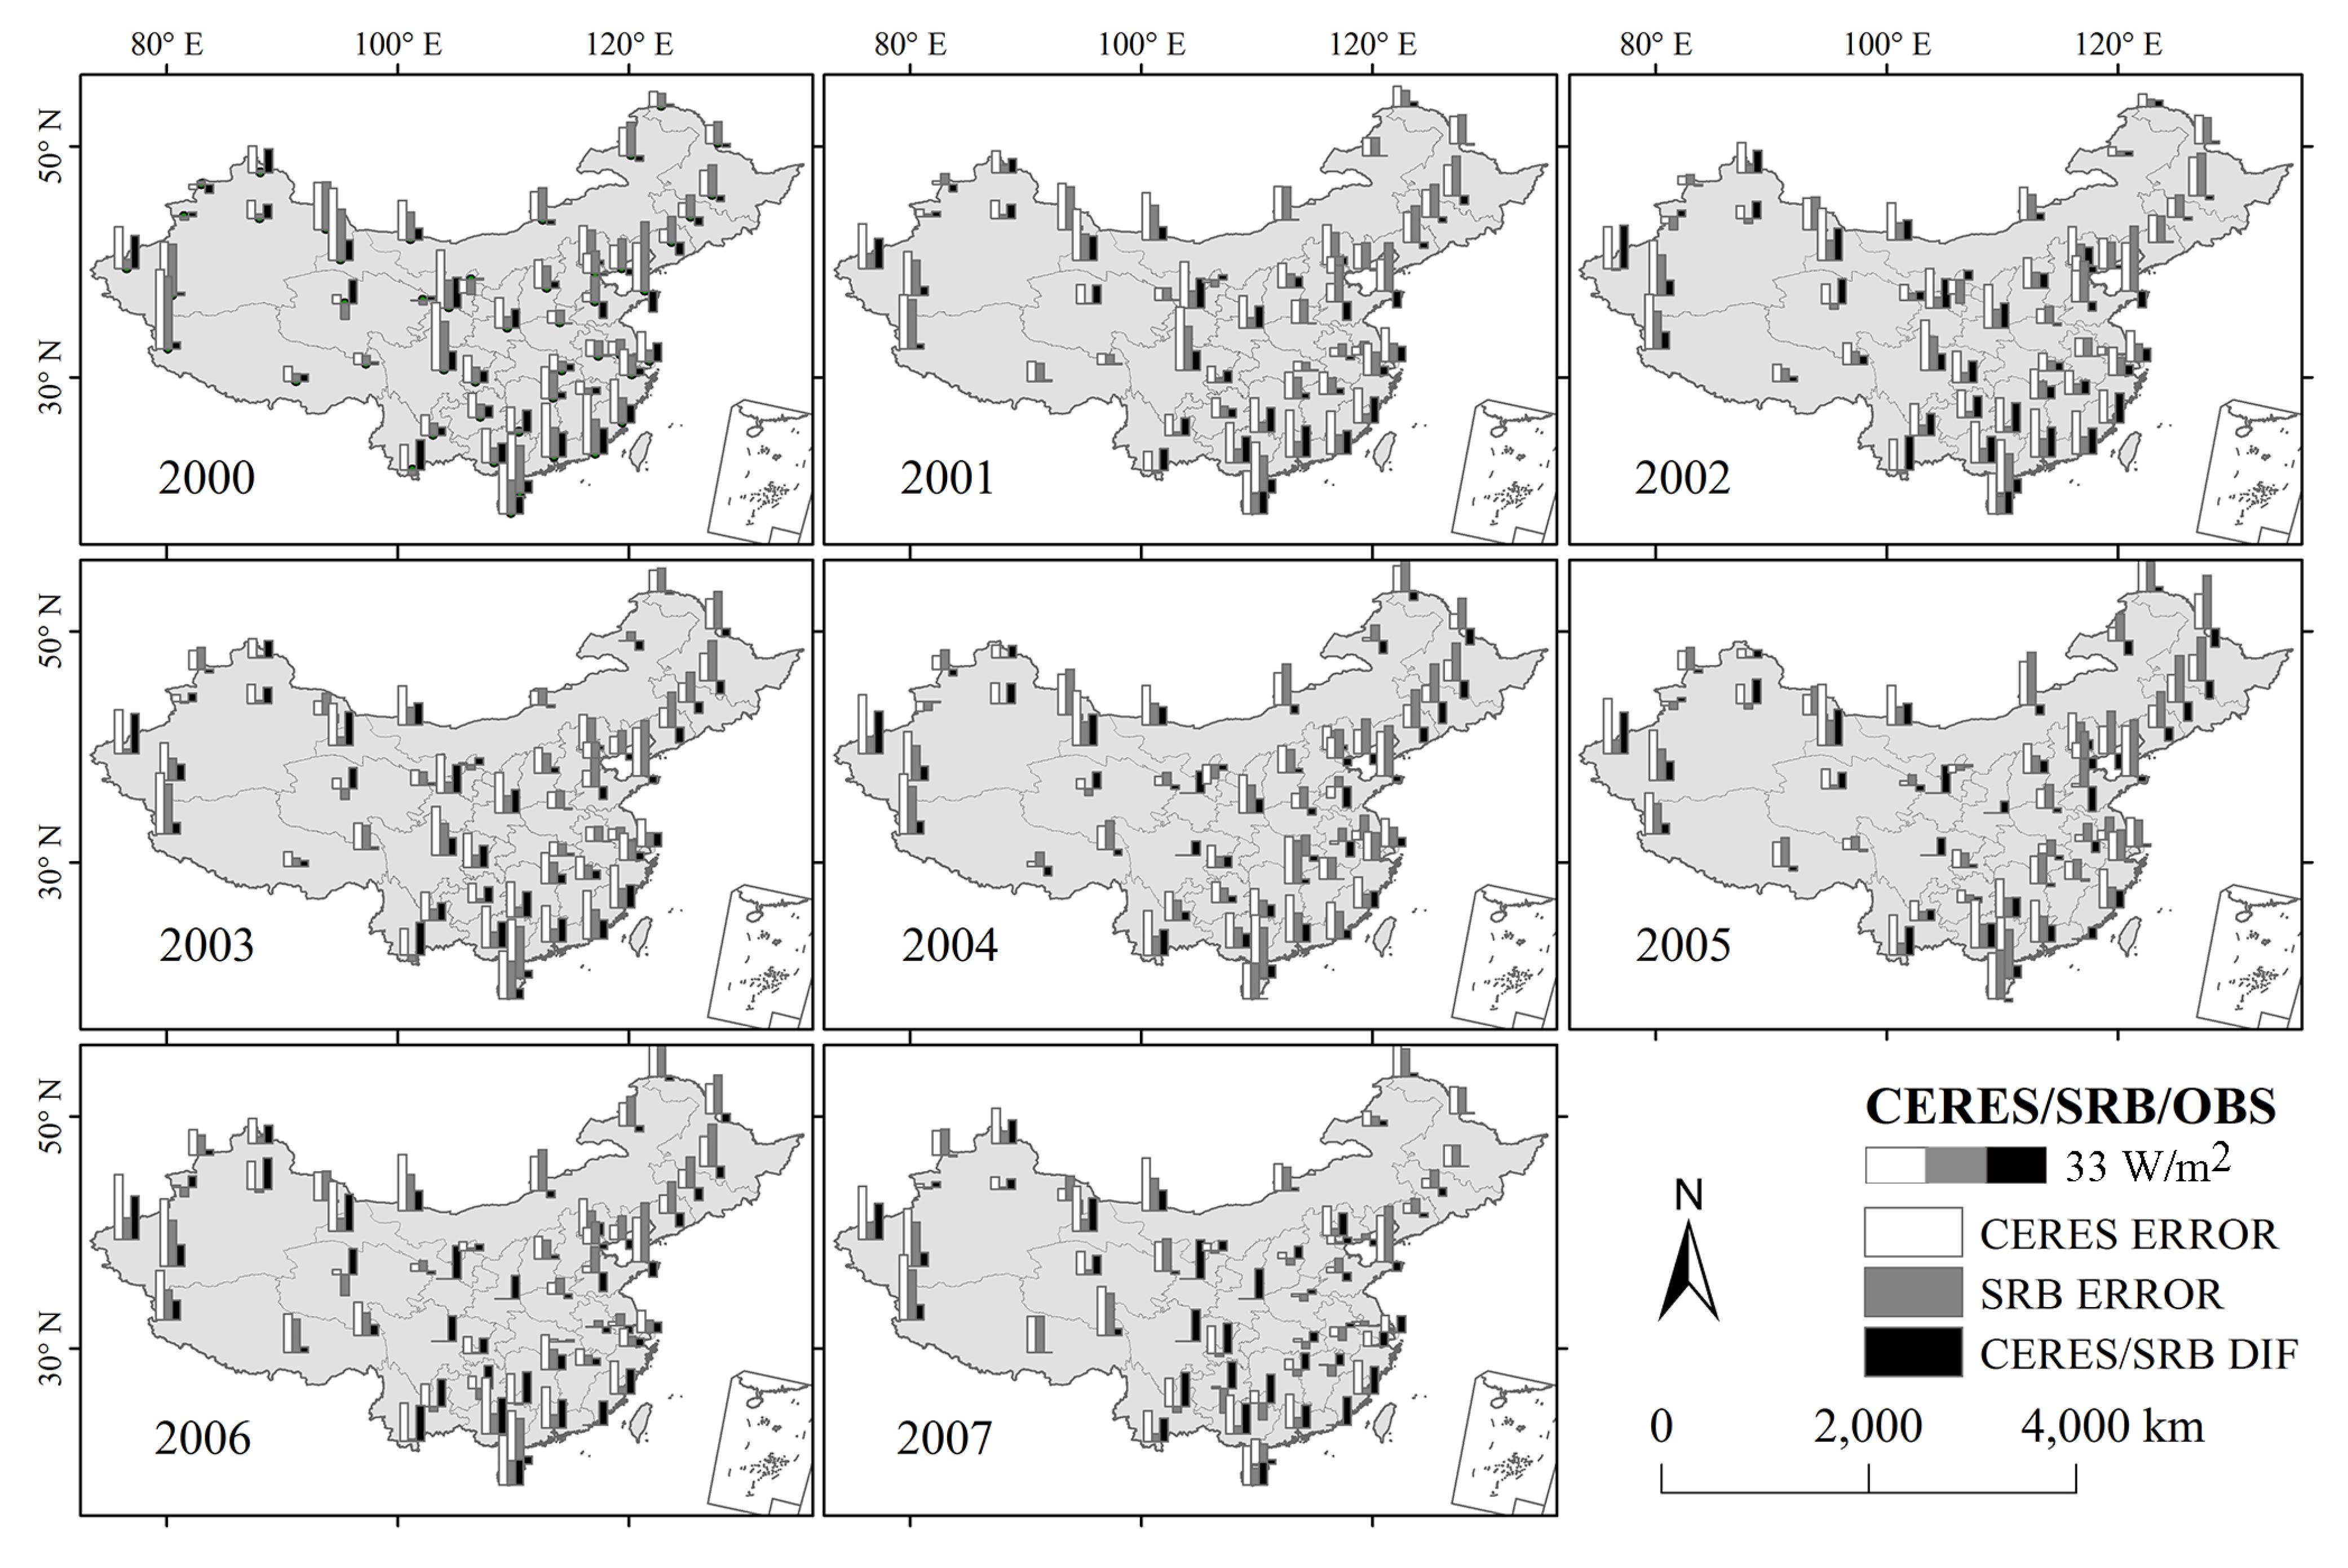
3.2. Spatial Distribution of Errors in Surface Net Radiation

Figure 3 shows the spatial distribution of absolute errors in CERES and SRB and their relative difference. It is clear that satellite data are generally higher than surface observation for most sites. There is one exception for CERES and three for SRB. Furthermore, the CERES data have relatively high correlation coefficients, ME, and RMSE values with surface observation, compared to the SRB data. A total of 20 sites have a correlation coefficient higher than 0.9 for the CERES data, whereas only five for SRB (Figure 4). The sites with a correlation coefficient of less than 0.8 between CERES and SRB data are located at the west of 110° E. The ME values between the CERES and surface observation range from −4.6 W/m2 to 56.7 W/m2, and the RMSE from 13.1 W/m2 to 61.1 W/m2. The ME values between the SRB and surface observation range from −8.5 W/m2 to 56.3 W/m2, and the RMSE values from 13.5 W/m2 to 67.4 W/m2. Given an accuracy of 10 W/m2 required for climate research at regional, monthly scales [59], only five (11) sites qualified for the CERES (SRB) data.
Figure 3. Error distribution of monthly surface net radiation generated from the CERES and SRB data for the period from March 2000 to December 2007.
Remotesensing 07 04899 g003
Specifically, the errors are quite small for inland sites in southeast China, approximately 30.0% (40.1%) lower than the overall errors of all sites for CERES (SRB). The CERES data have a relatively low accuracy for the sites in northwest China and the coastal sites in south China, whereas the SRB data have a low accuracy for the sites in northeast China. In northeast China, the errors are lower for CERES than for SRB, and the situation is opposite in other regions. For example, the errors are 26.4% higher for SRB than for CERES in northeast China, but 78.4% lower in other regions.
Figure 4. Statistical comparison of CERES, SRB, and observed (OBS) surface-measured monthly net radiation.
Remotesensing 07 04899 g004

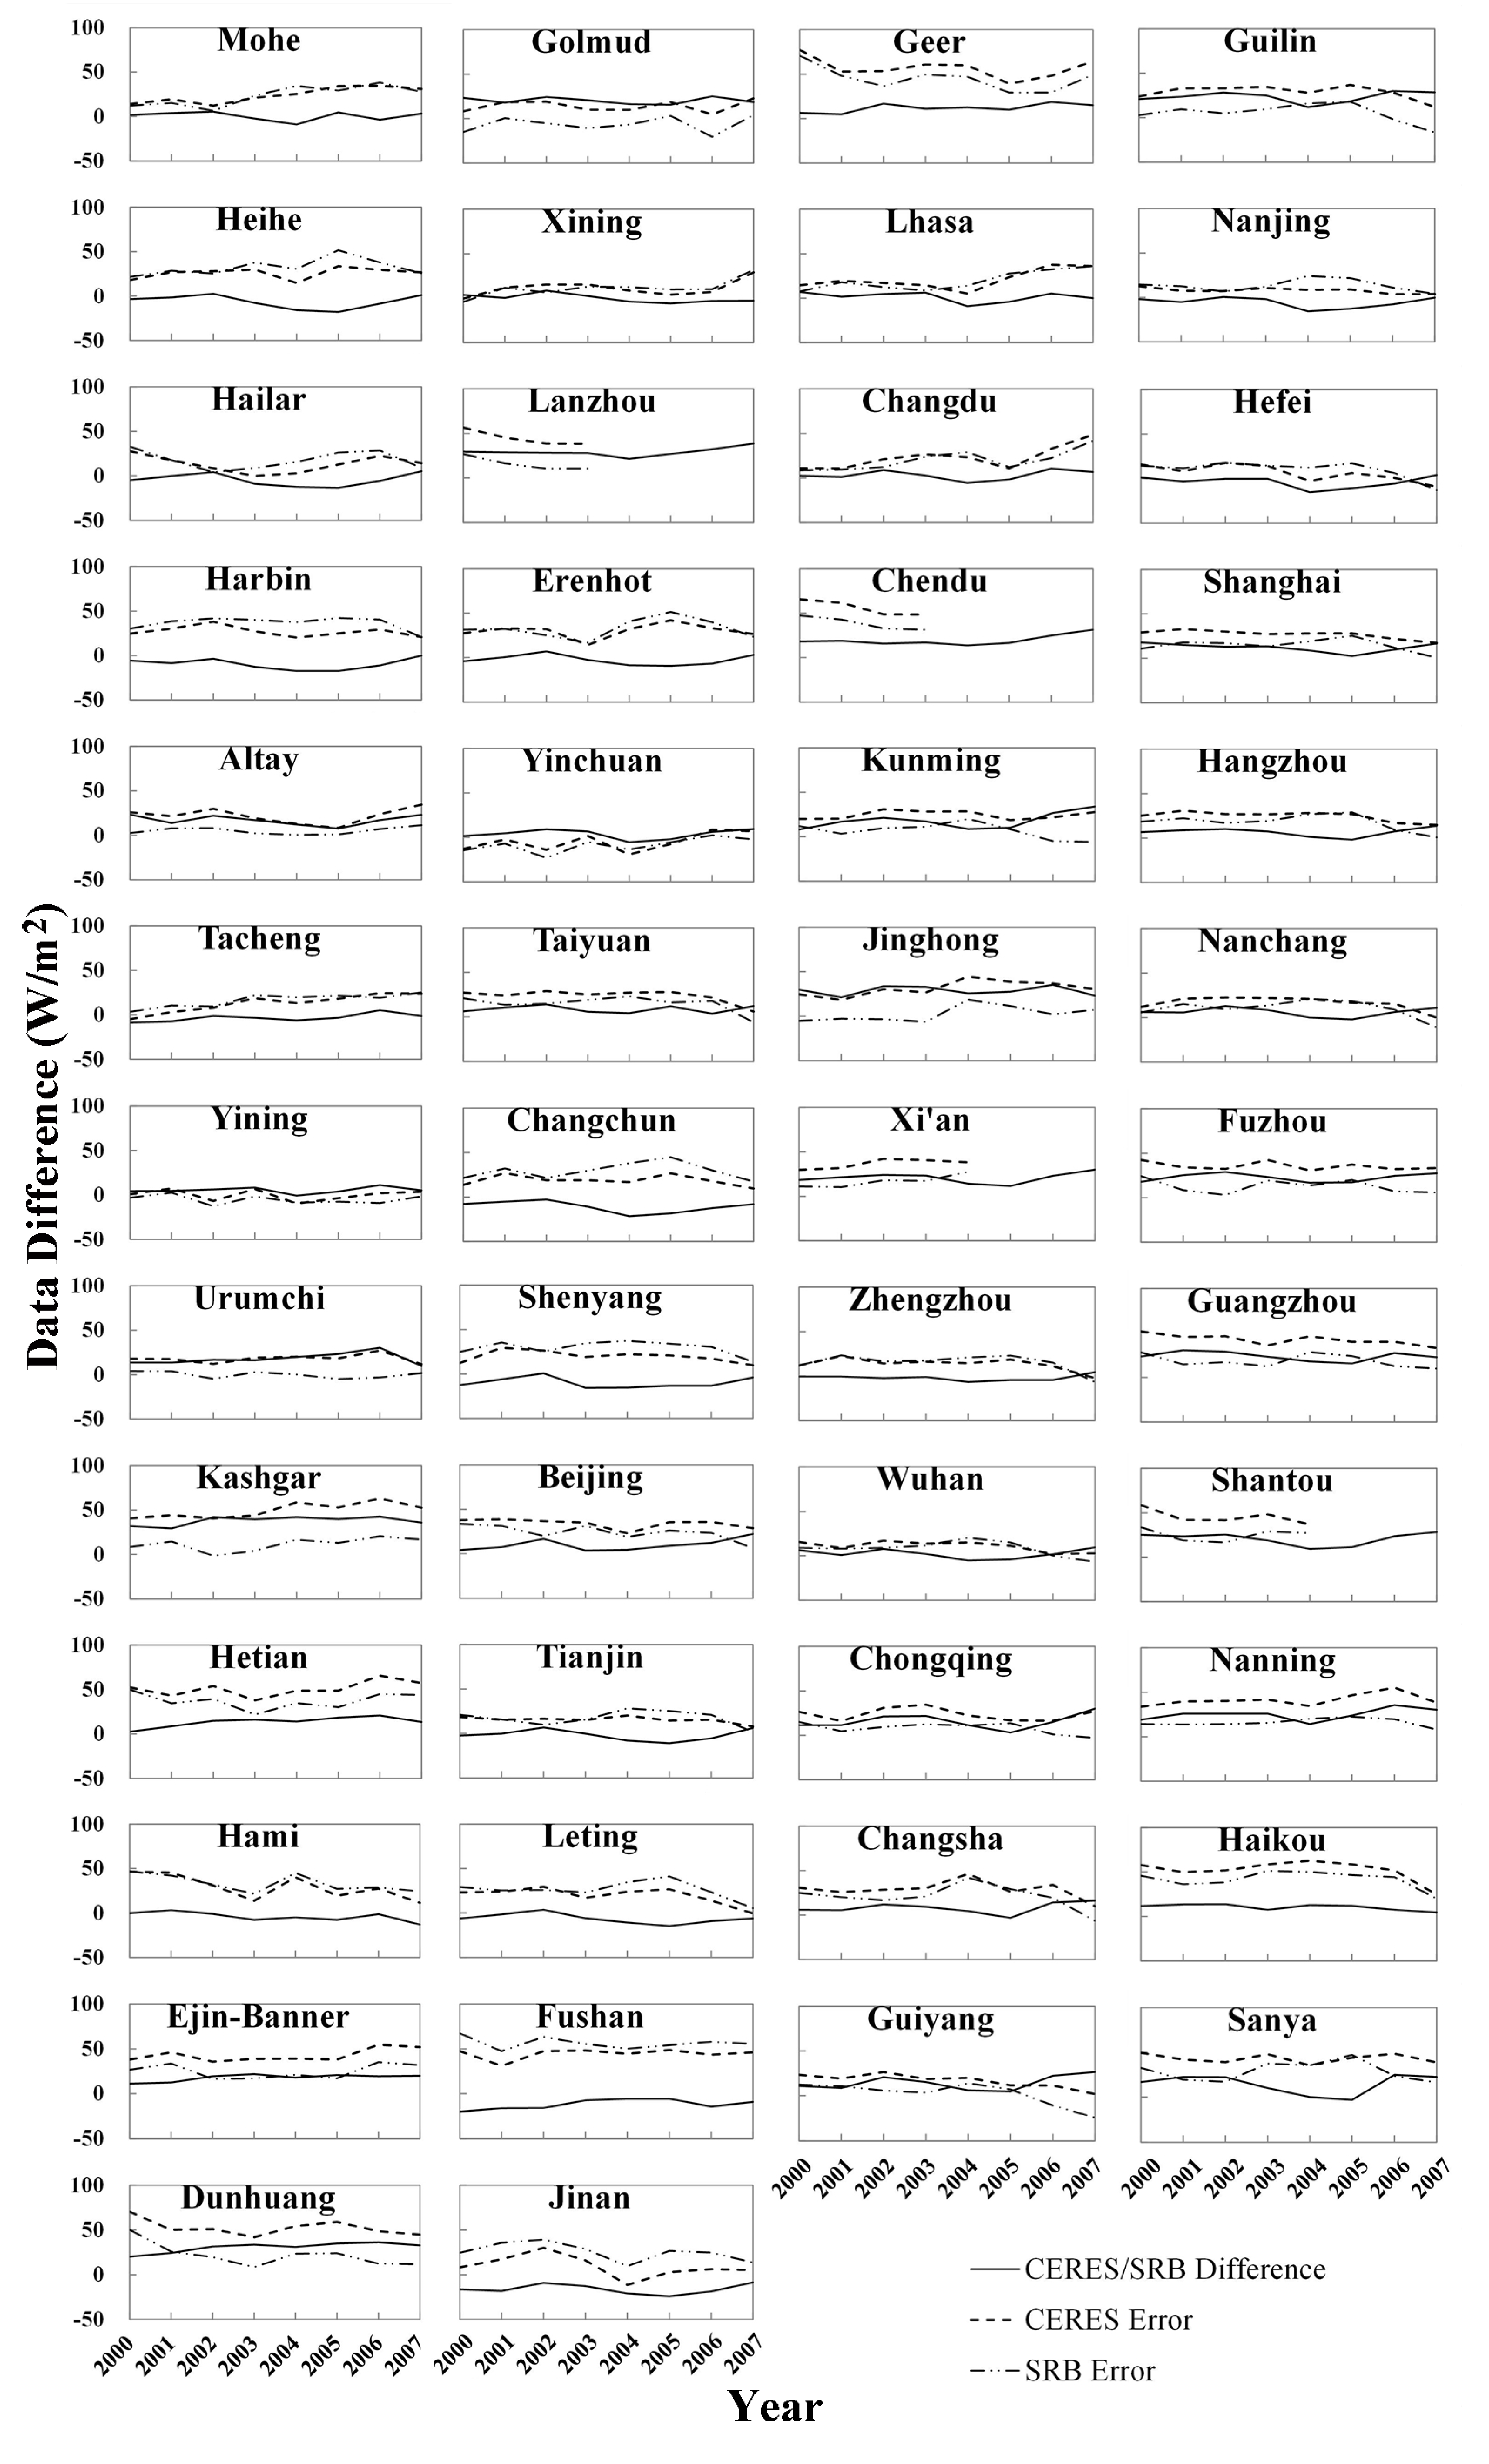
3.3. Temporal Variation of Errors in Surface Net Radiation

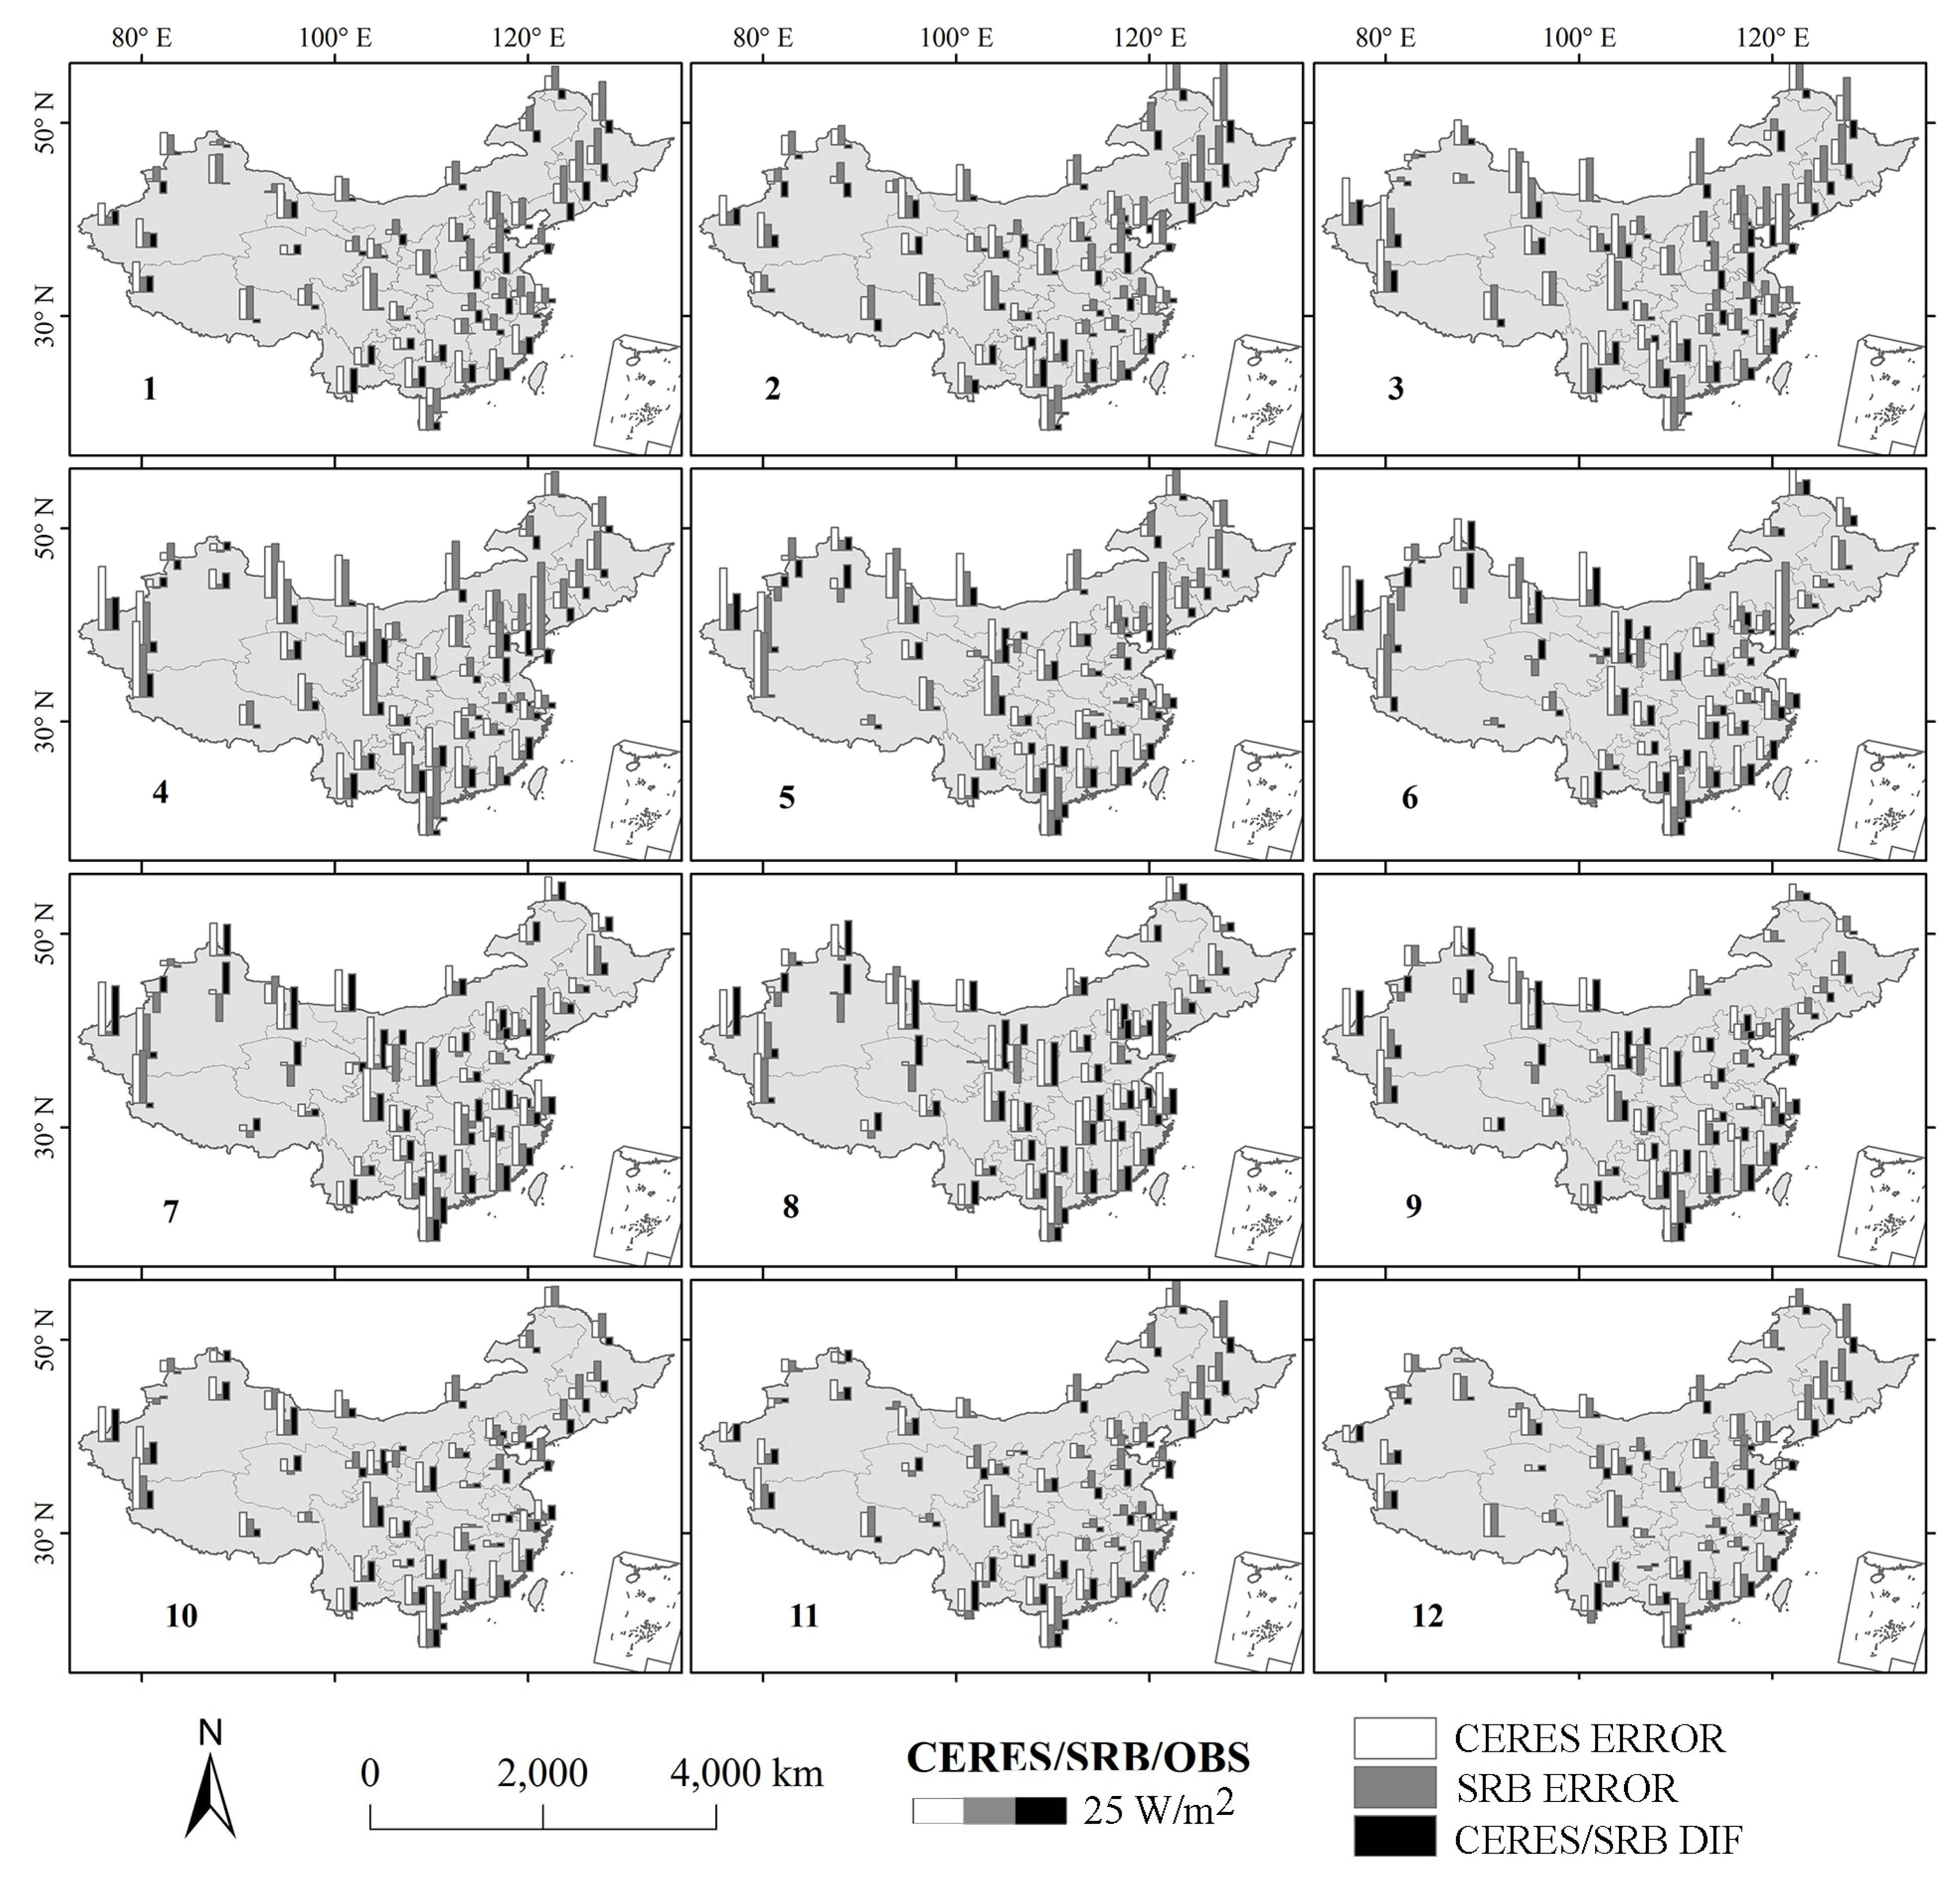
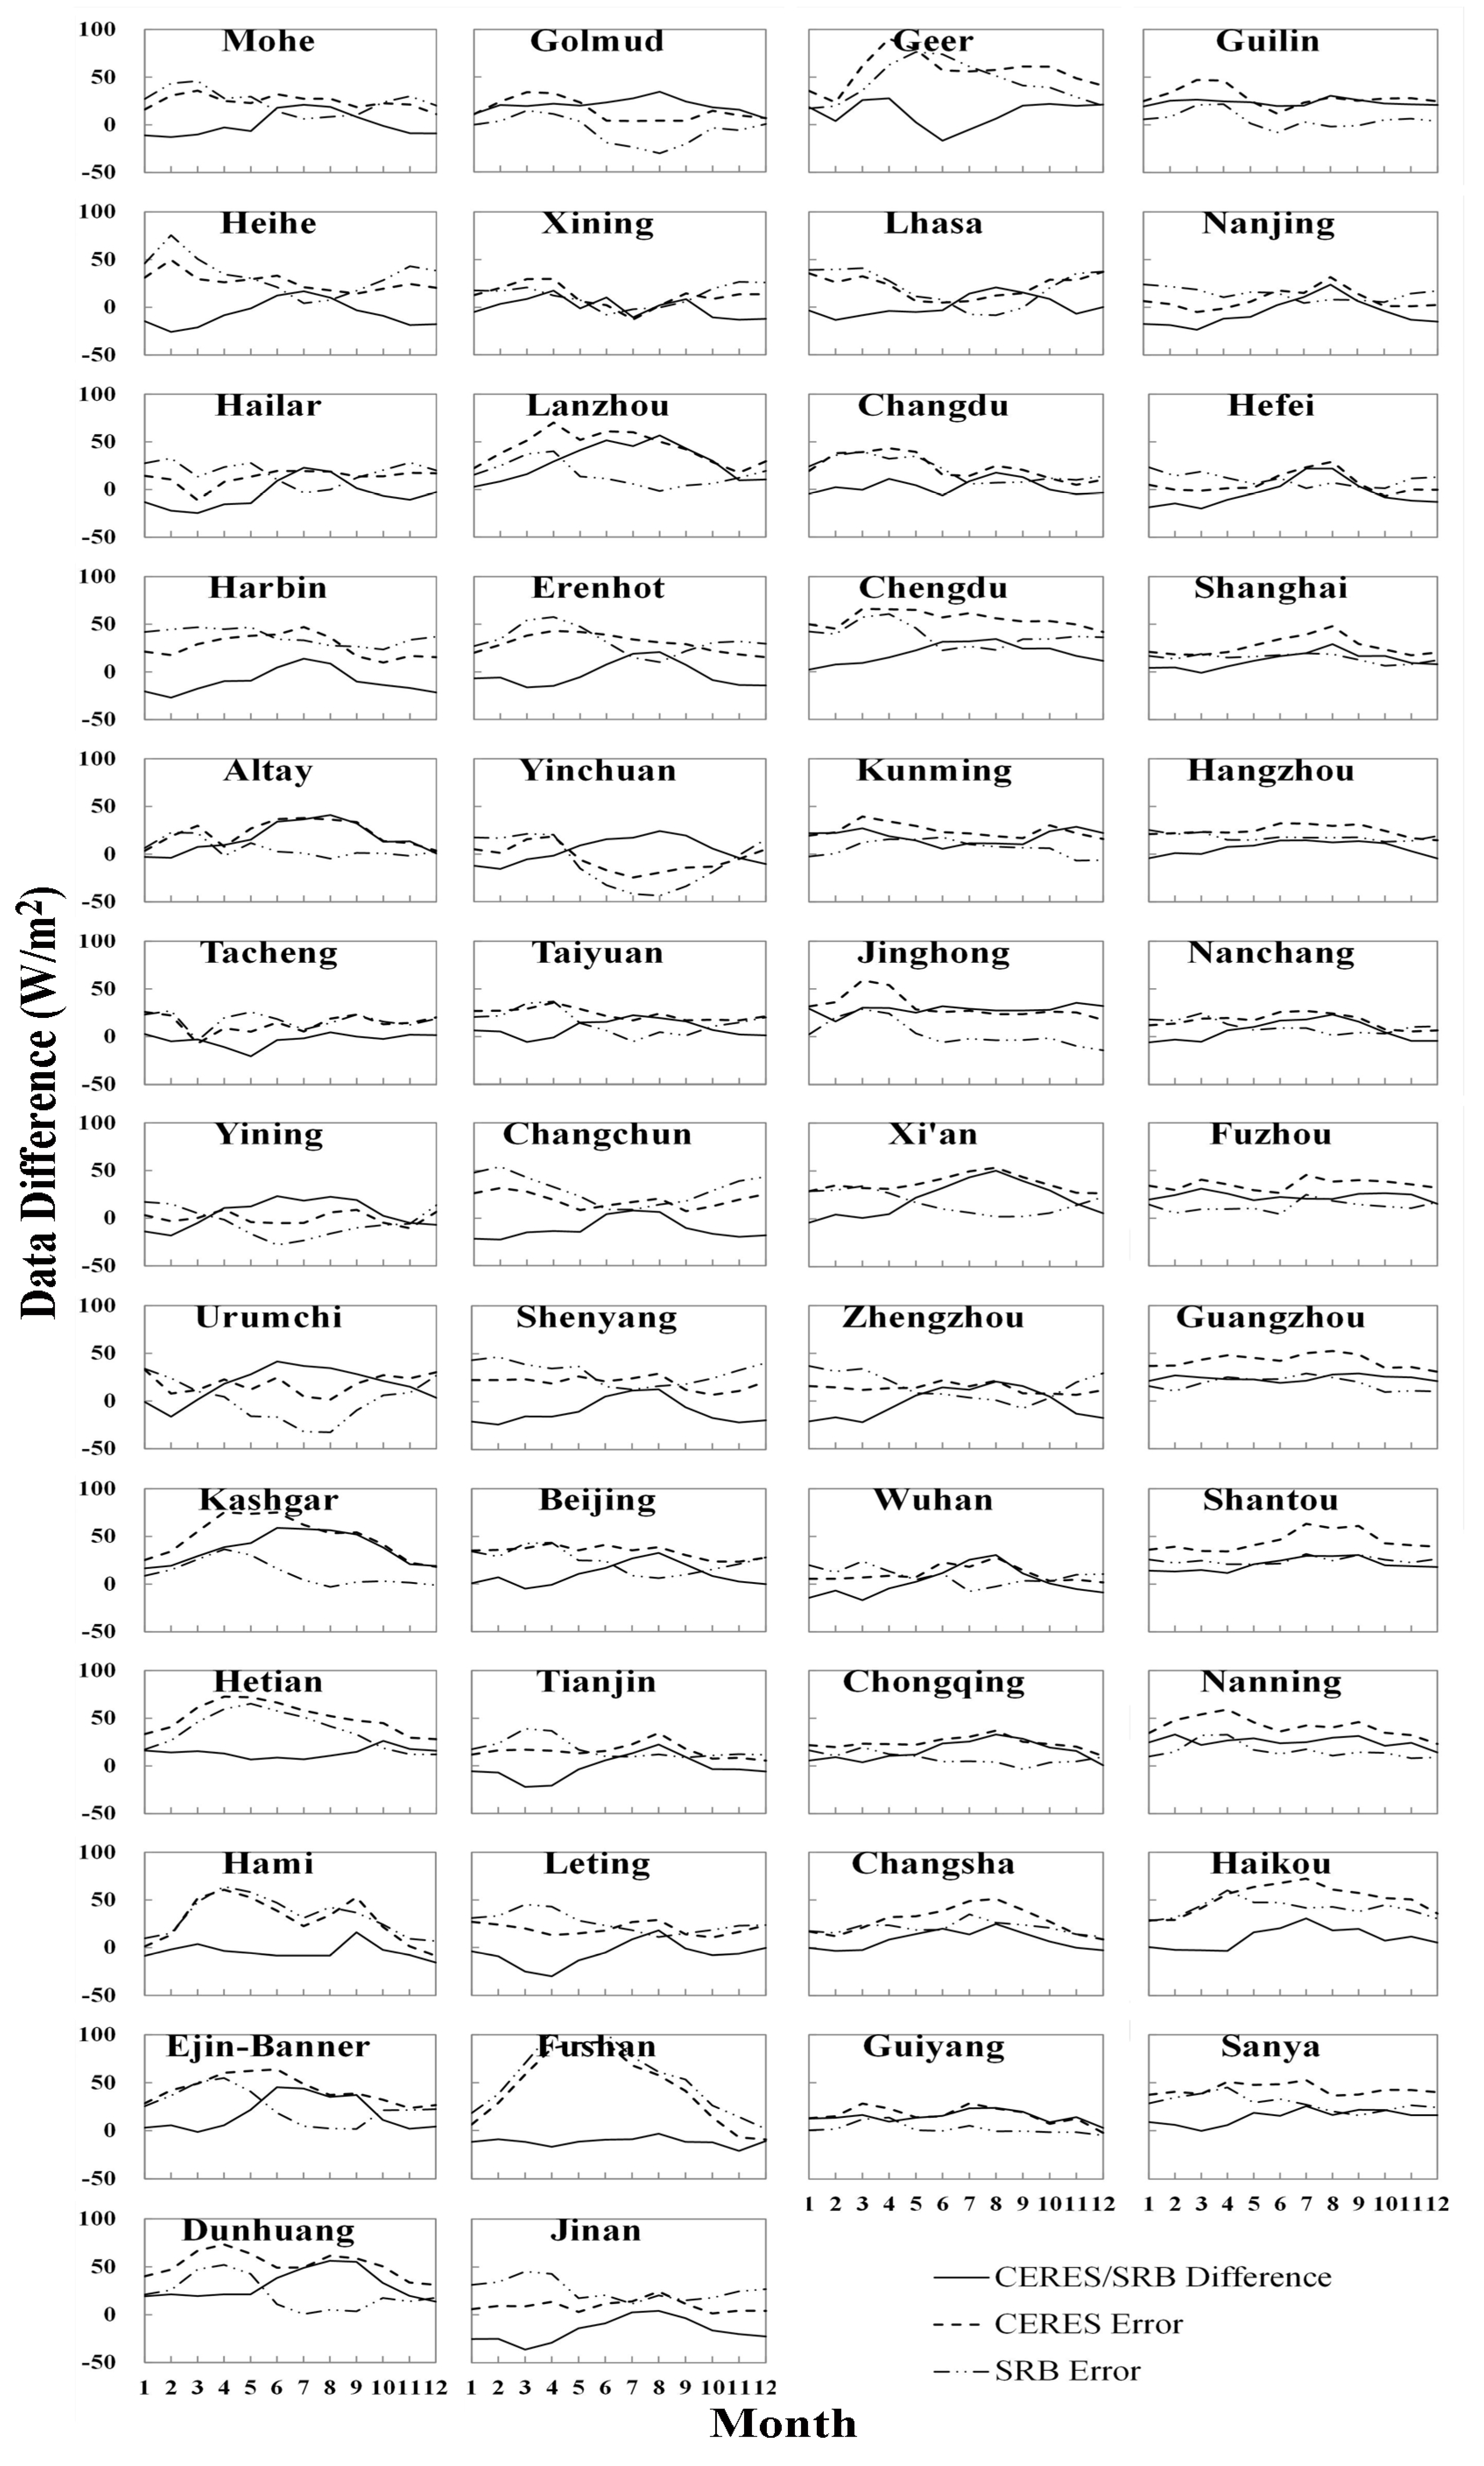
3.3.1. Intra-annual Variation

Figure 5 shows multi-year monthly mean of errors in surface net radiation at 50 sites. The errors have similar intra-annual variation patterns between the CERES and the SRB for most sites. Specifically, there are small variations in errors at the southeast sites throughout the year. In spring and summer, the errors appear large in west China, and may exceed 60 W/m2 at several sites—for example, 90.4 W/m2 in May for the Geer (CERES) and 65.2 W/m2 in May for the Hetian (SRB). In northeast China, the maximum errors appear in autumn and winter, and the errors can be up to 35 W/m2 at some sites—for example, 35.9 W/m2 in March for the Mohe (CERES) and 75.6 W/m2 in February for the Heihe (SRB).
For CERES, errors in net radiation are lowest with a mean of 19.6 W/m2 during the period from October to December. The errors are large during the period from April to September, except for the sites of northeast China where the errors are large from November to April. In April, there were large errors present at all the sites.
For SRB, the errors present a similar variation pattern, with a peak in spring and winter and a valley in summer and autumn. The errors appear to be at a minimum with a mean of 9.4 W/m2 during the period from July to August and at a maximum with a mean of 31.0 W/m2 in March and April. Notably, in northeast China, the maximum appears in the period from November to March.
The errors differ between the CERES and the SRB data (Figure 6). In general, the errors are larger for CERES than for SRB at most sites. The largest difference appears in summer and the least one in winter, except for northeast China. In contrast, the errors are generally lower for CERES than for SRB in winter and spring in northeast China. Their absolute differences are often larger in winter than in summer.
Figure 5. Spatial distribution of multi-year averaged errors in monthly surface net radiation generated from the CERES and SRB products.
Remotesensing 07 04899 g005

3.3.2. Inter-annual Variation

Figure 7 shows spatial distribution of annual mean errors in surface net radiation from 2000 to 2007. For CERES, the errors decrease from 28.1W/m2 in 2000 to 22.5W/m2 in 2007. Comparatively, the SRB errors fluctuate from 20.5W/m2 in 2000 to 23.2W/m2 in 2005, then down to 11.3W/m2 in 2007, except for some sites in west China.
Figure 6. Monthly variation of errors in surface net radiation generated from the CERES and the SRB products.
Remotesensing 07 04899 g006
For CERES, the errors are generally large in west and south China from 2000 to 2007 (Figure 8). The errors increase with an annual growth rate of 9.2% at 14 sites located on the southwest and northwest China from 2000 to 2007. In particular, at the Tacheng and the Changdu sites the errors increase rapidly after 2004 with an annual growth rate of 25.7%. In contrast, there are 18 sites in central and east China with an annual decreasing rate of 10.1%.
Figure 7. Spatial distribution of annual mean errors in surface net radiation generated from the CERES and the SRB products from 2000 to 2007.
Remotesensing 07 04899 g007
For SRB, the errors decrease from 2000 to 2007 with a slope value of −1.83 at 20 sites located in the inland area of southeast China. Especially, the errors decrease rapidly after 2005 by 24.4 W/m2. In contrast, there are 11 sites in west and northeast China with an annual growth rate of 24.1%.
The annual mean errors differ between the CERES and the SRB, and the differences increase from 7.5 W/m2 in 2000 to 12.9 W/m2 in 2002, then decrease to 3.0 W/m2 in 2004, and increase again after 2005 at most sites. Moreover, the errors are generally larger for CERES than for SRB, except for northwest China where the differences are negative at some sites, especially after 2003.
Figure 8. Annual mean errors in surface net radiation generated from the CERES and the SRB products from 2000 to 2007.
Remotesensing 07 04899 g008

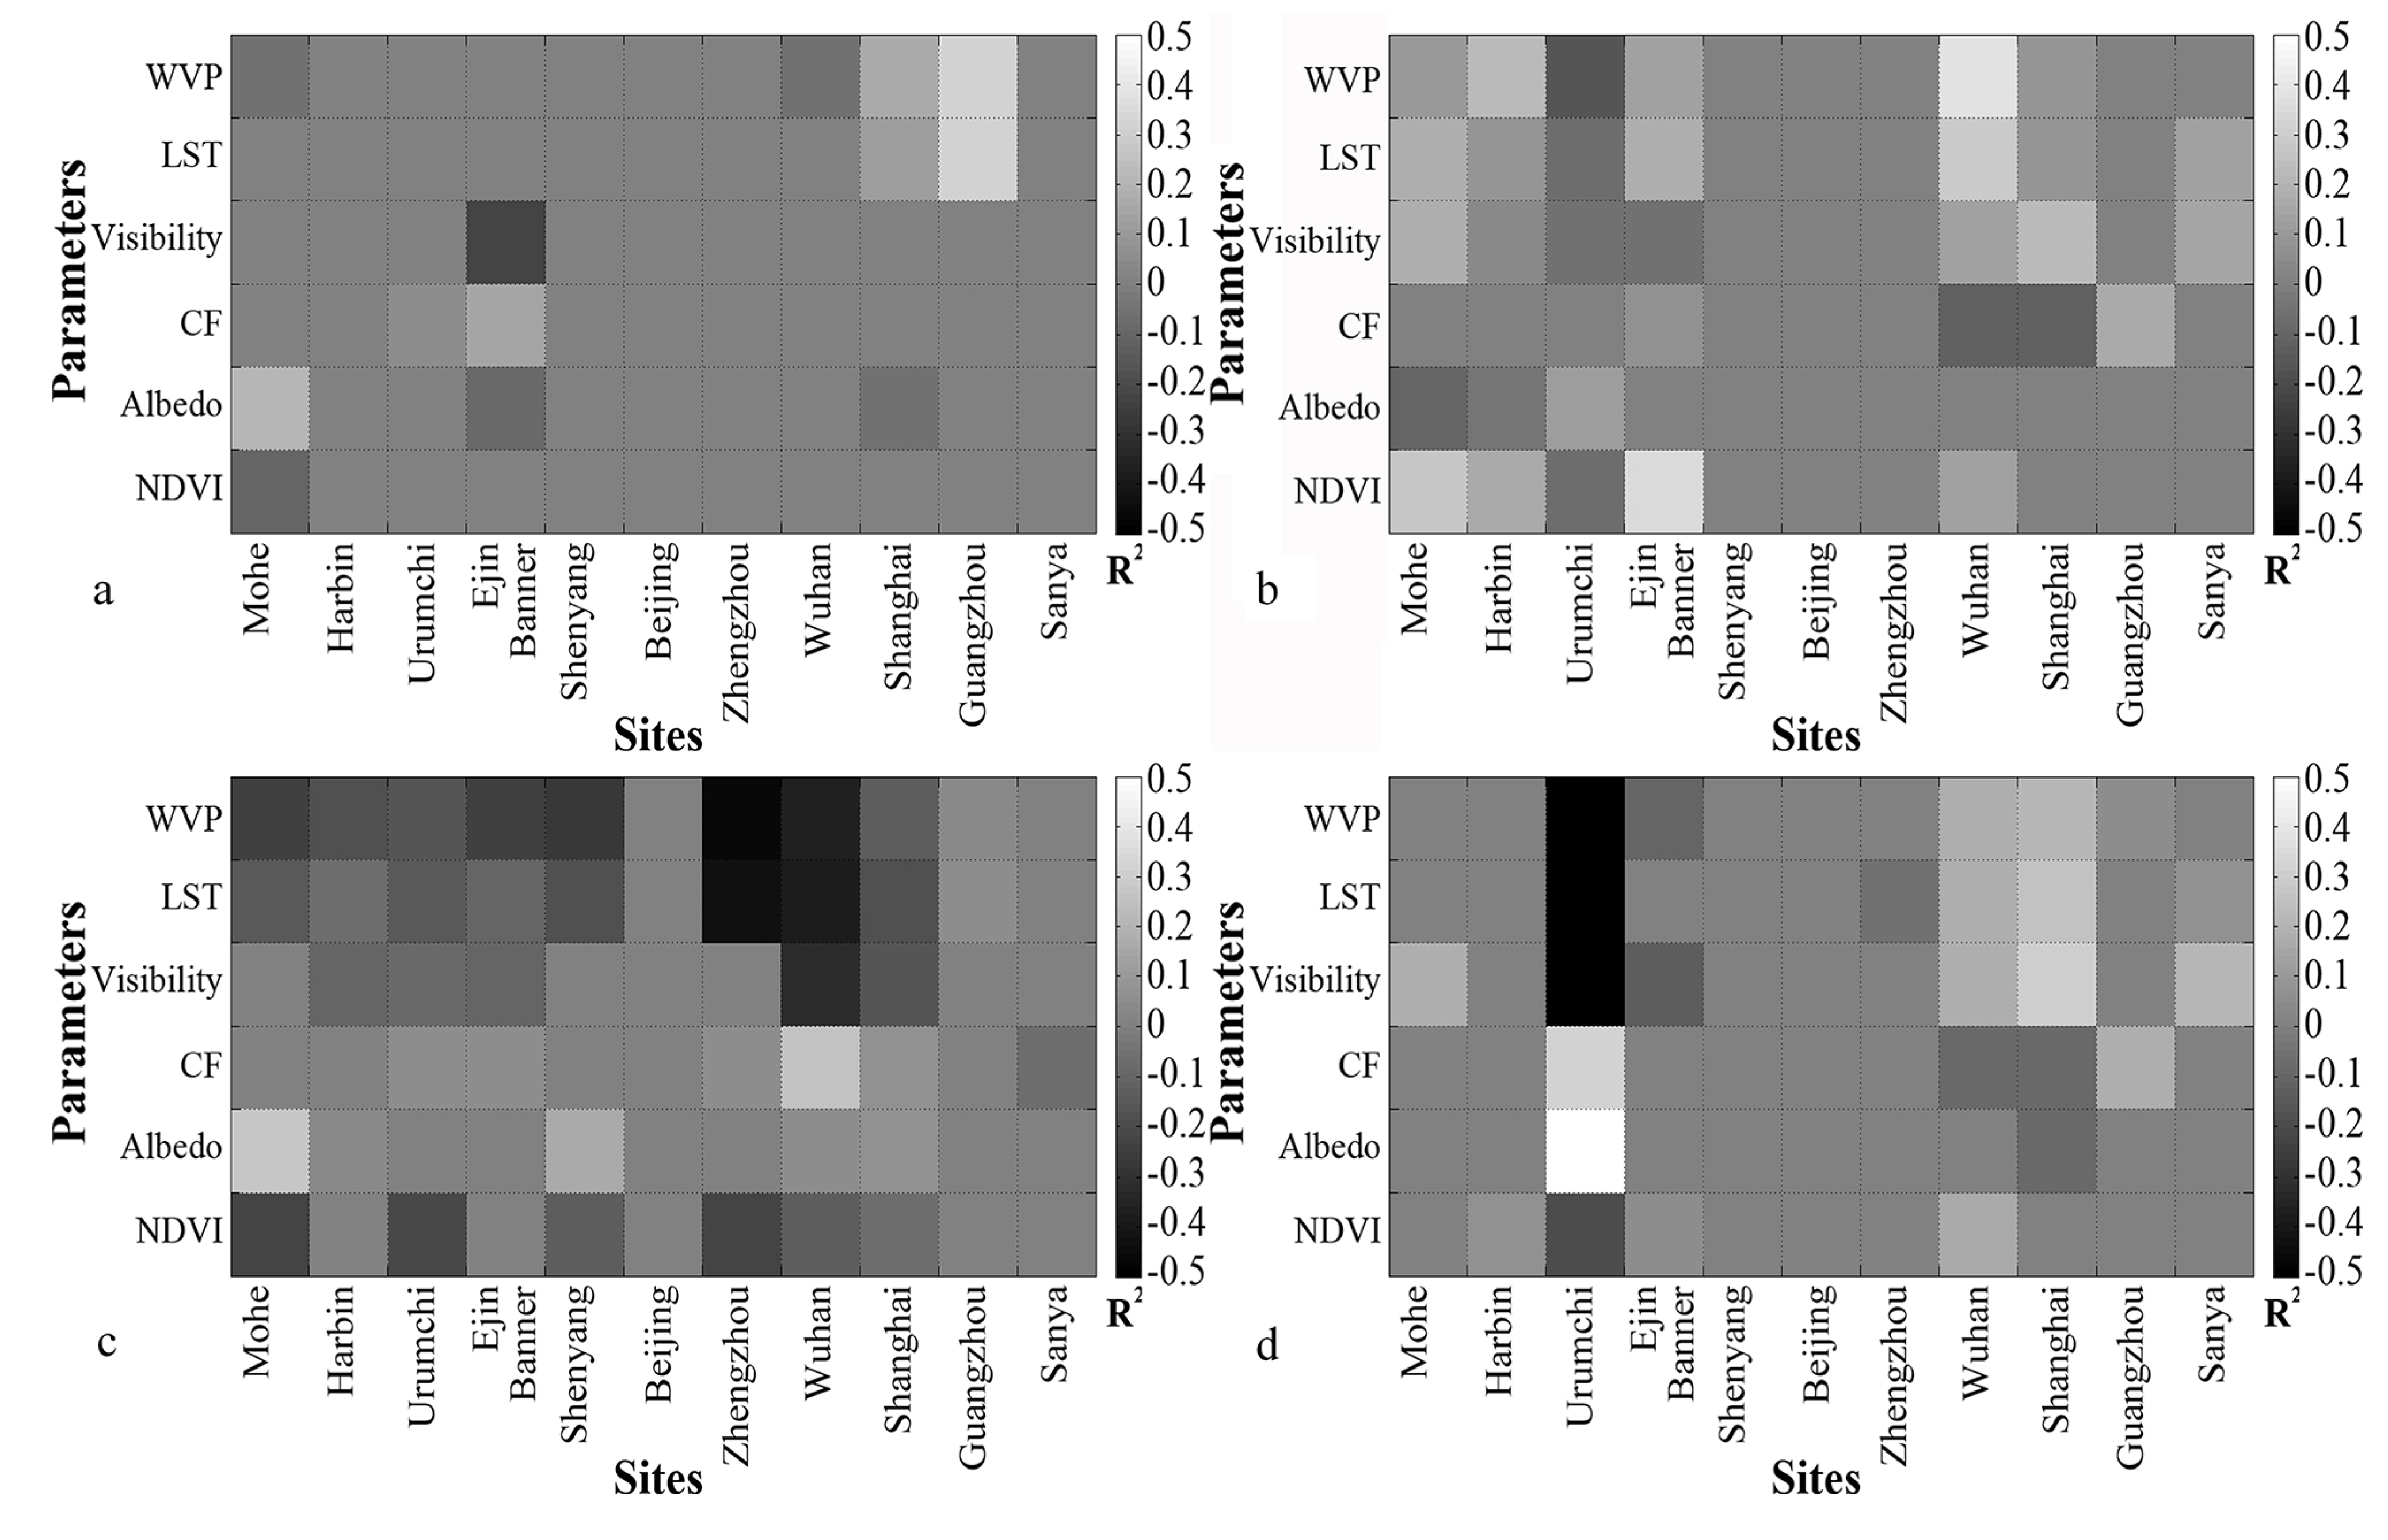
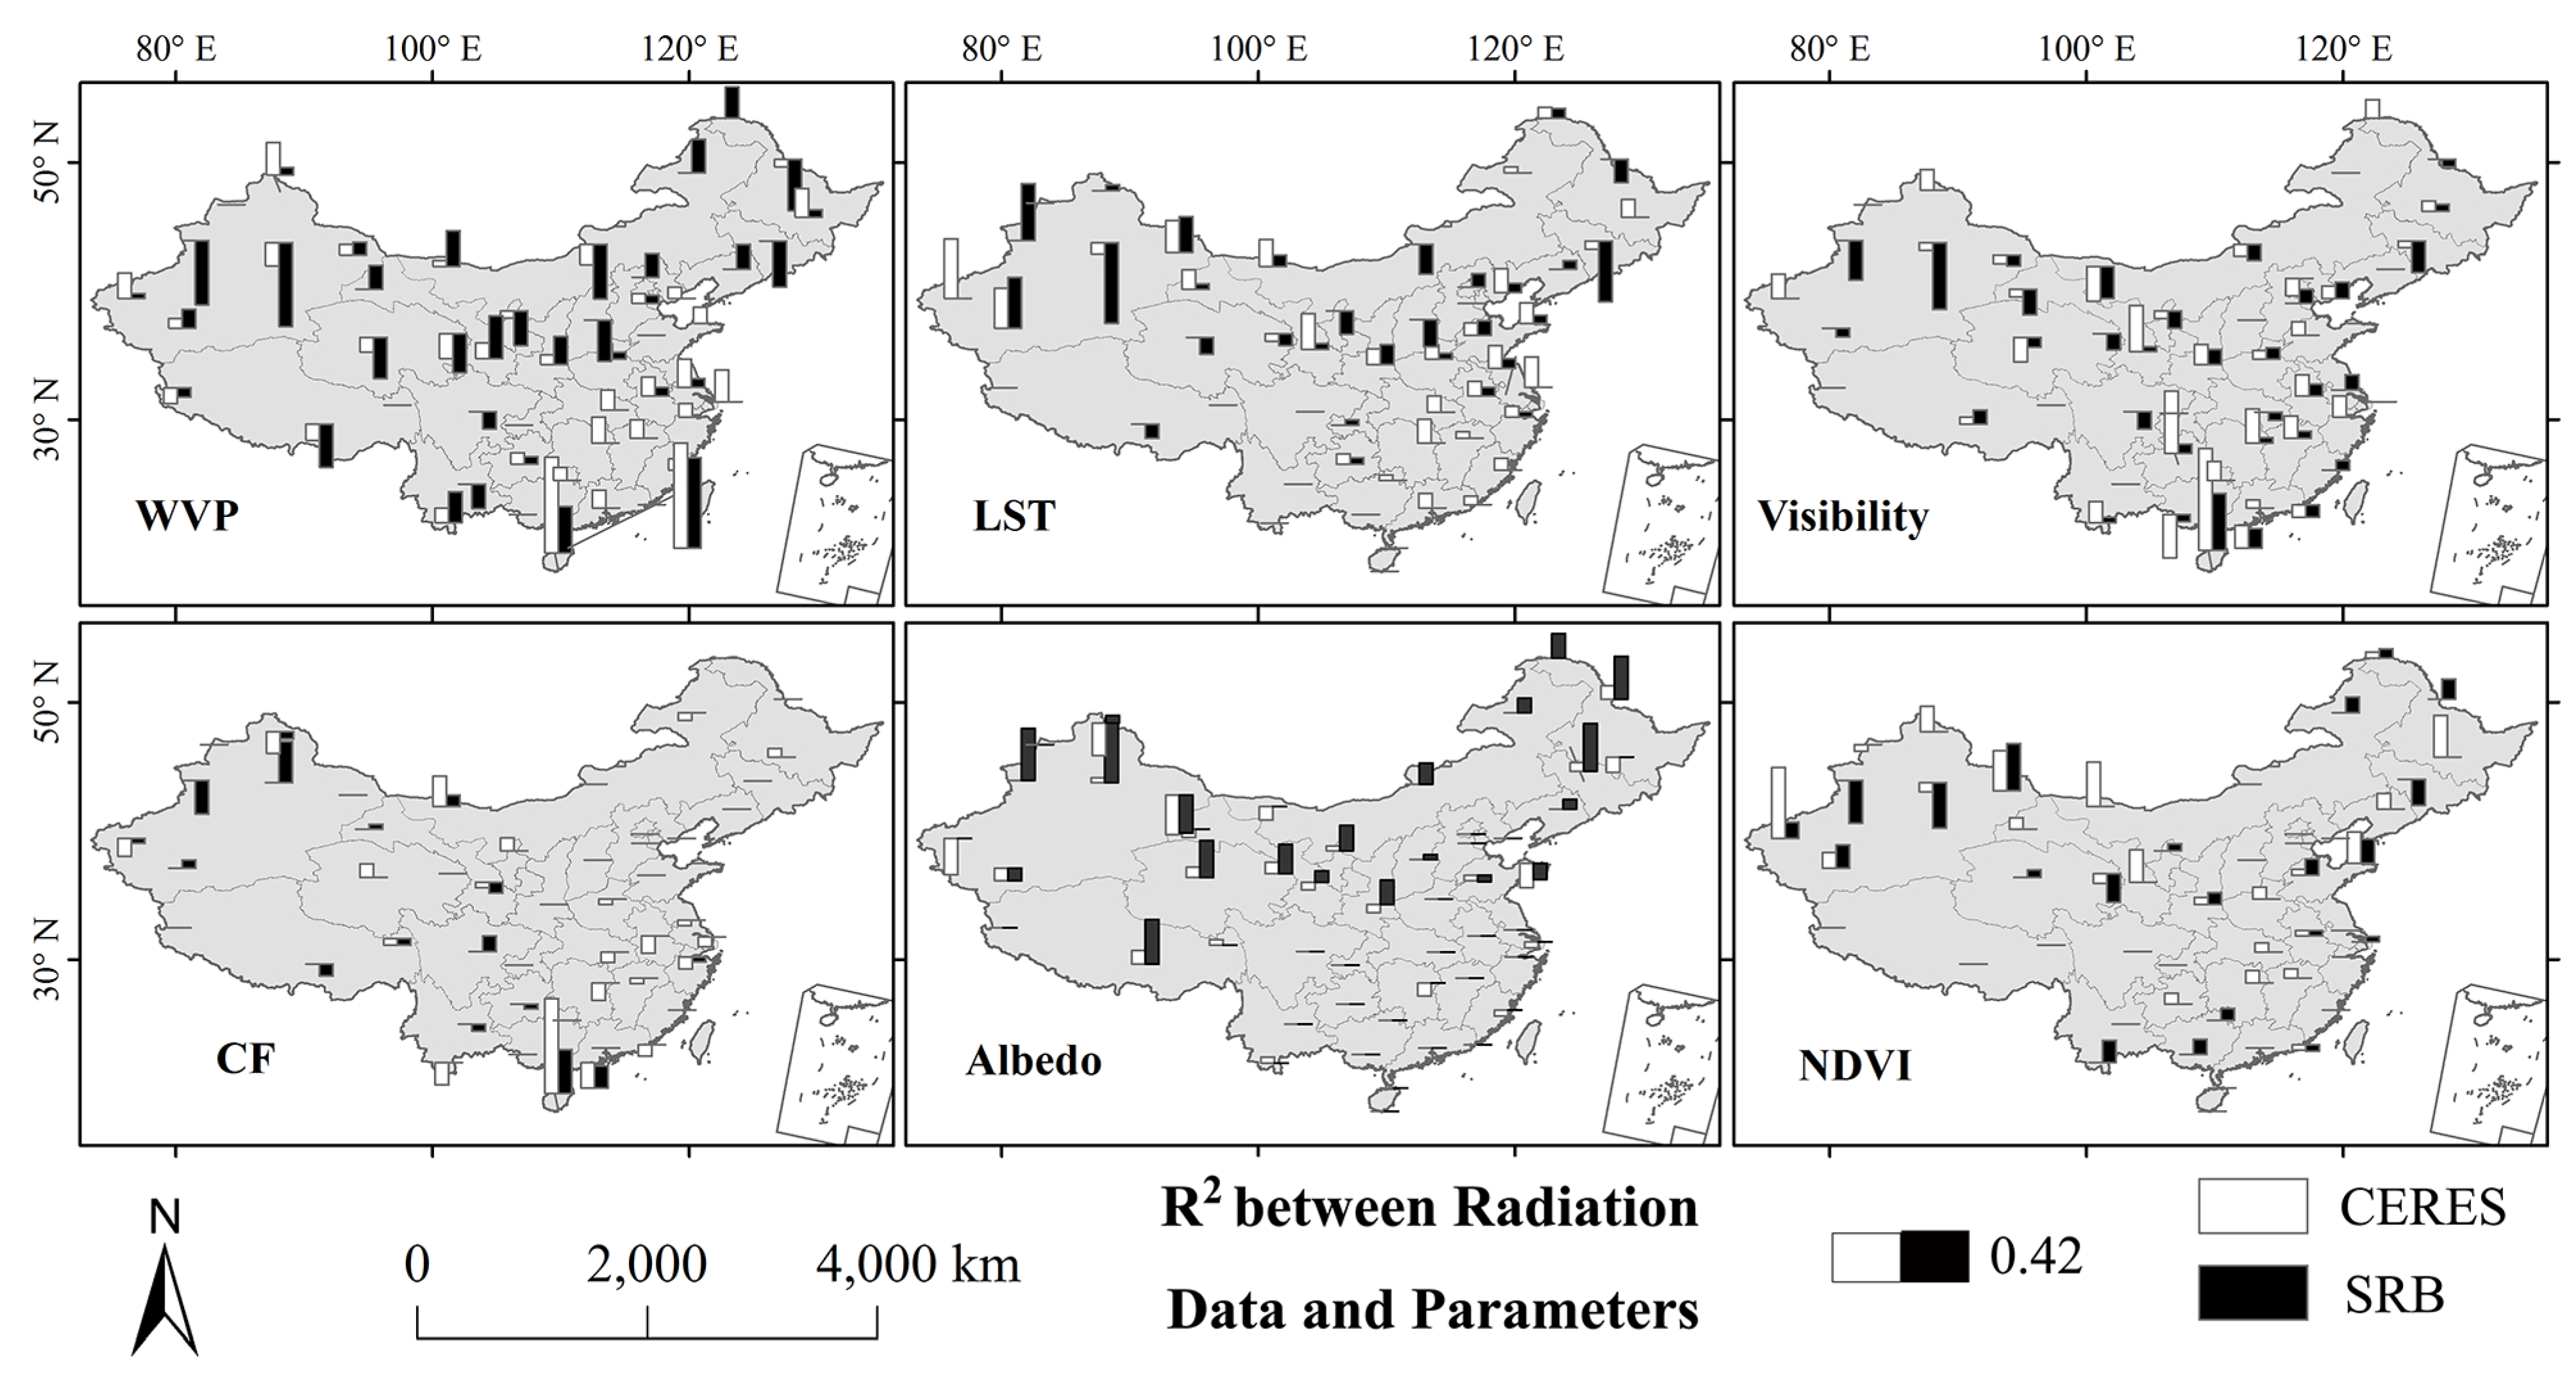
3.4. Error Sources in Surface Net Radiation

Surface net radiation is a combined result of NSW and NLW radiation. Errors in surface net radiation come from errors in the components. With the observation data of the radiation components at 11 level-1 sites, the errors in NSW and NLW and their contributions to net radiation can be identified. The overall errors are 27.5 W/m2 for CERES and 20.3 W/m2 for SRB at the sites (Table 1). Generally, for CERES, the NSW errors account for 56% of errors in net radiation, whereas the NLW errors account for 44%. For SRB, the NSW errors account for 65% and the NLW errors account for 35%. Specifically, the NLW errors contribute to >90% of errors in CERES net radiation at the Urumchi site, and the NSW errors contribute to >90% at the Zhengzhou site. For SRB, the NSW errors are dominant (>90%) at the Guangzhou and the Shanghai sites. Among 11 sites, the NSW errors contribute more at seven sites for CERES, and eight sites for SRB. This demonstrates that the NSW errors are the primary source of surface net radiation for both CERES and SRB. The mean NSW errors are 13.24 W/m2 and the mean NLW errors are 7.11 W/m2, which are close to 10 W/m2, as reported in Koster et al. [26].
Table 1. Errors in NSW and NLW and their relative contributions to errors in surface net radiation generated from the CERES and SRB products at 11 sites.
SitesCERESSRB
NSWNLWNSWNLW
Absolute ErrorRelative ContributionAbsolute ErrorRelative ContributionAbsolute ErrorRelative ContributionAbsolute ErrorRelative Contribution
(W/m2)(%)(W/m2)(%)(W/m2)(%)(W/m2)(%)
Mohe10.144214.155810.434413.2656
Harbin16.286010.744018.695117.9549
Urumchi−0.01018.11100−0.89510.8549
Ejin Banner16.693926.22618.573416.3066
Shenyang17.25872.641319.006410.6736
Beijing16.664917.195115.33658.4035
Zhengzhou13.12980.28219.6582−4.3318
Wuhan14.1181−3.391914.1271−5.7929
Shanghai15.585811.124215.9693−1.297
Guangzhou24.955917.304118.41100−0.030
Sanya22.185220.87485.932122.6579
Mean15.305613.204413.24657.1135
Errors in NSW and NLW are attributable to a number of influencing factors. Given an uncertainty of 0.035% in total solar irradiance measurement calibration [60] and an uncertainty of less than 1.5% in CERES calibration [61], they are neglected in the present study. Other factors include WVP, LST, surface albedo, NDVI, CF, and visibility. Figure 9 shows the correlation coefficients between the environmental parameters and error of radiation components. Each gray-scale grid represents R2 for linear fitting between component error (NSW or NLW) and environmental factor (denoted by y-axis) at each site (denoted by x-axis).
For CERES, there are no explicit relationships between the NSW errors and the environmental factors, except for a positive correlation between the errors and WVP/LST in south China. The R2 values (0.119, 0.117, and 0.116) are positive and statistically significant between the NLW errors and NDVI, WVP, and LST. As a result, these factors are identified as the major contributors to the errors. For SRB, a significant positive correlation appears between NSW errors and CF in northwest and south China, and also appears between NSW errors and surface albedo also in northeast and south China. Negative correlation can be found between NSW errors and the other four parameters at most sites. The mean R2 values are 0.222 for NDVI, 0.178 for WVP, and 0.110 for LST. There is a negative correlation between NLW errors and all the parameters except for albedo in northwest China, and an opposite correlation appears in south China. In addition, WVP, LST, and visibility are the main contributing factors, with a high R2 of 0.313, 0.261, and 0.319 in northwest China, and of 0.192, 0.216, and 0.247 in south China.
Figure 9. Correlation coefficients (R2) between environmental parameters and errors in NSW and NLW for CERES and SRB at 11 level-1 sites.
Remotesensing 07 04899 g009
Figure 10 shows a positive (negative) correlation with a R2 of 0.191 (0.013) between WVP and the errors in net radiation at major sites in south (north) China for CERES. There is a negative correlation with a R2 of 0.072–0.745 between WVP and the errors in net radiation in China for SRB, except for the south region. Similarly, there is also a negative correlation between visibility and the errors at sites in northwest China for CERES (R2 = 0.067–0.308) and SRB (R2 = 0.078–0.588). The positive correlation between surface albedo and the errors appears at most northern sites for SRB (R2 = 0.047–0.539), and both positive and negative correlation appear around China for CERES, which indicates that the influence of albedo is site-dependent for CERES errors. In south China, a positive correlation presents with an R2 of 0.170–0.894 for CERES and 0.051–0.503 for SRB. Oppositely, there is a positive correlation between the CERES net radiation errors and the environmental parameters including LST (R2 = 0.052–0.525) and NDVI (R2 = 0.049–0.626), at most sites. For SRB, the relationships are similar with a R2 of 0.050–0.503 for LST and 0.061–0.418 for NDVI in north China, but the relationships are not apparent in south China. A negative correlation (R2 = 0.045–0.194) appears in south China between CERES net radiation and CF.
Overall, the errors in net radiation are attributable to all parameters for CERES. CF is not the major contributor in north China. For SRB, according to R2, the contributors in north China are (in decreasing order of importance) WVP, surface albedo, LST, NDVI, and visibility. In south China, the largest contributor is WVP, followed by LST, visibility, and surface albedo. These results are similar to existing studies about uncertainty in surface net radiation. Kato et al. [62] report that the uncertainties in the CERES surface radiation data are dominated by uncertainties in surface temperature and precipitable water, in addition to cloud property and surface albedo [24,25]. For SRB, Zhang et al. [47,48] show that near-surface atmospheric properties, surface air temperature, column precipitable water, albedo, surface emissivity, and surface temperature are the uncertainty sources of surface net radiation.
There are several implications of the present findings. First, the SRB data are preferable for use in China’s regions, and the CERES data are applicable in northwest China as supplementary, especially in summer and winter seasons. Second, as the major error source, improvement of NSW should be a focus of retrieval correction for improving the data quality of surface net radiation. Third, both CERES and SRB errors are significantly dependent on input parameters, and future efforts should be made to reduce the input errors for more reliable retrieval. For CERES, cloud property, atmosphere profile, and surface temperature are the most important factors. For SRB, surface temperature and atmosphere profile are of central concern.
Figure 10. Spatial distributions of correlation coefficients (R2) between environmental parameters and errors in NSW and NLW for CERES and SRB at 50 sites.
Remotesensing 07 04899 g010

4. Conclusions

This study evaluates the accuracy of surface net radiation generated from the CERES and SRB datasets, respectively, for the period from March 2000 to December 2007 across China. The net radiation is generally larger than surface observation with a mean bias of 26.52 W/m2 for CERES and 18.57 W/m2 for SRB. The RMSE value is 34.58 W/m2 for CERES and 29.49 W/m2 for SRB.
Spatially, the satellite-retrieved monthly surface net radiation has relatively small errors for both CERES and SRB at inland sites in south China. Substantial errors are found at northeast sites for the two datasets, in addition to coastal sites for CERES. Temporally, the multi-year averaged monthly mean errors are large at sites in west China for spring and summer seasons, and in northeast China for spring and winter seasons. The annual mean errors fluctuate for SRB, but decrease for CERES between 2000 and 2007. About 56% of net radiation errors come from NSW and 44% from NLW radiation for CERES. For SRB, 65% of the errors may come from NSW and 35% from NLW radiation.
The errors in surface net radiation are attributable to environmental parameters including WVP, visibility, LST, NDVI, and surface albedo for CERES. For SRB, the major influences (in order of decreasing importance) are WVP, surface albedo, LST, NDVI, and visibility. In general, our findings offer an insight into error patterns in satellite-retrieved surface net radiation and should be valuable in reducing the identified influencing factors for improving retrieval accuracy of surface net radiation.

Acknowledgments

This work is supported by the State Key Program of National Science Foundation of China (41430855), the 973 Program of National Basic Research Program of China (2012CB417003), and the Key Program of Nanjing Institute of Geography and Limnology of the Chinese Academy of Sciences (NIGLAS2012135001).

Author Contributions

Xin Pan made careful data analysis and wrote this paper. Yuanbo Liu proposed the main idea, offered invaluable suggestions for data analysis, and revised the manuscript thoroughly. Xingwang Fan made some comments on the manuscript.

Conflicts of Interest

The authors declare no conflict of interest.

References

  1. Gui, S.; Liang, S.; Li, L. Validation of surface radiation data provided by the CERES over the Tibetan Plateau. In Proceedings of the 17th International Conference on Geoinformatics, Fairfax, VA, USA, 12–14 August 2009; pp. 1–6.
  2. Shi, Q.; Liang, S. Characterizing the surface radiation budget over the Tibetan Plateau with ground-measured, reanalysis, and remote sensing data sets: 1. Methodology. J. Geophys. Res.: Atmos. 2013, 118, 9642–9657. [Google Scholar] [CrossRef]
  3. Denmead, O.T.; Fritschen, L.J.; Shaw, R.H. Spatial distribution of net radiation in a corn field. Agron. J. 1962, 54, 505–510. [Google Scholar] [CrossRef]
  4. Federer, C.A. Spatial variation of net radiation, albedo and surface temperature of forests. J. Appl. Meteorol. 1968, 7, 789–795. [Google Scholar] [CrossRef]
  5. Idso, S.B.; Aase, J.K.; Jackson, R.D. Net radiation—Soil heat flux relations as influenced by soil water content variations. Bound. Layer Meteorol. 1975, 9, 113–122. [Google Scholar] [CrossRef]
  6. Shelton, M.L. Hydroclimatology: Perspectives and Applications; Cambridge University Press: Cambridge, UK, 2009; pp. 38–50. [Google Scholar]
  7. Tang, W.; Yang, K.; He, J.; Qin, J. Quality control and estimation of global solar radiation in China. Sol. Energy 2010, 84, 466–475. [Google Scholar] [CrossRef]
  8. Gilgen, H.; Ohmura, A. The global energy balance archive. Bull. Am. Meteorol. Soc. 1999, 80, 831–850. [Google Scholar] [CrossRef]
  9. Ohmura, A.; Gilgen, H.; Hegner, H.; Müller, G.; Wild, M.; Dutton, E.G.; Forgan, B.; Fröhlich, C.; Philipona, R.; Heimo, A.; et al. Baseline Surface Radiation Network (BSRN/WCRP): New precision radiometry for climate research. Bull. Am. Meteorol. Soc. 1998, 79, 2115–2136. [Google Scholar]
  10. Augustine, J.A.; de Luisi, J.J.; Long, C.N. SURFRAD—A national surface radiation budget network for atmospheric research. Bull. Am. Meteorol. Soc. 2000, 81, 2341–2357. [Google Scholar] [CrossRef]
  11. Baldocchi, D.; Falge, E.; Gu, L.; Olson, R.; Hollinger, D.; Running, S.; Anthoni, P.; Bernhofer, C.; Davis, K.; Evans, R.; et al. FLUXNET: A new tool to study the temporal and spatial variability of ecosystem-scale carbon dioxide, water vapor, and energy flux densities. Bull. Am. Meteorol. Soc. 2001, 82, 2415–2434. [Google Scholar]
  12. Zhang, Y.; Long, C.N.; Rossow, W.B.; Dutton, E.G. Exploiting diurnal variations to evaluate the ISCCP-FD flux calculations and radiative-flux-analysis-processed surface observations from BSRN, ARM, and SURFRAD. J. Geophys. Res.: Atmos. 2010. [Google Scholar] [CrossRef]
  13. Gilgen, H.; Wild, M.; Ohmura, A. Means and trends of shortwave irradiance at the surface estimated from global energy balance archive data. J. Clim. 1998, 11, 2042–2061. [Google Scholar] [CrossRef]
  14. Gui, S. Satellite Remote Sensing of Surface Net Radiation. Ph.D. Thesis, Wuhan University, Wuhan, China, 2010. [Google Scholar]
  15. Liang, S. Quantitative Remote Sensing of Land Surfaces; John Wiley & Sons: Hoboken, NJ, USA, 2005. [Google Scholar]
  16. Cox, S.J.; Stackhouse, P.W., Jr.; Gupta, S.K.; Mikovitz, J.C.; Zhang, T.; Hinkelman, L.M.; Wild, M.; Ohmura, A. The NASA/GEWEX surface radiation budget project: Overview and analysis. In Proceedings of the 12th Conference on Atmospheric Radiation, Madison, WI, USA, 10–14 July 2006.
  17. Wielicki, B.A.; Barkstrom, B.R.; Baum, B.A.; Charlock, T.P.; Green, R.N.; Kratz, D.P.; Lee, R.B.I.; Minnis, P.; Smith, G.L.; Wong, T.; et al. Clouds and the Earth’s Radiant Energy System (CERES): Algorithm overview. IEEE Trans. Geosci. Remote Sens. 1998, 36, 1127–1141. [Google Scholar] [CrossRef]
  18. Zhang, Y.; Rossow, W.B.; Lacis, A.A.; Oinas, V.; Mishchenko, M.I. Calculation of radiative fluxes from the surface to top of atmosphere based on ISCCP and other global data sets: Refinements of the radiative transfer model and the input data. J. Geophys. Res.: Atmos. 2004. [Google Scholar] [CrossRef]
  19. Lin, B.; Stackhouse, P.W., Jr.; Minnis, P.; Wielicki, B.A.; Hu, Y.; Sun, W.; Fan, T.; Hinkelman, L.M. Assessment of global annual atmospheric energy balance from satellite observations. J. Geophys. Res.: Atmos. 2008. [Google Scholar] [CrossRef]
  20. Yang, K.; Koike, T.; Stackhouse, P.W., Jr.; Mikovitz, C.; Cox, S.J. An assessment of satellite surface radiation products for highlands with Tibet instrumental data. Geophys. Res. Let. 2006. [Google Scholar] [CrossRef]
  21. Hinkelman, L.M.; Stackhouse, P.W.; Wielicki, B.A.; Zhang, T.; Wilson, S.R. Surface insolation trends from satellite and ground measurements: Comparisons and challenges. J. Geophys. Res.: Atmos. 2009. [Google Scholar] [CrossRef]
  22. Yang, K.; He, J.; Tang, W.; Qin, J.; Cheng, C.C.K. On downward shortwave and longwave radiations over high altitude regions: Observation and modeling in the Tibetan Plateau. Agric. For. Meteorol. 2010, 150, 38–46. [Google Scholar] [CrossRef]
  23. Stackhouse, P.W., Jr.; Gupta, S.K.; Cox, S.J.; Zhang, T.; Mikovitz, J.C.; Hinkelman, L.M. 24.5-year SRB data set released. GEWEX News 2011, 21, 10–12. [Google Scholar]
  24. Kato, S.; Loeb, N.G.; Rutan, D.A.; Rose, F.G.; Sun-Mack, S.; Miller, W.F.; Chen, Y. Uncertainty estimate of surface irradiances computed with MODIS-, CALIPSO-, and CloudSat-derived cloud and aerosol properties. Surv. Geophys. 2012, 33, 395–412. [Google Scholar] [CrossRef]
  25. Kato, S.; Loeb, N.G.; Rose, F.G.; Doelling, D.R.; Rutan, D.A.; Caldwell, T.E.; Yu, L.; Weller, R.A.. Surface irradiances consistent with CERES-derived top-of-atmosphere shortwave and longwave irradiances. J. Clim. 2013, 26, 2719–2740. [Google Scholar]
  26. Koster, R.D.; Fekete, B.M.; Huffman, G.J.; Stackhouse, P.W., Jr. Revisiting a hydrological analysis framework with International Satellite Land Surface Climatology Project Initiative 2 rainfall, net radiation, and runoff fields. J. Geophys. Res.: Atmos. 2006. [Google Scholar] [CrossRef]
  27. Miralles, D.G.; Holmes, T.R.H.; de Jeu, R.A.M.; Gash, J.H.; Meesters, A.G.C.A.; Dolman, A.J. Global land-surface evaporation estimated from satellite-based observations. Hydrol. Earth Syst. Sci. Discuss. 2010, 7, 8479–8519. [Google Scholar] [CrossRef]
  28. Vinukollu, R.K.; Wood, E.F.; Ferguson, C.R.; Fisher, J.B. Global estimates of evapotranspiration for climate studies using multi-sensor remote sensing data: Evaluation of three process-based approaches. Remote Sens. Environ. 2011, 115, 801–823. [Google Scholar] [CrossRef]
  29. Wu, F.; Fu, C. Assessment of GEWEX/SRB version 3.0 monthly global radiation dataset over China. Meteorol. Atmos. Phys. 2011, 112, 155–166. [Google Scholar]
  30. Xia, X.A.; Wang, P.C.; Chen, H.B.; Liang, F. Analysis of downwelling surface solar radiation in China from National Centers for Environmental Prediction reanalysis, satellite estimates, and surface observations. J. Geophys. Res.: Atmos. 2006. [Google Scholar] [CrossRef]
  31. Xu, J.; Masuda, K.; Ishigooka, Y.; Kuwagata, T.; Haginoya, S.; Hayasaka, T.; Yasunar, T. Estimation and verification of daily surface shortwave flux over China. J. Meteorol. Soc. Jpn. 2011, 89, 225–238. [Google Scholar] [CrossRef]
  32. Ma, Y.Z.; Liu, X.N.; Xu, S. The description of Chinese radiation data and their quality control procedures. Meteorol. Sci. 1998, 2, 53–56. [Google Scholar]
  33. Shi, G.Y.; Hayasaka, T.; Ohmura, A.; Chen, Z.H.; Wang, B.; Zhao, J.Q.; Che, H.Z.; Xu, L. Data Quality Assessment and the Long-Term Trend of Ground Solar Radiation in China. J. Appl. Meteorol. Climatol. 2008, 47, 1006–1016. [Google Scholar]
  34. Stackhouse, P.W., Jr.; SJ, C.; Chiacchio, M.; Mikovitz, J. The WCRP/GEWEX Surface Radiation Budget Project Release 2: An Assessment of Surface Fluxes at 1 Degree Resolution; NASA Langley Technical Report; NASA: Washington, DC, USA, 2000. [Google Scholar]
  35. Gupta, S.K.; Ritchey, N.A.; Wilber, A.C.; Whitlock, C.H.; Gibson, G.G.; Stackhouse, P.W., Jr. A climatology of surface radiation budget derived from satellite data. J. Clim. 1999, 12, 2691–2710. [Google Scholar] [CrossRef]
  36. Gupta, S.K.; Stackhouse, P.W., Jr.; Cox, S.J.; Mikovitz, J.C.; Zhang, T. Surface radiation budget project completes 22-year data set. GEWEX News 2006, 16, 12–13. [Google Scholar]
  37. Smith, G.L.; Priestley, K.J.; Loeb, N.G.; Wielickia, B.A.; Charlocka, T.P.; Minnisa, P.; Doellinga, D.R.; Rutanb, D.A. Clouds and Earth Radiant Energy System (CERES), a review: Past, present and future. Adv. Sp. Res. 2011, 48, 254–263. [Google Scholar] [CrossRef]
  38. Staylor, W.F.; Wilber, A.C. Global surface albedos estimated from ERBE data. In Proceedings of the AMS Conference on Atmospheric Radiation, San Francisco, CA, USA, 23–27 July 1990; pp. 231–236.
  39. Pinker, R.T.; Ewing, J.A. Modeling surface solar radiation: Model formulation and validation. J. Clim. Appl. Meteorol. 1985, 24, 389–401. [Google Scholar] [CrossRef]
  40. Pinker, R.T.; Laszlo, I. Modeling surface solar irradiance for satellite applications on a global scale. J. Appl. Meteorol. 1992, 31, 194–211. [Google Scholar] [CrossRef]
  41. Fu, Q.; Liou, K.N.; Cribb, M.C.; Charlock, T.P.; Grossman, A. Multiple scattering parameterization in thermal infrared radiative transfer. J. Atmos. Sci. 1997, 54, 2799–2812. [Google Scholar] [CrossRef]
  42. Li, Z.; Leighton, H.G.; Masuda, K.; Takashima, T. Estimation of SW flux absorbed at the surface from TOA reflected flux. J. Clim. 1993, 6, 317–330. [Google Scholar] [CrossRef]
  43. Gupta, S.K. A parameterization for longwave surface radiation from sun-synchronous satellite data. J. Clim. 1989, 2, 305–320. [Google Scholar] [CrossRef]
  44. Gupta, S.K.; Darnell, W.L.; Wilber, A.C. A parameterization for longwave surface radiation from satellite data: Recent improvements. J. Appl. Meteorol. 1992, 31, 1361–1367. [Google Scholar] [CrossRef]
  45. Qin, S.; Shi, G.; Chen, L.; Wang, B.; Zhao, J.; Yu, C.; Yang, S. Long-term variation of aerosol optical depth in China based on meteorological horizontal visibility observations. Chin. J. Atmos. Sci. 2010, 34, 449–456. [Google Scholar]
  46. Bevis, M.; Businger, S.; Herring, T.A.; Rocken, C.; Anthes, R.A.; Ware, R.H. GPS meteorology: Remote sensing of atmospheric water vapor using the Global Positioning System. J. Geophys. Res.: Atmos. 1992, 97, 15787–15801. [Google Scholar] [CrossRef]
  47. Zhang, Y.; Rossow, W.B.; Stackhouse, P.W., Jr. Comparison of different global information sources used in surface radiative flux calculation: Radiative properties of the near-surface atmosphere. J. Geophys. Res.: Atmos. 2006. [Google Scholar] [CrossRef]
  48. Zhang, Y.; Rossow, W.B.; Stackhouse, P.W., Jr. Comparison of different global information sources used in surface radiative flux calculation: Radiative properties of the surface. J. Geophys. Res.: Atmos. 2007. [Google Scholar] [CrossRef]
  49. Duan, J.; Liu, Y. Variation and trends of cloud amount in china over past 20 years. Meteorol. Sci. Technol. 2011, 39, 280–288. [Google Scholar]
  50. Staley, D.O.; Jurica, G.M. Effective atmospheric emissivity under clear skies. J. Appl. Meteorol. 1972, 11, 349–356. [Google Scholar] [CrossRef]
  51. Yang, J.; Qiu, J. Method for estimating precipitable water and effective water vapor content from ground humidity parameters. Chin. J. Atmos. Sci. 2002, 1, 9–22. [Google Scholar]
  52. Rossow, W.B.; Schiffer, R.A. Advances in understanding clouds from ISCCP. Bull. Am. Meteorol. Soc. 1999, 80, 2261–2287. [Google Scholar] [CrossRef]
  53. Bloom, S.; Da Silva, A.; Dee, D.; Bosilovich, M.; Chern, J.D.; Pawson, S.; Wu, M.L. Documentation and Validation of the Goddard Earth Observing System (GEOS) Data Assimilation System-Version 4; NASA Technical Report; NASA Goddard Space Flight Center: Greenbelt, MD, USA, 2005; Volume 26, p. 187. [Google Scholar]
  54. Wilber, A.C.; Kratz, D.P.; Gupta, S.K. Surface Emissivity Maps for Use in Satellite Retrievals of Longwave Radiation; National Aeronautics and Space Administration, Langley Research Center: Hampton, VA, USA, 1999. [Google Scholar]
  55. CERES. CERES_EBAF-Surface_Ed2.8 Data Quality Summary. Available online: http://ceres.larc.nasa.gov/documents/DQ_summaries/CERES_EBAF-Surface_Ed2.8_DQS.pdf (accessed on 16 April 2015).
  56. Van de Griend, A.A.; Owe, M. On the relationship between thermal emissivity and the normalized difference vegetation index for natural surfaces. Int. J. Remote Sens. 1993, 14, 1119–1131. [Google Scholar] [CrossRef]
  57. Nagol, J.R.; Vermote, E.F.; Prince, S.D. Effects of atmospheric variation on AVHRRNDVI data. Remote Sens. Environ. 2009, 113, 392–397. [Google Scholar] [CrossRef]
  58. Hakuba, M.Z.; Folini, D.; Sanchez-Lorenzo, A.; Wild, M. Spatial representativeness of ground-based solar radiation measurements. J. Geophys. Res.: Atmos. 2013, 118, 8585–8597. [Google Scholar] [CrossRef]
  59. Suttles, J.T.; Ohring, G. Surface Radiation Budget for Climate Applications; NASA Reference Publication 1169; NASA: Washington, DC, USA, 1986. [Google Scholar]
  60. Kopp, G.; Lean, J.L. A new, lower value of total solar irradiance: Evidence and climate significance. Geophys. Res. Lett. 2011. [Google Scholar] [CrossRef]
  61. Morstad, D.L.; Doelling, D.R.; Bhatt, R.; Scarino, B. The CERES calibration strategy of the geostationary visible channels for CERES cloud and flux products. Proc. SPIE 2011, 8153. [Google Scholar] [CrossRef]
  62. Kato, S.; Rose, F.G.; Sun-Mack, S.; Miller, W.F.; Chen, Y.; Rutan, D.A.; Stephens, G.L.; Loeb, N.G.; Minnis, P.; Wielicki, B.A.; et al. Improvements of top-of-atmosphere and surface irradiance computations with CALIPSO-, CloudSat-, and MODIS-derived cloud and aerosol properties. J. Geophys. Res.: Atmos. 2011. [Google Scholar] [CrossRef]

