
Knowledge-Based Detection and Assessment of Damaged Roads Using Post-Disaster High-Resolution Remote Sensing Image

 ,
,
Abstract
:
1. Introduction
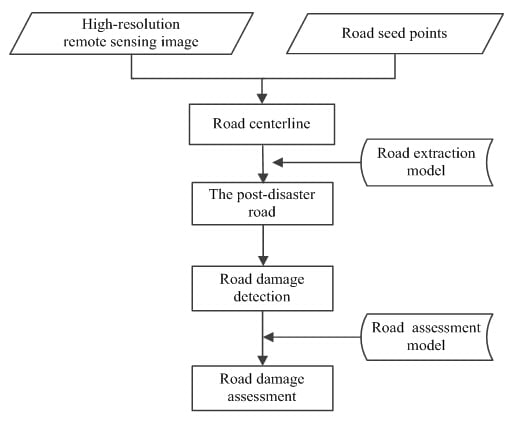
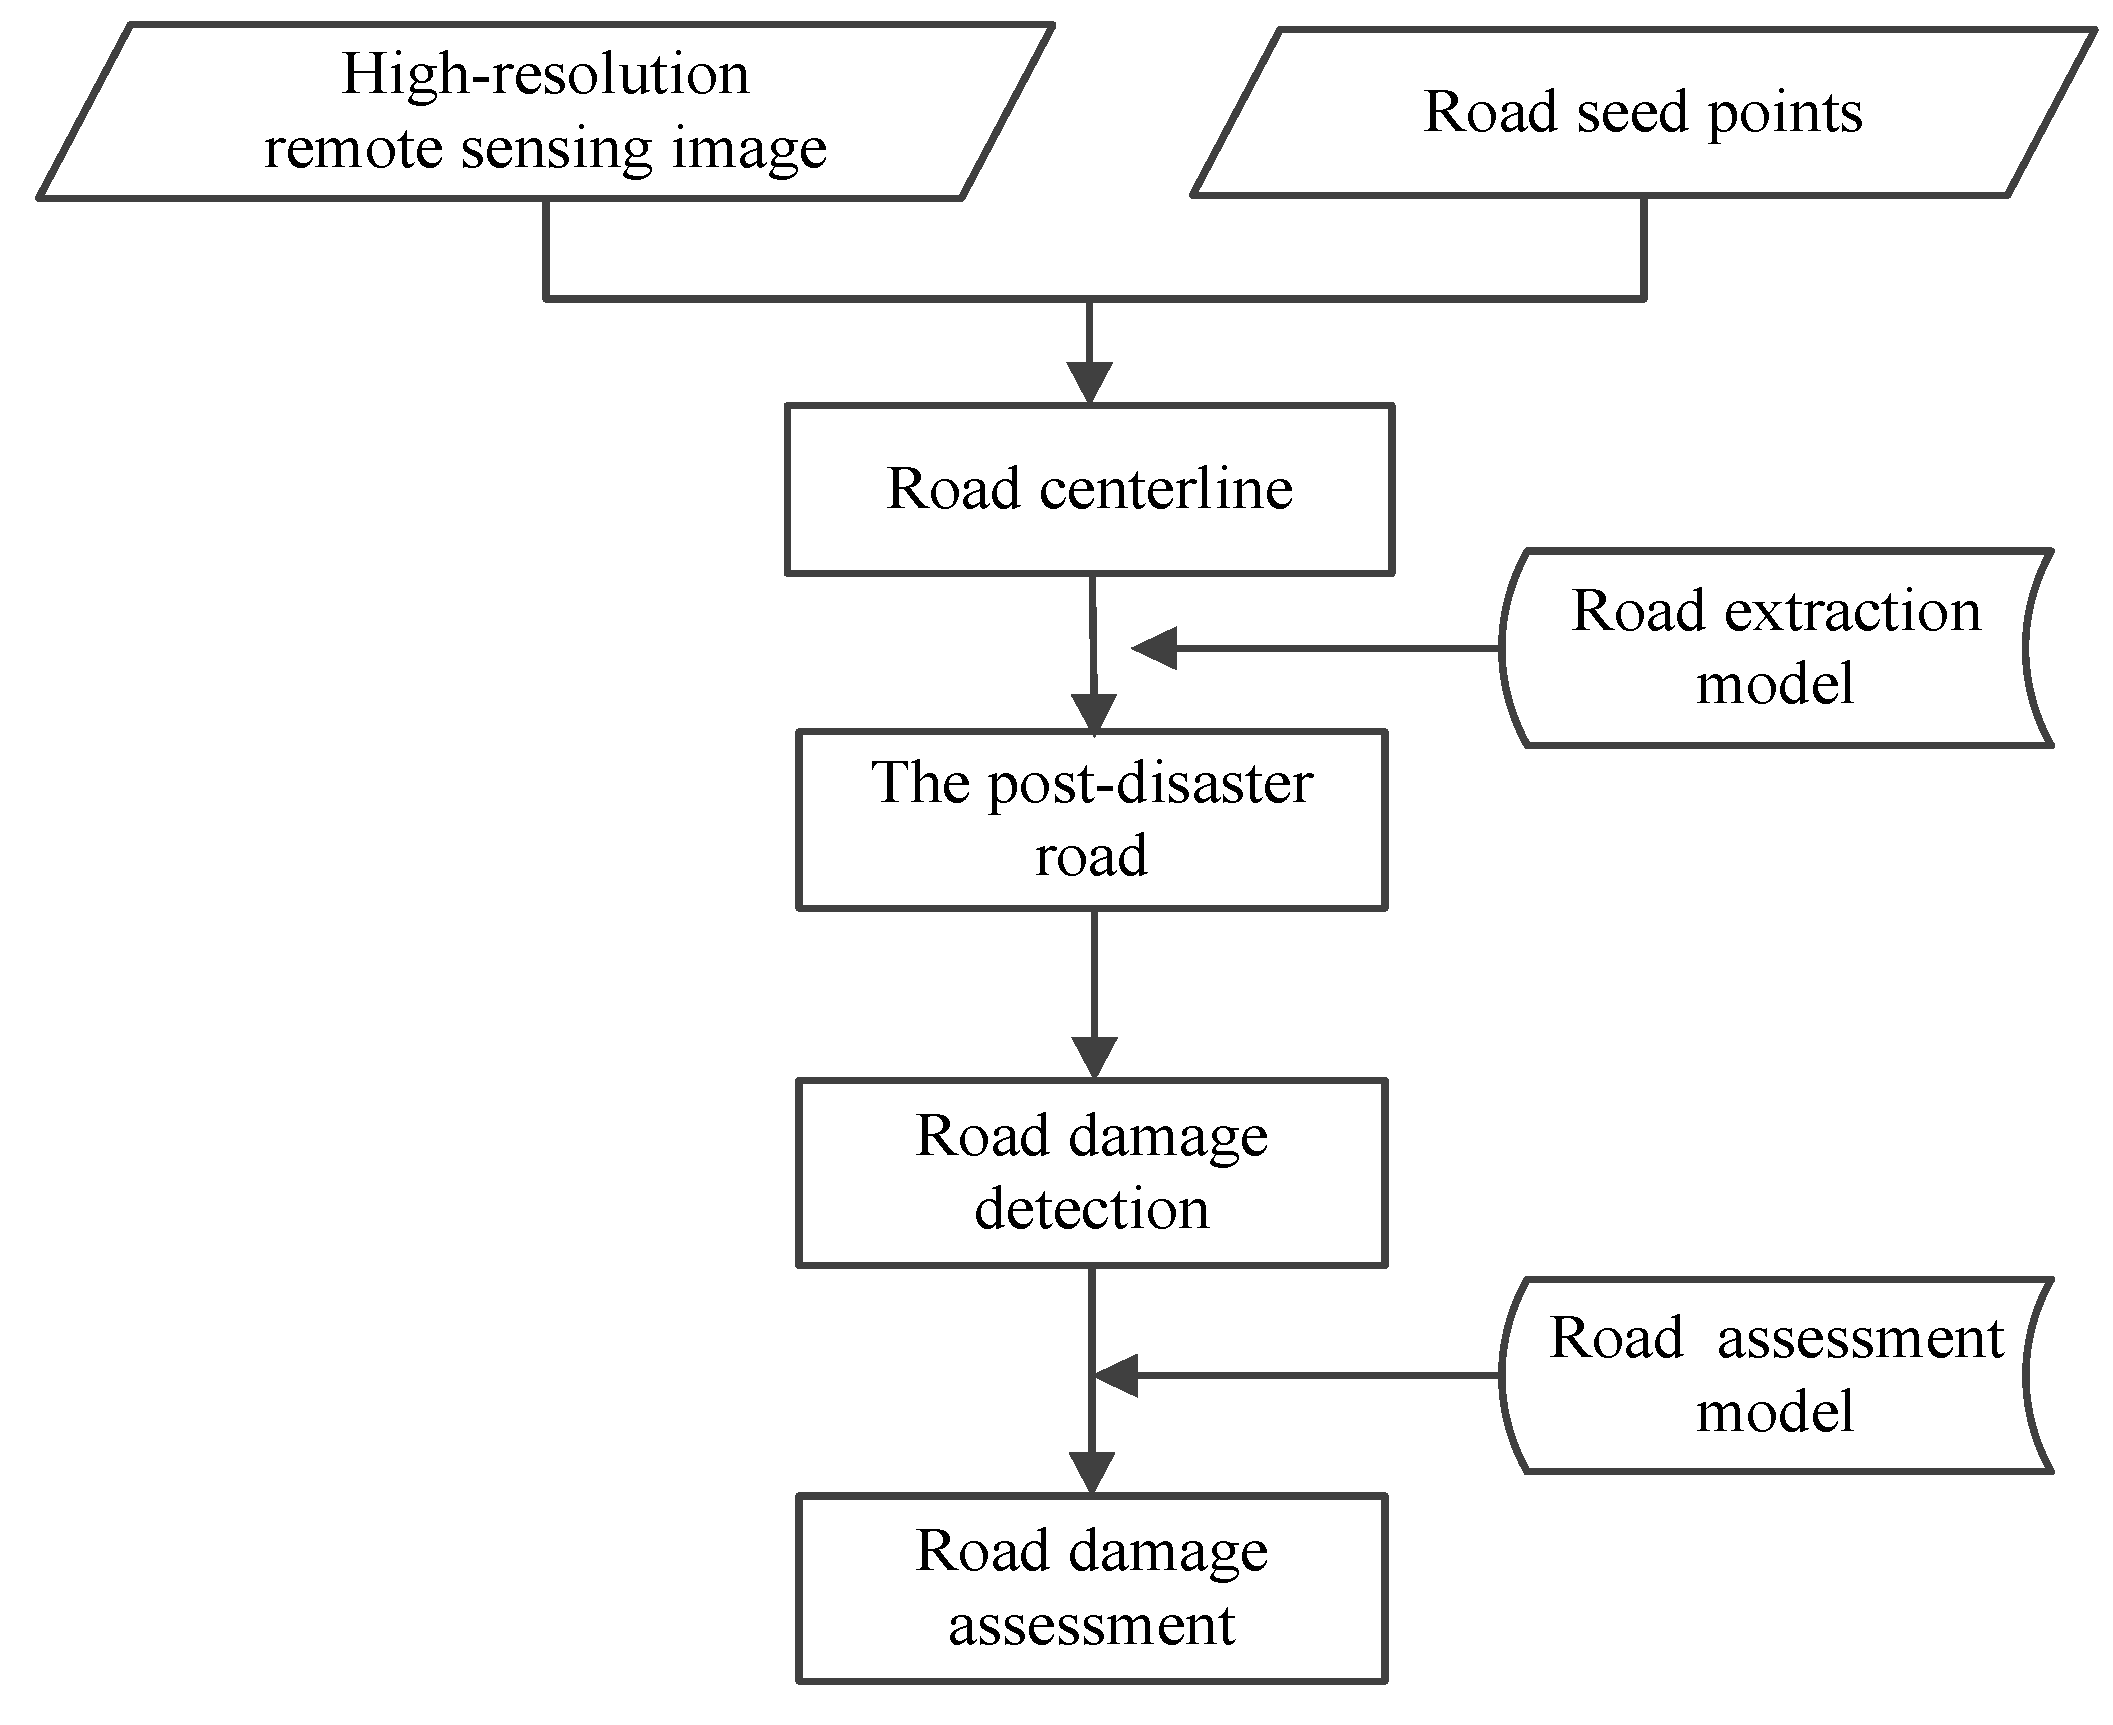
2. Methods
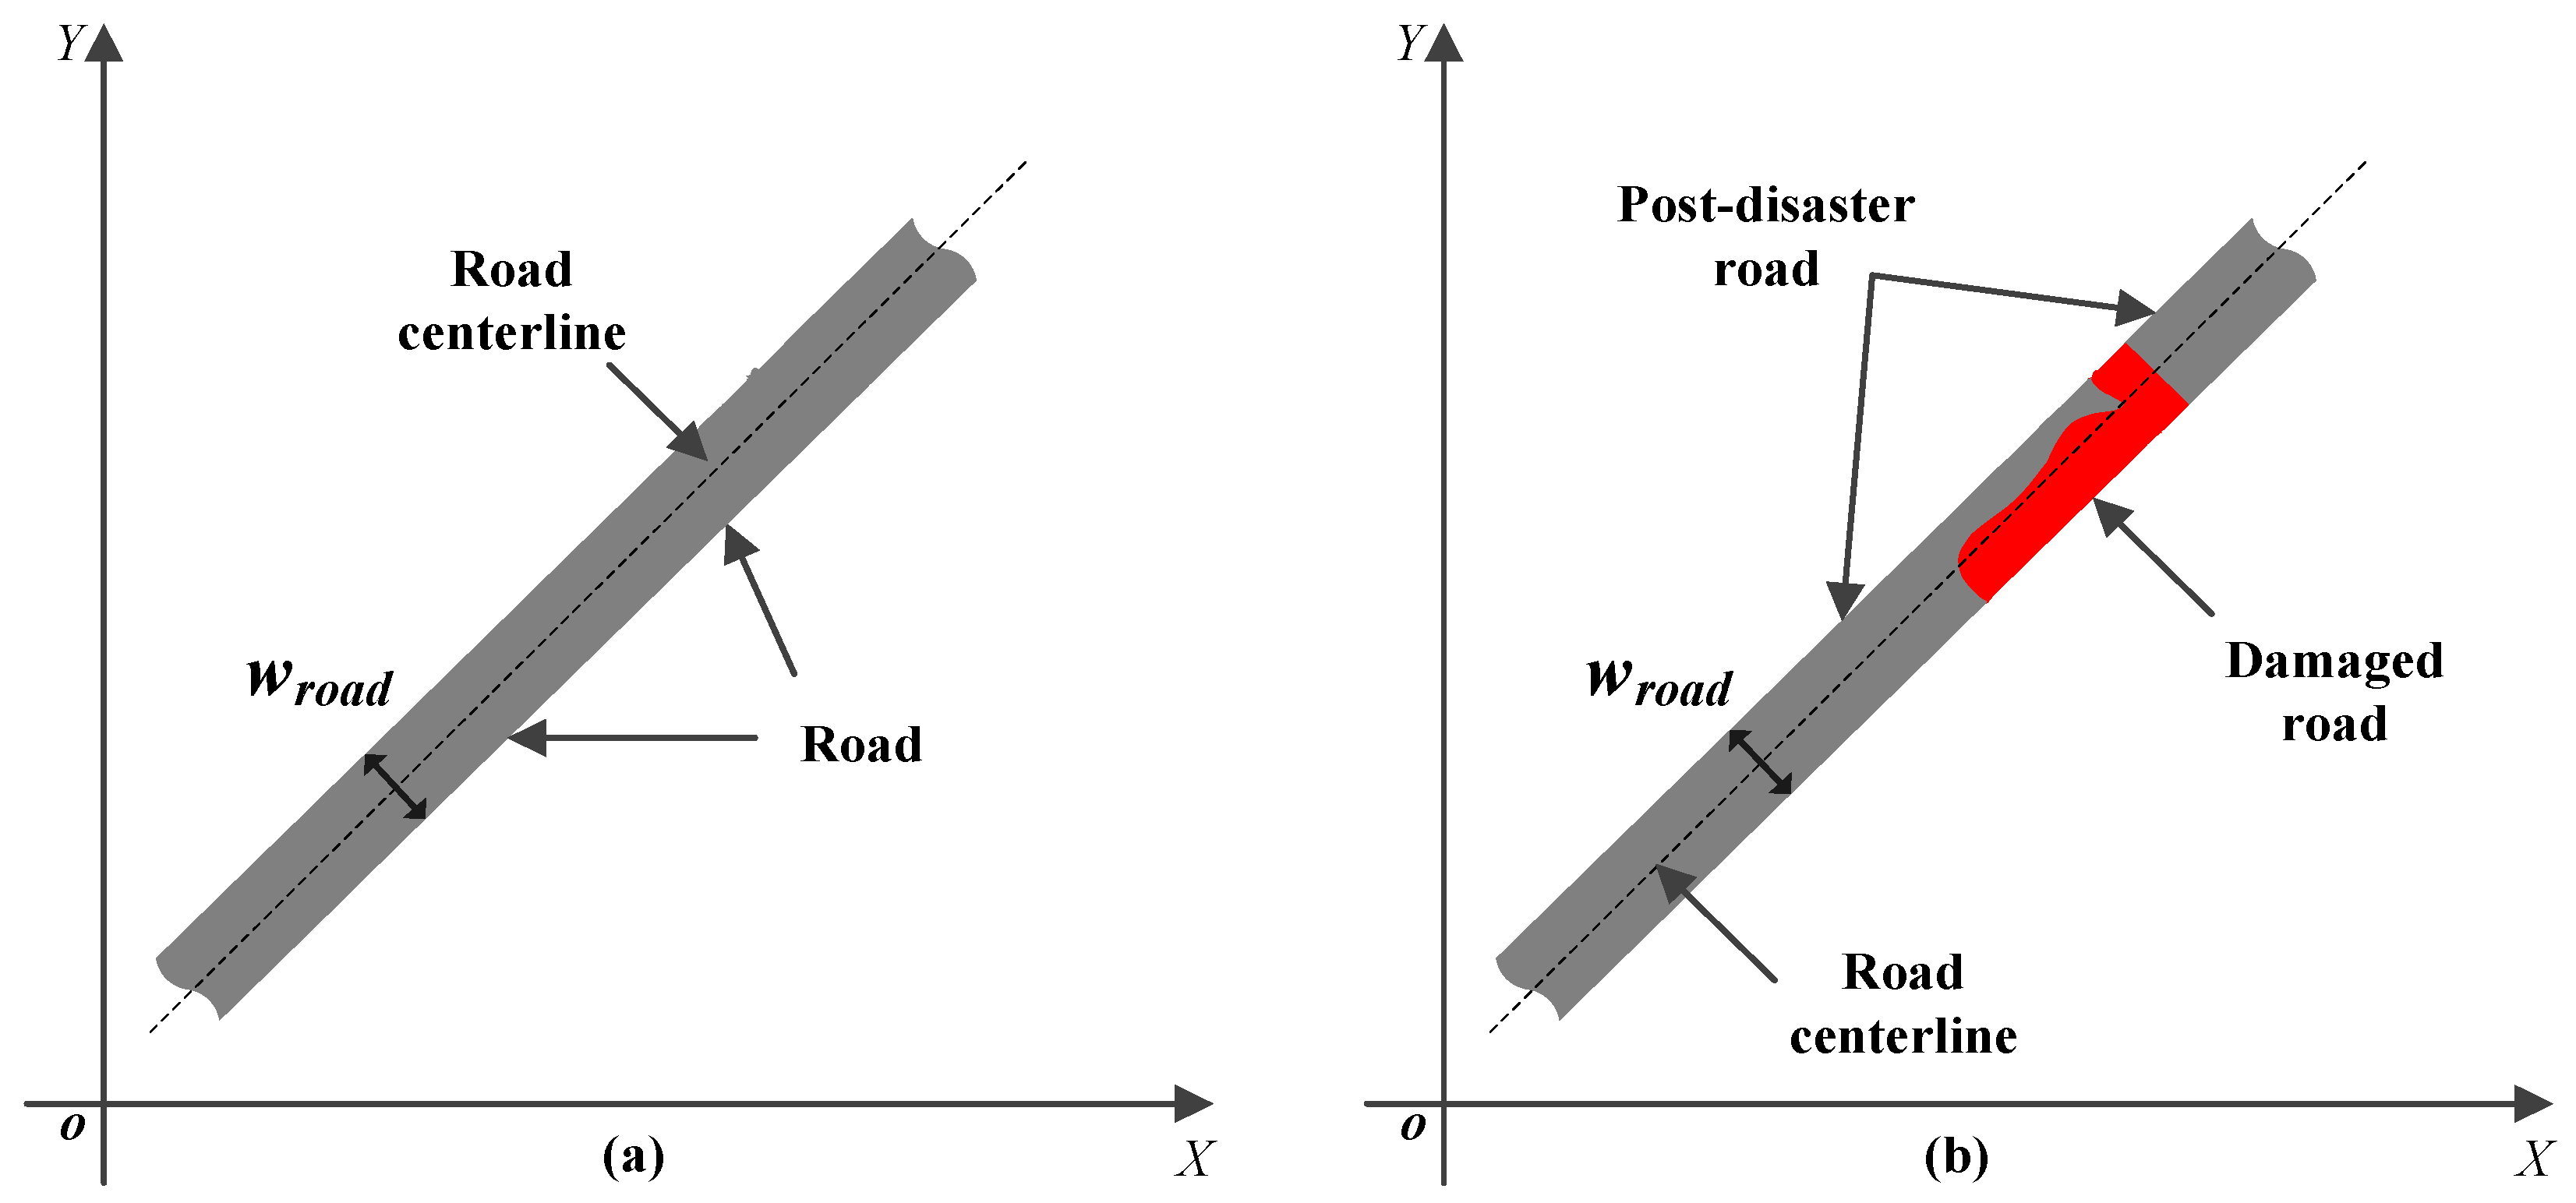
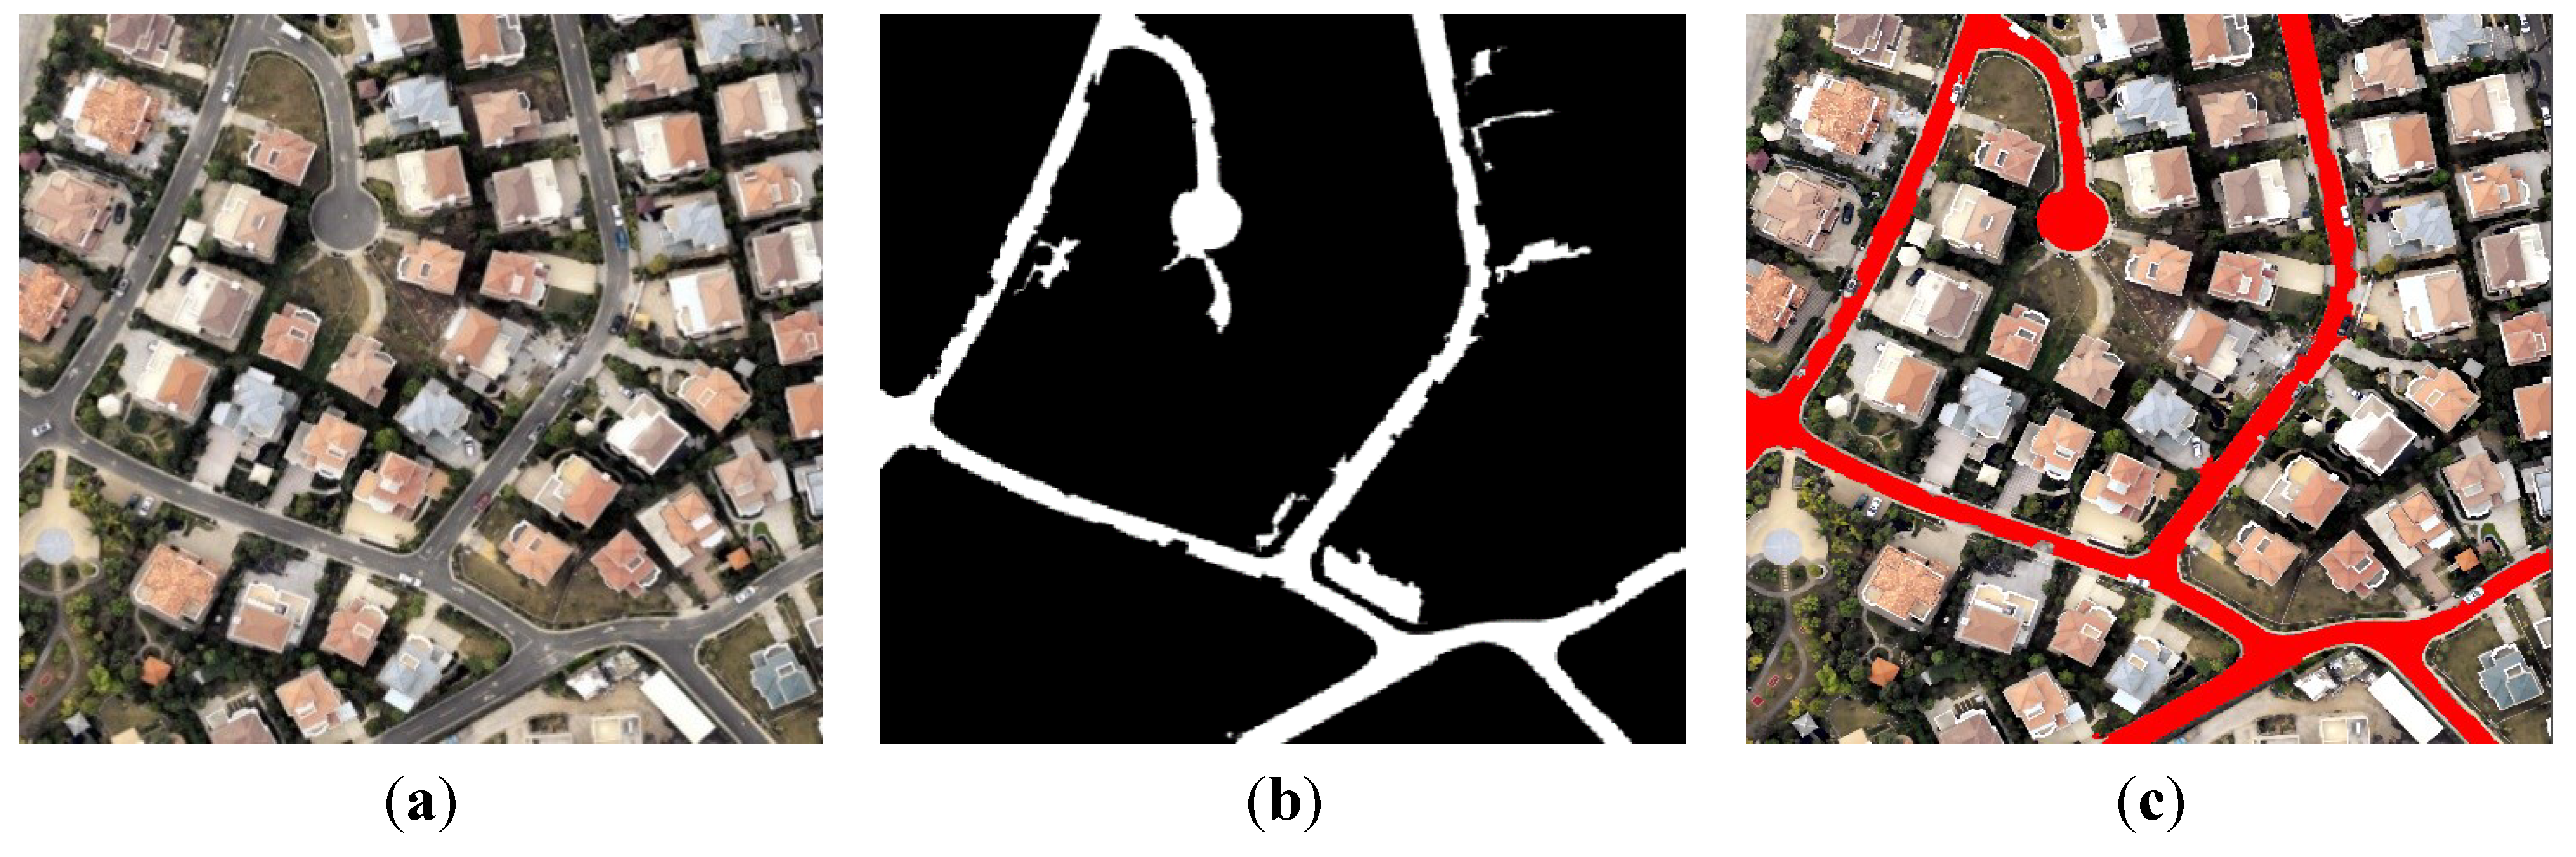
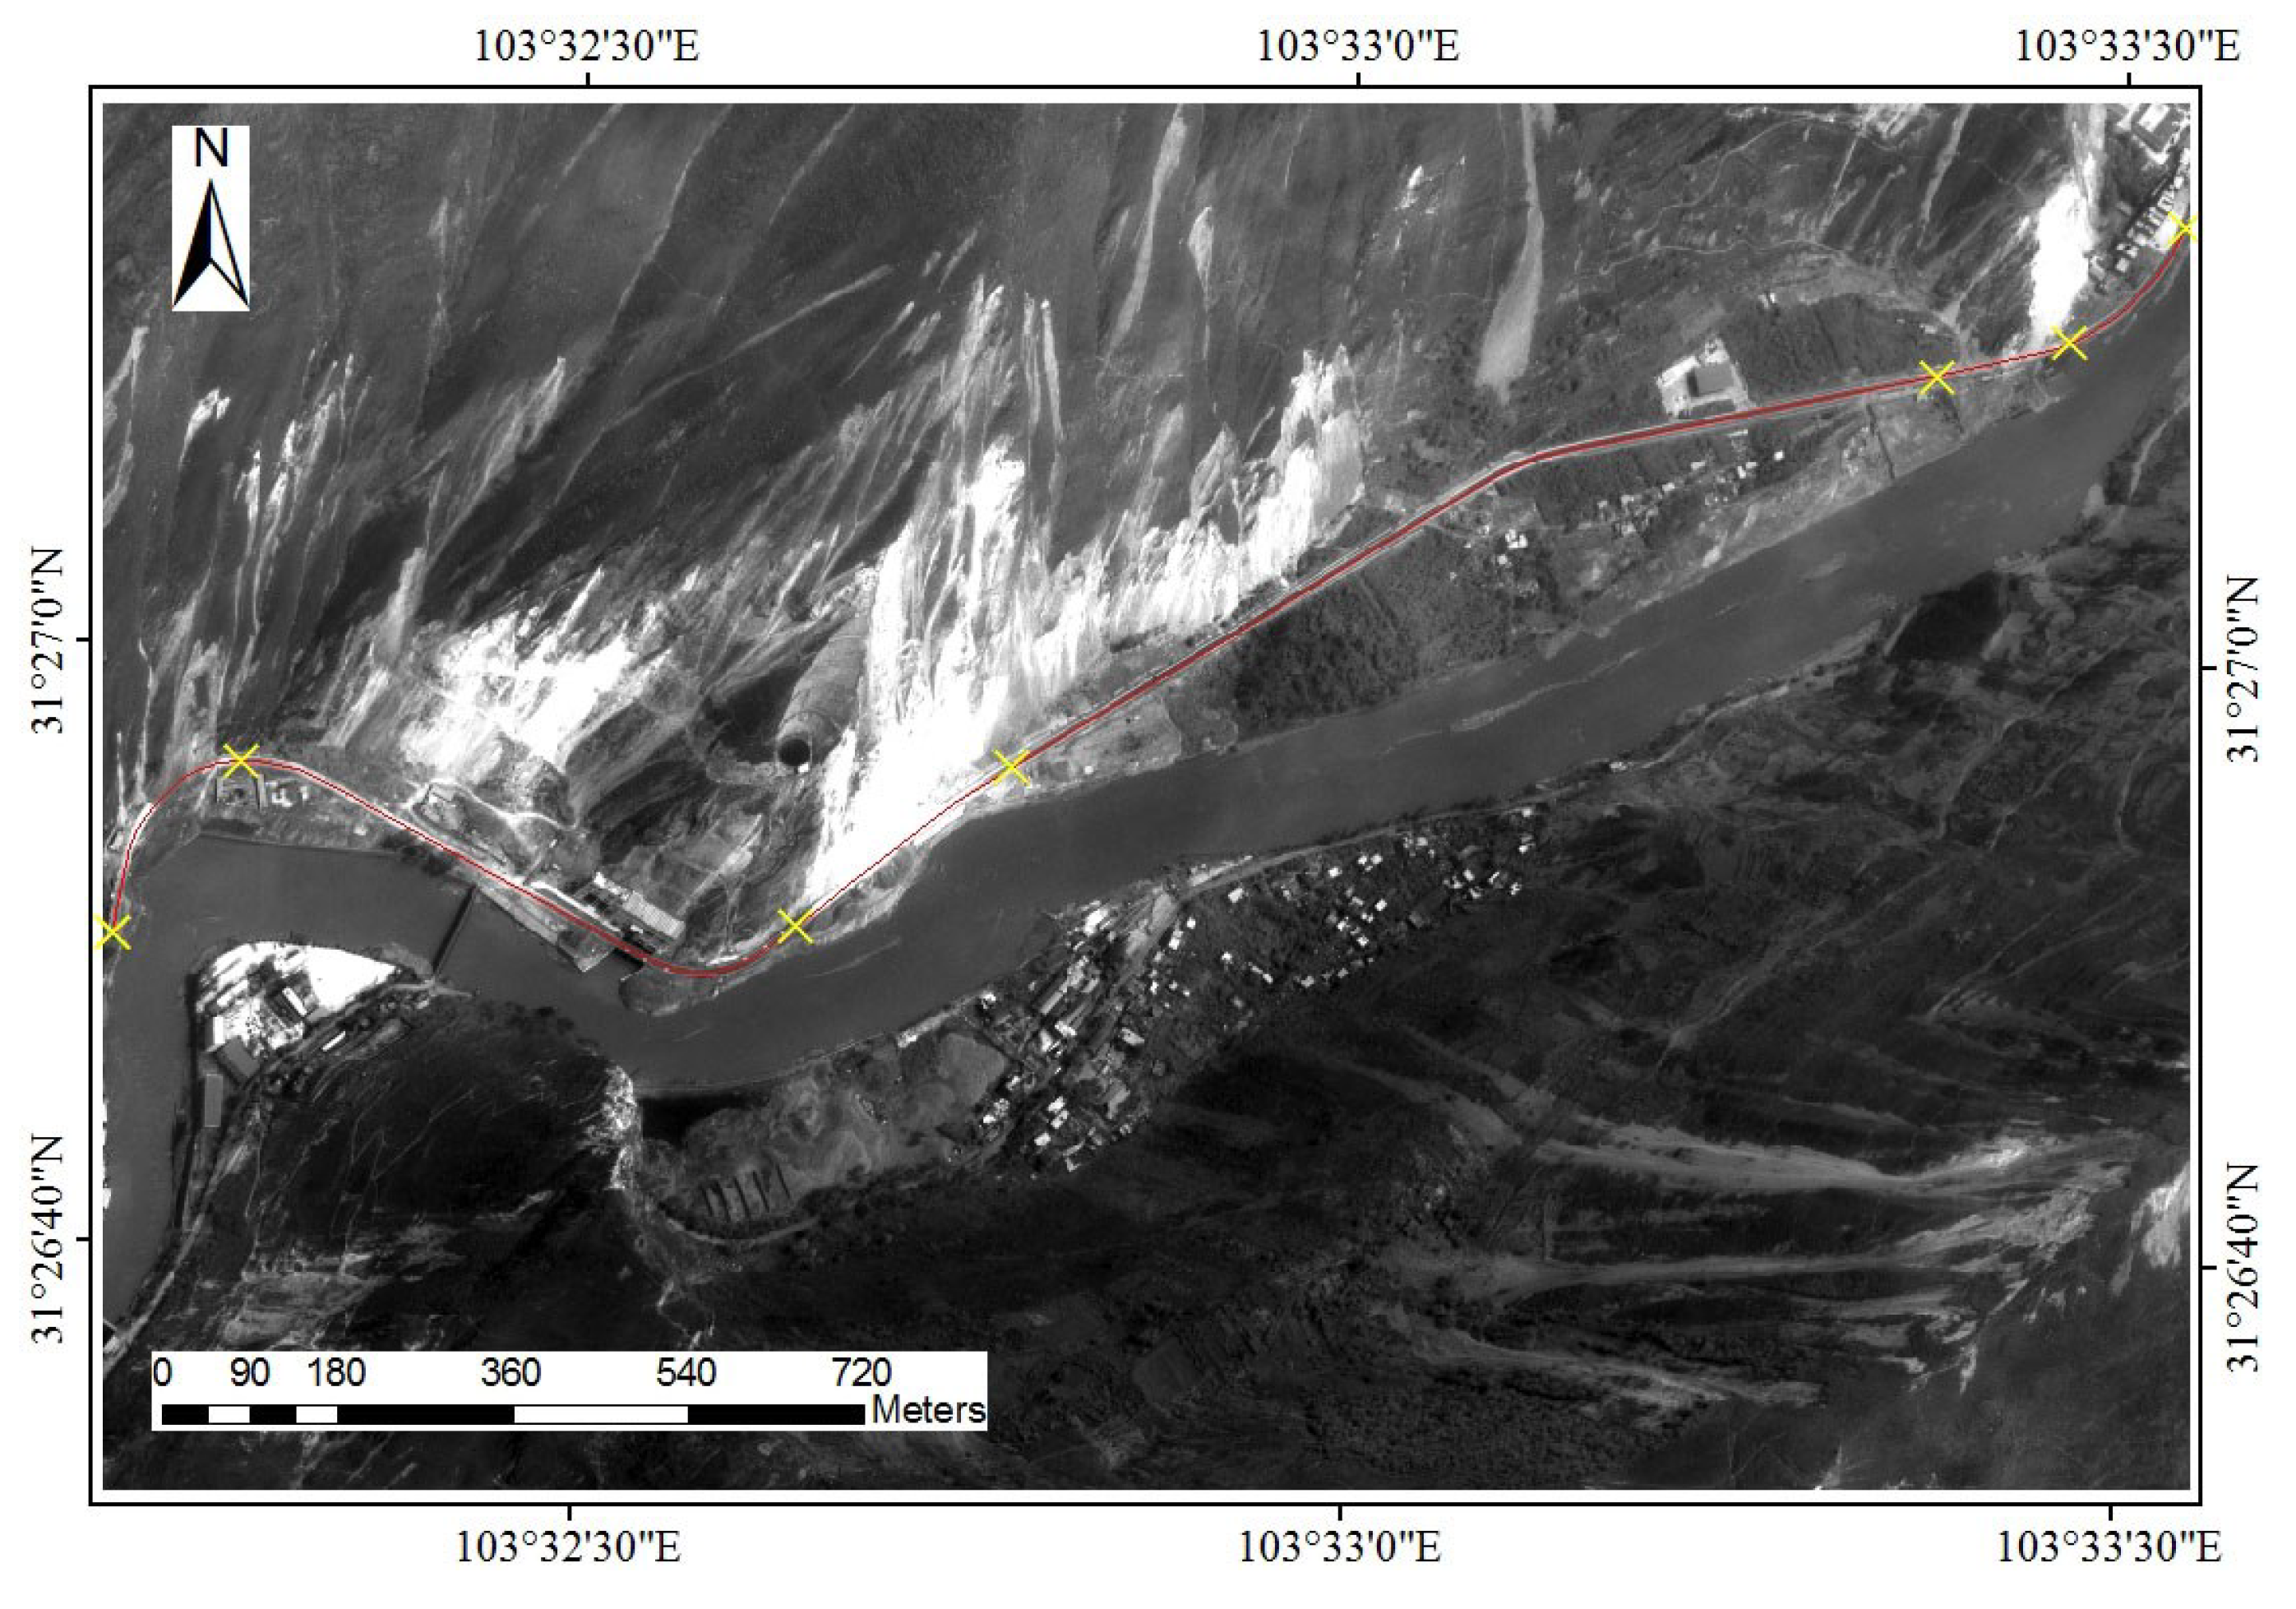
2.1. Road Centerline Extraction

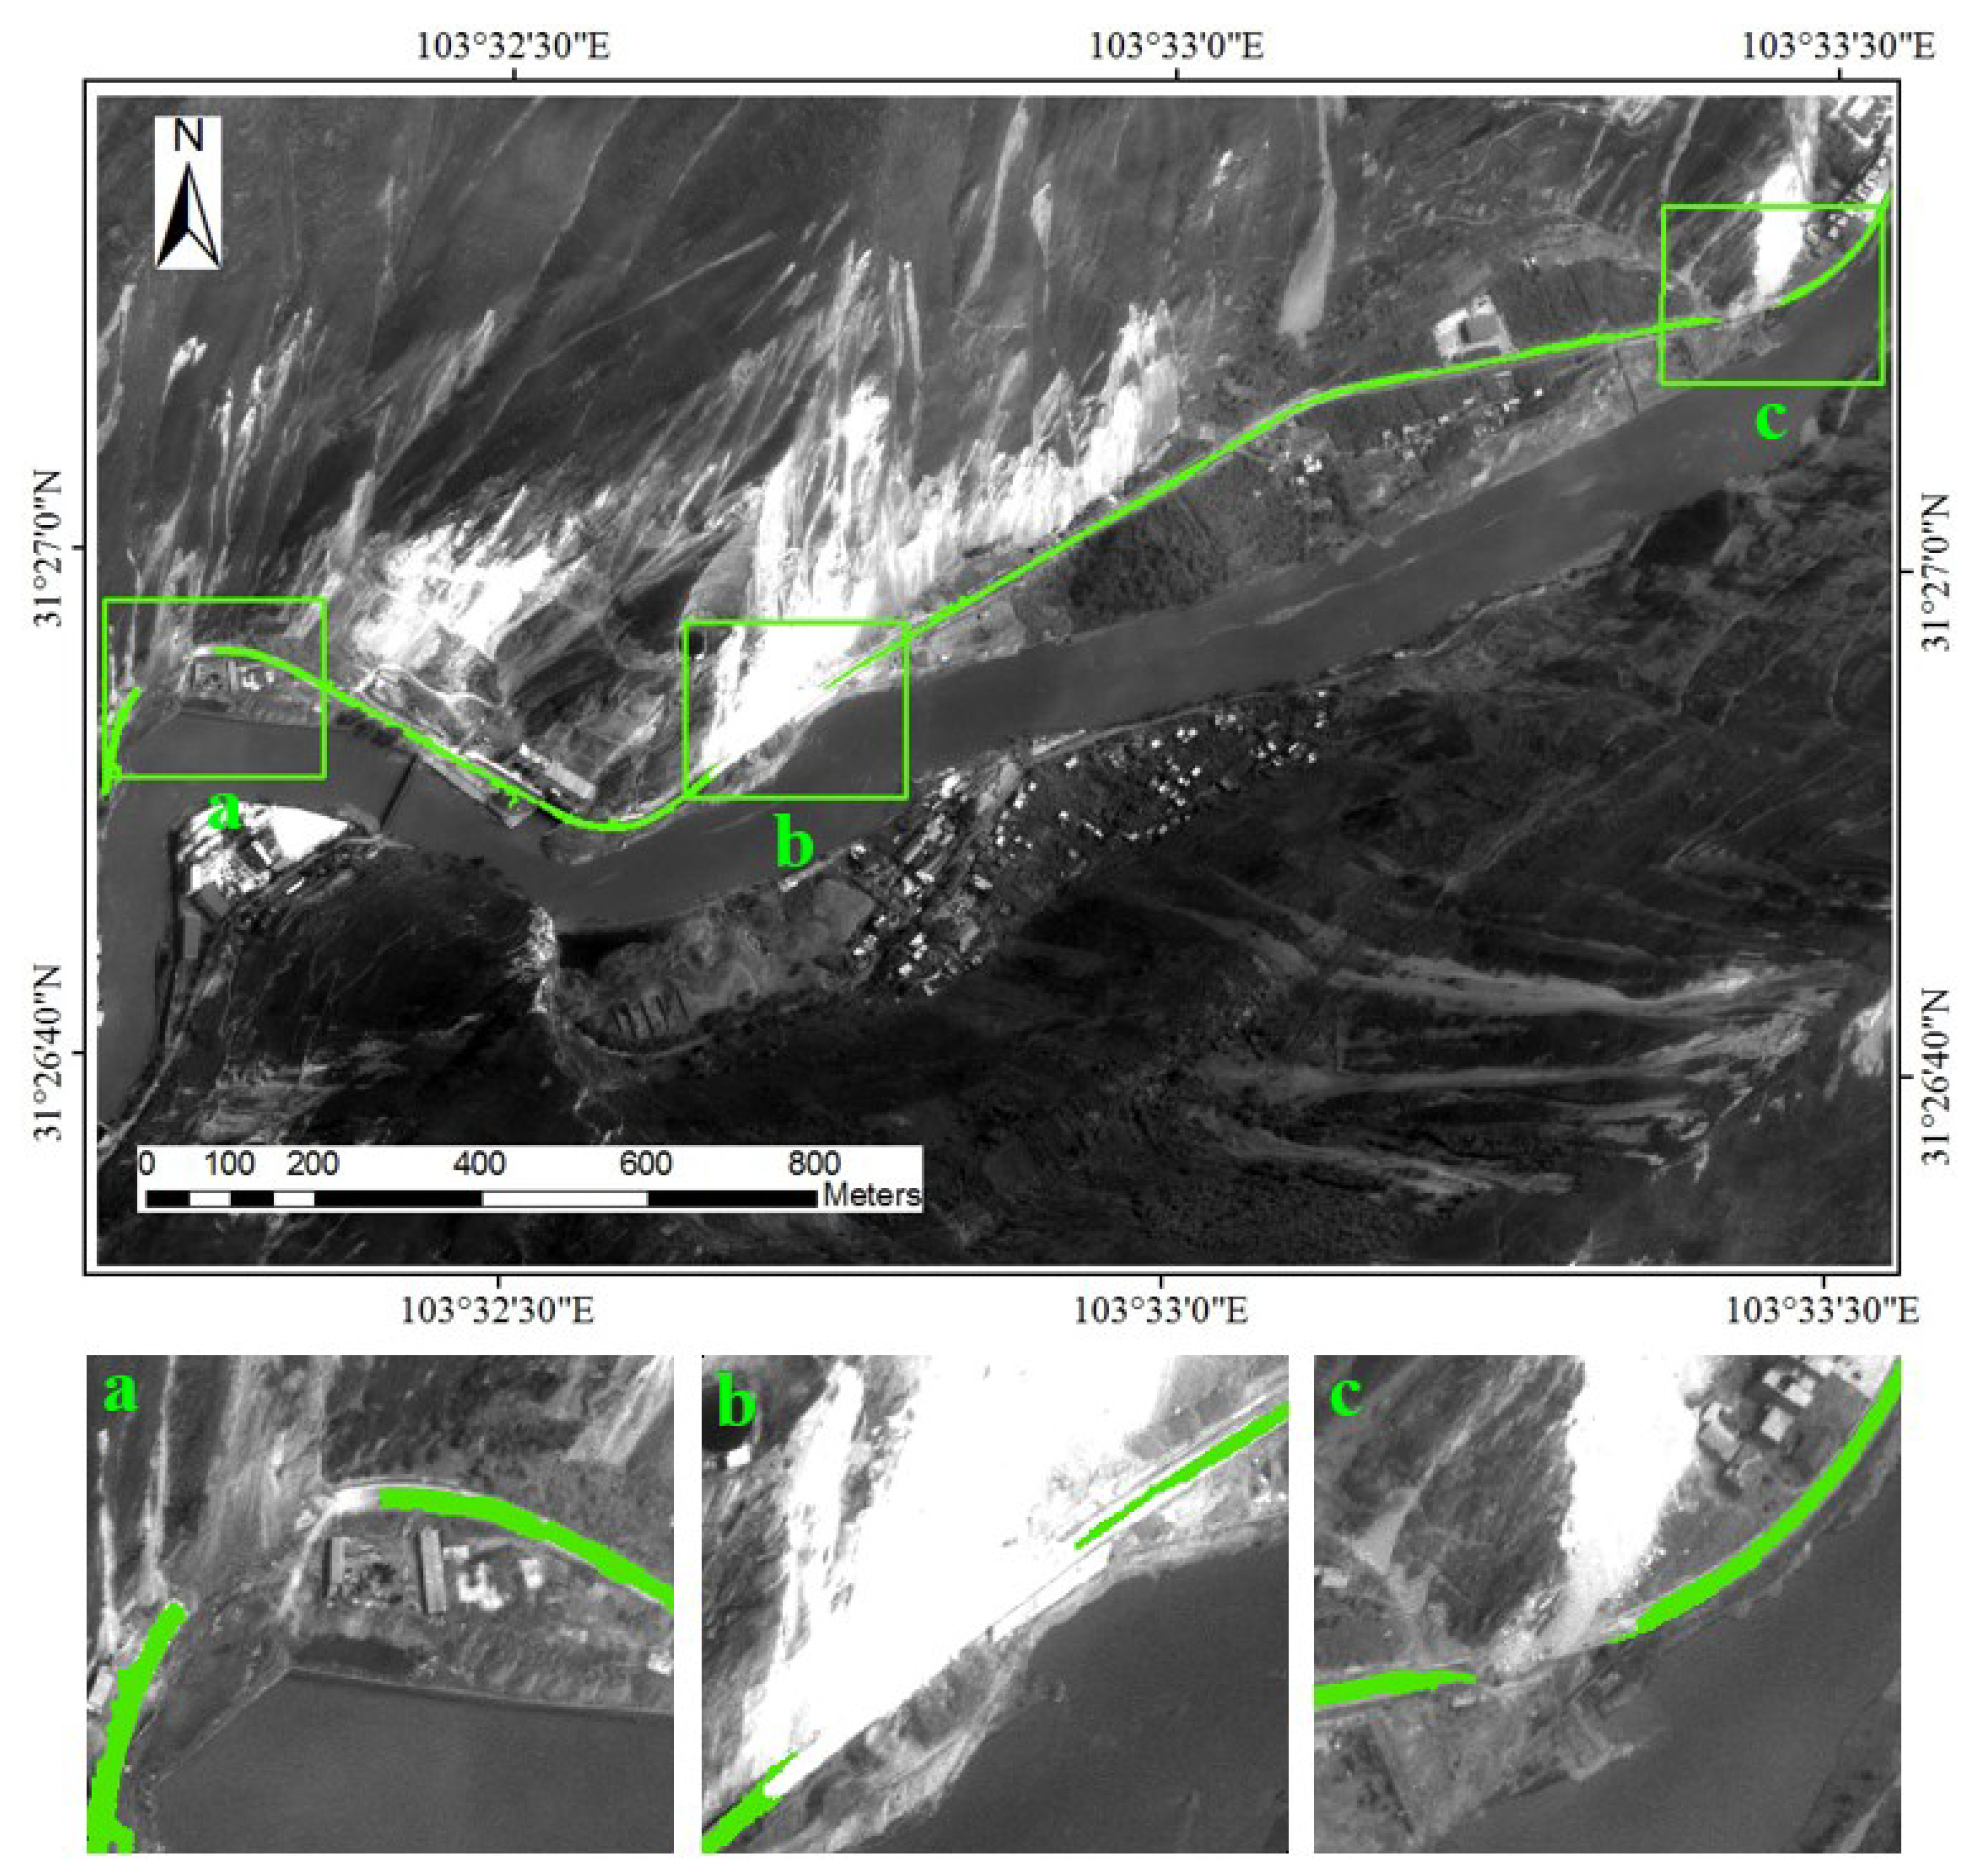
2.2. Post-Disaster Road Extraction Based on Knowledge


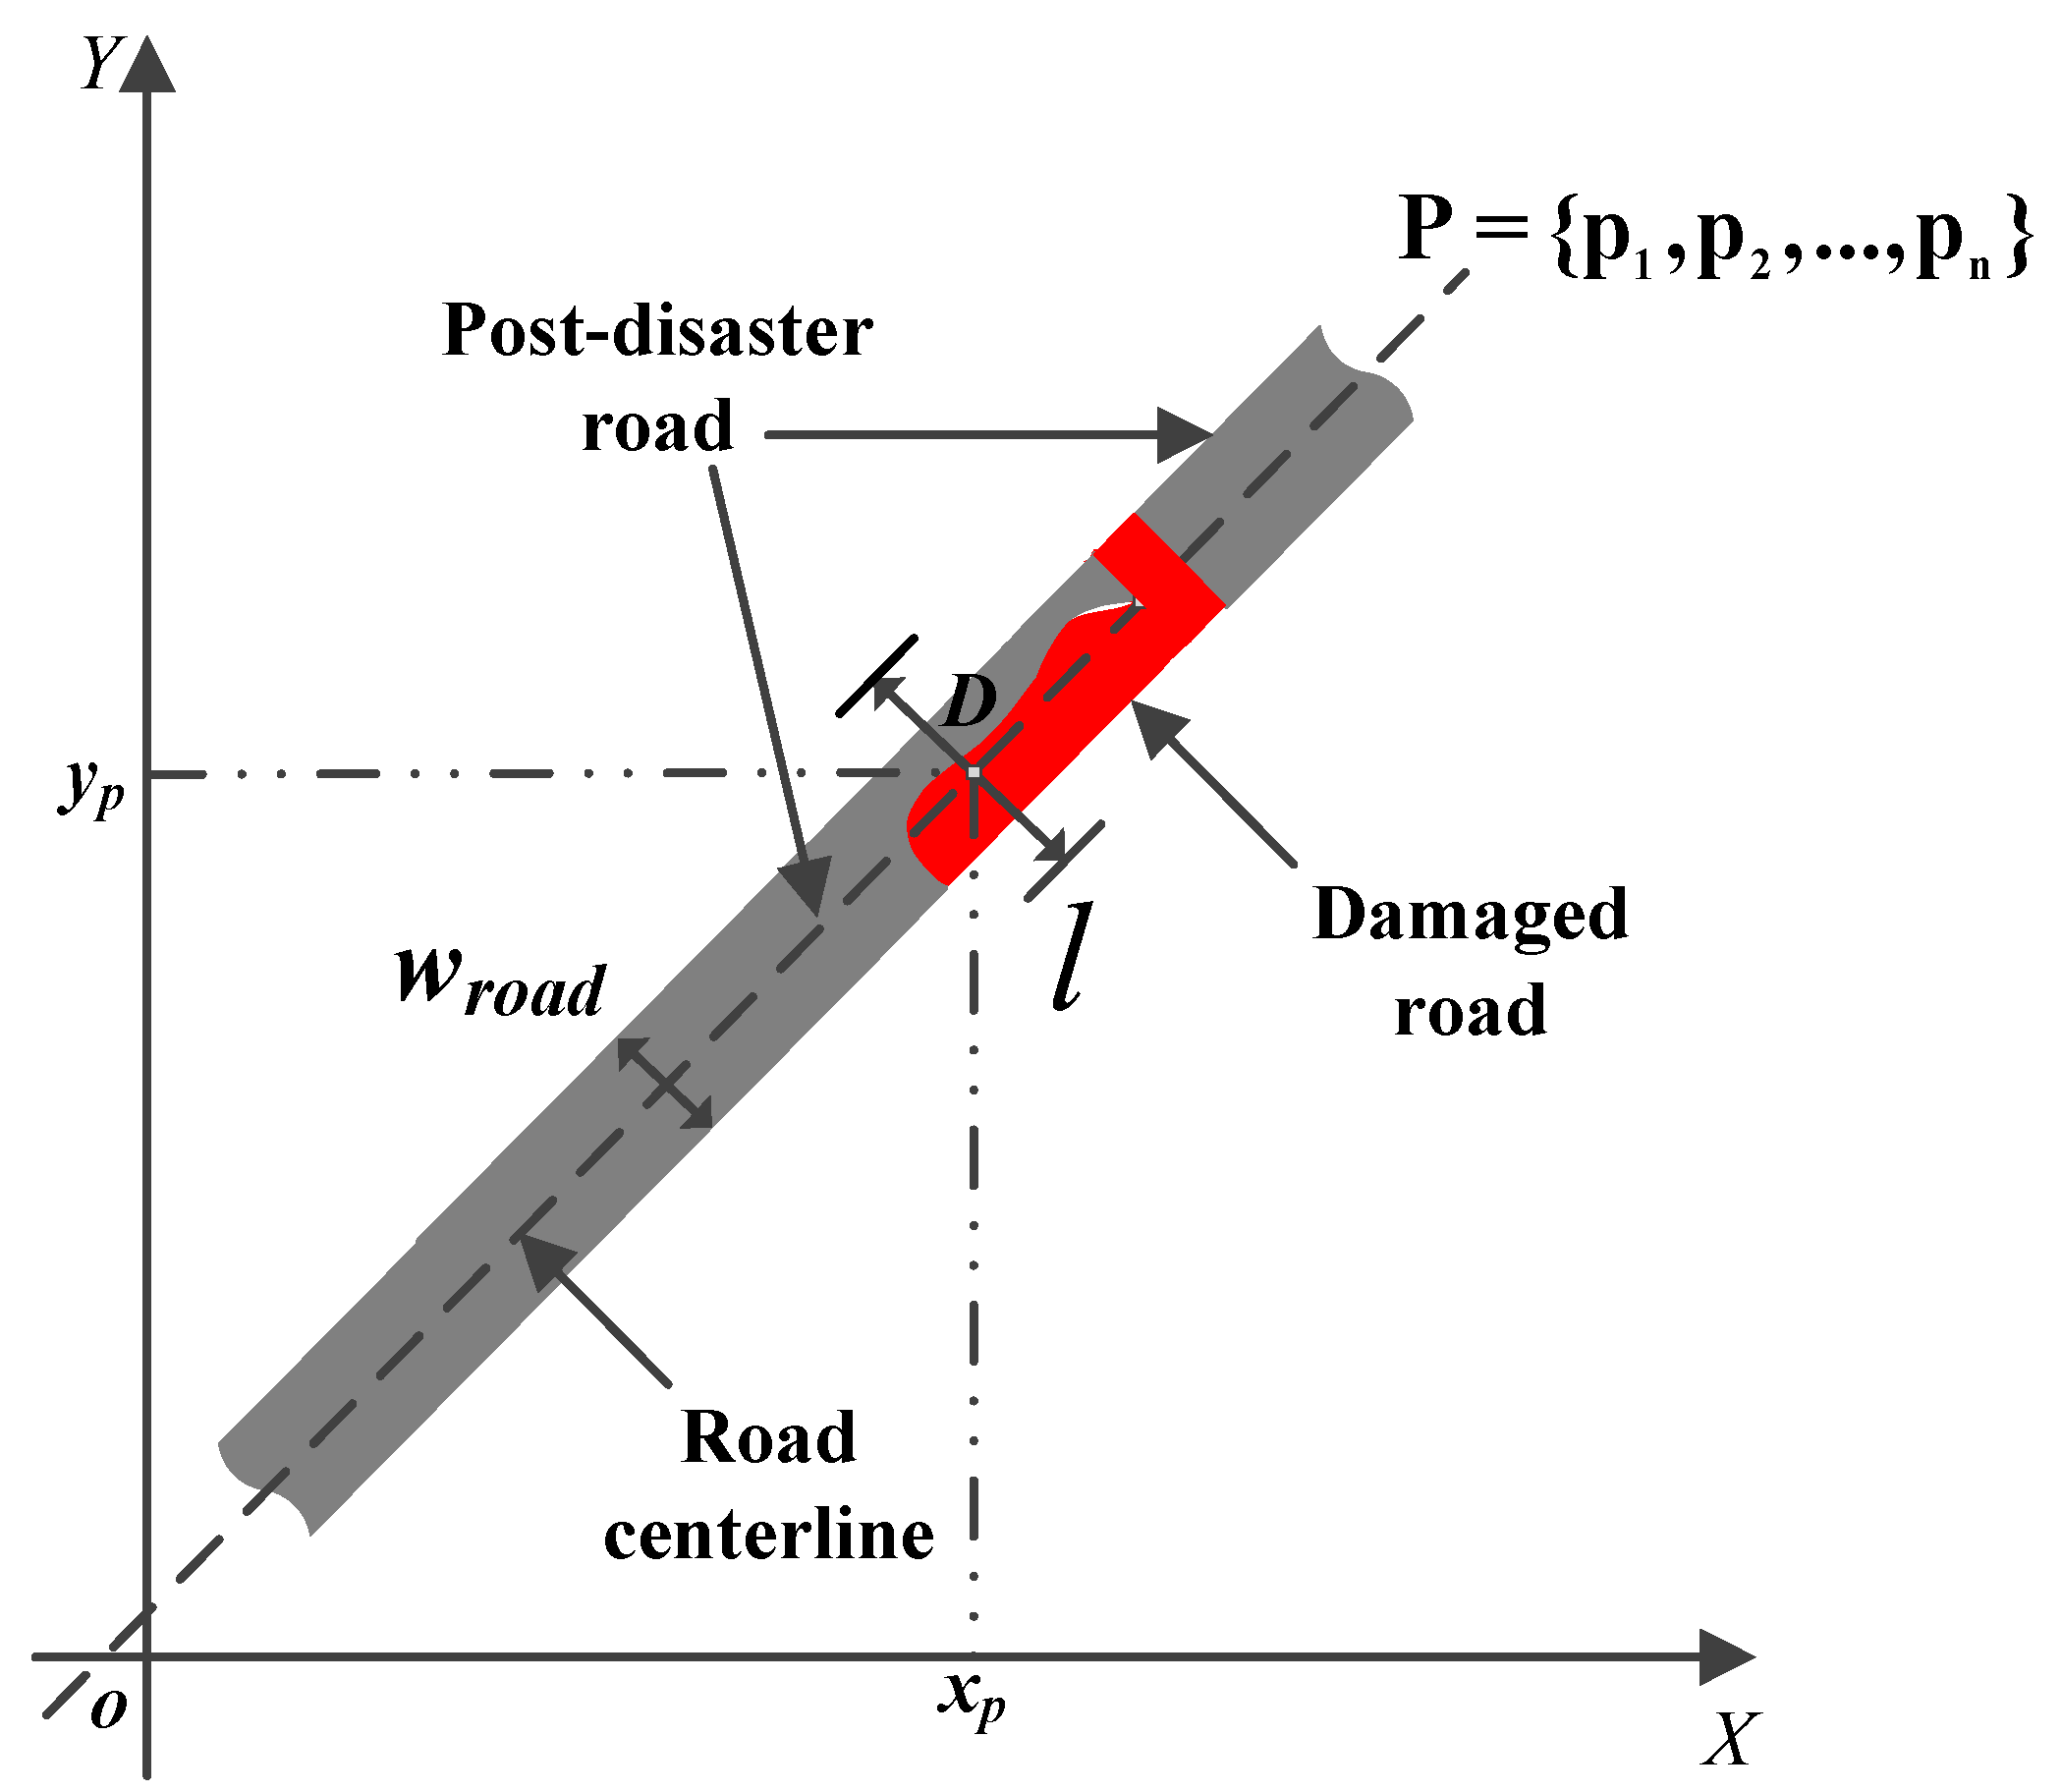
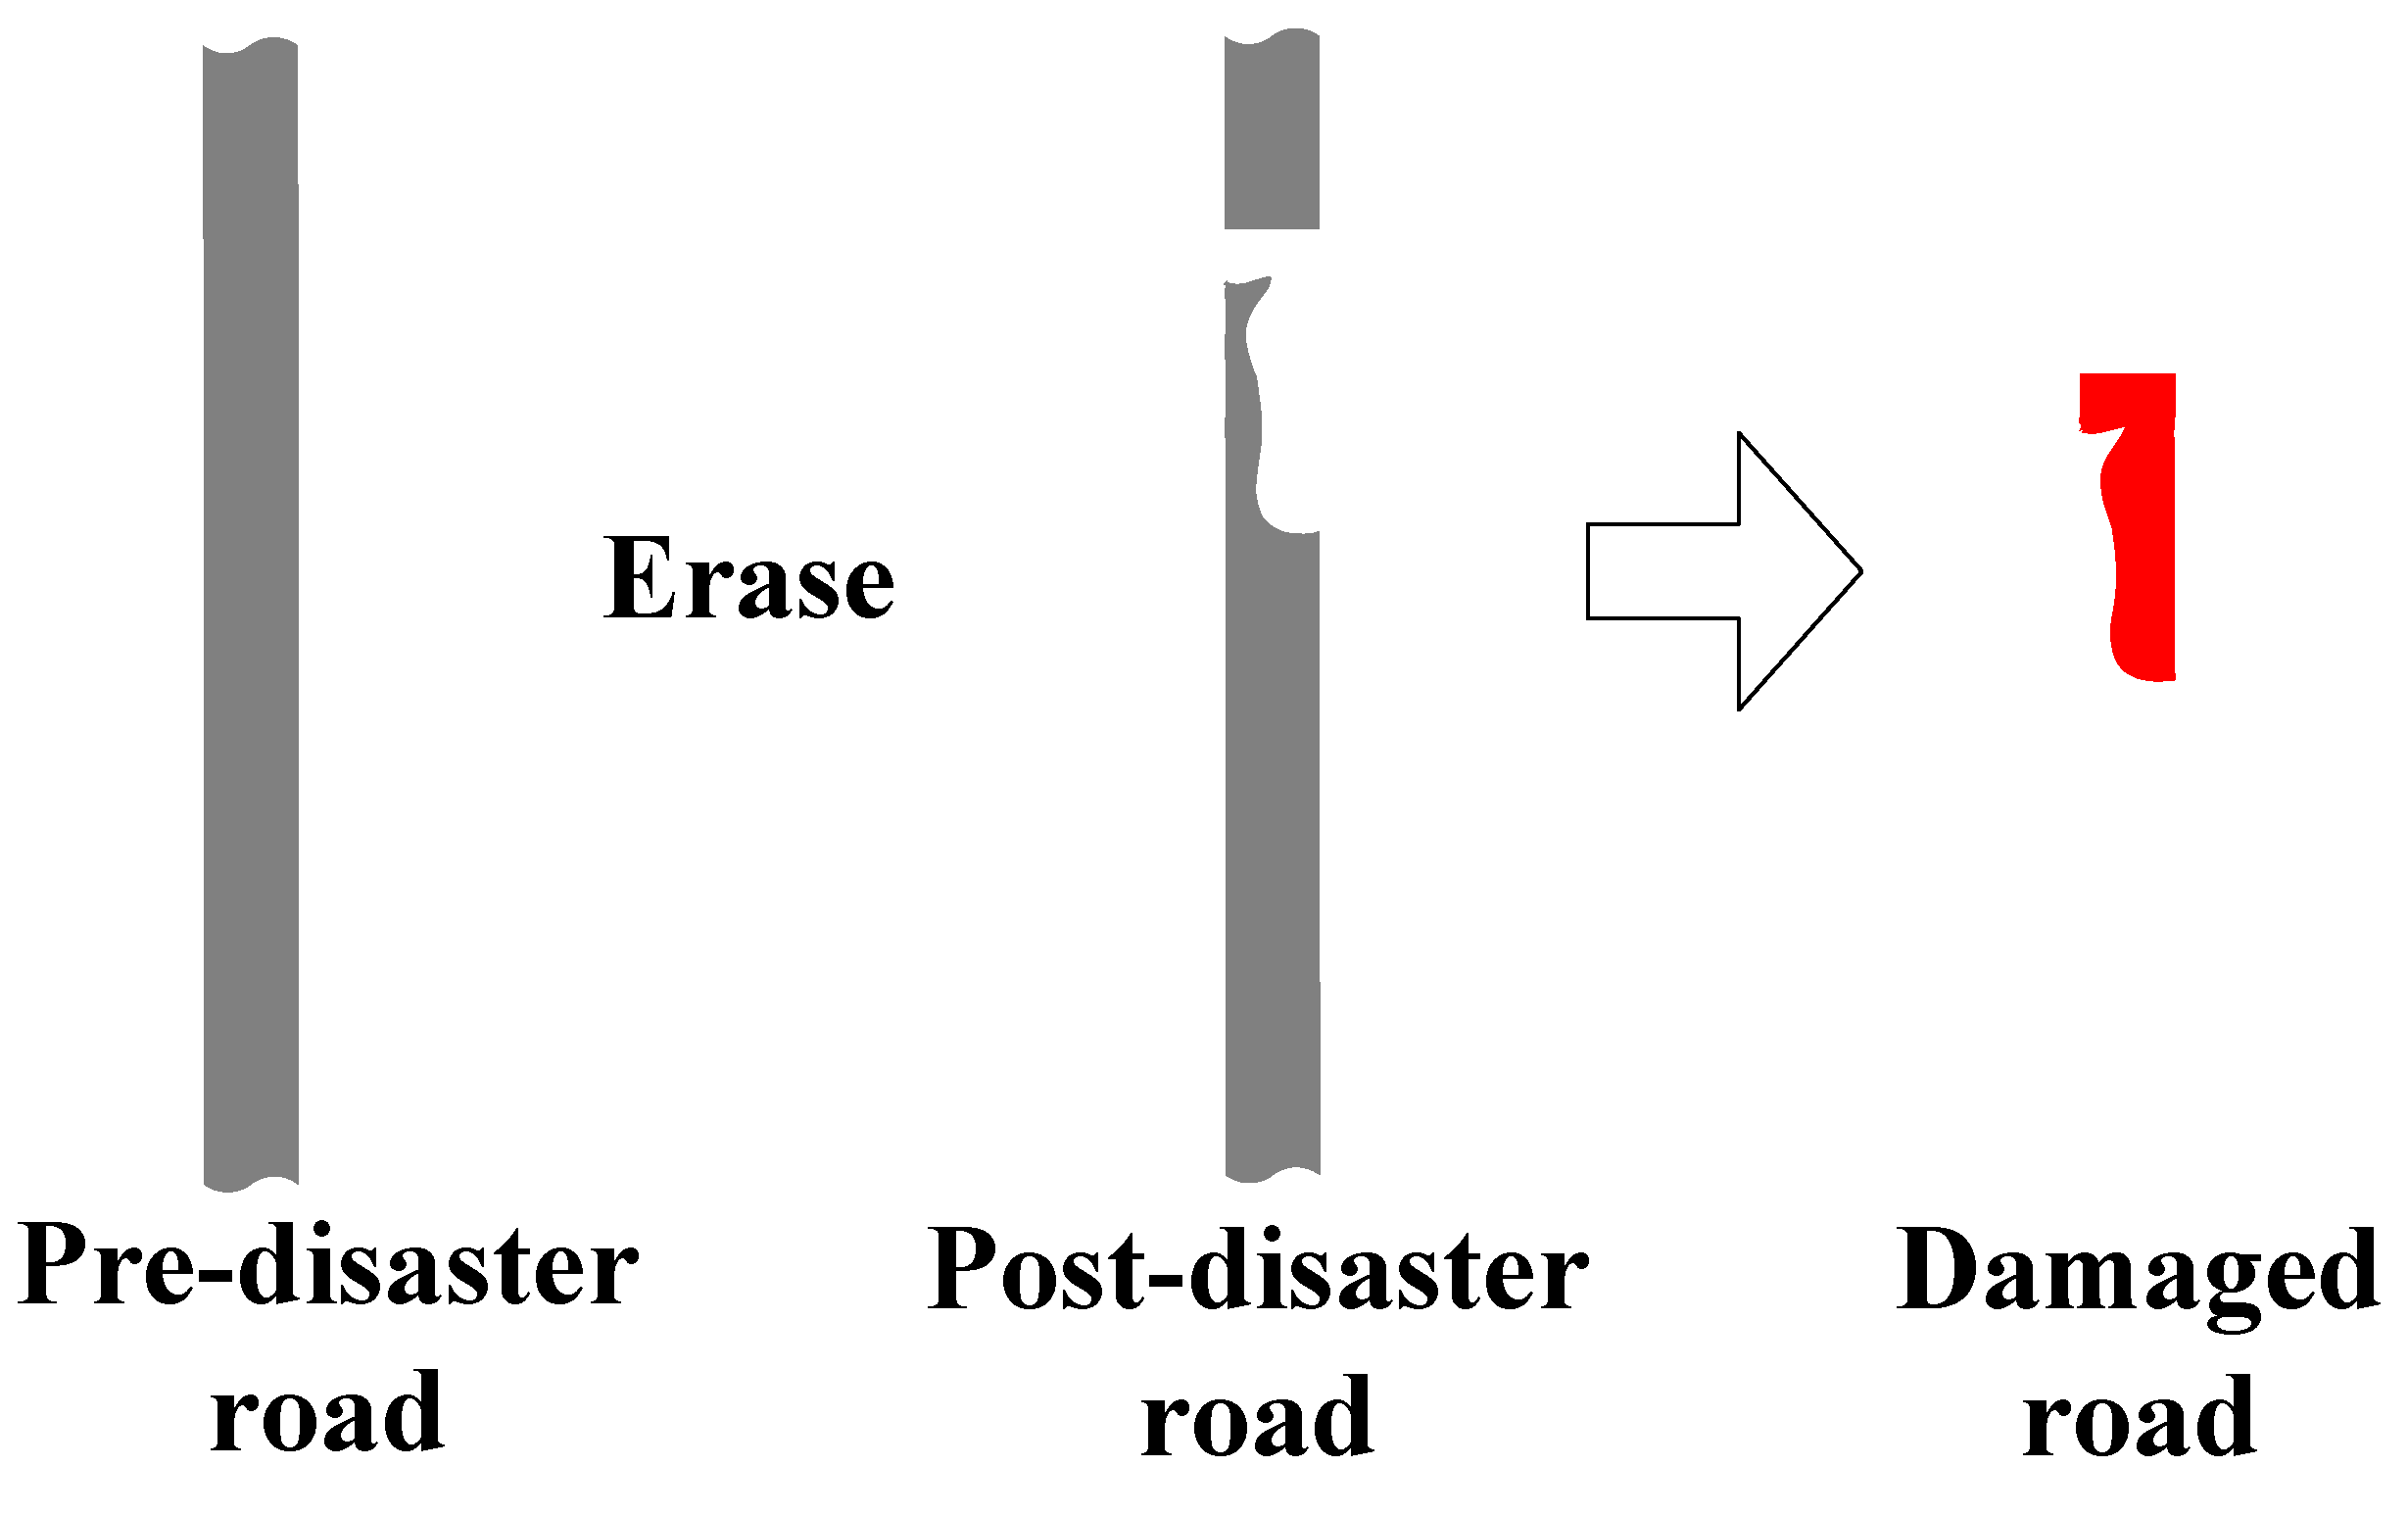
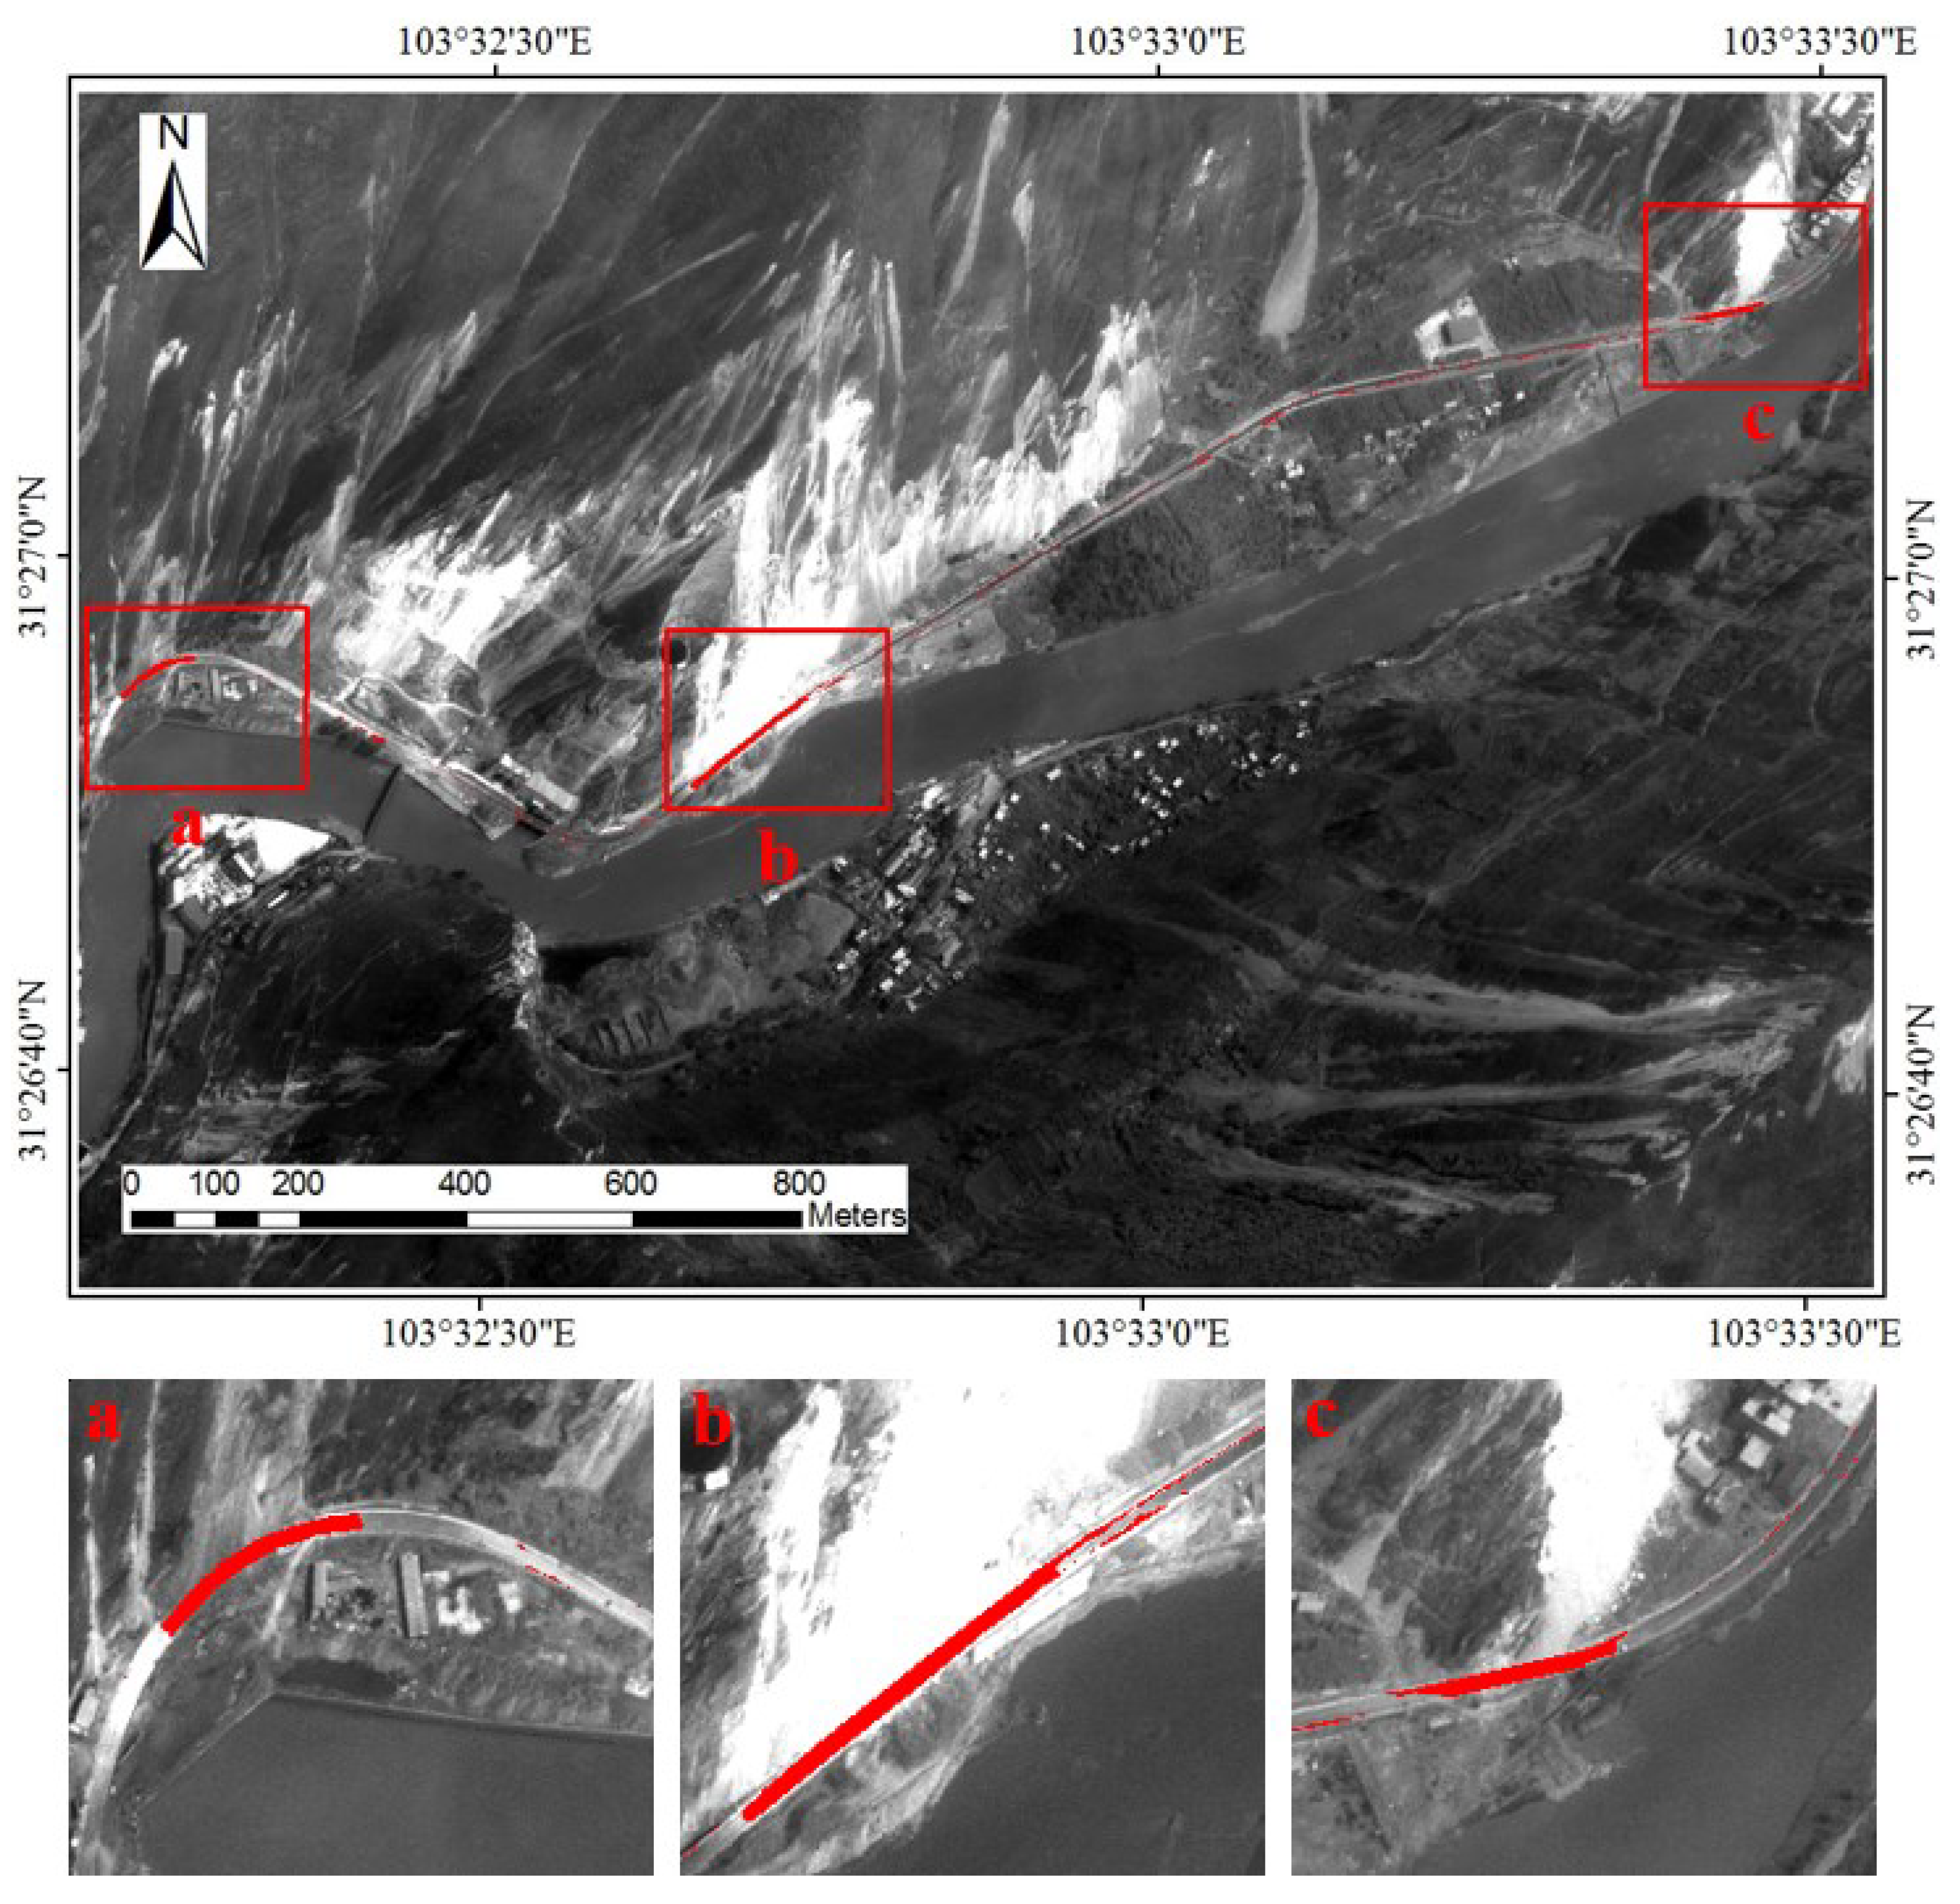
2.3. Road Damage Detection Using the Spatial Analysis

2.4. Building Indicators of Road Damage Assessment
2.5. Setting Standard for Road Damage Grade Classification

| Damage Grade | Damaged Ratio of Width: ρw (%) | Description |
|---|---|---|
| Basic | No significant changes in the pavement, and the safe passage of pedestrians and vehicles is unaffected. | |
| Minor | Pavement is partially buried by landslides or mudslides. A little operation is needed to restore to normal. | |
| Moderate | Localized moderate cracking. Reduced structural integrity of pavement. Repair is needed to continue to use it. | |
| Major | Failure of pavement structure. It cannot guarantee the safe passage of pedestrians and vehicles. It needs to be rebuilt. |
3. Study Area and Data
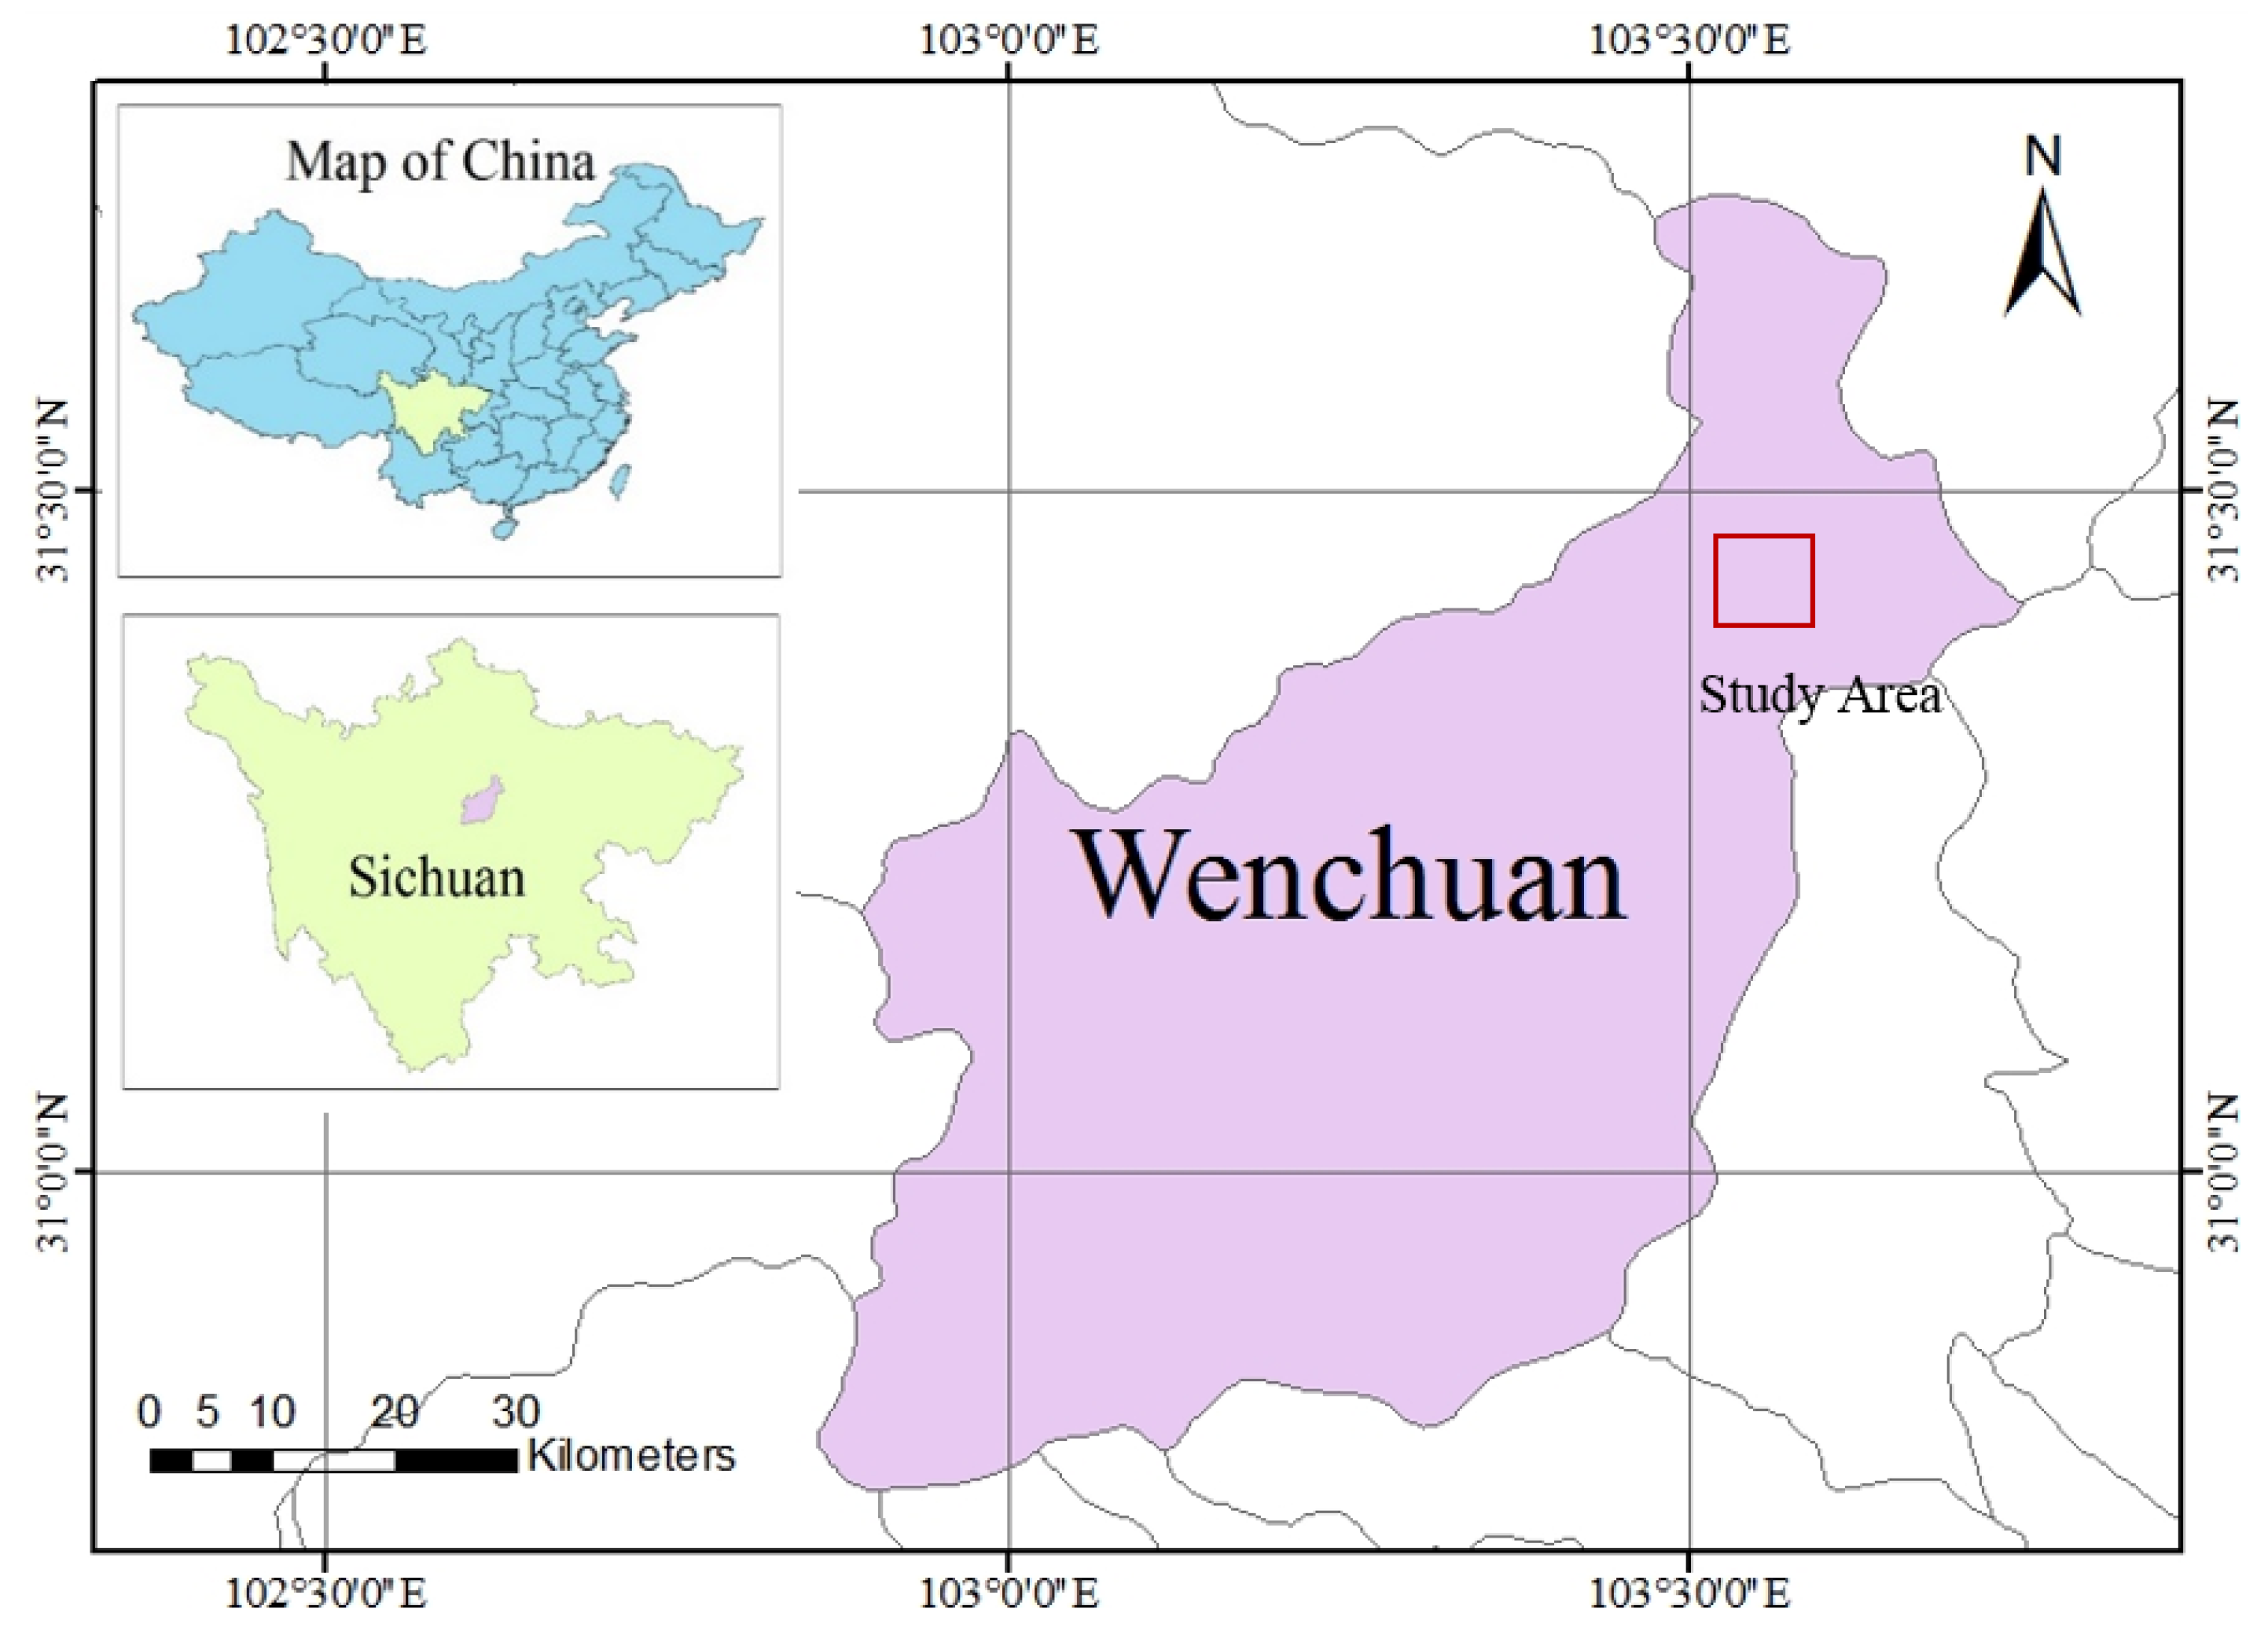
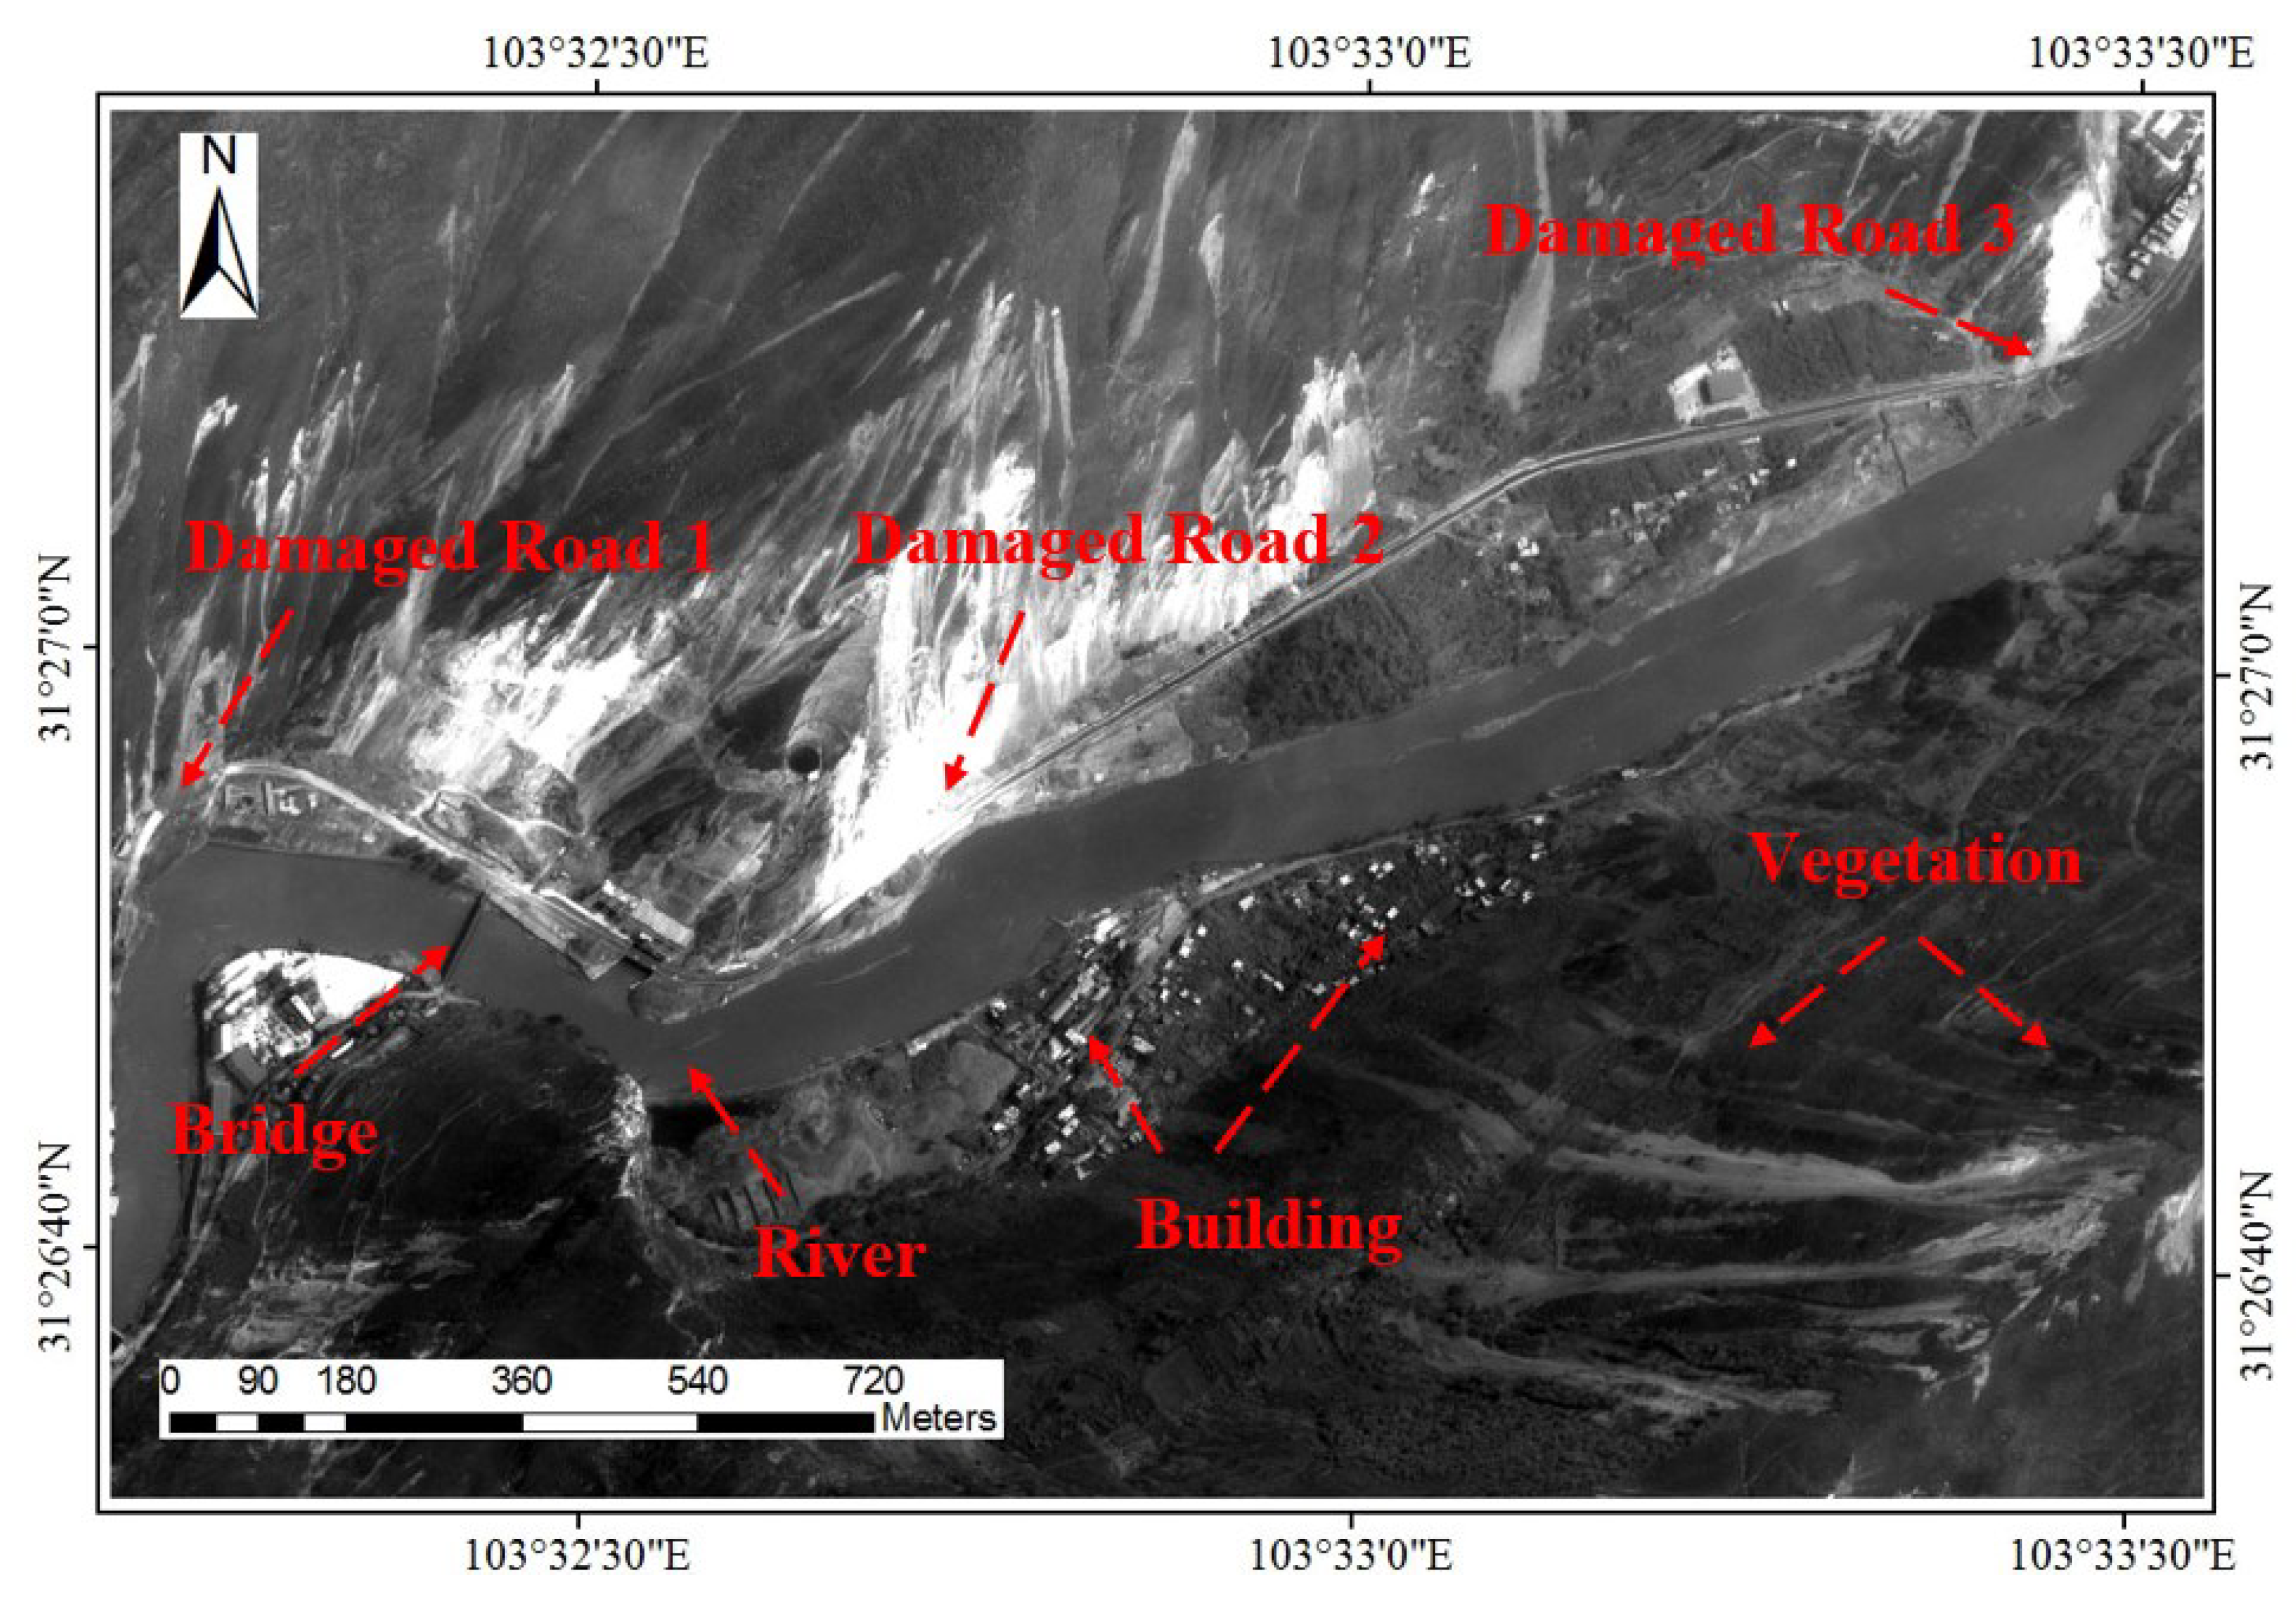
3.1. Study Area

3.2. Data Source

4. Results and Discussions
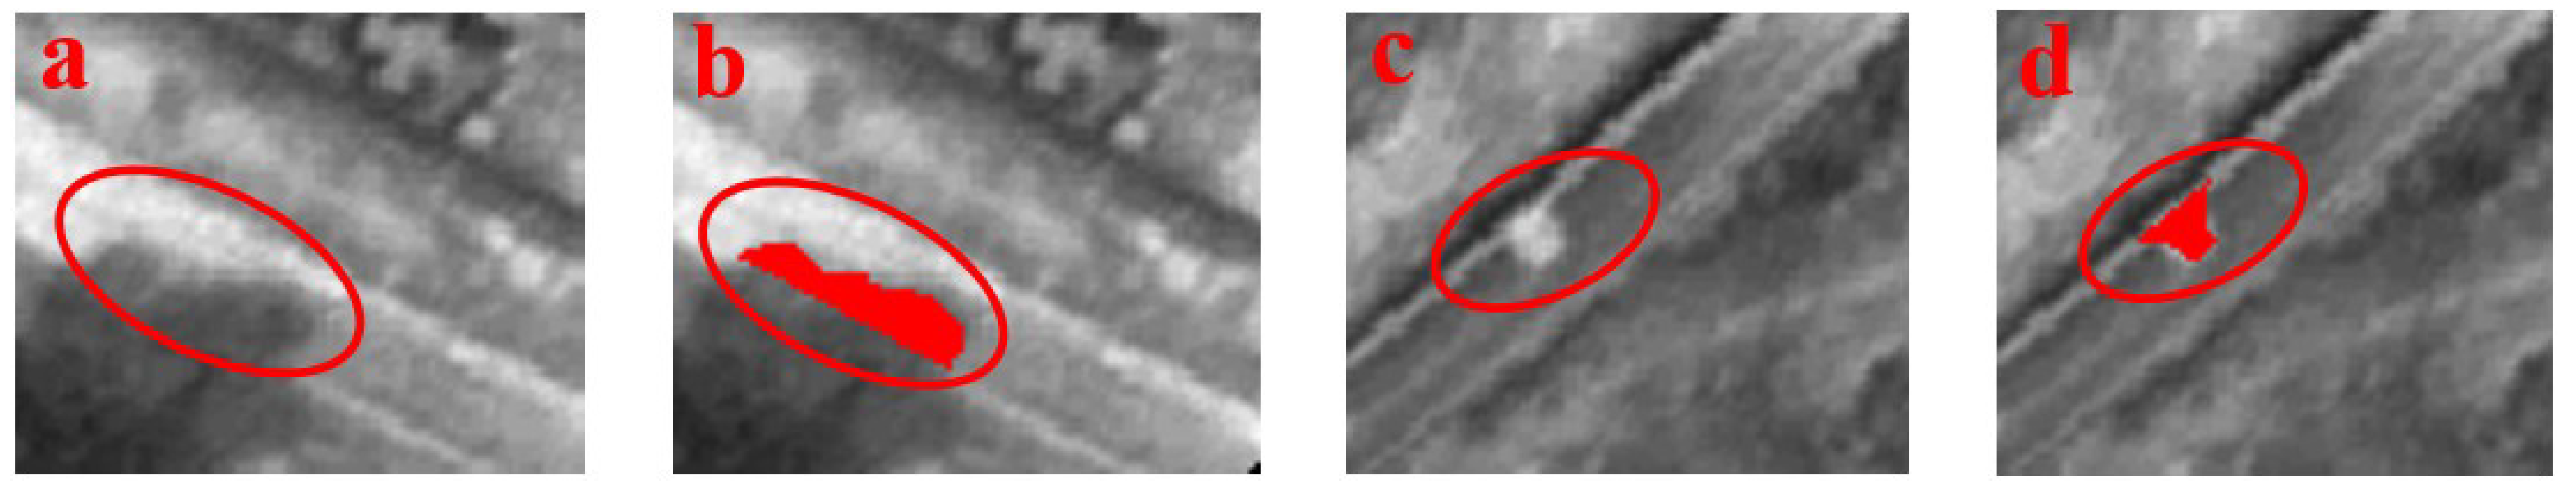
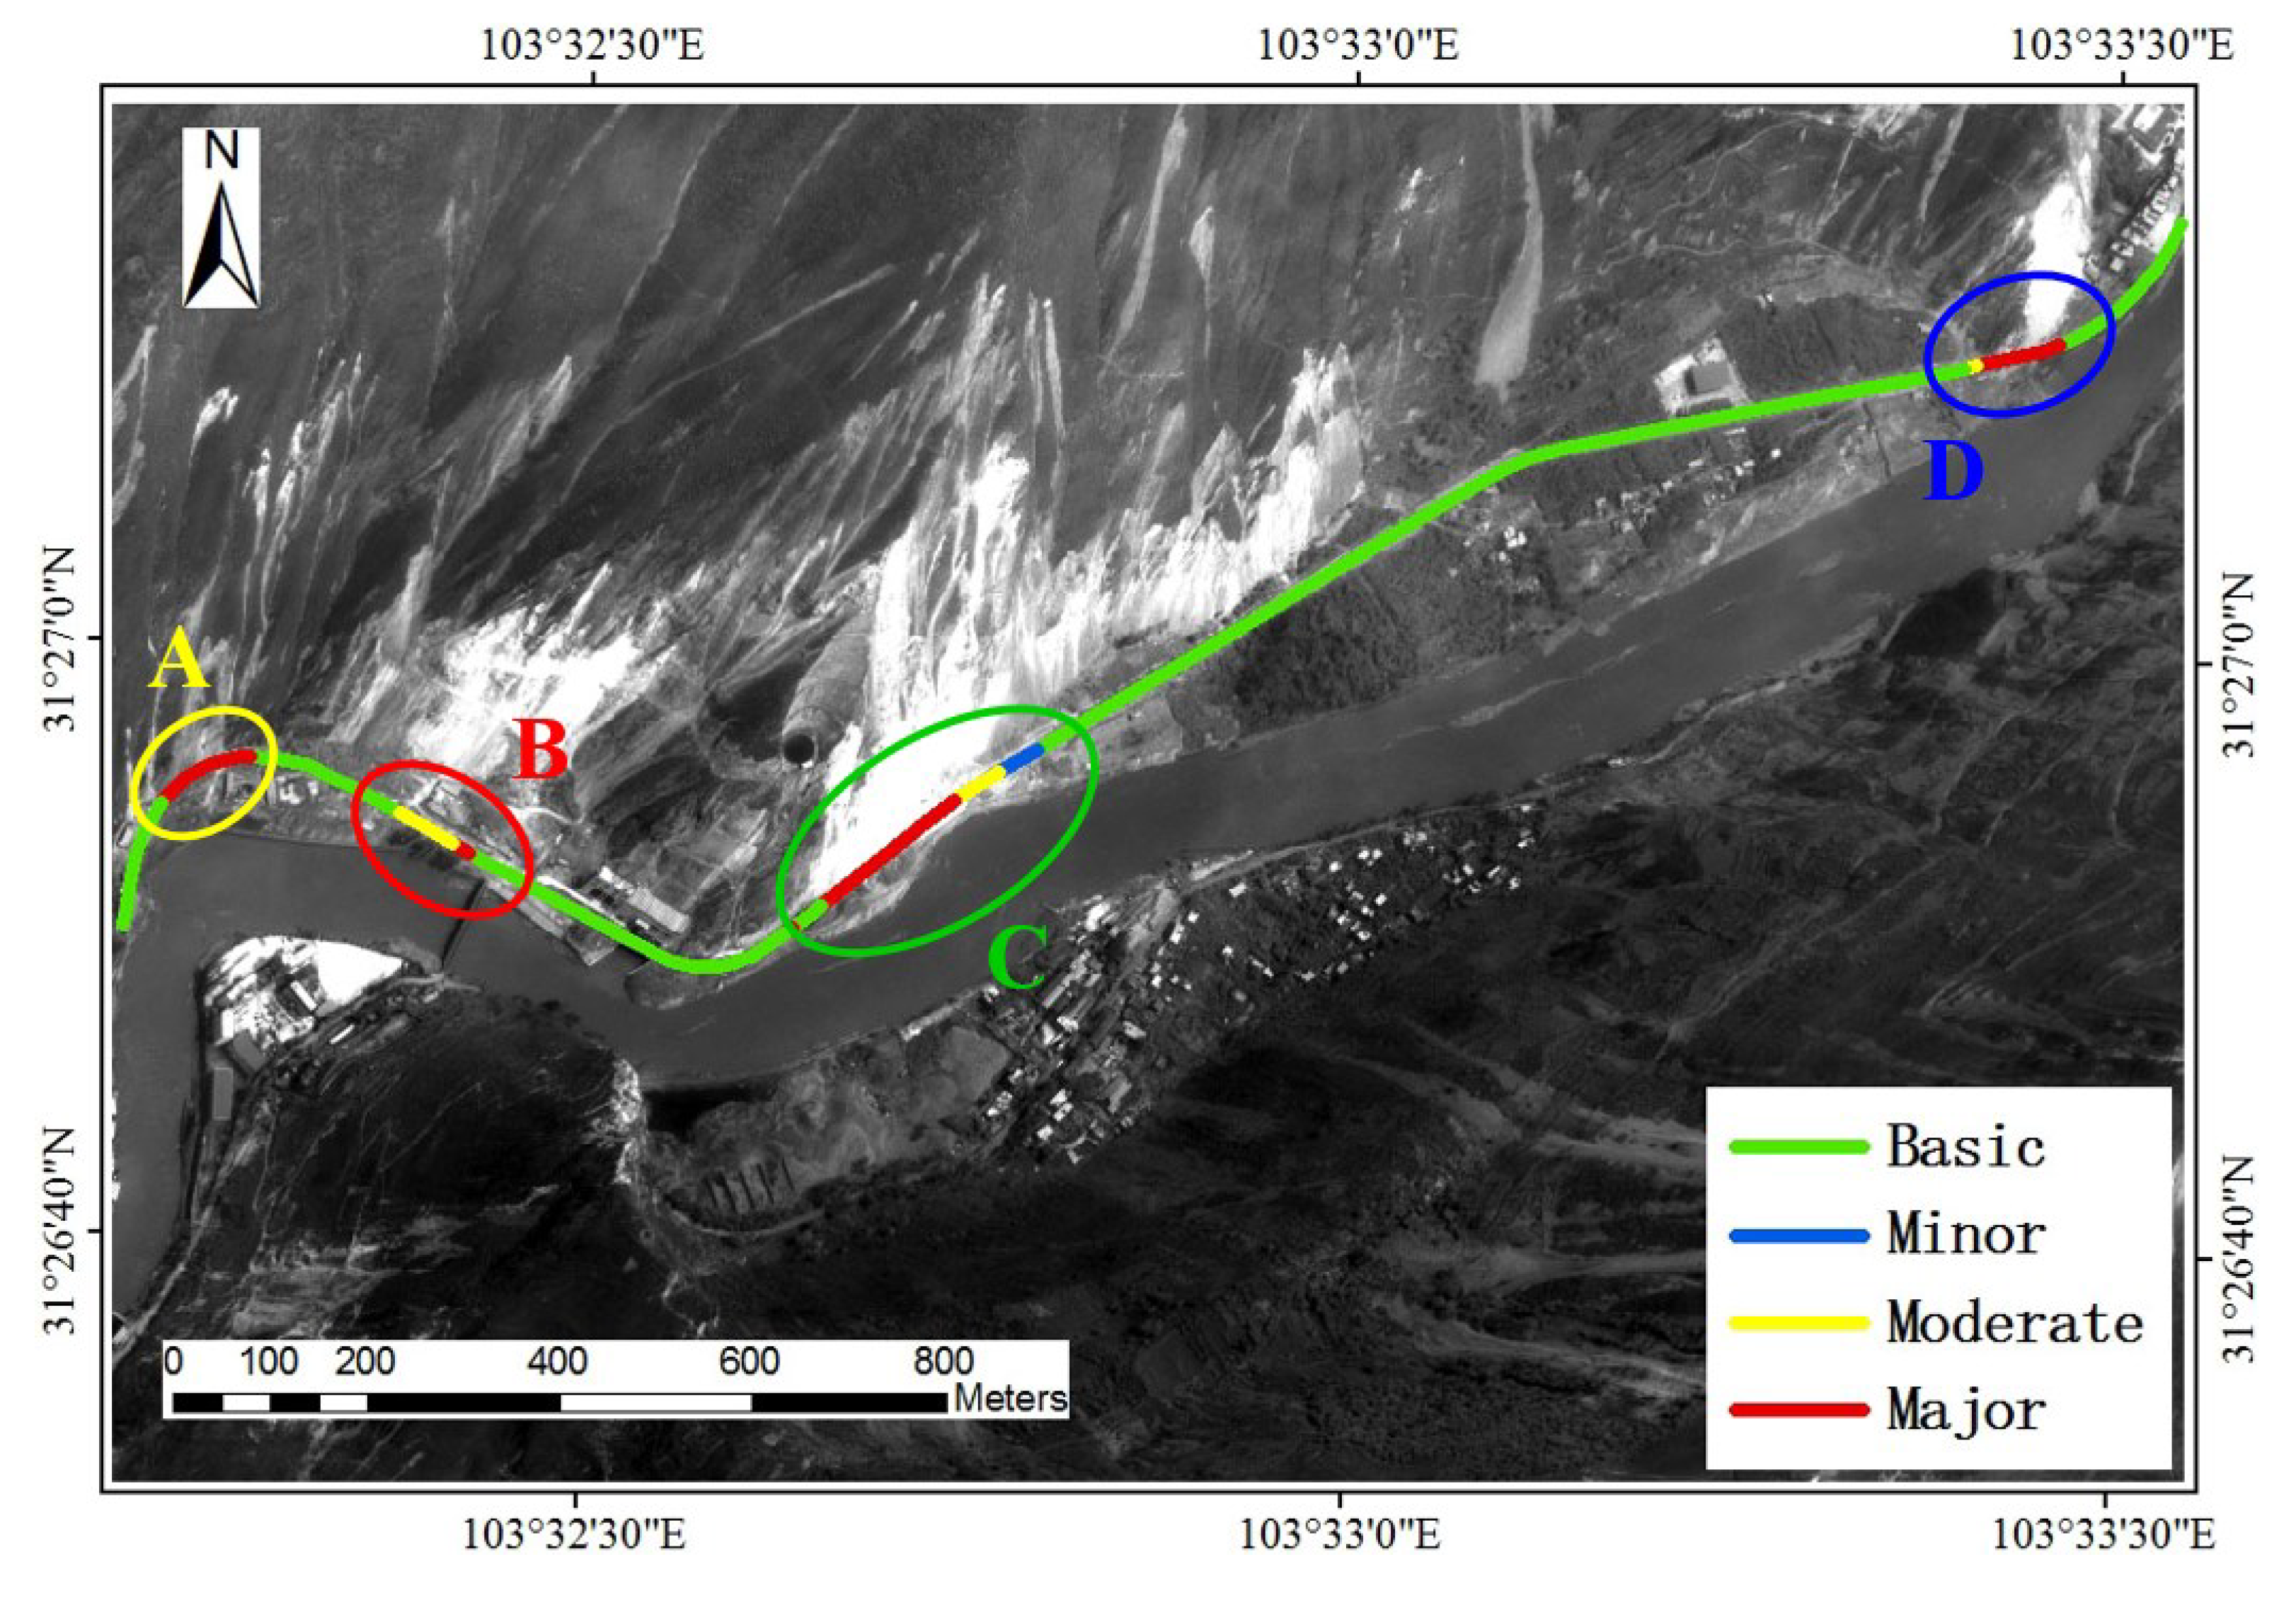
4.1. Road Damage Detection


4.2. Accuracy Evaluation
| Indicators | Real Damaged Road | Detected Damaged Road | Correctly Detected Road | PA (%) | UA (%) |
|---|---|---|---|---|---|
| Width | 8m | 7.5m | 7.5m | 93.75 | 100.00 |
| Length | 353m | 392m | 323m | 91.50 | 82.40 |
| Area | 2661 m2 | 2809 m2 | 2322 m2 | 87.26 | 82.66 |


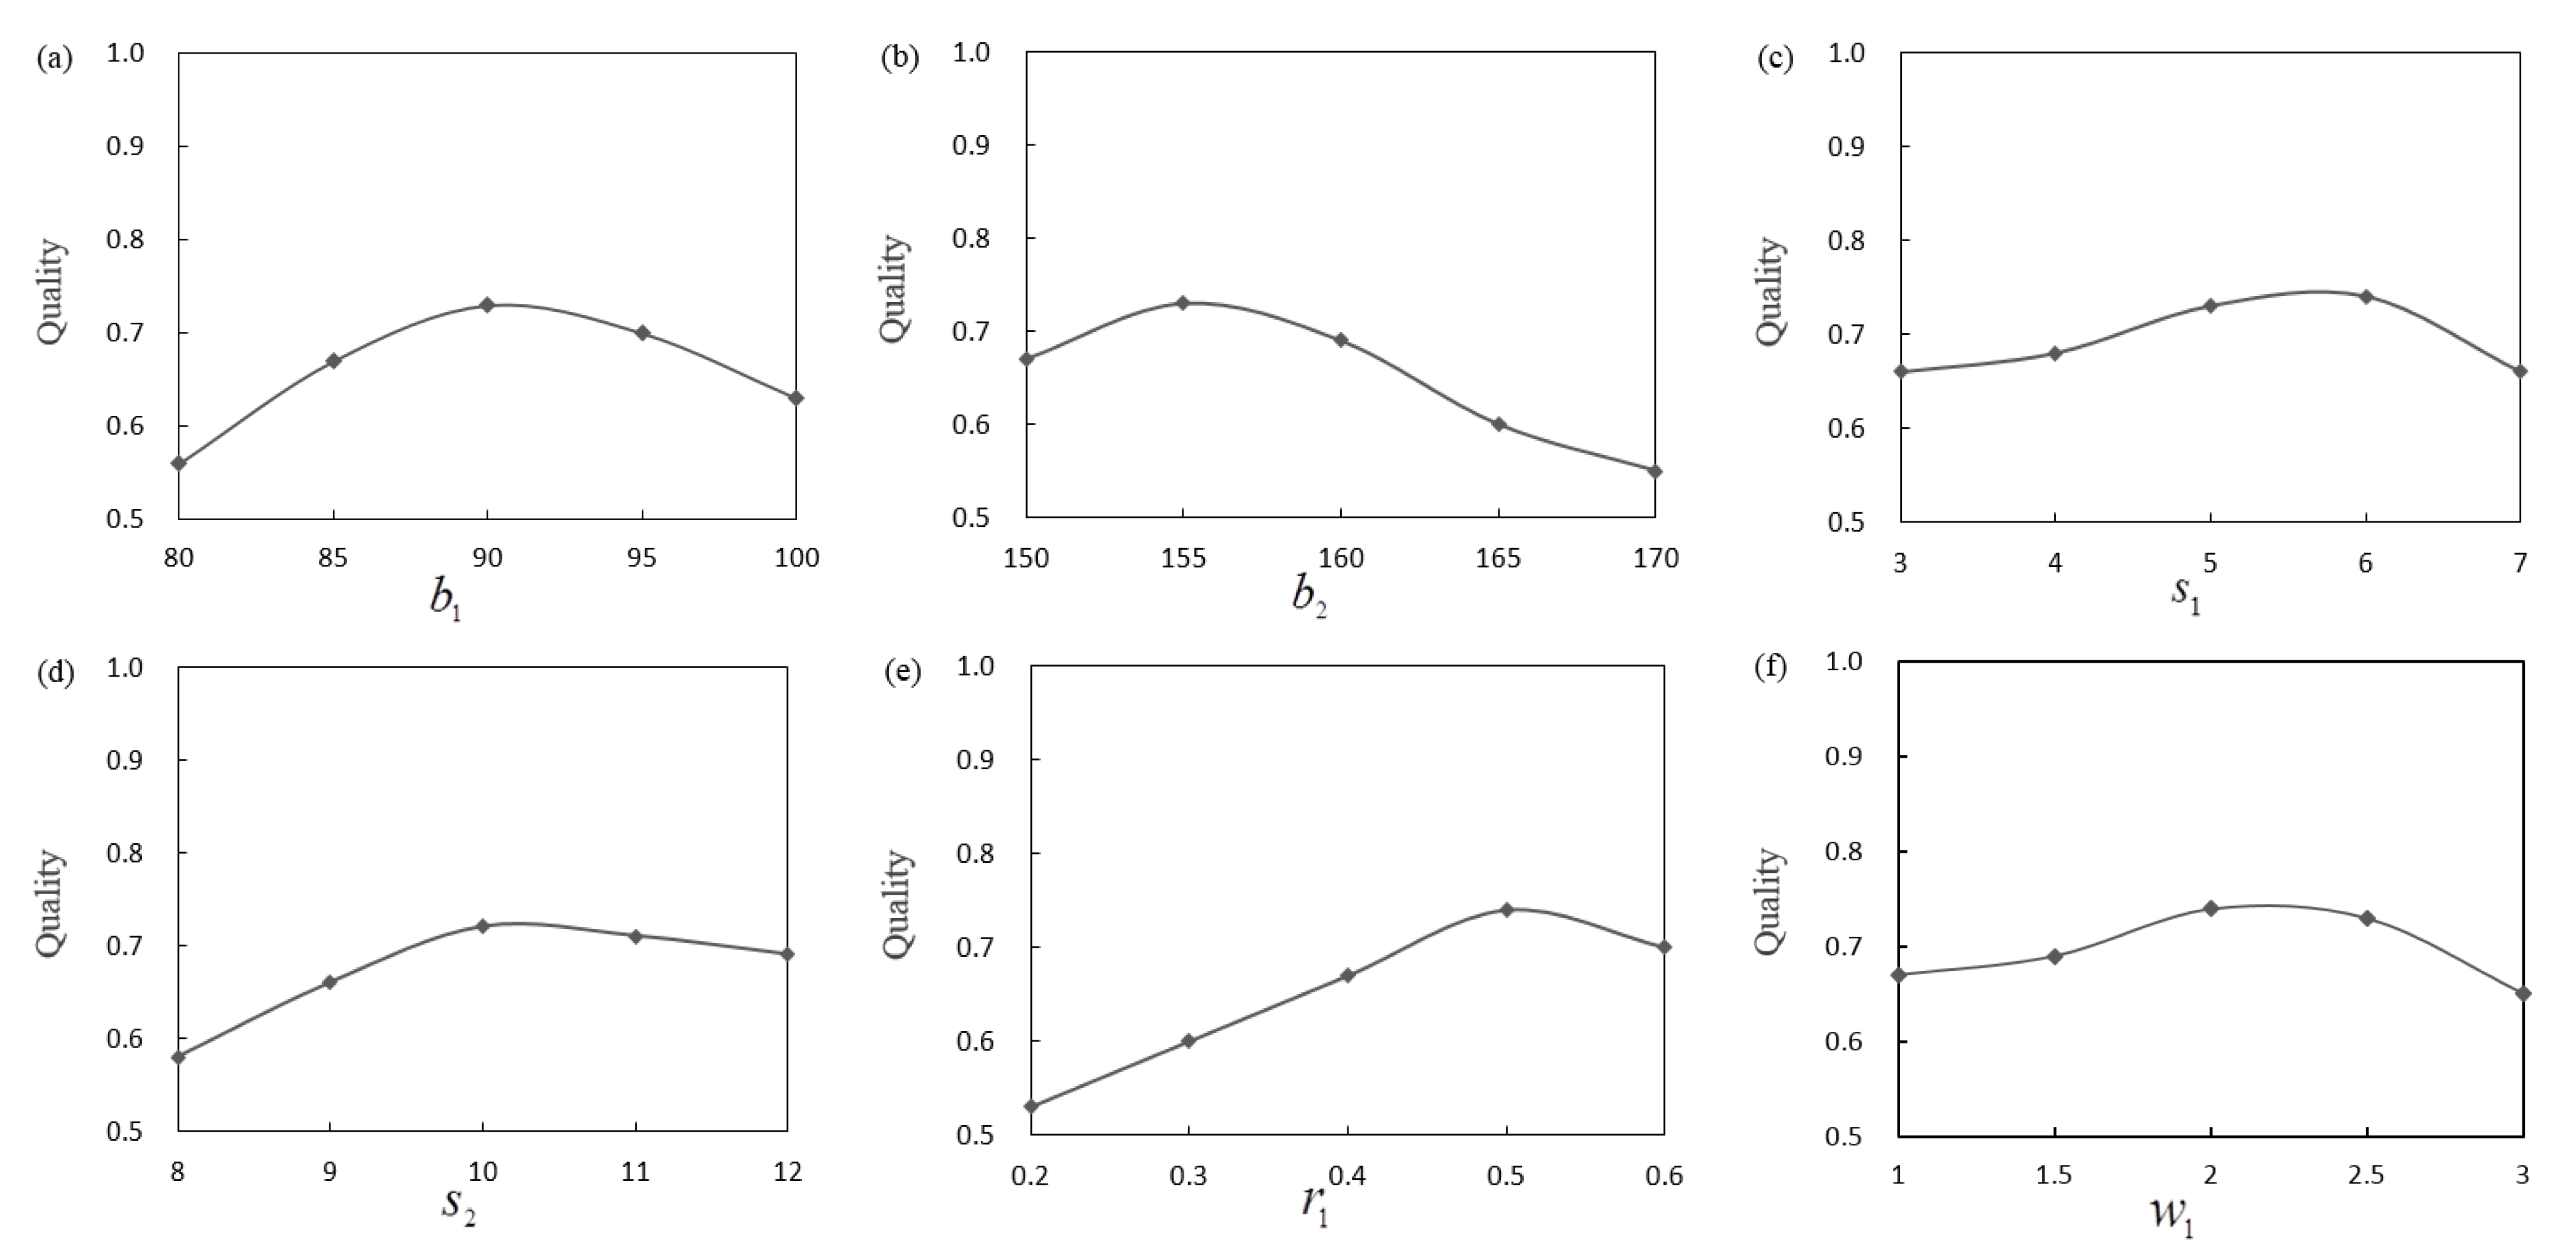
4.3. Parameter Selection and Sensitivity Analysis

4.4. Road Damage Assessment

5. Conclusions
Acknowledgments
Author Contributions
Conflicts of Interest
References
- Plank, S. Rapid damage assessment by means of multi-temporal SAR—A comprehensive review and outlook to sentinel-1. Remote Sens. 2014, 6, 4870–4906. [Google Scholar] [CrossRef]
- Lan, R.; Feng, B.; Wang, Z. Study on the fast assessment of traffic capacity of highway bridges after strong earthquakes. World Earthq. Eng. 2009, 25, 81–87. [Google Scholar]
- Li, P.; Xu, H.; Song, B. a novel method for urban road damage detection using very high resolution satellite imagery and road map. Photogramm. Eng. Remote Sens. 2011, 77, 1057–1066. [Google Scholar] [CrossRef]
- Pitilakis, K.; Alexoudi, M.; Argyroudis, S.; Monge, O.; Martin, C. Earthquake risk assessment of lifelines. Bull. Earthq. Eng. 2006, 4, 365–390. [Google Scholar] [CrossRef]
- Li, B. Discussion of the content and assessment criteria of post-disaster bridge in Wenchuan Earthquake. Southwest Highway 2008, 4, 50–56. [Google Scholar]
- Saito, K.; Spence, R.; Going, C.; Markus, M. Using high-resolution satellite images for post-earthquake building damage assessment: A study following the 26 January 2001 Gujarat Earthquake. Earthq. Spectra 2004, 20, 145–169. [Google Scholar] [CrossRef]
- Shinozuka, M.; Feng, Q.; Kim, H.; Ueda, T. Statistical Analysis of Fragility Curves; Multidisciplinary Center for Earthquake Engineering Research, University of New York: New York, NY, USA, 2001. [Google Scholar]
- Chesnel, A.L.; Binet, R.; Wald, L. Object oriented assessment of damage due to natural disaster using very high resolution images. In Proceedings of the IEEE International Conference on Geoscience and Remote Sensing Symposium, Barcelona, Spain, 23–28 July 2007; pp. 3736–3739.
- Qu, G.; Gao, Q.; Yang, H. Some urgent problems in natural disaster evaluation in China. Earth Sci. Front. 1996, 2, 212–218. [Google Scholar]
- Fan, Y.; Yang, S.; Wang, L. Study on urgent monitoring and assessment in Wenchuan Earthquake. J. Remote Sens. 2008, 12, 858–864. [Google Scholar]
- Zhou, G.; Lu, Y.; Fei, M.; Hu, K.; Qian, J. Research on primary evaluation of earthquake Disaster loss. J. Seismol. Res. 2010, 25, 208–215. [Google Scholar]
- Zhang, J.; Li, J.; Pan, B. Rapid assessment techniques for post-earthquake bridges in China. J. Highway Transp. Res. Dev. 2012, 29, 51–58. [Google Scholar]
- Department of Homeland Security Federal Emergency Management Agency. Hazus-MH Earthquake Model User Manual; Federal Emergency Management Agency: Washington, DC, USA, 2012.
- University of Kentucky. Post-earthquake Investigation Field Manual for the State of Kentucky; Kentucky Transportation Center: Lexington, KY, USA, 2006. [Google Scholar]
- University of Washington. Proposed Post-earthquake Bridge Inspection Procedures for New York State; New York State Department of Transportation: Washington, DC, USA, 2010. [Google Scholar]
- Purdue University. Field Guide for the Post-earthquake Safety Evaluation of Bridges and Roads; Indiana Department of Transportation: West Lafayette, IN, USA, 2000. [Google Scholar]
- Gao, H. Japan’s disaster early warning and assessment system. J. Chin. Acad. Soc. 2008, 3, 1–2. [Google Scholar]
- Highway Association of Japan. Brief Guide of Highway Earthquake Countermeasures (Post-Earthquake Emergency Treatment); Maruzen Co., Ltd.: Tokyo, Japan, 2006. [Google Scholar]
- Zhao, Y.; Wang, Y.; Liu, W.; Niu, Y.; Huang, M.; Zhao, Y. The earthquake disaster prediction and evaluation method of the highway system based on fuzzy comprehensive evaluation. World Earthq. Eng. 2010, 26, 139–144. [Google Scholar]
- Amelia, M.; Hannah, E.; Jody, M.; Ana, V. Evolution of coral rubble deposits on a reef platform as detected by remote sensing. Remote Sens. 2013, 5, 1–18. [Google Scholar]
- Wang, J.; Qin, Q.; Yang, X.; Wang, J.; Ye, X.; Qin, X. Automated road extraction from multi-resolution images spectral information and texture. In Proceedings of the IEEE International Conference on Geoscience and Remote Sensing Symposium, Québec, Canada, 13–18 July 2014; pp. 533–536.
- Kaur, A.; Singh, R. Various methods of road extraction from satellite images: A review. Int. J. Res. 2015, 2, 1025–1032. [Google Scholar]
- Li, Y.; Xu, L.; Piao, H. Semi-automatic road extraction from high-resolution remote sensing image: Review and prospects. In Proceedings of the 2009 IEEE Ninth International Conference on Hybrid Intelligent Systems, Shenyang, China, 12–14 August 2009; volume 1, pp. 204–209.
- Callier, S.; Saito, H. Automatic road area extraction from printed maps based on linear feature detection. IEICE Trans. Inf. Syst. 2012, 95, 1758–1765. [Google Scholar] [CrossRef]
- Anil, P.; Natarajan, S. Automatic road extraction from high resolution imagery based on statistical region merging and skeletonization. Int. J. Eng. Sci. Technol. 2010, 2, 165–171. [Google Scholar]
- Mokhtarzade, M.; Zoej, M. Road detection from high-resolution satellite images using artificial neural networks. Int. J. Appl. Earth Obs. Geoinf. 2007, 9, 32–40. [Google Scholar] [CrossRef]
- Trinder, J.; Wang, Y. Knowledge-based road interpretation in aerial images. Int. Arch. Photogramm. Remote Sens. 1998, 32, 635–640. [Google Scholar]
- Senthilnath, J.; Rajeshwari, M.; Omkar, S. Automatic road extraction using high resolution satellite image based on texture progressive analysis and normalized cut method. J. Indian Soc. Remote Sens. 2009, 37, 351–361. [Google Scholar] [CrossRef]
- Singh, P; Garg, R. Automatic road extraction from high resolution satellite image using adaptive global thresholding and morphological operations. Indian Soc. Remote Sens. 2013, 3, 631–640. [Google Scholar]
- Teng, X.; Song, S.; Zhan, Y. A novel road extraction algorithm for high resolution remote sensing images. Appl. Math. Inf. Sci. 2014, 8, 1435–1443. [Google Scholar] [CrossRef]
- Gong, L.; An, L.; Liu, M.; Zhang, J. Road damage detection from high-resolution RS image. In Proceedings of the IEEE International Conference on Geoscience and Remote Sensing Symposium, Munich, Germany, 22–27 July 2012; pp. 990–993.
- Ma, H. Research on Road Damage Detection from High Resolution Remotely Sensed Images for Disaster Evaluation. Ph.D. Theses, Peking University, Beijing, China, 13 June 2009. [Google Scholar]
- Qin, Q.; Ma, H.; Li, J. Damage detection and assessment system of roads for decision support for disaster. Key Eng. Mater. 2011, 467–469, 1144–1149. [Google Scholar] [CrossRef]
- Earthquake Destruction Assessment of Urban Roads Network Using Satellite Imagery and Fuzzy Inference Systems. Available online: http://www.isprs.org/proceedings/XXXVII/congress/8_pdf/2_WG-VIII-2/47.pdf (accessed on 22 April 2015).
- Wang, Y.; Wang, Y.; da, Y.; Liu, X.; Li, J.; Huang, J. An object-oriented method for road damage detection from high resolution remote sensing images. In proceedings of the 19th International Conference on GeoInformatics, Shanghai, China, 24–26 June 2011; pp. 1–5.
- Haghighattalab, A.; Mohammadzadeh, A.; Valadan Zoej, M.; Taleai, M. Post-earthquake road damage assessment using region-based algorithms from high-resolution satellite images. Proc. SPIE 2010, 7830. [Google Scholar] [CrossRef]
- Shi, W.; Miao, Z.; Debayle, J. An integrated method for urban main road centerline extraction from optical remotely sensed imagery. IEEE Trans. Geosci. Remote Sens. 2014, 52, 3359–3372. [Google Scholar] [CrossRef]
- Miao, Z.; Shi, W.; Zhang, H. Road centerline extraction from high-resolution imagery based on shape features and multivariate adaptive regression splines. IEEE Geosci. Remote Sens. Lett. 2013, 10, 583–587. [Google Scholar] [CrossRef]
- Miao, Z.; Wang, B.; Shi, W. A semi-automatic method for road centerline extraction from VHR images. IEEE Geosci. Remote Sens. Lett. 2014, 11, 1856–1860. [Google Scholar] [CrossRef]
- Peyré, G.; Péchaud, M.; Keriven, R.; Cohen, L. Geodesic methods in computer vision and graphics. Trends Comput. Graphics Vis. 2010, 5, 197–397. [Google Scholar] [CrossRef]
- Hastie, T.; Tibshirani, R.; Friedman, J. The Elements of Statistical Learning: Data Mining, Inference, and Prediction, 2nd Ed. ed; Springer-Verlag: Berlin, Germany, 2008. [Google Scholar]
- Ahamada, I.; Flachaire, E. Non-Parametric Econometrics; Oxford Univ. Press: Oxford, UK, 2010. [Google Scholar]
- Cheng, Y. Mean shift, mode seeking, and clustering. IEEE Trans. Pattern Anal. Mach. Intell. 1995, 17, 790–799. [Google Scholar] [CrossRef]
- Paris, S.; Kornprobst, P.; Tumblin, J.; Durand, F. Bilateral filtering: Theory and applications. Found. Trends Comput. Graph. Vis. 2008, 4, 1–73. [Google Scholar] [CrossRef]
- Canny, J. A Computational approach to edge detection. IEEE Trans. Pattern Anal. Mach. Intell. 1986, PAMI-8, 679–698. [Google Scholar] [CrossRef]
- Li, J.; Qin, Q.; Ma, H.; Yuan, W. Study on road damage assessment based on RS and GIS. In Proceedings of 2010 IEEE International Geoscience and Remote Sensing Symposium (IGARSS), Honolulu, HI, USA, 25–30 July 2010. [CrossRef]
- Liu, W.; Hu, H.; Cheng, C.; Li, Q. Application of grey correlation degree to disaster loss evaluation of strong wind and heavy rainfall. Meteorol. Sci. Technol. 2007, 4, 563–566. [Google Scholar]
- Dilley, M.; Chen, R.S.; Deichmann, U.; Lerner-Lam, A.L.; Arnold, M. Natural Disaster Hotspots: A Global Risk Analysis; International Bank for Reconstruction and Development; The World Bank and Columbia University: Washington, DC, USA, 2005. [Google Scholar]
- Rivas, V.; Rix, K.; Frances, E.; Cendrero, A.; Brunsden, D. Geomorphological indicators for environmental impact assessment: Consumable and non-consumable geomorphological resources. Geomorphology 1997, 18, 169–182. [Google Scholar] [CrossRef]
- Stuart, D.; Sungbin, C.; Ronald, T. The Shakeout Scenario Supplemental Study: Analysis of Risks to Southern California Highway System; SPA Risk LLC: Oakland, CA, USA, 2008. [Google Scholar]
- GB/T 18208.4–2011. Post-earthquake Field Works—Part 4: Assessment of Direct Loss; China Earthquake Administration: Beijing, China, 2011.
- Chen, C. Recognition and Damage Assessment for Bridge over Water from High-resolution Optical Remote Sensing Images. Ph.D. Theses, Peking University, Beijing, China, 9 June 2013. [Google Scholar]
- Ma, H.; Lu, N.; Ge, L.; Li, Q.; You, Z.; Li, X. Automatic road damage detection using high-resolution satellite images and road maps. In Proceedings of the 2013 IEEE International conference on Geoscience and Remote Sensing Symposium, Melbourne, Australia, 21–26 July 2013; pp. 3718–3721.
- Kawamura, M.; Tsujino, K.; Shimada, T.; Tsujiko, Y. Disaster damage detection and its recovery support system of road and railroad using satellite images. Int. Arch. Photogramm. Remote Sens. Spat. Inf. Sci. 2010, 8, 314–319. [Google Scholar]
- Gao, C.; Sun, Y. Automatic road centerline extraction from imagery using road GPS data. Remote Sens. 2014, 6, 9014–9033. [Google Scholar] [CrossRef]
© 2015 by the authors; licensee MDPI, Basel, Switzerland. This article is an open access article distributed under the terms and conditions of the Creative Commons Attribution license (http://creativecommons.org/licenses/by/4.0/).
Share and Cite
Wang, J.; Qin, Q.; Zhao, J.; Ye, X.; Feng, X.; Qin, X.; Yang, X. Knowledge-Based Detection and Assessment of Damaged Roads Using Post-Disaster High-Resolution Remote Sensing Image. Remote Sens. 2015, 7, 4948-4967. https://0-doi-org.brum.beds.ac.uk/10.3390/rs70404948
Wang J, Qin Q, Zhao J, Ye X, Feng X, Qin X, Yang X. Knowledge-Based Detection and Assessment of Damaged Roads Using Post-Disaster High-Resolution Remote Sensing Image. Remote Sensing. 2015; 7(4):4948-4967. https://0-doi-org.brum.beds.ac.uk/10.3390/rs70404948
Chicago/Turabian StyleWang, Jianhua, Qiming Qin, Jianghua Zhao, Xin Ye, Xiao Feng, Xuebin Qin, and Xiucheng Yang. 2015. "Knowledge-Based Detection and Assessment of Damaged Roads Using Post-Disaster High-Resolution Remote Sensing Image" Remote Sensing 7, no. 4: 4948-4967. https://0-doi-org.brum.beds.ac.uk/10.3390/rs70404948