Article

Feature Extraction in the North Sinai Desert Using Spaceborne Synthetic Aperture Radar: Potential Archaeological Applications

1
Department of Civil Engineering and Computer Science, Tor Vergata University of Rome, Rome 00133, Italy
2
Department of Cultural Heritage, Universitablety of Salento, Lecce 73100, Italy
3
Freelance Consultant, Rome 00183, Italy
4
Sarmap SA, Purasca 6989, Switzerland
*
Author to whom correspondence should be addressed.
Submission received: 14 July 2016 / Revised: 19 September 2016 / Accepted: 27 September 2016 / Published: 7 October 2016
(This article belongs to the Special Issue Remote Sensing for Cultural Heritage)

Abstract

:
Techniques were implemented to extract anthropogenic features in the desert region of North Sinai using data from the first- and second-generation Phased Array type L-band Synthetic Aperture Radar (PALSAR-1 and 2). To obtain a synoptic view over the study area, a mosaic of average, multitemporal (De Grandi) filtered PALSAR-1 σ° backscatter of North Sinai was produced. Two subset regions were selected for further analysis. The first included an area of abundant linear features of high relative backscatter in a strategic, but sparsely developed area between the Wadi Tumilat and Gebel Maghara. The second included an area of low backscatter anomaly features in a coastal sabkha around the archaeological sites of Tell el-Farama, Tell el-Mahzan, and Tell el-Kanais. Over the subset region between the Wadi Tumilat and Gebel Maghara, algorithms were developed to extract linear features and convert them to vector format to facilitate interpretation. The algorithms were based on mathematical morphology, but to distinguish apparent man-made features from sand dune ridges, several techniques were applied. The first technique took as input the average σ° backscatter and used a Digital Elevation Model (DEM) derived Local Incidence Angle (LAI) mask to exclude sand dune ridges. The second technique, which proved more effective, used the average interferometric coherence as input. Extracted features were compared with other available information layers and in some cases revealed partially buried roads. Over the coastal subset region a time series of PALSAR-2 spotlight data were processed. The coefficient of variation (CoV) of De Grandi filtered imagery clearly revealed anomaly features of low CoV. These were compared with the results of an archaeological field walking survey carried out previously. The features generally correspond with isolated areas identified in the field survey as having a higher density of archaeological finds, and interpreted as possible islands of dry land, which may have been surrounded by lagoons, rivers, and swamplands in antiquity. It is suggested that these surrounding areas may still have a higher water content, sufficient to be detected in processed Synthetic Aperture Radar (SAR) imagery.

Graphical Abstract

1. Introduction

1.1. Context of Research

Remote sensing is widely applied in archaeological research to map, prospect, and monitor large and often inaccessible areas at low cost [1,2,3]. However, while optical remote sensing techniques are already well established, relatively few studies have made use of remotely sensed Synthetic Aperture Radar (SAR) data by comparison [4]. The nature of microwave interaction with desert landscapes means that unique information can be provided by SAR over these areas [5], including subsurface imaging capability, particularly with long wavelength SAR [6].
Research on the feasibility of spaceborne Synthetic Aperture Radar to carry out large scale, systematic archaeological surveys in the North Sinai is one of the objectives of the Satellite Remote Sensing in Support to Egyptological Research (SatER) team. SatER is a research group of the Institute for Ancient Mediterranean Studies (ISMA) of the Italian National Research Council (CNR) coordinated by G. Capriotti Vittozzi. Its ultimate aim is to support the CNR Multidisciplinary Egyptological Mission (MEM). SatER seeks to apply innovative technologies that may increase the efficacy and efficiency of Egyptological research, drawing on a multidisciplinary team including remote sensing specialists, geophysical surveyors, geologists, and Egyptologists.
The present paper describes a methodology for anthropogenic feature extraction from SAR data of North Sinai, from regional to local scales, and some preliminary results of its implementation. Satellite data processing has been undertaken in the framework of a PhD project at the “Tor Vergata” University of Rome. An initial analysis and interpretation of results, and a discussion of its utility for archaeological research, has been carried out by the multidisciplinary team of SatER specialists in various fields ranging from geology to archaeology and Egyptology. The satellite SAR data includes scenes acquired by the first and second generation Phased Array type L-band SAR (PALSAR-1 and 2) sensors carried on-board the Japanese Advanced Land Observing Satellites (ALOS-1 and 2). The PALSAR-1 data was acquired through a Category-1 (research) project of the European Space Agency (ESA), while the PALSAR-2 data was obtained from the Japanese Space Agency (JAXA) via the fourth Research Agreement for ALOS-2.
The North Sinai area has been chosen as a suitable desert test area given the extent and homogeneity of its desert land cover, its lack of development, while still containing some infrastructure, and its archaeological significance as a land bridge between Egypt and the Levant.

1.2. Satellite SAR Remote Sensing in Desert Regions

SAR has certain properties that can be exploited for remote sensing applications in desert regions. These include the transmissivity of dry sand to microwave wavelengths, the sensitivity of radar to roughness and micro relief, and the fact that SAR is a coherent system [7].
The factors affecting the transmissivity of microwaves in dry material can be described by the following expressions, if the assumptions can be made that scattering in the soil volume can be ignored and that the extinction coefficient is constant with depth. The intensity of an incident SAR signal at depth z can be given by:
I ( z ) I 0   exp ( 2 α 0 z d z ' ) ,
adapted from [8], where I 0 is the intensity just below the surface and α is the field attenuation coefficient [8]. α can be described by the following:
α =   2 π λ | Im [ ε ] | ,
adapted from [6], where λ is the wavelength in free space and ε =   ε   j ε ' ' is the relative complex dielectric constant of the material medium.
The penetration depth, δ P , can be characterised according to α by the expression [6]:
δ P =   1 2 α .
The penetration depth is therefore directly proportional to the wavelength of the signal and indirectly proportional to the modulus of the imaginary part of the relative complex dielectric constant.
This implies that, in theory, the longer the wavelength of the SAR system, the greater the penetration capability. It also implies that materials that have a very low dielectric constant, such as dry sand, are more inclined to be transparent to microwaves.
The subsurface imaging potential of SAR in sandy areas was alluded to by Roth and Elachi [9] and gained widespread interest when the Shuttle Imaging Radar (SIR-A), carried on the space shuttle Columbia in November 1981, penetrated the hyperarid Selima Sand Sheet, dunes, and drift sand of the eastern Sahara, revealing previously unknown buried valleys, geologic features, and potential Stone Age occupation sites [10]. Studies showed that the penetration depth of L-band satellite SAR in the area was up to a few meters, e.g., [11,12]. While the implications of this for archaeological prospection had been discussed and indirectly applied, e.g., [10,13,14], it was initially mainly exploited for geological and hydrological mapping, e.g., [15,16,17]. Only relatively recently has the subsurface imaging property of SAR been directly used for archaeological prospection in desert regions, with the advent of High Resolution (HR) and Very High Resolution (VHR) satellite SAR missions, such as ALOS PALSAR-1 in Egypt [18,19], TerraSAR-X in Syria [20], and Radarsat-2 in Sudan and Iraq [21]. The present article demonstrates for the first time the use of PALSAR-2 for archaeological prospection.
The sensitivity of SAR to surface roughness and micro-relief [6] is also a property that has been exploited for feature extraction and archaeological prospection in desert regions. For example, Blom and Hedges [22] recognised the utility of SAR images from SIR-B to contribute to the detection of ancient tracks in Oman that converge at the likely location of an ancient caravansary that supported the incense trade. Comer and Blom [23] developed a set of protocols to enable more automated extraction of both surface and subsurface features in desert environments. This was done with airborne SAR systems including AIRSAR (C-band) and GeoSAR (X-band) over San Clemente Island, California [23]. Chen, Masini, Yang, Milillo, Feng and Lasaponara [4] used COSMO SkyMed SAR data to detect archaeological structures from micro-relief in a desert environment in Libya as well as other areas characterised by non-desert land cover. Stewart et al. [24,25] presented preliminary results on the use of ALOS PALSAR imagery to extract anthropogenic structures in Egypt.
Other studies on feature extraction using SAR remote sensing have taken place in non-desert environments, including for archaeological applications, such as for the detection of Mayan sites in Central America [26], and to map the greater extent of Angkor in Cambodia [27].
The present paper describes novel approaches for anthropogenic feature extraction in desert regions at various scales, and using both the phase and amplitude of the SAR signal. It also provides a first use and analysis of PALSAR-2 for this application. The work has been carried out in the hope that the techniques described may possibly be modified to suit the needs of archaeological research.

1.3. North Sinai Geography, Geology and Climate

The study area includes the arid, sand covered regions of North Sinai and is bounded by the Nile Delta in the northwest and Suez in the southwest, by the Negev Desert in the east, and the Mediterranean coast to the north (see Figure 1).
The area is composed mainly of Aeolian sand dune fields and interdune areas. The sand dunes include barchans, transverse, and linear dunes. Linear dunes are the main Aeolian form in North Sinai [28]. Only in a small part of the study area, in the Negev Desert, are there vegetated linear dunes [29]. There are also some exposed rock formations including the Um Khushaib, El Maghara, and El Halal mountains.
The climate of the study area is arid. The average annual evapotranspiration is around 100 mm per year, and the average annual rainfall is about 140 mm at El Arish [30], but drops in the southern part of the study area, where it does not exceed 28 mm per year [28].

1.4. North Sinai Archaeology

As a land bridge connecting Africa and Western Asia, the Sinai Peninsula has been traversed and inhabited since prehistoric (Paleolithic) times [31].
Along the Mediterranean coast of Sinai a well-known land route existed as early as the mid-4th millennium BC [32]. Throughout the 2nd millennium BC, especially in the New Kingdom, this coastal route, known also as the “Way of Horus” or “Via Maris”, became the most travelled commercial and military road between Egypt and the Levant, with the erection of a series of forts along its course [33,34]. Many campsites and way stations from the 4th to 2nd millennium BC have been unearthed [32], together with military fortifications from the New Kingdom to the Greco-Roman times. Towns, agricultural farmsteads, and irrigation canals continued to be developed in this region through later periods.
Ancient routes also existed further inland. An east–west route, the “Darb el-Hajj” or “Via Regia”, is known mostly from the Iron Age, but was possibly used since late prehistory for the exchange of copper ore from both the Wadi Arabah deposits (Timna and Faynan) and the Sinai desert to the Nile Valley [35]. The present research team postulates, as suggested elsewhere [36], that a route may have travelled from the Beersheba area in northern Negev, passed the limestone escarpments of Gebel Maghara and Gebel Halal, and continued along the Wadi Tumilat, a main entry point to Egypt (near the modern city of Ismailiya) [37]. The movement of Asiatics (the so-called Amw, “amu”) along these inland desert paths, and the consequent penetration of people from western Asia in the Nile Valley, are documented by both Egyptian literary [38] and pictorial sources [39], and by the retrieval of Asiatic materials along the Wadi Tumilat. This way also represents the scenario of the biblical Exodus (it can be tentatively associated with the biblical “Way of Shur”) [38]. To this day, the route through North Sinai from the Wadi Tumilat to the south of Gebel Maghara constitutes one of the main alternatives to the coastal route.
In central-southern Sinai, mining sites related to the presence of copper and turquoise have been brought to light, as well as camps and villages from as early as the 4th millennium BC. Early settlement sites and ancient Sinaitic campgrounds of various periods have been found in this area. With dry masonry walls, and rooms, yards, and enclosures of varying circular forms, their shape resembles modern Bedouin camps in both the Negev and Sinai [40].
More modern structures exist in the form of roads, canals, powerlines, airfields, industrial, and residential centres. Much military hardware has been deposited in Sinai, particularly during contemporary period conflicts, such as the Six Day War [41] and in more recent times [42].
Despite the many surveys that have been carried out in the region, e.g., [43,44,45], systematic and large-scale surveys remain a challenge due mainly to the large extent of inhospitable and inaccessible terrain, and the frequent security threats [42]. Another challenge with archaeological survey throughout Egypt is that sites that have previously been surveyed and uncovered are sometimes lost again beneath the sand [46]. Sand drift and dune migration affect much of North Sinai. The burial of modern infrastructure is a common and serious problem [28,47]. The use of spaceborne SAR to regularly survey large areas could potentially constitute a cost-effective technique, and given the transmissivity of dry sand to microwave wavelengths, may uniquely provide information on structures obscured by sand.

2. Materials and Methods
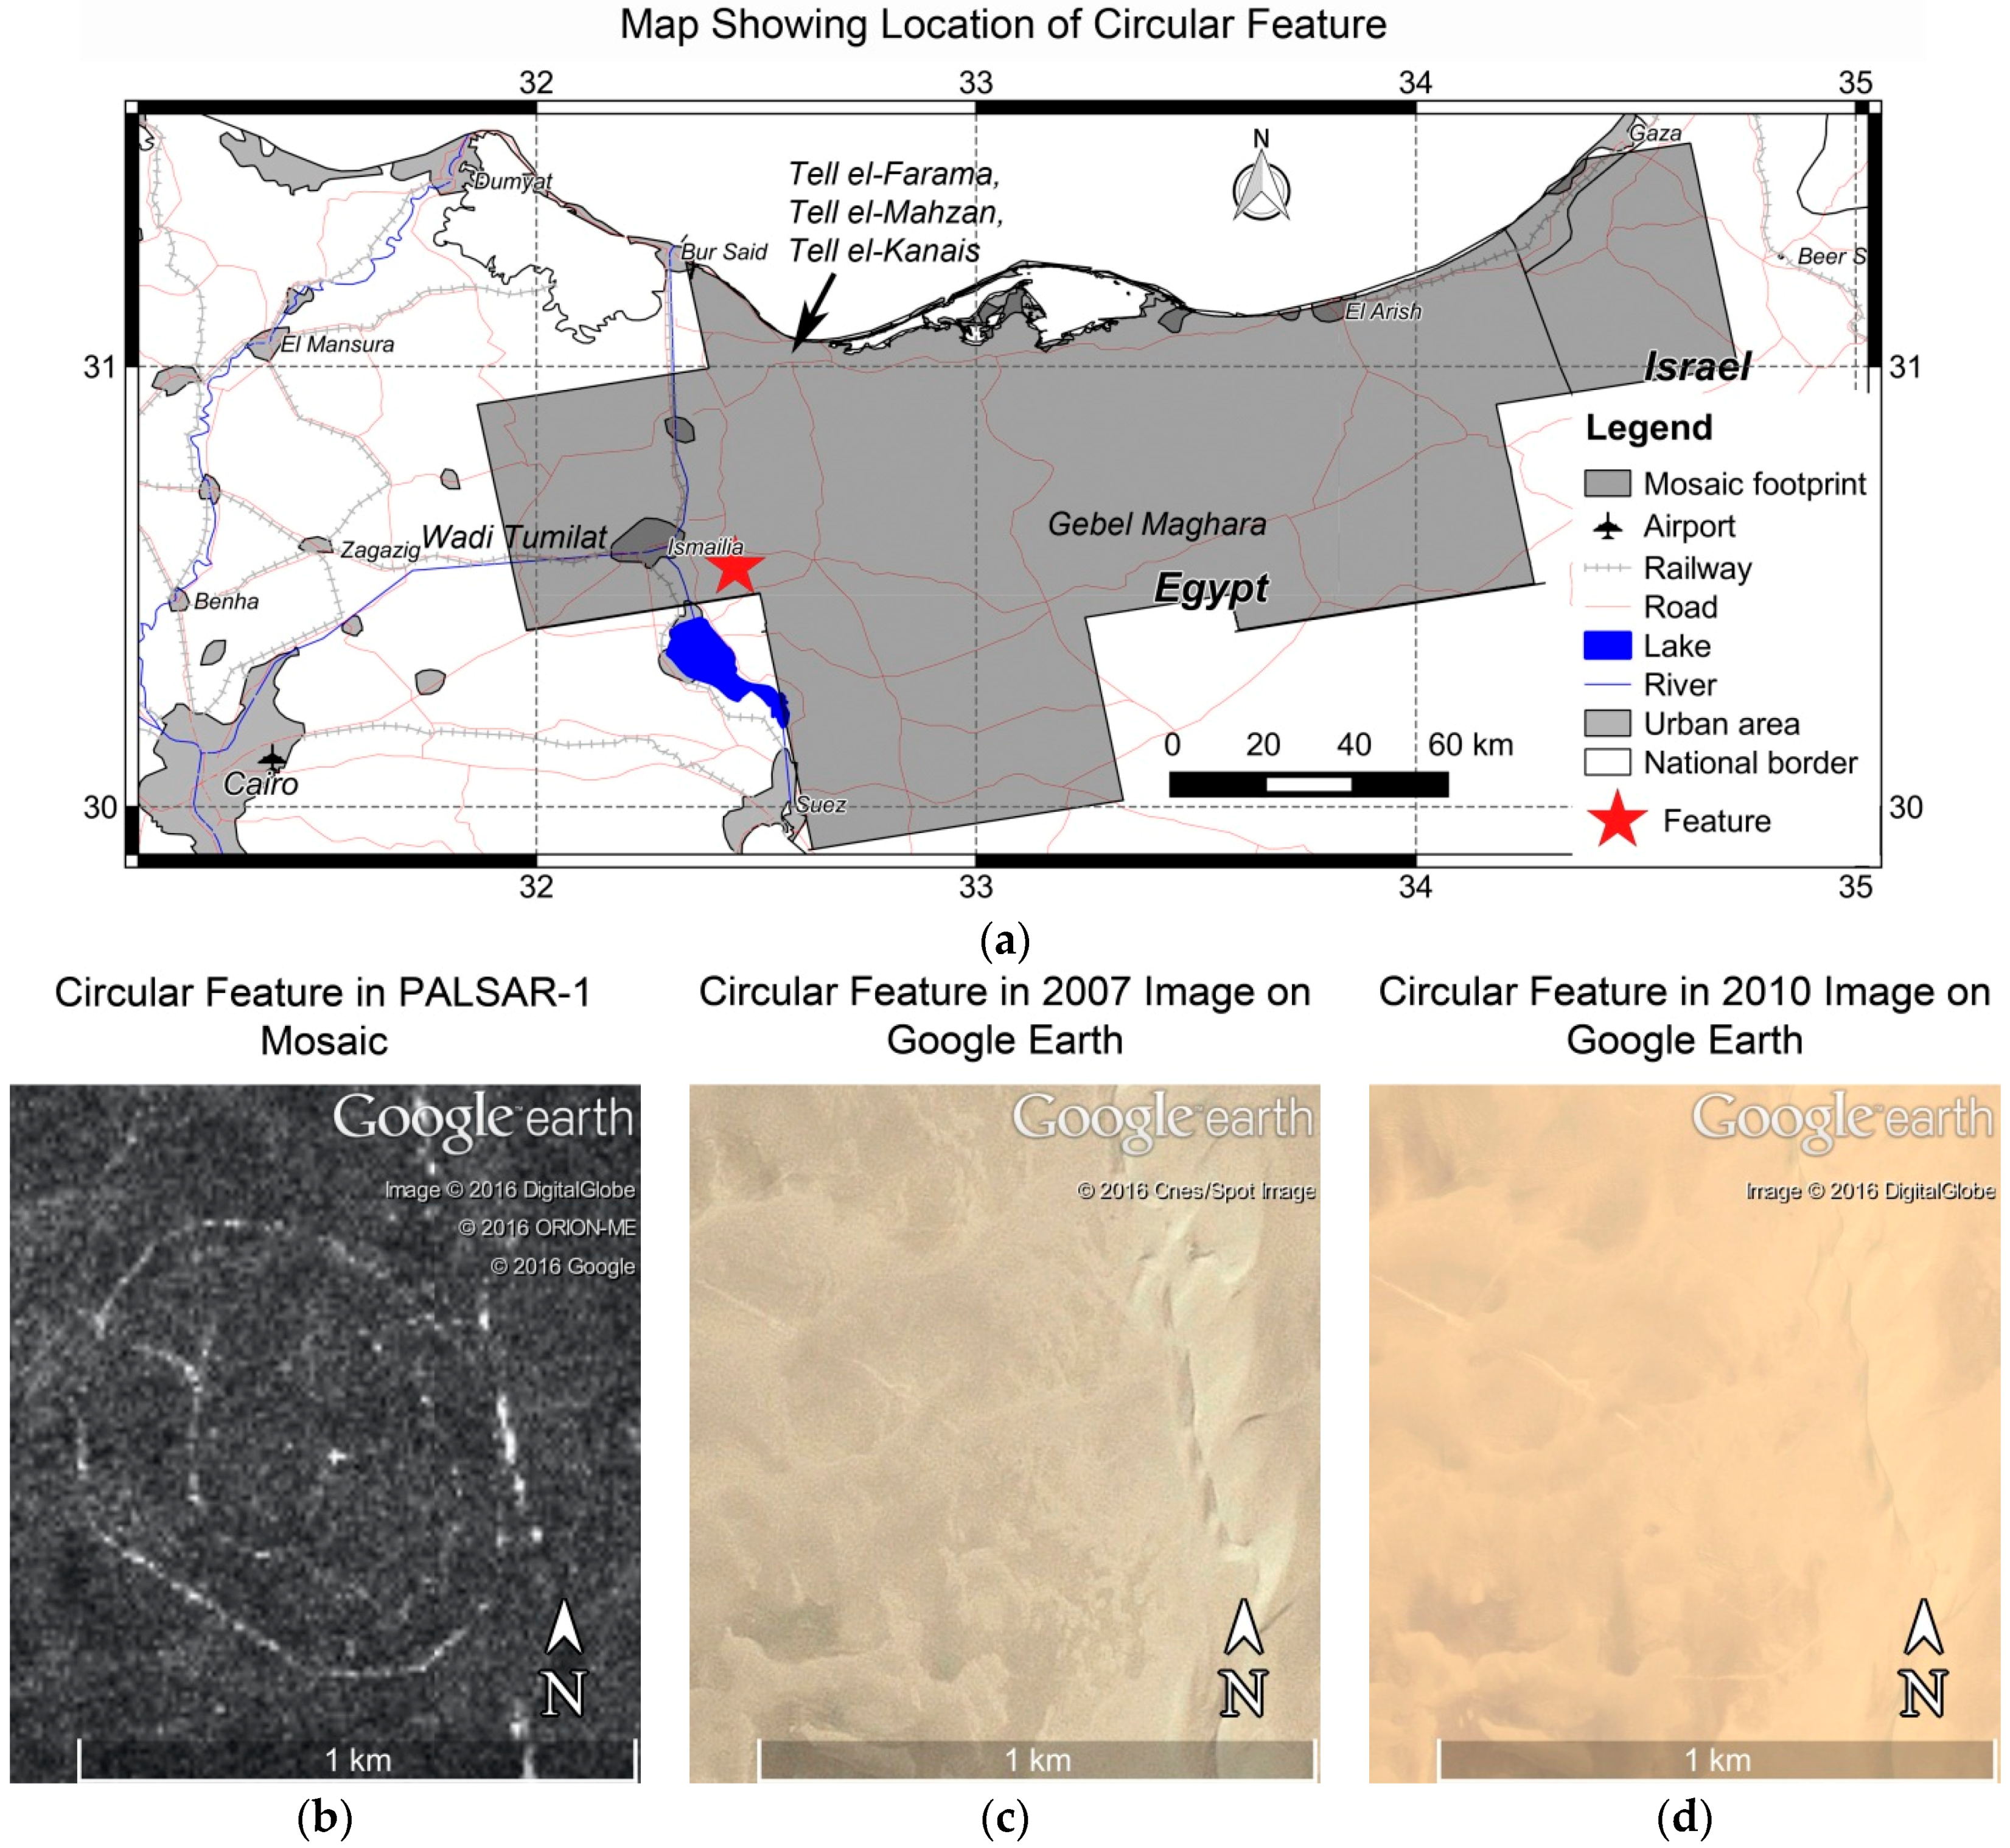
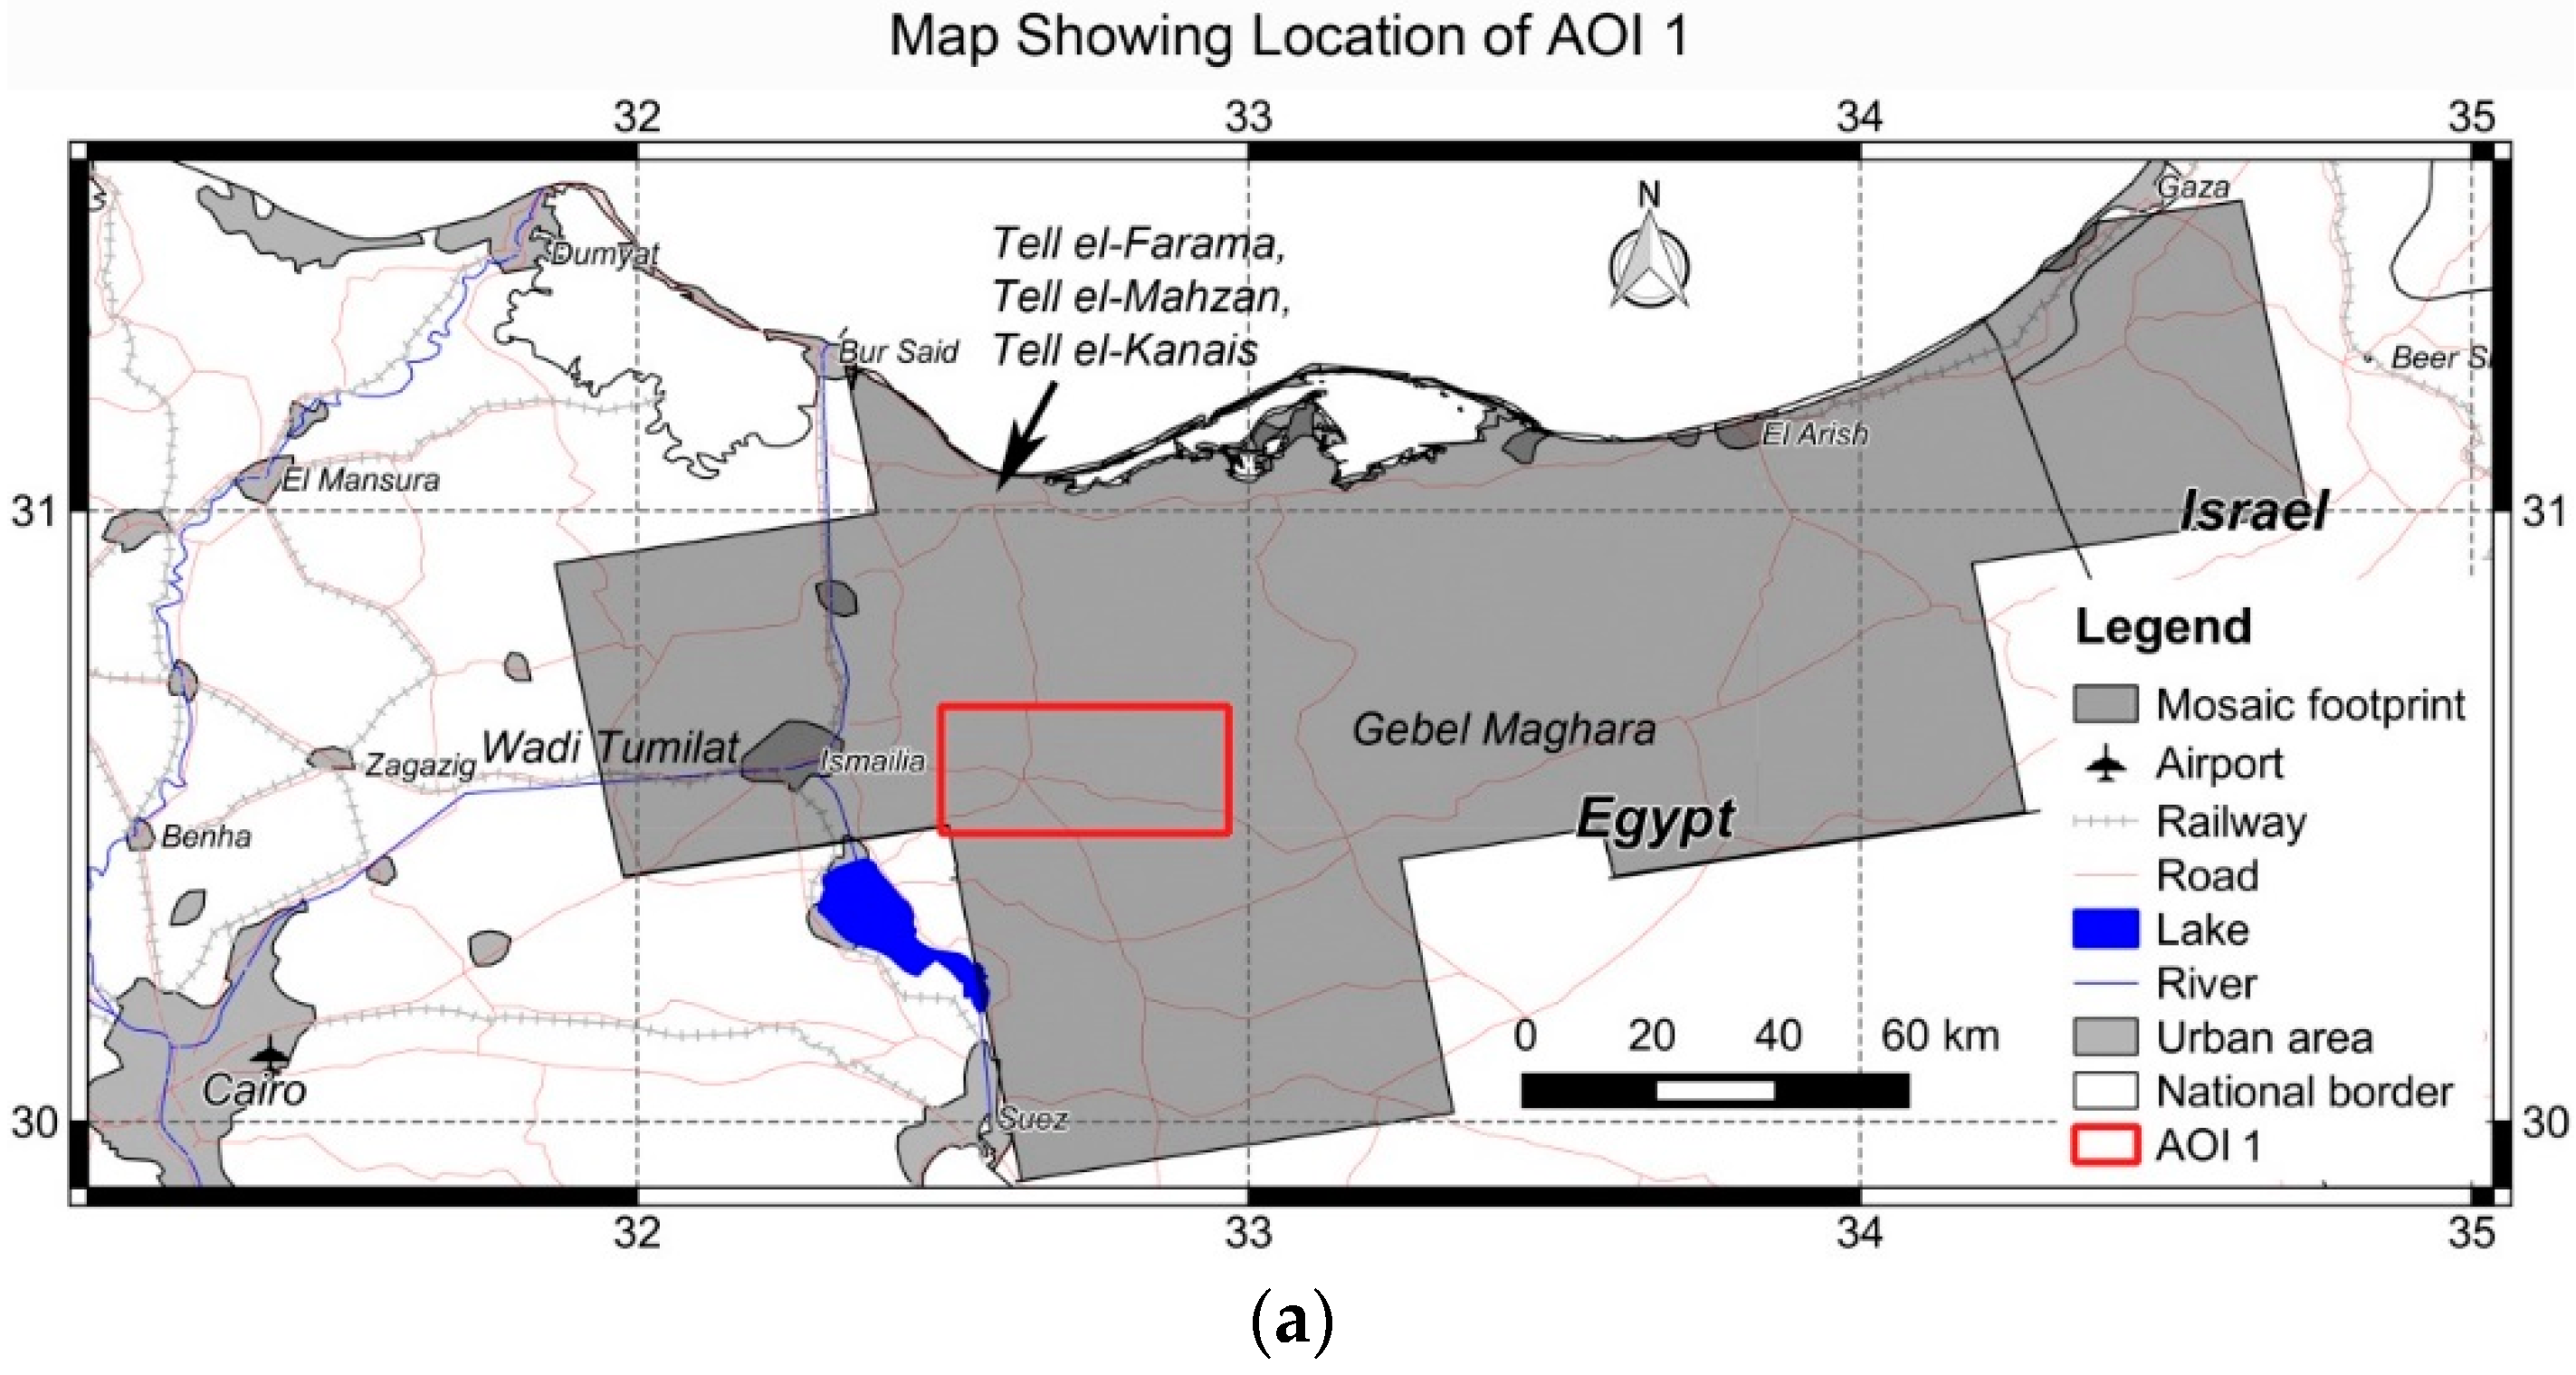
Figure 2 is a diagram summarizing the methodology for anthropogenic feature extraction. The SAR satellite data processing involved first the creation of a mosaic of multitemporal speckle filtered PALSAR-1 backscatter intensity over the study area. The purpose of this was to obtain a synoptic view of the area and to select potential areas of interest to focus further research.
An interpretation of the mosaic was carried out by the SatER team through comparison with raster and vector information layers in a Geographic Information System (GIS). These layers included geological and archaeological charts, remotely sensed optical imagery and Web Map Service (WMS) vector layers of infrastructure (roads, railways, canals, etc.). The objective of this interpretation was to evaluate any features that were uniquely identified, or better highlighted, in the mosaic. Many seemingly man-made features were distinguished by abnormally high backscatter compared to the surrounding sand. A much smaller number of potential anthropogenic structures were characterised by lower backscatter relative to surrounding areas. These were mainly confined to an area near the eastern Nile Delta and Mediterranean coast, around the archaeological sites of Tell El-Farama, Tell El-Mahzan, and Tell El-Kanais (see Figure 1). It was decided therefore to focus further research on two Areas of Interest (AOIs):
AOI 1:
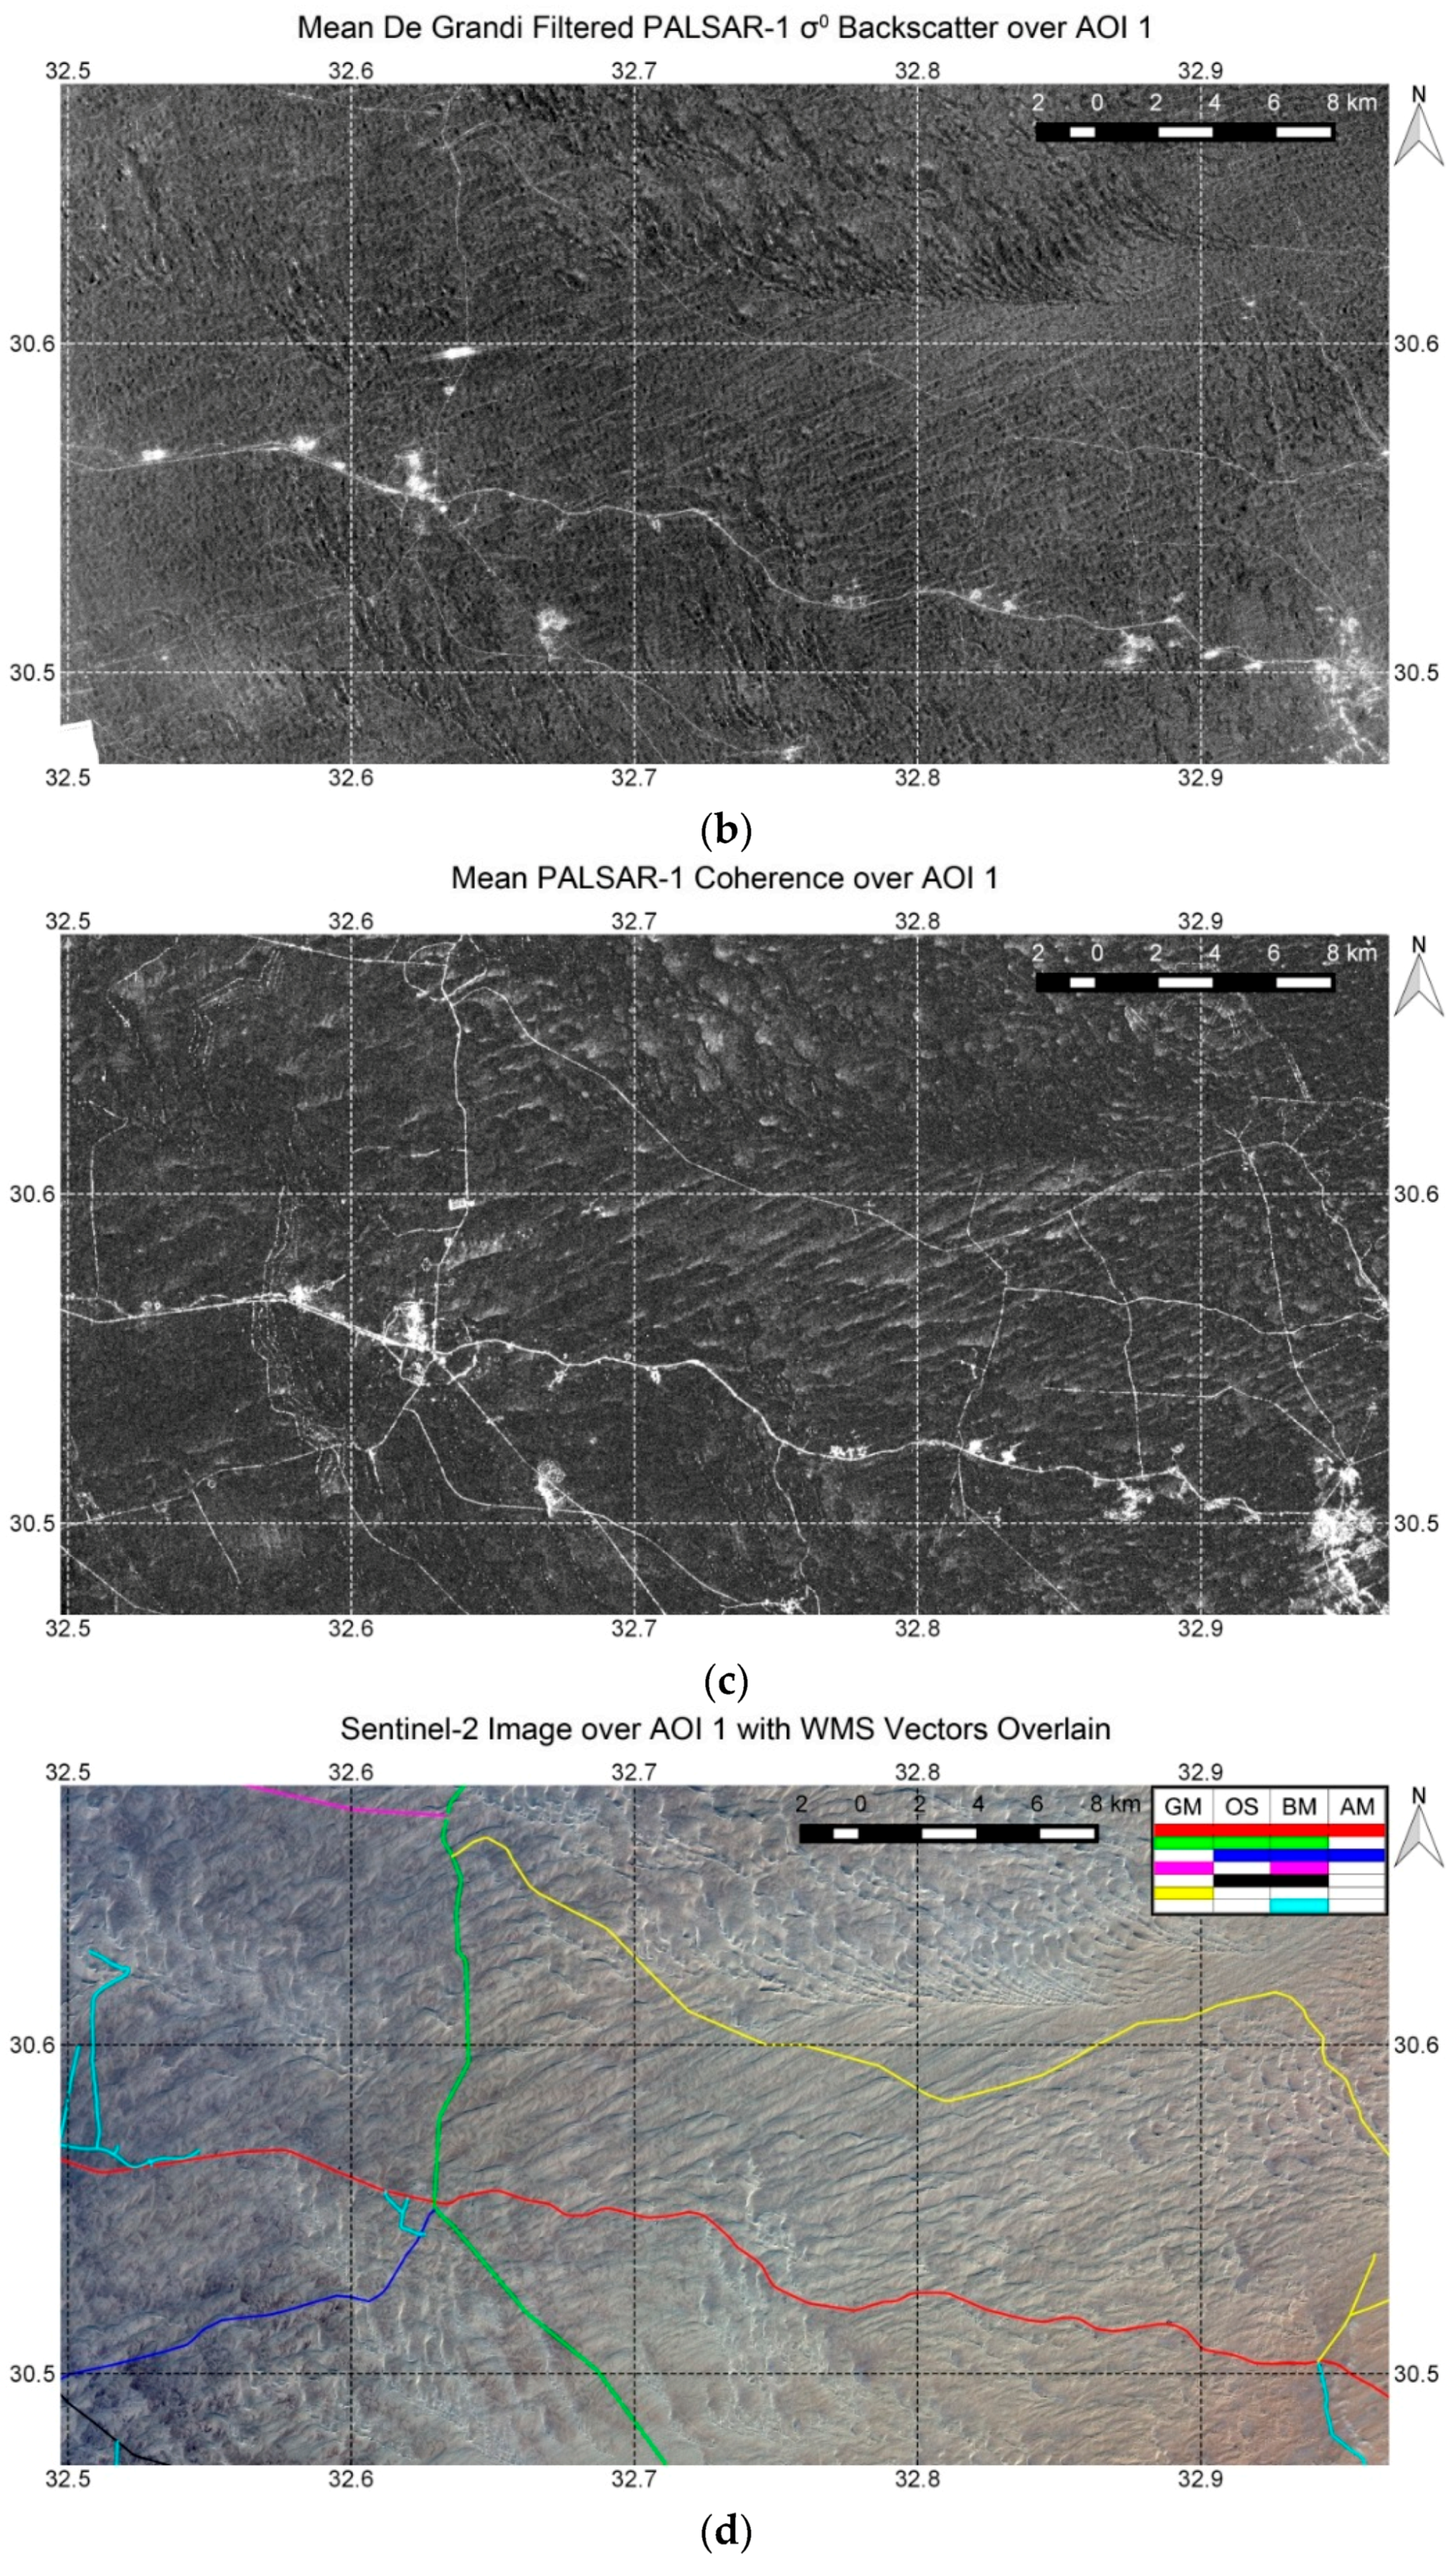
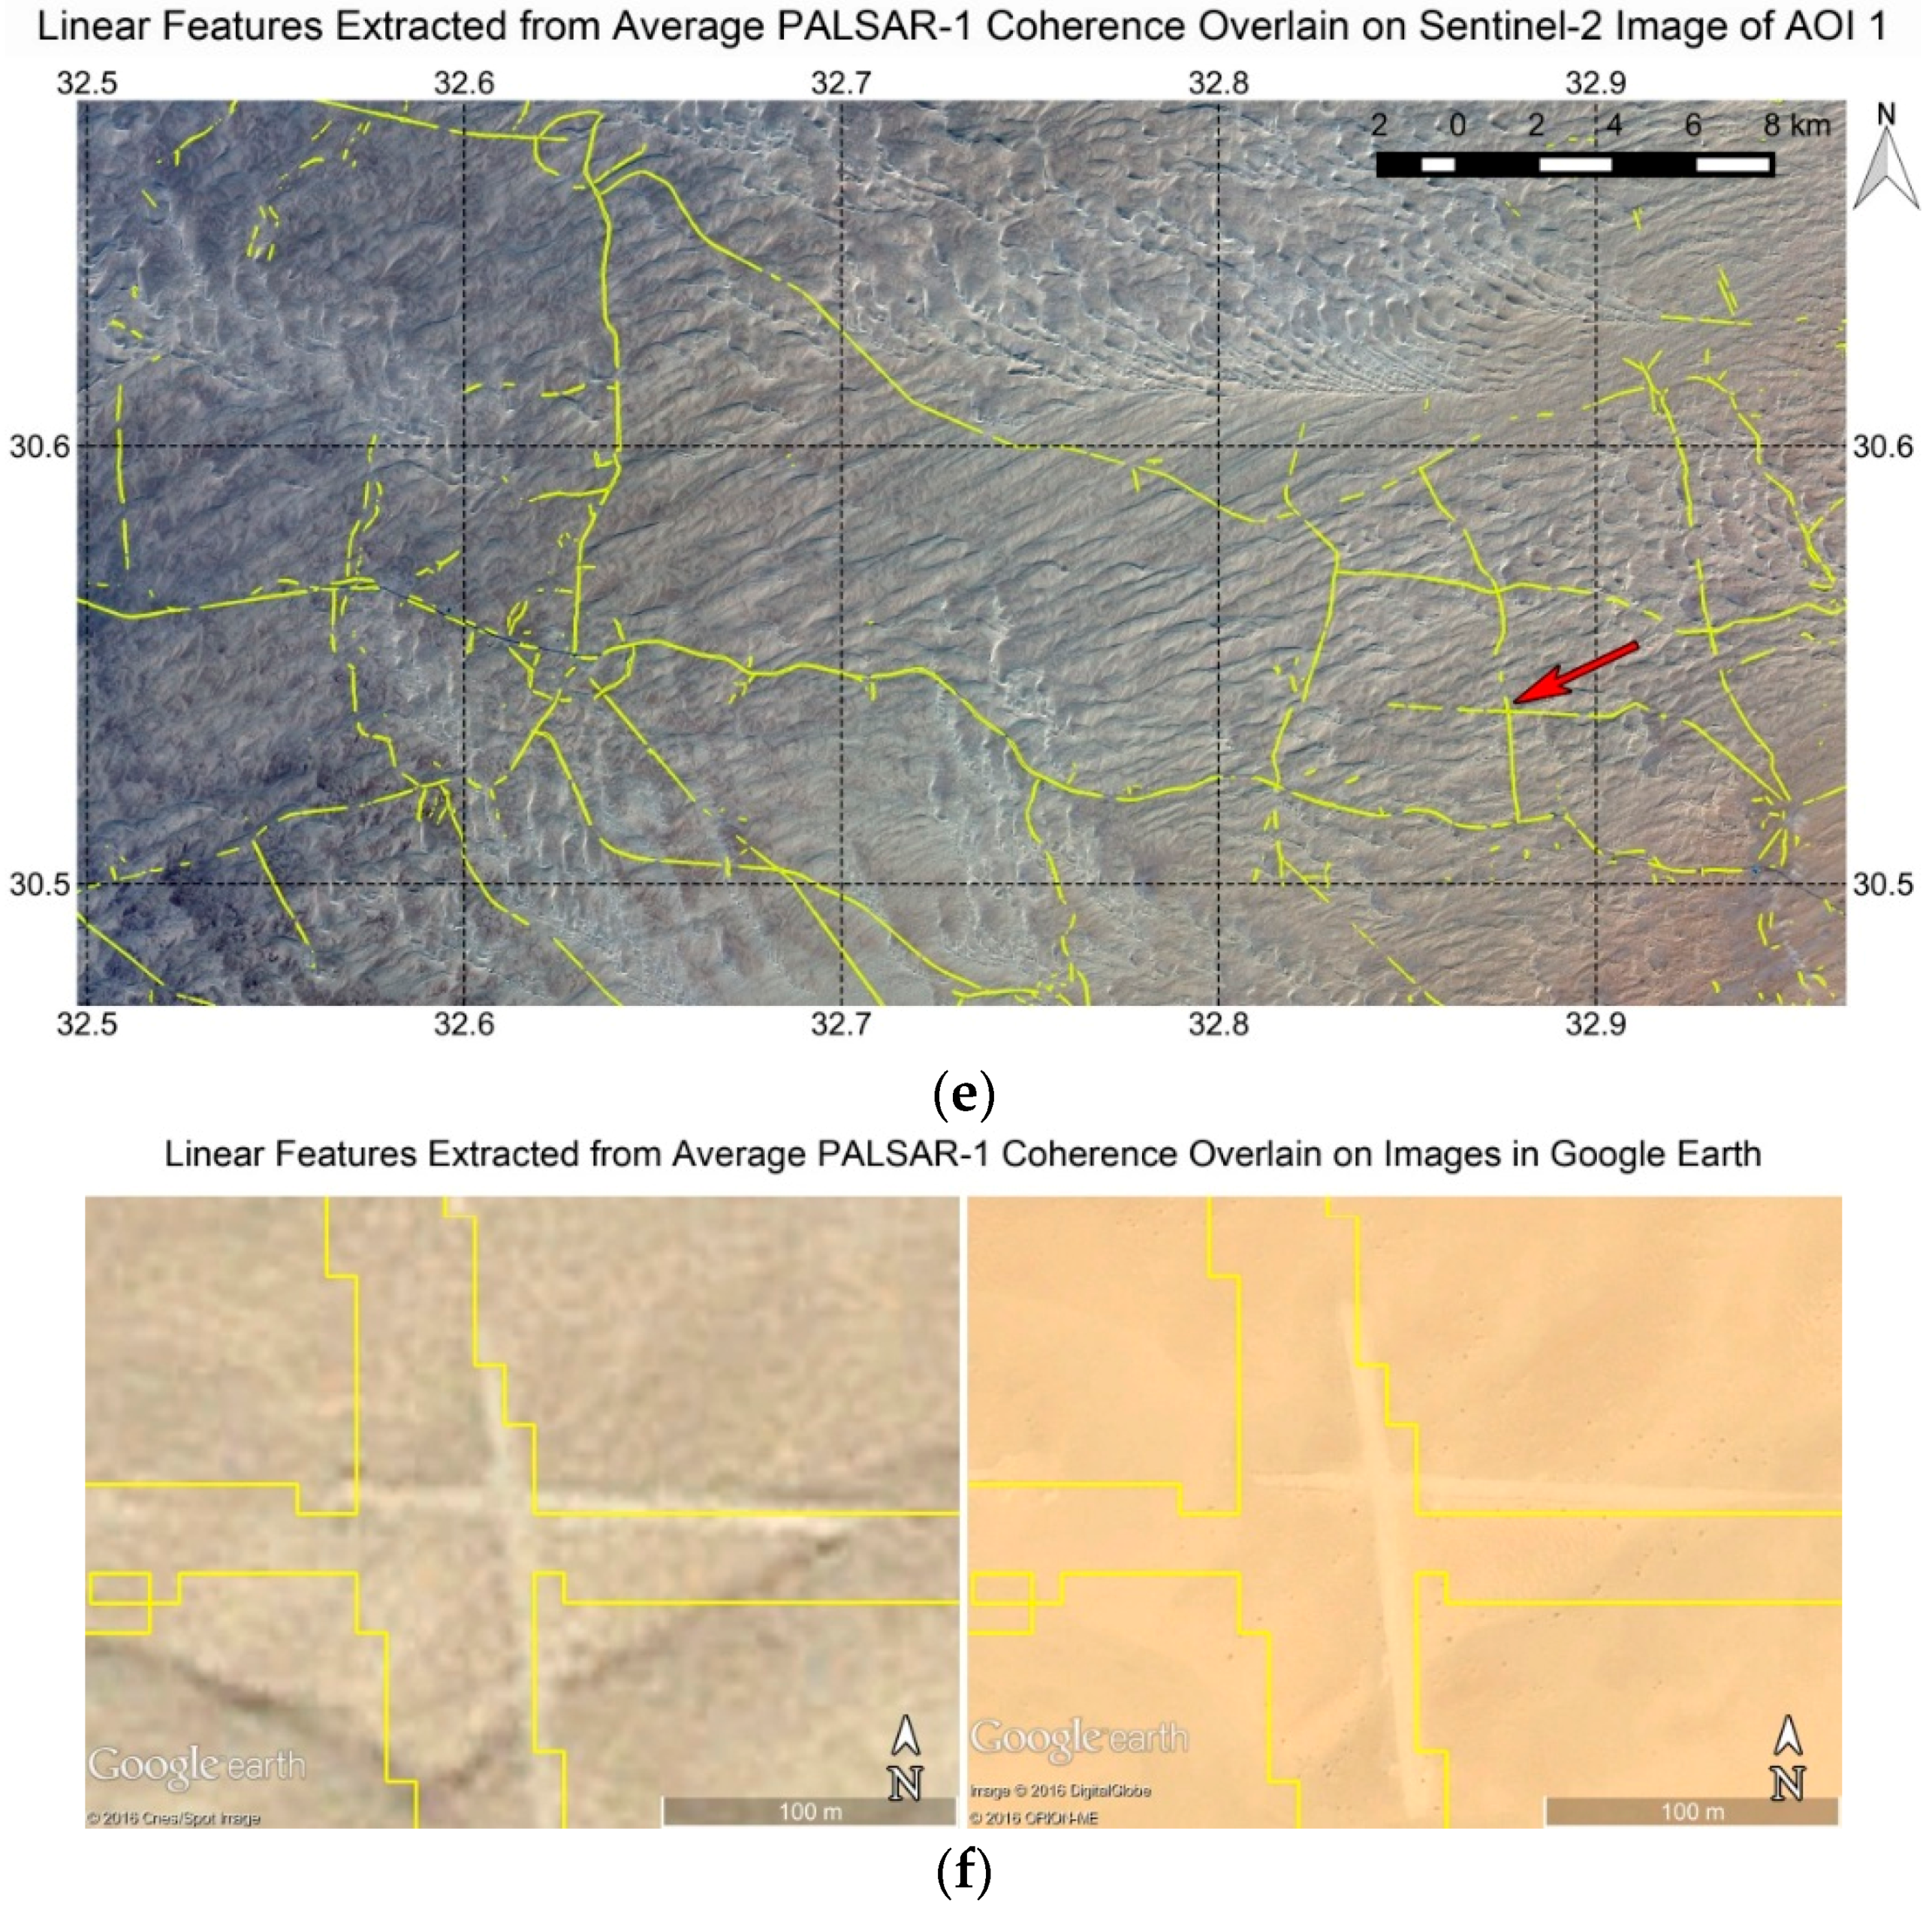
The region between the Wadi Tumilat and El Maghara Mountain (Gebel Maghara) (see Figure 1). This comprises an area of mobile sand dunes traversed, probably since antiquity (see Section 1.4) to the present. Many anomaly linear features of high relative backscatter were identified in this region.
AOI 2:
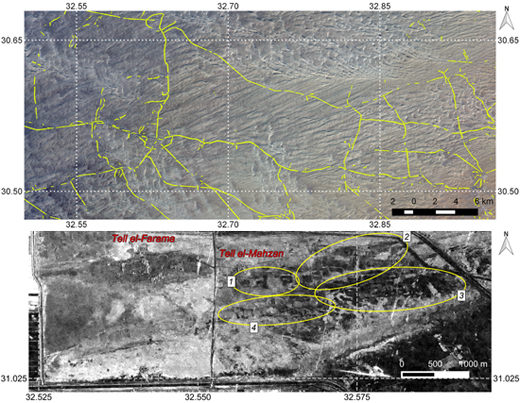
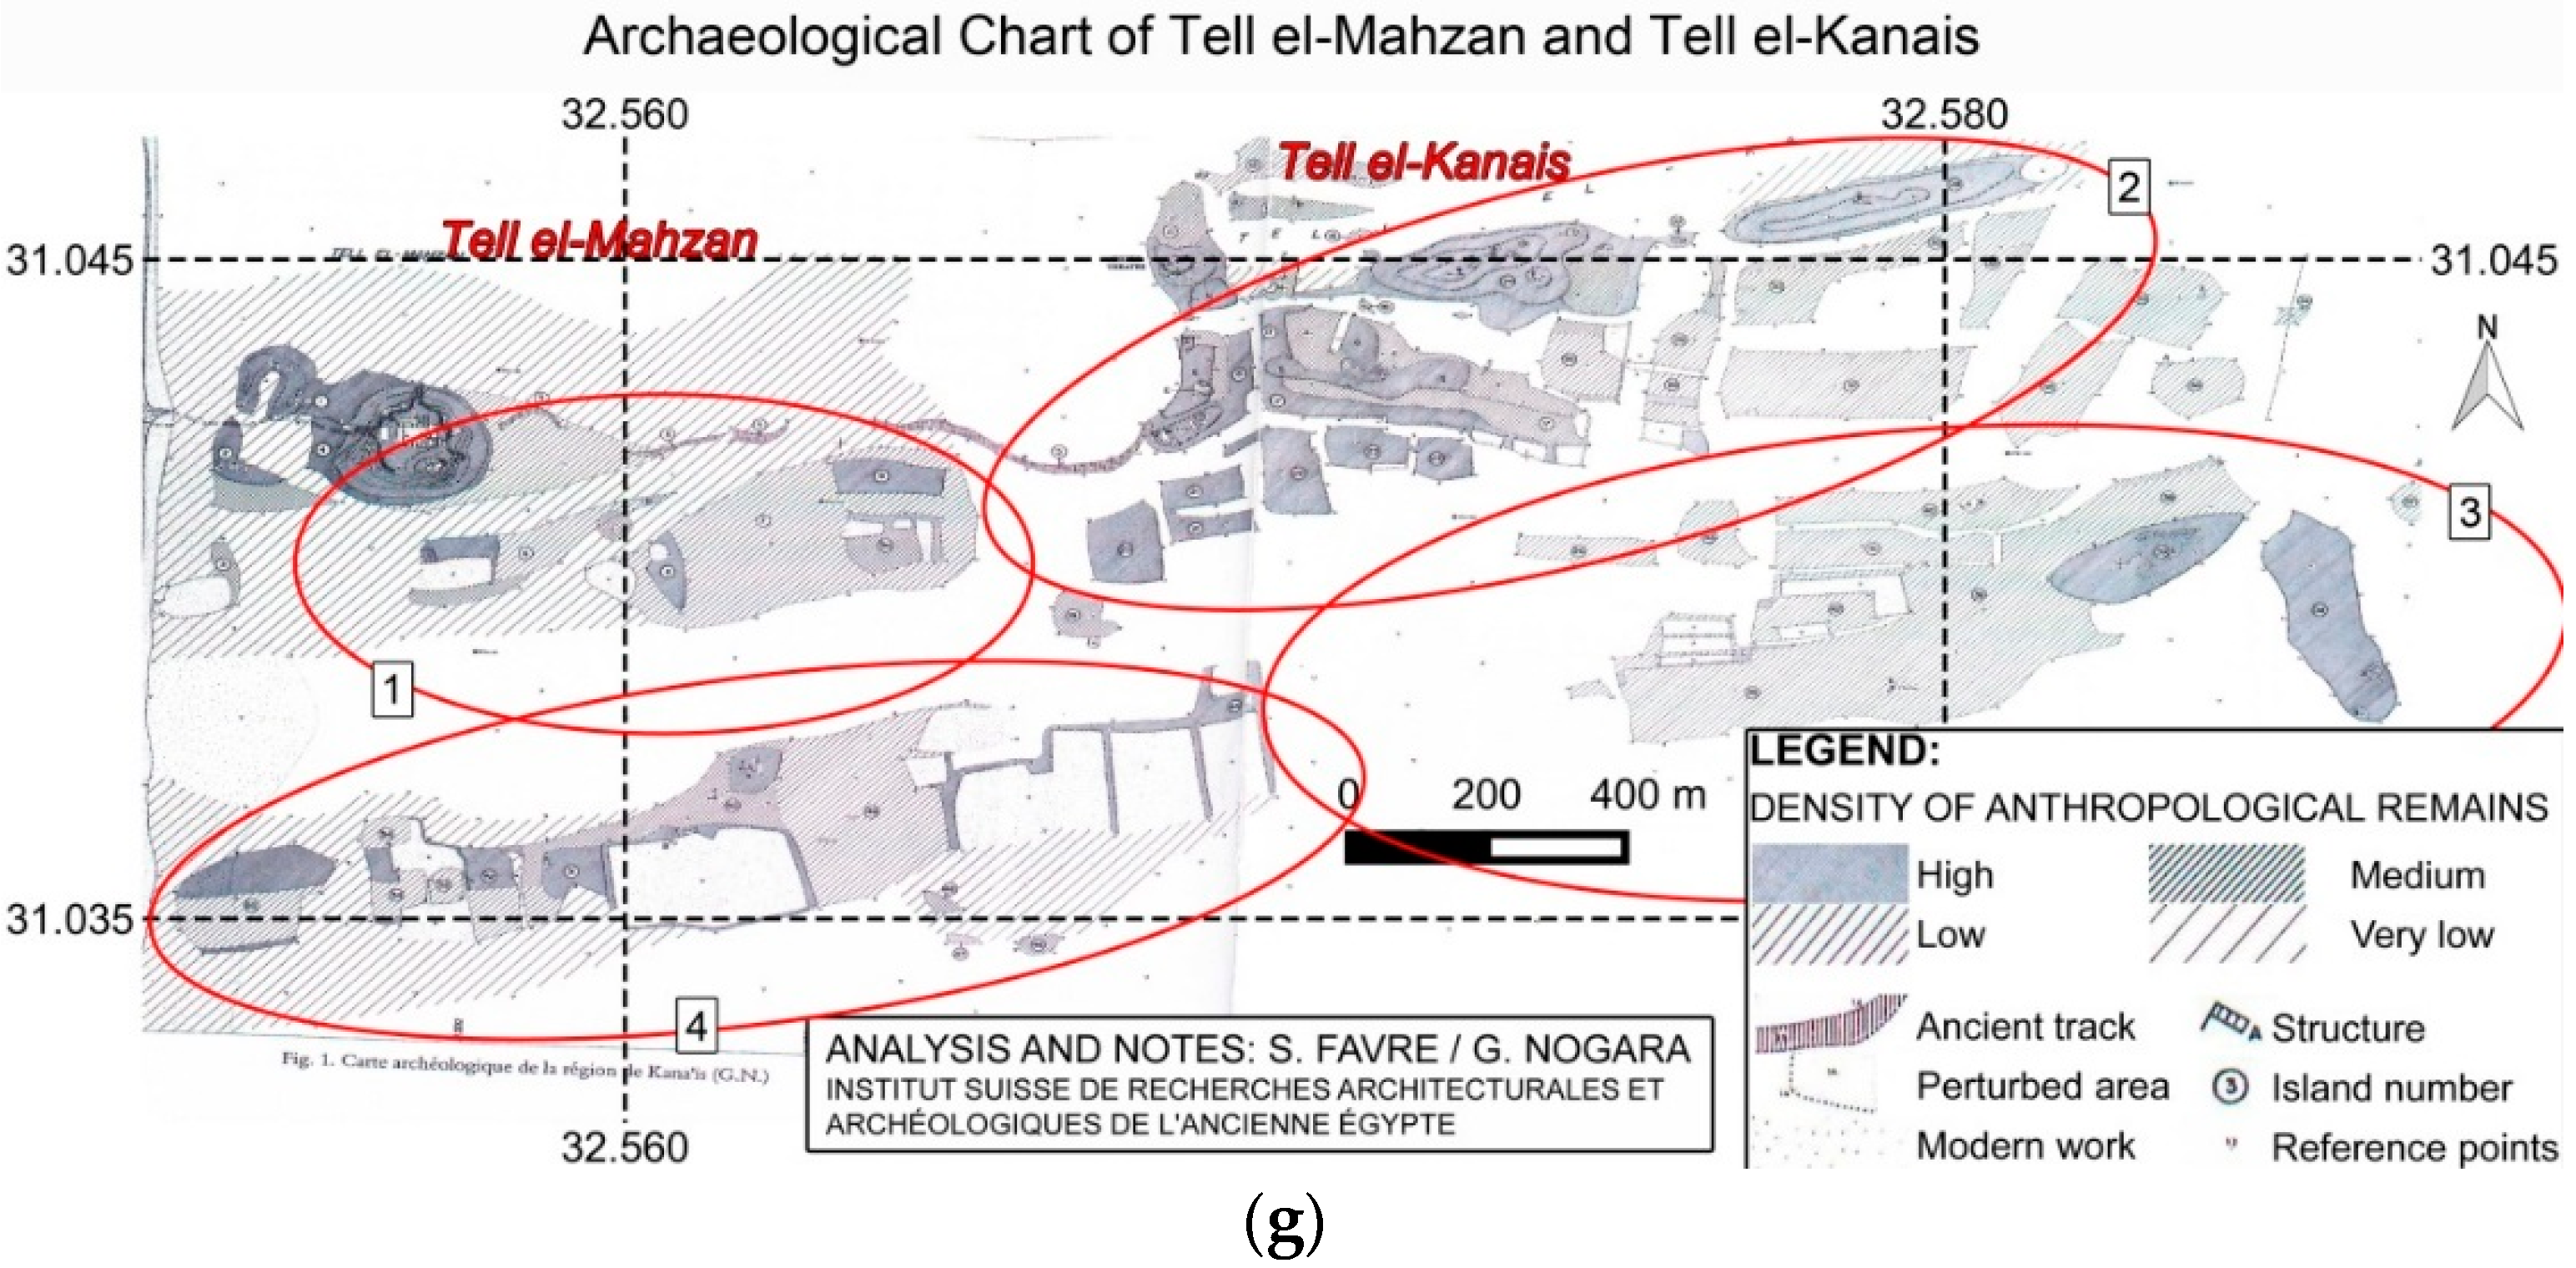
The area of Tell El-Farama, Tell El-Mahzan, and Tell El-Kanais. This is where features of low relative backscatter were found, which possibly correspond to archaeological structures.
Over AOI 1 a linear feature detection algorithm was designed and implemented to extract the abundant linear features of high backscatter. Conversion of these to vector format facilitated comparison and analysis with other layers in the GIS.
Over AOI 2, a time series of PALSAR-2 Spotlight imagery was procured to complement the existing data. Processing included a range of multitemporal techniques to better extract the low backscatter anomaly structures. These were then interpreted through comparison with other information layers, and with the results of previous archaeological survey in the area.
The sections below describe the processing methodology for the mosaic and each of the two AOIs.

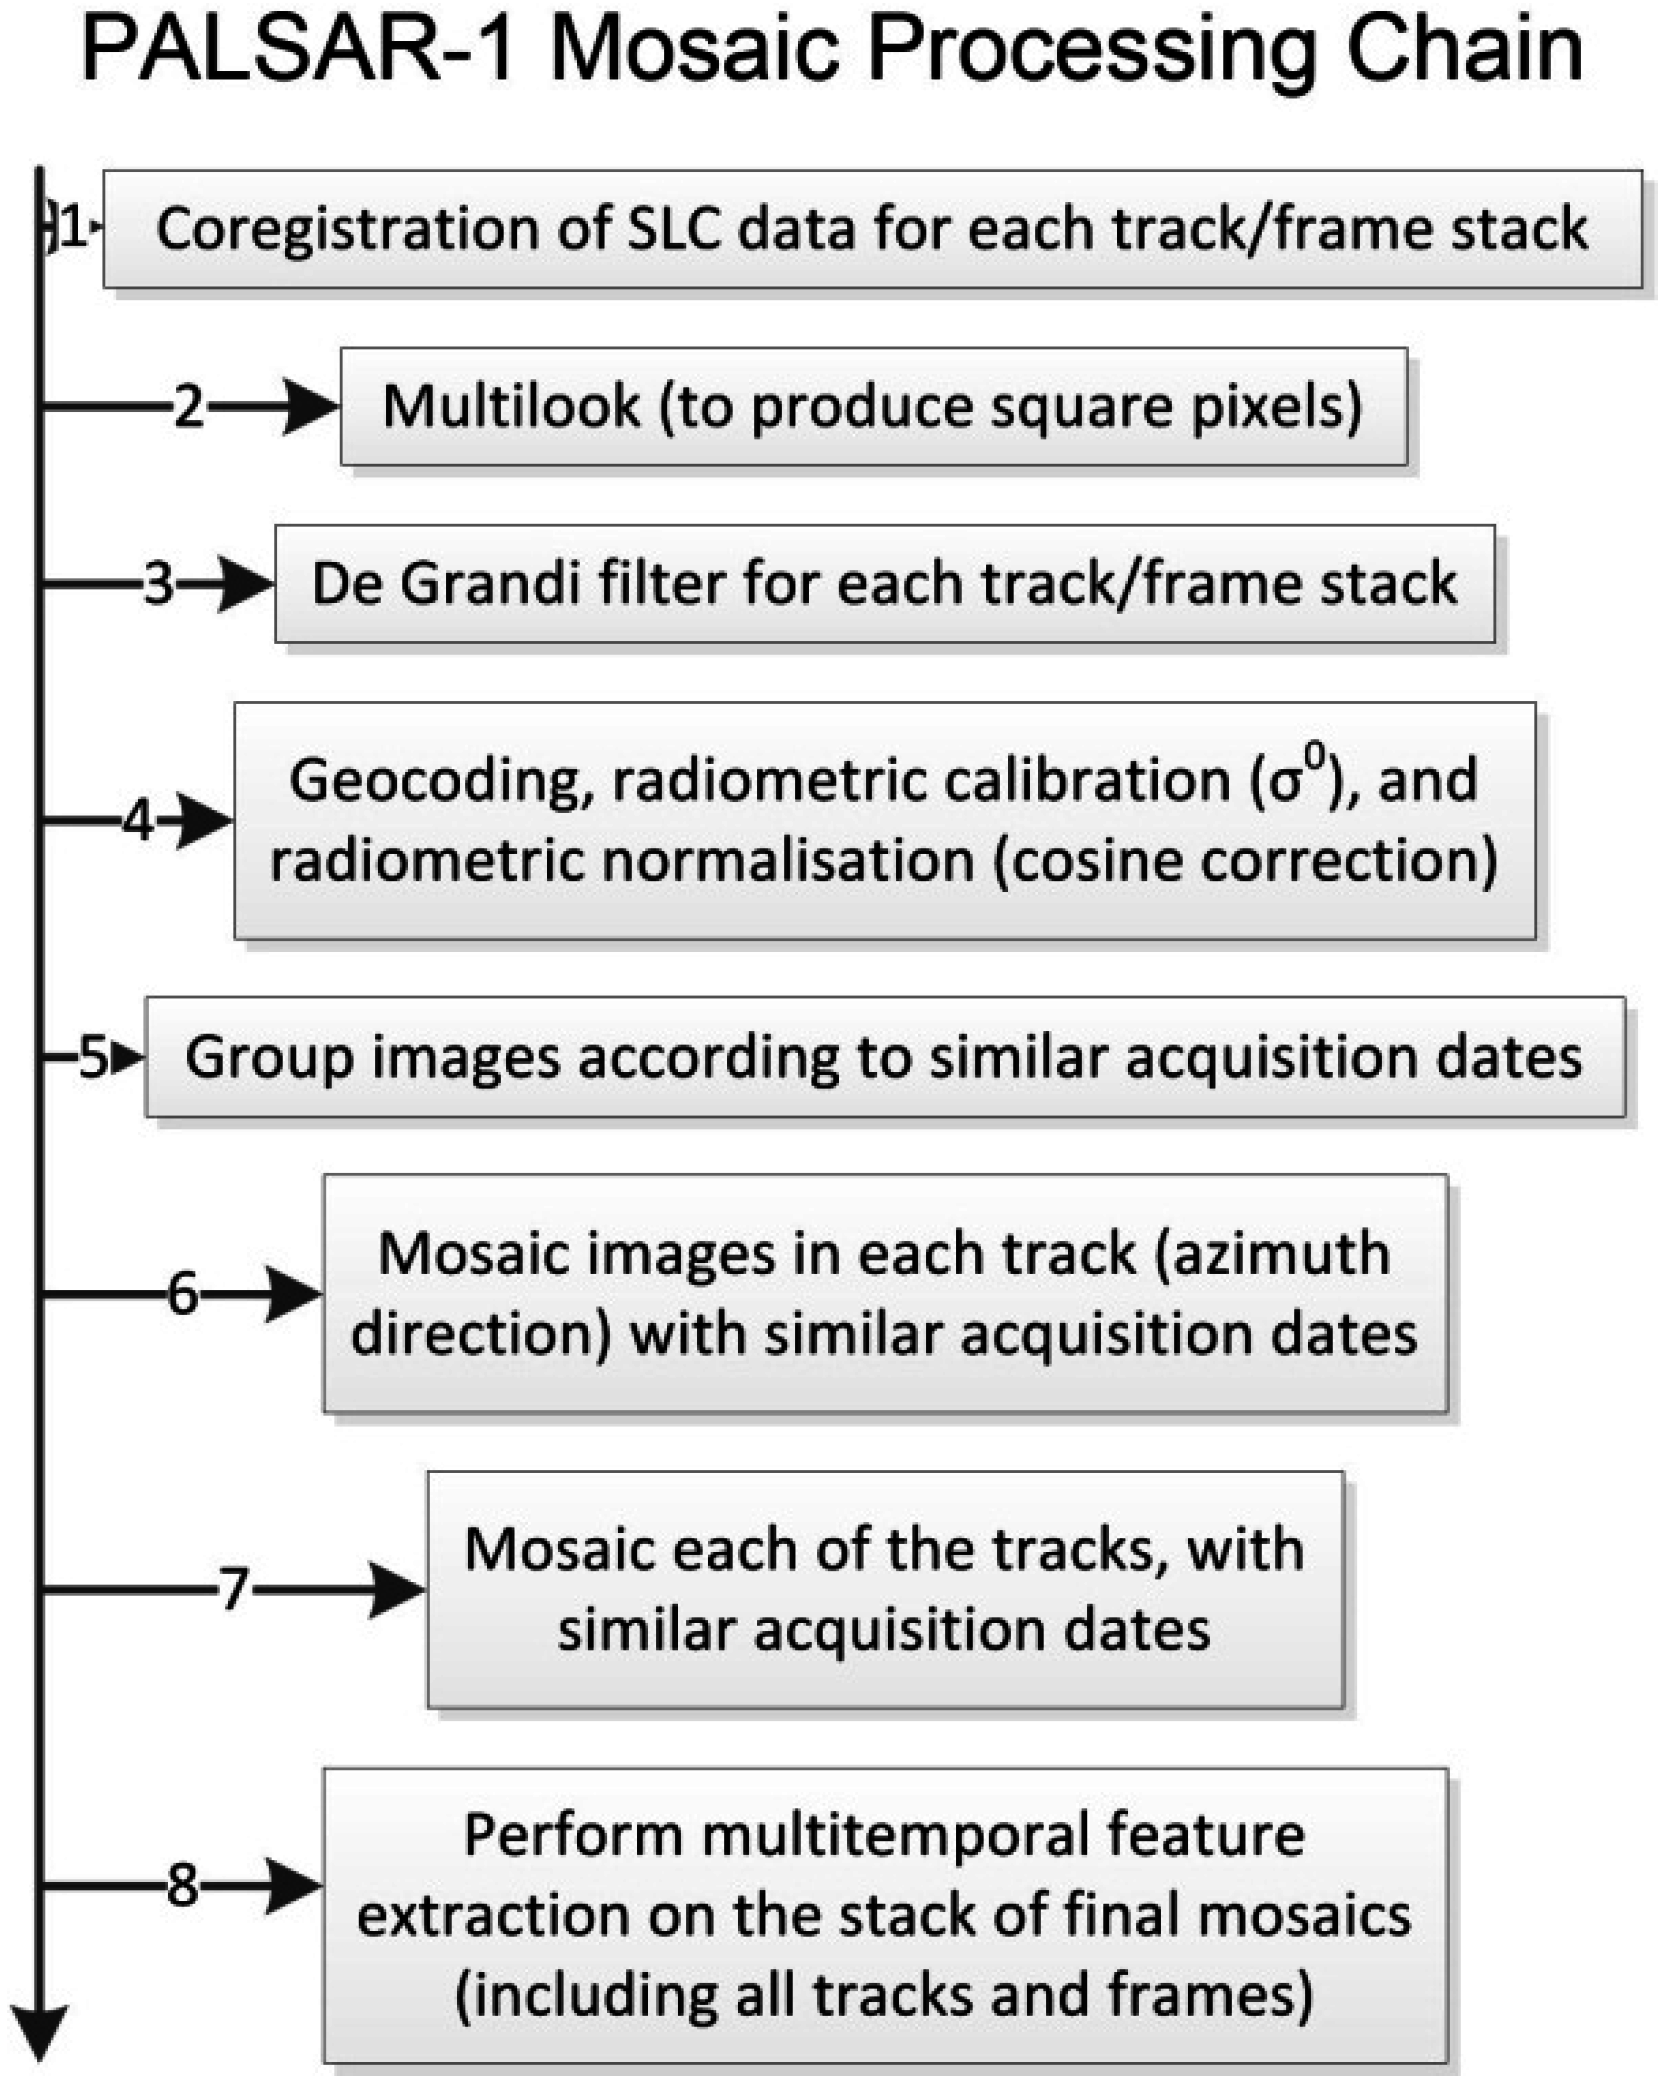
2.1. PALSAR-1 Mosaic of North Sinai

For the PALSAR-1 mosaic, a total of 74 PALSAR-1 images were procured covering nine image tracks and frames in the PALSAR-1 Fine Beam (FB) mode (see Table 1, Figure 1, and Tables S1 and S2 of the Supplementary Materials). The imagery was obtained through a European Space Agency (ESA) Category-1 (research) project, with project ID: C1F11458. Given the image quotas, and the fact that the images covering frame 610 only included a small strip of coastline (the rest being over water), only two images were procured for each of the coastal frames, while over all other frames seven images were obtained to enable good multitemporal speckle filtering. The image mode chosen was Fine Beam Dual polarization mode (FBD) to benefit from both the Horizontal Transmit, Horizontal Receive (HH), and Horizontal Transmit, Vertical Receive (HV) polarisations. Due to the low signal to noise ratio of the HV polarization, the mosaic, and subsequent analysis, was done with the HH polarization. Once the subset areas were identified, further imagery was procured covering these areas in both FBD and Fine Beam Single (FBS) sensor modes. The FBS imagery included HH polarization only. The imagery of track 607, frame 590 was included towards the end of the analysis, and comprised only FBS imagery, given that it was intended only for the mosaic in HH polarization. All images were acquired while the satellite was ascending, right looking, and with an incidence angle of 38.7 degrees. ALOS was launched in January 2006, and following a period of satellite commissioning, acquired data until April 2011 [48]. Imagery over most tracks and frames were thus available from 2007 to 2010 or 2011.
Figure 3 shows the processing chain used in the ENVI SARscape software to create the mosaic. Processing began with coregistration of Single Look Complex (SLC) data for each track/frame stack. Multilooking was then applied to produce square pixels: for FBS a multilooking of 3 in azimuth produced square pixels of approximately 10 m, for FBD a multilooking of 5 in azimuth produced square pixels of approximately 15 m.
De Grandi multitemporal speckle filtering [49] was then applied for each track/frame stack to reduce the image speckle without degrading spatial resolution. Conceptually, the De Grandi filter works by averaging in the temporal domain parts of images that are statistically homogenous. If such an area is interrupted by the appearance of a feature in one or more images, the areas to be averaged are divided to exclude this feature [49]. The De Grandi filter is thus suitable for preserving small-scale structures in individual images, whilst averaging surrounding areas of homogenous backscatter. This filter was therefore chosen over various other filters which were attempted, including the Anisotropic Non-Linear Diffusion Filter [50] and the multitemporal speckle filter described in [51]. The output of the De Grandi filtering process consists of the same number of images as the input.
Following De Grandi filtering, the imagery was geocoded and calibrated to σ ° applying also radiometric normalisation (cosine correction).
The geocoding was done using the Shuttle Radar Topography Mission (SRTM) Digital Elevation Model (DEM) version 4, at 3 arc second (90 m) resolution. Higher resolution DEMs could have been used. The Advanced Spaceborne Thermal Emission and Reflection Radiometer (ASTER) Global DEM (GDEM) is also freely available, and has a spatial resolution of 30 m [52]. However, it was found that the SRTM DEM was less noisy over this area. The 90 m SRTM was also favoured over the 1 arc second (30 m) SRTM, now freely available globally, given the issues with the accuracy and noise present in the 30 m SRTM [53]. Other DEMs could have been chosen, such as the TanDEM-X 12 m DEM, but this is not as accessible as the SRTM DEM, which was deemed sufficient for the purposes of the project.
The cosine correction was to compensate for near to far range backscatter variations. A correction factor, modified from [54], was applied in the SARscape software, according to,
σ n o r m ° = σ c a l ° ( cos θ n o r m / cos θ i n c ) 2 ,
where σ c a l ° is the calibrated σ ° , θ n o r m is the incidence angle in the scene center, and θ i n c is the local incidence angle with reference to the ellipsoid.
The map system consisted in the Geographic Latitude/Longitude projection, with the World Geodetic System 1984 (WGS 84) datum. The pixel spacing was selected as 10 m, to preserve the highest resolution FBS image details.
Mosaicking was then done first for each track (azimuth direction) with similar acquisition dates (the acquisition dates along the azimuth were not always identical given the varying amount of images procured for each track/frame stack). The mosaicked strips were in turn mosaicked together, again for similar dates, with mean values calculated over regions of track overlap. This resulted in a series of mosaics over the entire area for different date ranges. A final reference mosaic was created by averaging these mosaics and converting the mean backscatter to decibel.
Results of the mosaic processing, and a first interpretation by the SatER team is described in Section 3 and Section 4. The mosaic in ENVI format was imported into a GIS for comparison with a geological chart, DEMs, remotely sensed optical imagery, and WMS vector layers of infrastructure from Google Maps, Bing Maps Open Street Map and Apple iPhoto map. Export to Keyhole Markup Language (KML) format allowed overlay onto Google Earth. Using the history slider of Google Earth, it was possible to compare the mosaic with VHR optical imagery acquired, in most areas, in 2007 and 2010. This corresponded well with the PALSAR-1 time series used to create the mosaic, which included imagery acquired from 2007 to 2010/2011.
A number of features evident only in the PALSAR-1 mosaic were discovered following this initial analysis. These included two different types of anomaly: anomalies caused by low backscatter relative to the surroundings and by high relative backscatter. The anomalies of low relative backscatter were confined to a coastal region in the northwest of the study area, around the archaeological sites of Tell El-Farama, Tell El-Mahzan, and Tell El-Kanais. The anomalies caused by high relative backscatter can be seen thoughout the mosaic, but are predominantly present in the region between the Wadi Tumilat and Gebel Maghara. This area is of particular interest given its strategic location, possibly since antiquity, as a southern route linking the Wadi Tumilat to Beersheba in northern Negev (see Section 1.4 above).

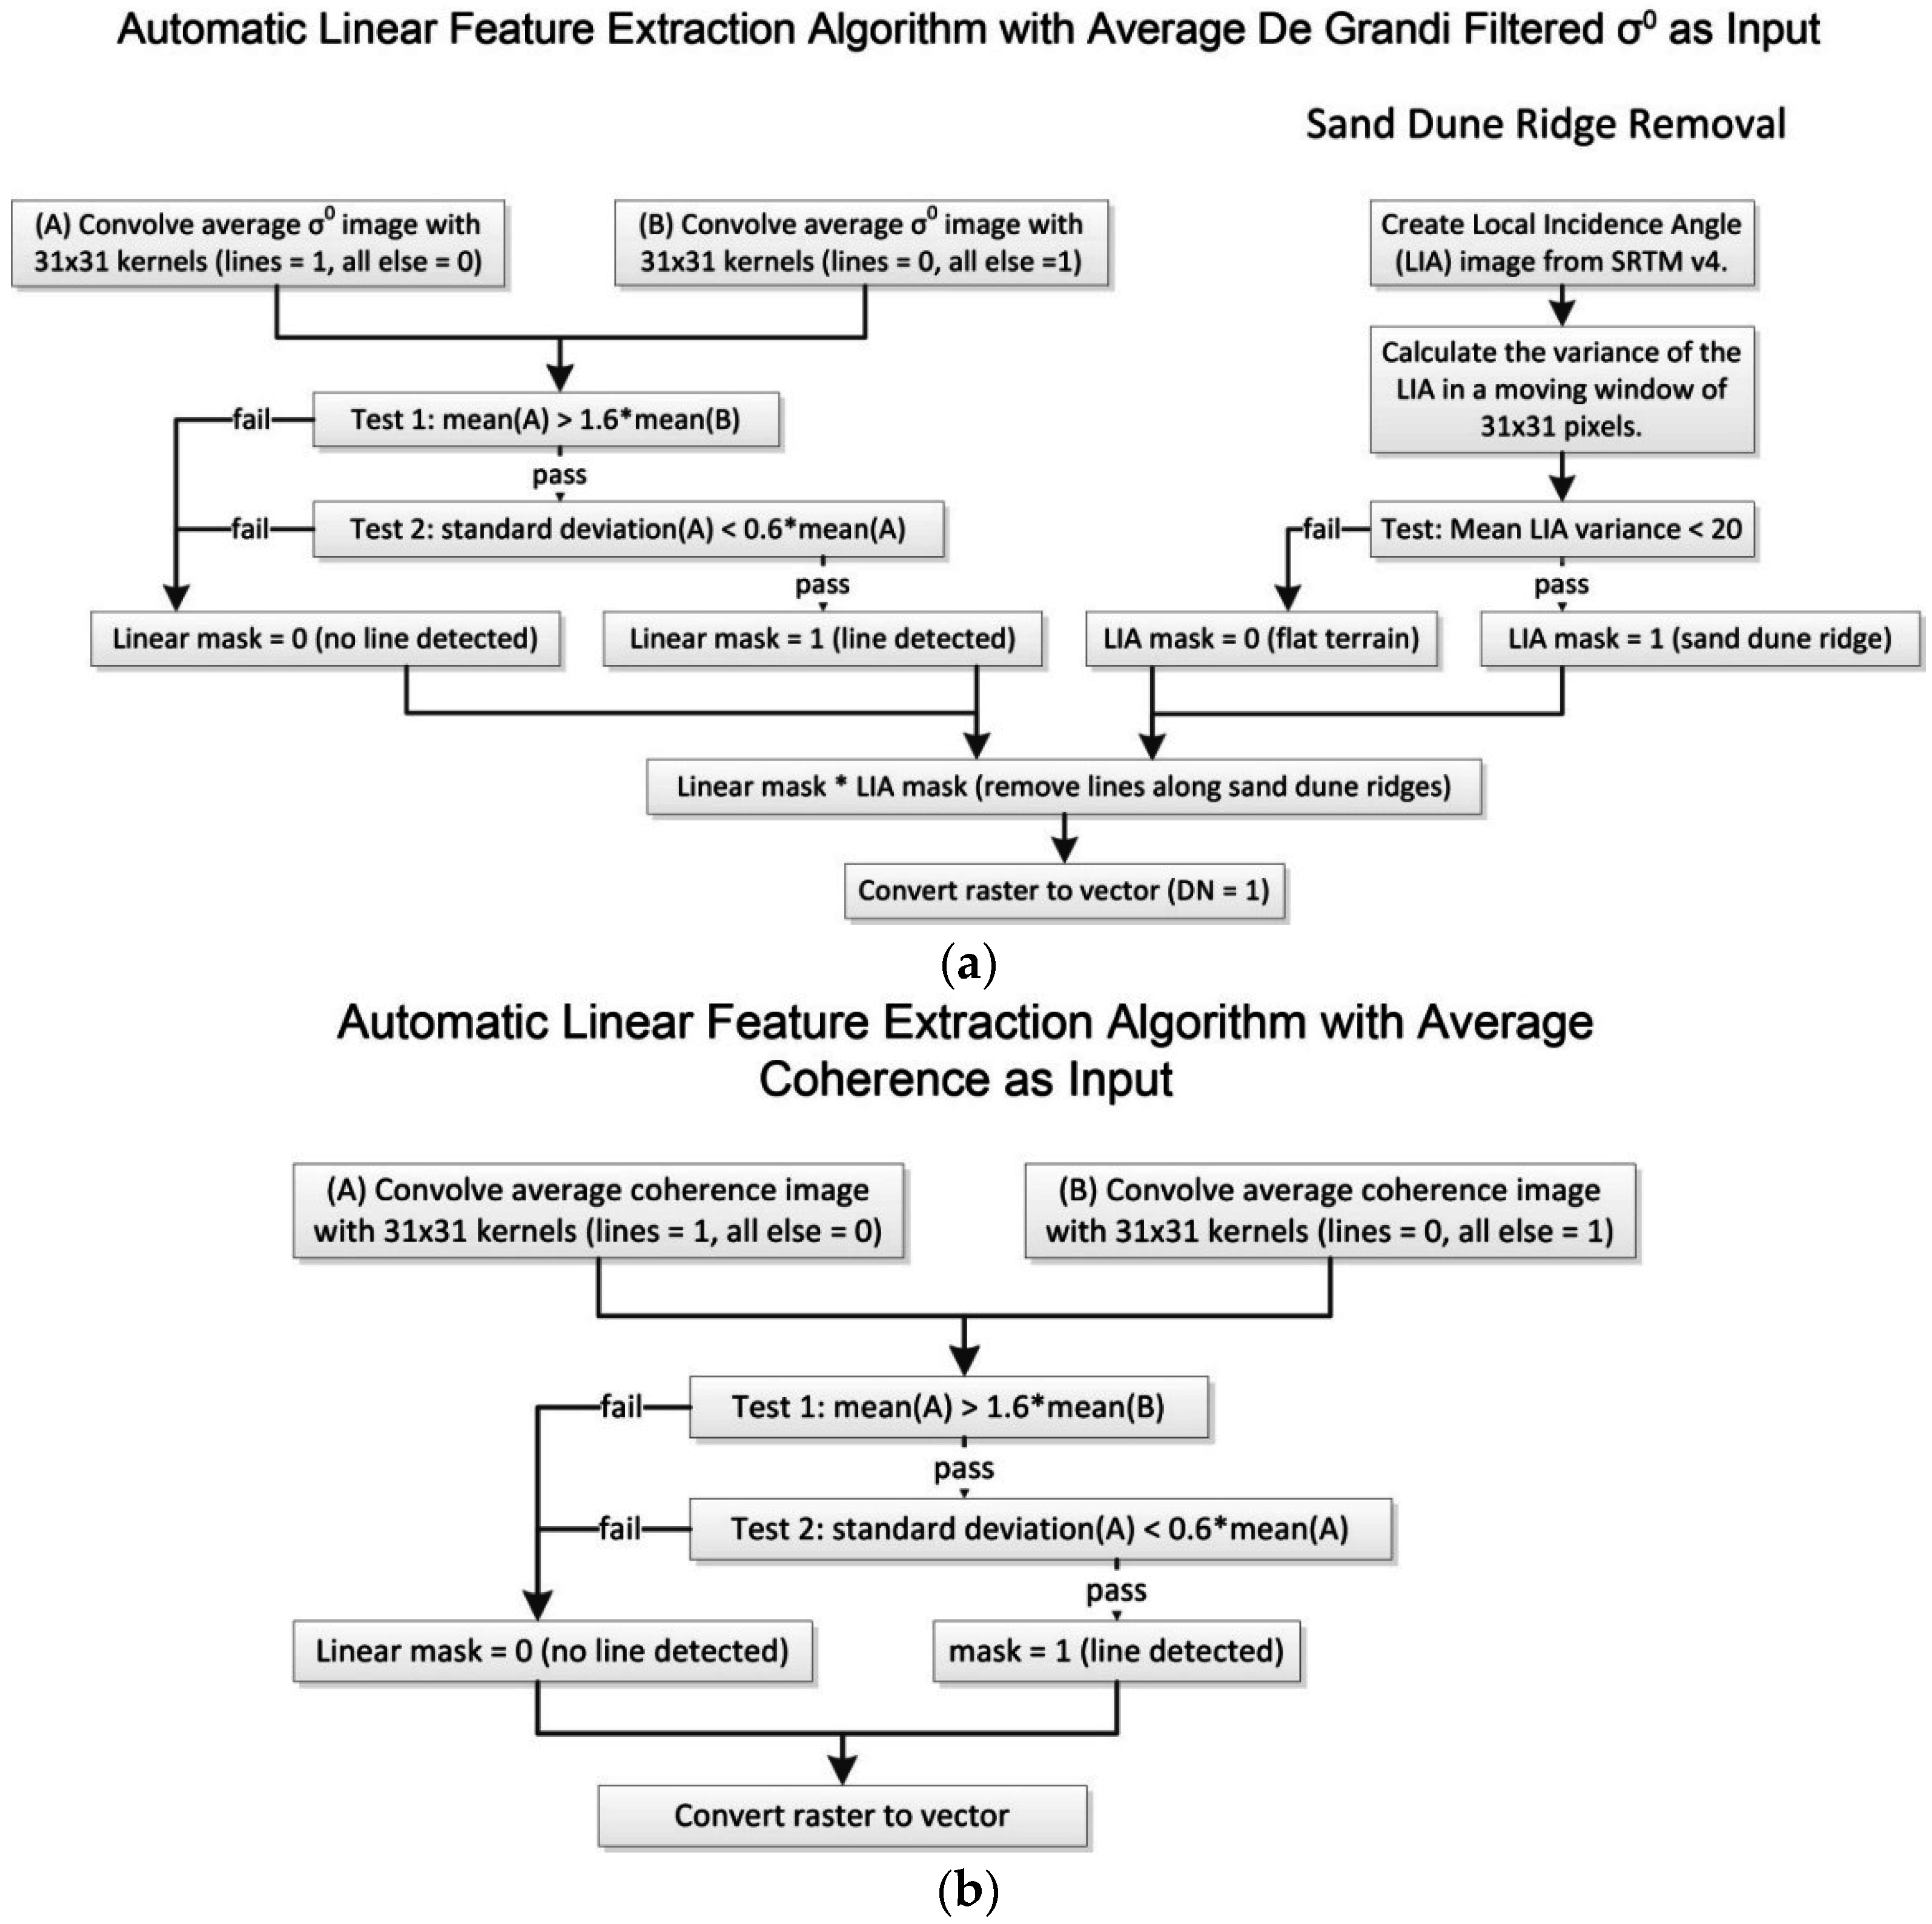
2.2. Extraction of Linear Features of High Backscatter over AOI 1

Many of the features of high relative backscatter in the area between the Wadi Tumilat and Gebel Maghara are in linear form. The backscatter properties of known natural linear objects (such as sand dune ridges) and artificial linear objects (such as roads and power cables) are very similar in the mosaic. A comparison of the mosaic with other information layers (optical imagery, geological charts, and WMS vector layers) revealed that many linear features correspond to roads or tracks. In some cases, these are very clearly visible in the optical remote sensing imagery and WMS vector layers. In other cases, they are only barely visible in some of the available VHR optical remote sensing imagery, such as that provided by Google Earth, and do not appear in any of the other vector or raster layers procured for the analysis. Assuming a user would be interested in extracting traces of man-made features from SAR imagery, a method would be required to separate these from natural features of high backscatter. Not all linear features of high backscatter necessarily correspond with routes. They may equally well be objects such as pipelines, military structures, thin metal fences, or cables that do not appear on infrastructure maps. These may be buried or at the surface, but too small to be visible in VHR optical imagery, yet cause high backscatter due to their geometry or dielectric properties. To facilitate interpretation of these features, first the abundant linear features corresponding to natural objects need to be removed. Next a spatial analysis of the remaining linear features needs to be undertaken to better determine from their course, and from other information layers, what they are, and whether they are buried or still in use. Such filtering and analysis can be performed more easily if the linear features are in vector format. This can be achieved by manually digitizing the linear features, but given their abundance, a more feasible approach would be to extract and convert them automatically. An automatic algorithm was thus devised to extract anthropogenic linear features of interest from the SAR imagery and convert them from raster to vector format.
The concept of the linear feature extraction algorithm is to detect man-made features in a desert region characterized by a relatively large area with similar land cover (such as the case of North Sinai), but recognizing that parts of the feature may be buried, eroded or for any other reason no longer visible in the satellite imagery, and that they are likely to wind and deviate from a straight line.
The algorithm (implemented in IDL and Matlab) has, as its base, a simple mathematical morphological filter, such as the type described in [55]. To detect long and possibly discontinuous linear features, a large kernel was used (31 × 31 pixels) without requiring all pixels in a particular orientation to detect the feature. Linear features, such as paths, clearly may not all follow a very straight line, but they are expected to cover distances beyond the length of the 31 pixel kernel. The basic filter functions as follows:
Pixels are compared iteratively along straight lines of all angles in a moving 31 × 31 pixel window with pixels outside each line in the same moving window. The pixel at the centre of this window is flagged as belonging to a line if two tests both result positive:
  • The mean value of pixels along a straight line of any orientation is greater than a threshold factor (1.6) multiplied by the mean value of pixels outside the line of the same orientation.
  • The standard deviation of pixels along a line of the same orientation is less than a second threshold (0.6).
Initially, the tests above were performed on the mosaic of average σ° backscatter. One problem encountered using this data as input was a difficulty in distinguishing the backscatter over apparently man-made linear features of interest from the backscatter over sand dunes. At small incidence angles, peak backscatter usually occurs at the incidence angle equal to the angle of repose of sand dunes [56]. Particularly for sand dunes oriented along the SAR azimuth direction, a line of bright pixels can be seen along the dunes. Having a line detection algorithm distinguish these from man-made linear features is particularly challenging. To overcome this problem, steep sand dunes were masked out by setting a threshold on the Local Incidence Angle variance over a moving window, calculated from the same SRTM DEM used for the terrain correction of the mosaic.
Results showed improved performance with the steep sand dunes masked out. In an attempt to improve further the results a different technique was attempted using interferometric coherence. Instead of taking the average σ° backscatter as input, the average interferometric coherence of all consecutive image acquisitions was used instead. The average coherence showed an even better distinction between bright linear features (high coherence) and surrounding sandy areas (low coherence). Moreover, the appearance of linear features over sand dunes was much less apparent. Consequently, the linear feature detection algorithm was applied instead to this dataset with greatly improved results, without the need for masking out sand dunes [25]. Figure 4a summarises the initial method applied with the average σ° backscatter as input, while Figure 4b shows the algorithmic steps of the final approach with average coherence as input.
Various standard edge and line detection algorithms were applied initially, including those based on the Hough Transform, e.g., [57], and on template matching [55], but it was found that for this particular area and dataset, the custom approaches outlined above (particularly with average coherence as input) proved the most effective at extracting the linear features whilst avoiding false positives arising from natural features. A drawback of the algorithm is that it is quite computationally demanding. It requires convolution with the SAR coherence image of 2 (for line = 1 and line = 0) × 61 (for all angles) × 31 × 31 pixel kernels.

2.3. Analysis of Geometric Features of Low Backscatter in AOI 2

The anomalies caused by low relative backscatter were confined to a relatively small area around the archaeological sites of Tell El-Farama, Tell El-Mahzan, and Tell El-Kanais (see Figure 1). Given the small scale of the features, it was considered appropriate to procure higher resolution datasets. A request was therefore made to the Japanese space agency (JAXA) to task acquisitions of PALSAR-2, in Spotlight mode, over the study area. Seven images were acquired in August and September 2015 (see Table 2, and Table S3 of the Supplementary Materials). Four of the images were acquired with an incidence angle of 49 degrees and three with an incidence angle of 40 degrees. All the images were acquired in descending node, right looking, and with HH polarization. The slant range pixel spacing of the images in Single Look Complex (SLC) format are 1.4 m in range and 0.9 m in azimuth.
The processing carried out on the time series of SLC imagery included the following:
  • Extraction of subset SLC images over the Tells
  • Multilooking: given the small variation in incidence angle, the same factor of 2 in azimuth could be applied to all images to produce a square ground range pixel spacing of approximately 2 m
  • Coregistration
  • De Grandi multitemporal speckle filtering
  • Geometric correction and calibration: geometric correction to geographic latitude/longitude, WGS 84, with a pixel spacing of 1.5 m. Calibration to σ ° (in both dB and linear units)
  • Extraction of the following images calculated from the entire filtered time series (in both dB and linear):
    a.
    Mean
    b.
    Standard deviation
    c.
    Gradient: maximum absolute variation between consecutive acquisition dates
    d.
    Maximum
    e.
    Minimum
    f.
    Span difference: difference between the maximum value and the minimum value of all input data
    g.
    Maximum increment between consecutive acquisition dates
    h.
    Maximum decrement between consecutive acquisition dates
    i.
    Span ratio: the ratio calculated between the maximum value and the minimum value of all input data
    j.
    Maximum ratio: maximum value (max backscatter increment) among all ratios calculated between consecutive acquisition dates
    k.
    Minimum ratio: minimum value (max backscatter decrement) among all ratios calculated between consecutive acquisition dates
    l.
    Mu Sigma: mean/standard deviation ratio
    m.
    Coefficient of variation: standard deviation/mean ratio
  • Average coherence generation (taking results of step 1 as input)
    a.
    Coregistration of SLC data for each incidence angle separately
    b.
    Coherence generation of consecutive acquisitions for each incidence angle stack
    c.
    Multilooking by the same factor as above
    d.
    Averaging multilooked coherence images within each stack
    e.
    Geometric correction to same map system as in step 5.
Steps 6 and 7 were also carried out on the PALSAR-1 FBS and FBD imagery, which had already been processed up to Step 5 for the mosaic. The purpose of Steps 6 and 7 was to determine whether any of these multitemporal techniques could enhance the visibility of features of low backscatter relative to surrounding areas. On the assumption that the low backscatter was caused by signal attenuation in sand, it was hoped that the contrast between volume scattering (over the low backscatter features) versus surface scattering (over surrounding areas) may be enhanced through time series analyses or through interferometric coherence.
All final imagery were analysed by the SatER team. Comparisons were made between the various results of the processing, together with optical remote sensing datasets (Pleiades, Kompsat-2, Sentinel-2, and imagery available on Google Earth). An interpretation of results has been provided, taking into account all previously published archaeological survey in the region. The archaeological chart produced by Jaritz, et al. [58] (see Section 4.2) was geocoded using a second-order polynomial, with manually collected Ground Control Points (GCPs) from the available geocoded EO imagery (Pleiades, Google Earth). The geocoded map could then be overlain onto the SAR and optical datasets. Results of the analysis and interpretation by the SatER team are provided in Section 4.2.

3. Results

Figure 5 shows the final mosaic of multitemporal speckle filtered and averaged PALSAR-1 backscatter. The Aeolian sand dune fields are characterised by very low backscatter, while higher backscatter is observed over the irrigated fields of the Nile Delta and over the exposed rock formations of Um Khushaib, Gebel Maghara, and Gebel el-Halal. In between Gebel Maghara, el-Halal, and Yelleq, there is a flat plateau where greatly varying levels of SAR backscatter correspond to varying rock and sand formations. Anthropogenic features, such as power cables, roads, and buildings are clearly visible as highly reflective targets.
Analysis of the mosaic using the combined expertise of SAR remote sensing, geological, and archaeological interpretation revealed the presence of a number of features characterised by high backscatter relative to surrounding areas that were not visible in other information layers, but visible in all the intermediate PALSAR mosaics of different dates. In particular around Gebel Maghara, but also elsewhere, there are many isolated patches and patterns of bright backscatter that have been interpreted as exposed or partially buried rocks, the surfaces of which may be rough relative to the L-band (23 cm) PALSAR-1 wavelength. These are perhaps not visible in any of the available optical imagery either because they are partially buried, or because their spectral signature in the visible domain is the same as surrounding sand. They are too small to appear on the available geological chart.
Some features are in the form of concentric circles (see Figure 6). It is tempting to interpret these as Bronze Age structures given that their shape is very similar to early Bronze Age sites, such as those illustrated in [59]. However, their scale in the SAR imagery is at least one order of magnitude larger (around 700 m while the early Bronze Age sites in [59] are from around 15 to 70 m), and therefore excludes this interpretation. They may be buried relics of military installations from past wars, such as the Six Day War [41].
Many linear features of high backscatter are clearly visible. A detailed discussion of these over a subset region is provided in Section 4.1. In a small coastal region to the northwest of the mosaic, a few interesting features of low relative backscatter were identified. An in-depth analysis and interpretation of these is provided in Section 4.2. Throughout the mosaic there are also many features that are not present in other information layers; these have been interpreted as image artefacts caused by sensor inconsistencies. They are discussed in Section 4.3.

4. Discussion

4.1. Focus on AOI 1 (Region East of Wadi Tumilat and West of Gebel Maghara)

The desert region that lies between the Wadi Tumilat and Gebel Maghara (AOI 1) (see Figure 7a) constitutes a sparsely developed hyperarid area, strategically located as a crossing point between routes and settlements that lie along the Wadi Tumilat and the plateau between the rock formations of Gebel Maghara and Gebel Yelleq. In this region the mosaic revealed many, particularly linear, anomaly features of higher backscatter than surrounding areas. These are in most cases identifiable in the PALSAR-1 images only after multitemporal filtering. This is probably due to their small scale and the background of high speckle characterised by the low Signal to Noise Ratio (SNR) of the SAR backscatter over sand. Interpretation of these features is very difficult, especially lacking ground truth and the difficulty in identifying the same features in, even VHR, optical remote sensing imagery. The purpose of the linear feature extraction was to facilitate such interpretation through conversion of these features to vector format to enable easier comparison with other information layers.
Figure 7b shows the PALSAR-1 mosaic of average σ° backscatter over AOI 1 where many linear features are evident, this was the first input to the linear feature extraction algorithm. Figure 7c shows the average PALSAR-1 coherence image. Here linear features are also evident, but the sand dune crests are less sharply defined, hence constituting a better input to the feature detection algorithm.
Figure 7d shows vector layers from Google Maps, Bing Maps, Open Street Map, and Apple iPhoto Map overlain on a Sentinel-2 image of AOI 1. Figure 7e shows the extracted linear features overlain on the same Sentinel-2 image of AOI 1. A comparison of Figure 7d,e shows that the majority of the WMS vectors correspond with extracted features. A few are very fragmented and some have not been extracted at all. Many more features have been extracted that do not correspond with any of the WMS vectors.
Using the history slider of Google Earth it was possible to view VHR optical imagery available in most of the area from both 2007 to 2010 (e.g., Figure 7f), which corresponded well with the PALSAR-1 time series (also from 2007 to 2010). Careful comparison of the extracted features that are not present on any of the considered WMS layers with the available optical imagery reveals in many cases the presence of partially buried unpaved roads (e.g., Figure 7f). Sand drift and dune migration covering infrastructure is a common problem throughout the region, e.g., [28,47]. Dune migration has been studied and quantified in this area recently by Hermas, Leprince and El-Magd [28], who detected lateral movements along the crest lines of linear dunes of up to 20 m per year. Often the extracted features do not correspond with any of the VHR optical or vector layers, despite their clear appearance in all multitemporal filtered PALSAR-1 images in the time series. In these cases the linear features may correspond with many objects that could produce a high backscatter in SAR data, but remain invisible in, even VHR, optical imagery. These could include, for example, buried or unburied metal cables, fences, pipelines, un-paved roads (with similar colour to surrounding sand), buried paved roads, and similar objects.

4.2. Focus on AOI 2 (Area of Tell El-Farama, Tell El-Mahzan, and Tell El-Kanais)

Analysis of the mosaic revealed a number of anomaly features characterized by low backscatter relative to surrounding areas in the coastal desert near the eastern Nile Delta and Mediterranean coast, around the archaeological sites of Tell El-Farama, Tell El-Mahzan, and Tell El-Kanais (see Figure 8a). These archaeological sites lie at the mouth of the now extinct Pelusiac branch of the Nile [60]. The area was first occupied around the fourth to third centuries BCE and was eventually abandoned around the seventh century CE [58]. Tell El-Farama (also known by its Roman name of Pelusium) flourished in Ptolemaic and Greco-Roman times, during which it was the most important harbour in Egypt after Alexandria [61]. The silting up of the Pelusiac branch of the Nile and coastline migration would have influenced the region in ancient times [60] and may have contributed to its decline. The present geographical setting is that of a coastal desert with isolated sabkhas (mud flats). The soil in the area of Tell el-Farama, Tell el-Mahzan, and Tell el-Kanais comprises silt and sand, covered in places with salt crusts [58].
The Tells have been studied during several field expeditions, particularly in the early 1990s, in the framework of the North Sinai Salvage Project for the el-Salaam Canal [62,63] and, more recently, by a joint Polish–Egyptian archaeology mission [64]. While these expeditions shed more light on the Ptolemaic, Roman, and Byzantine periods, which represent the golden age of the region, most of the area still remains unexcavated [61]. The large extent of the area represents one challenge for archaeological surveying; another is the difficulty of access for security reasons, particularly in recent times.
Some studies have applied optical remote sensing techniques to study the wider context to aid archaeological research: for example, Marcolongo [62] used SPOT and SOYOUZ satellite imagery to identify Holocene geomorphic features in the surrounding region related to archaeological sites, and Moshier and El-Kalani [60] used CORONA optical satellite imagery to investigate the paleogeography of the region in relation to the ancient Ways of Horus. SAR analysis of the area has been undertaken for the first time by Stewart, Lasaponara and Schiavon [19], who interpreted a number of anomaly features as possible archaeological structures in PALSAR-1 FB and Polarimetric images.
The anomalies visible in this region in the PALSAR-1 mosaic are in the form of patches of low backscatter (see ellipses in Figure 8b), some of which seem to be arranged into geometric shapes (especially ellipses 1 and 2 of Figure 8b). As this area lies near the coast, and was covered only by a small part of frame 610, initially only two PALSAR-1 FBD images were procured for the mosaic (see Section 2.1). The anomalous features were already visible on these images. Once it was decided to focus analysis in this area, the remaining stack of PALSAR-1 FBS and FBD data over track 607 and frame 610, listed in Table 1, were obtained. An initial interpretation of features visible in this imagery is reported in [19].
Out of the PALSAR-1 imagery, of all the processed images, the anomaly features were most clearly visible in the mean of the multitemporal De Grandi speckle filtered images, calibrated to σ° and converted to decibel (which corresponds to the mosaic image) (see Figure 8b). Out of the processed PALSAR-2 Spotlight imagery, the anomalous features were most clearly visible in the coefficient of variation (CoV) of the multitemporal De Grandi speckle filtered images as areas of lower CoV (see Figure 8c). The CoV did not yield good results in the PALSAR-1 time series, perhaps due to the presence of artefacts. Several of the images had a band of varying backscatter across the centre of the image, similar in width to the Radio Frequency Interference (RFI) patterns shown in Section 4.3. A number of bright linear features in all SAR images of the area are likely to be range ambiguities originating from the high backscatter of irrigated field boundaries to the west of the area of the Tells.
The anomalous features are less discernible in the optical remotely sensed imagery procured for the analysis (see Table 3 [65,66,67] and Figure 8d,e).
Over the areas of Tell El-Mahzan and Tell El-Kanais, the SAR response was compared with the archaeological ground truth data published by [58]. Continuing the work of others, in particular [68], Jaritz, Favre, Nogara, Rodziewicz and Carrez-Maratray [58] published a map showing the distribution of anthropogenic surface remains identified by field walking in the region of Tell el-Mahzan and Tell el-Kanais, east of Tell el-Farama. Figure 8d shows the coverage of this map overlain on a Sentinel-2 image. Figure 8e–g show a Pleiades image covering the same area as the map, the CoV of the De Grandi filtered PALSAR-2 imagery also covering the same area, and the map itself, respectively. On this map, the density of anthropogenic material, including brick, ceramic, glass, metal, bone, etc. were divided into four classes of increasing density. Jaritz, Favre, Nogara, Rodziewicz and Carrez-Maratray [58] observed that one of the most interesting outcomes of the resulting map is that the density of anthropogenic material seems to be clustered in a number of islands. These islands have in some cases been tentatively classified according to the type of material found, such as a necropolis or a residential area. Some of the islands are connected, such as by an ancient road identified in the survey. A full description of each island is given in [58]. A possible interpretation as to why anthropogenic remains seem to be clustered in these islands is also given by Jaritz, Favre, Nogara, Rodziewicz and Carrez-Maratray [58], who suggest the areas in between may have been ancient lagoons, swamps, and river branches, leaving patches of dry ground in between that were more attractive for human settlement.
Both the PALSAR-1 mean backscatter and PALSAR-2 CoV images largely show the same pattern of islands as in the archaeological chart, which in most cases appear darker than the spaces in between. If the interpretation of Jaritz, Favre, Nogara, Rodziewicz and Carrez-Maratray [58] is correct, a possible reason for this may be that the former inundated areas in between the islands may still have moisture present beneath the surface. This moisture may cause a higher SAR backscatter response due to the increased relative permittivity [6] than the dryer areas apparently favoured by humans in antiquity and may explain the clarity of features in the PALSAR-1 mean backscatter. The dryer areas would attenuate the SAR backscatter and also reduce the backscatter variation, which may explain the clarity of features in the CoV of the PALSAR-2 imagery.
The interpretation by Jaritz, Favre, Nogara, Rodziewicz and Carrez-Maratray [58] of the various islands of anthropogenic material mapped as a result of the field walking survey is summarised in the four ellipses highlighted in Figure 8b–g. Over the islands in ellipse 1 many surface remains of bricks have been found. The additional presence of slag and glass leads to the interpretation that some of these areas may have been occupied by craft workshops. Over the islands in ellipse 2, the strong concentration of fragmented building material may indicate that these were urban areas. The long feature in the top right of this area (island 28) may have been a necropolis, given the remains on the surface of offerings and human bones. The islands to the right of ellipse 3 are also likely to be necropoli, while to the left, modern works prior to the survey inhibited interpretation and only a low density of archaeological remains were found. The area in ellipse 4 was also seriously altered by works prior to the survey, in the form of modern terracing. However, the passage of water between the islands has been noted and interpreted as canals, which could have archaeological significance Jaritz, Favre, Nogara, Rodziewicz and Carrez-Maratray [58].

4.3. Image Artefacts

Throughout the PALSAR-1 and PALSAR-2 imagery there are many features that are not present in other information layers; these have been interpreted as image artefacts. Most of these do not appear the same way in the individual PALSAR-1 and 2 images. Some of these artefacts are likely to be range or azimuth ambiguities [69], while others may be due to Radio Frequency Interference (RFI) [70]. RFI is very high in this region [71], and particularly affects long wavelength SAR [70]. A few scenes of PALSAR-1 and 2 polarimetric data were available over some parts of the study area. In some cases, RFI can be identified in this polarimetric data as variations of backscatter in the two cross-polarised channels of Vertical transmit and Horizontal receive (VH) and Horizontal transmit and Vertical receive (HV). For monostatic SAR systems (such as PALSAR-1 and 2), where the transmitting and receiving antennas are collocated, the reciprocity constrains the scattering matrix to be symmetrical and the transmitted to received power ratios should be identical for HV and VH [72]. If there is a difference in backscatter between the two, it means that polarised radiation is being received by the SAR antenna from an external source, which is the case with RFI. Figure 9 shows the probable presence of RFI in a region of the mosaic from the varying response in HV and VH backscatter. Figure 9a shows the location of a subsetted polarimetric PALSAR-1 image in relation to the PALSAR-1 mosaic (note that it includes the subset of the Tells). Figure 9b is the backscatter amplitude in HV, while Figure 9c is the backscatter amplitude in VH. Note that the backscatter varies between the two images. This is likely due to RFI.

5. Conclusions

The sensitivity of microwave radiation to surface roughness and dielectric properties can be exploited to provide unique information about surface and subsurface objects in desert environments [5]. Longer wavelength SAR has increased penetration capability when compared to shorter wavelengths [6], and can thus provide information on subsurface features at greater depths. SAR can also provide a clear distinction of surface features if their roughness and composition causes a sufficiently high backscatter to contrast with the attenuated signal in the surrounding sand.
Techniques have been implemented to extract anthropogenic features in the desert region of North Sinai using PALSAR-1 and 2 data. To obtain a synoptic view over the study area, a mosaic of average De Grandi filtered PALSAR-1 σ° backscatter of North Sinai was produced. Many features of high relative backscatter in the desert sand were detected, while over a coastal mudflat, features of low relative backscatter were observed. The De Grandi speckle filtering made an enormous difference in the ability to distinguish features given the high amount of speckle due to the low signal to noise ratio of sand covered areas. Speckle filtering in the temporal domain reduced speckle while preserving spatial resolution. This is preferable when permanent, small-scale features are of interest in an area of largely homogeneous and unchanging land cover. Two subset regions were selected for further analysis: The first included an area of abundant linear features of high relative backscatter in a strategic, but sparsely developed area between the Wadi Tumilat and Gebel Maghara. The second included an area of low backscatter anomaly features in a coastal sabkha around the archaeological sites of Tell el-Farama, Tell el-Mahzan, and Tell el-Kanais.
Over the subset region between the Wadi Tumilat and Gebel Maghara, algorithms were developed to extract linear features and convert them to vector format to facilitate interpretation. The algorithms were based on mathematical morphology, but to distinguish apparent man-made features from sand dunes, several techniques were applied. The first technique took as input the average σ° backscatter and used a DEM-derived LIA mask to exclude sand dune ridges. The second technique, which proved more effective, used the average interferometric coherence as input, no longer necessitating a mask given that there was no longer an ambiguity between sand dune ridges and anthropogenic linear features. Interpretation of extracted features revealed partially buried infrastructure that was not present in any of the available vector layers, and was difficult, and in some cases impossible, to distinguish in available optical imagery or any other non-SAR information layers obtained for the comparison.
Over the small coastal region including the archaeological sites of Tell El-Farama, Tell El-Mahzan, and Tell El-Kanais, some features of low relative backscatter were identified. To enable better distinction and interpretation of these, a time series of VHR PALSAR-2 Spotlight imagery was acquired with a ground range pixel spacing of 2 m. Moreover, a comprehensive analysis was carried out with other VHR remote sensing datasets and results of ground surveys. Processing of the PALSAR-2 imagery revealed better distinction of features in the CoV of De Grandi filtered backscatter intensity, while with the PALSAR-1 data, features were better revealed in the mean De Grandi filtered intensity. The reason for the difference may be due to image artefacts, including suspected range ambiguities in the PALSAR-2 data, and RFI in the PALSAR-1 data. Both techniques can enhance areas of greater signal attenuation, which was the explanation given for the cause of the anomaly features. A comparison of the SAR data was made with an archaeological chart of the same area produced by Jaritz, Favre, Nogara, Rodziewicz and Carrez-Maratray [58]. A possible interpretation of the features is that they are local areas that in the past may have been islands of dry land surrounded by lagoons, rivers and swamplands. These areas may have been more favourable to settlement, which would explain the higher density of archaeological finds. It is suggested that there may still be a difference in soil moisture between the features and surrounding areas sufficient to be detected in processed SAR imagery, but not visible in optical remote sensing data.
Regular systematic and large scale survey of North Sinai remains a challenge. The inhospitable terrain and political instability [42] hinders access. Moreover, sand drift and dune migration affecting much of North Sinai can rapidly bury modern structures [28,47] or ancient sites that may have been excavated in the past [46]. The use of long wavelength (L-band) spaceborne SAR could be a promising tool for regular survey of large areas for man-made structures. However, if it is to be applied operationally to extract specific features of interest, ground truth validation would be essential. Also, other datasets would likely be vital to aid interpretation. This is particularly in view of the many artefacts that can be present in SAR data, including range and azimuth ambiguities and RFI. The area of North Sinai is particularly prone to RFI [71].

Supplementary Materials

The following are available online at www.mdpi.com/2072-4292/8/10/825/s1, Table S1: PALSAR-1 FBD Scene IDs, Table S2: PALSAR-1 FBS Scene IDs, Table S3: PALSAR-2 Scene IDs.

Acknowledgments

The PALSAR-1, Pleiades, and MERIS data were obtained through the ESA Category-1 (research) project C1F11458. The Copernicus Sentinel-2 data was also provided by ESA through the Sentinels Scientific Data Hub. The PALSAR-2 data was obtained through the 4th JAXA Research Agreement for ALOS-2. Imagery was obtained from Google Earth Pro. The archaeological chart was produced by Jaritz, Favre, Nogara, Rodziewicz and Carrez-Maratray [58]. Processing was carried out with the SARscape software (versions 5.0 to 5.2) and IDL (version 8.2). The authors gratefully acknowledge the help and support of the Sarmap team for the SAR data processing.

Author Contributions

Christopher Stewart conceived the research and carried out all remote sensing data processing with the help of Sarmap SA, in particular Paolo Riccardi. Rosanna Montanaro conducted the majority of the archaeological analysis and interpretation over the area of Tell El-Farama, Tell El-Mahzan, and Tell El-Kanais. Maura Sala contributed overall archaeological expertise, in particular for desert road archaeology and analysis of the subset region east of the Wadi Tumilat and west of Gebel Maghara.

Conflicts of Interest

The authors declare no conflict of interest.

References

  1. Giardino, M.J. A history of NASA remote sensing contributions to archaeology. J. Archaeol. Sci. 2011, 38, 2003–2009. [Google Scholar] [CrossRef]
  2. Agapiou, A.; Lysandrou, V. Remote sensing archaeology: Tracking and mapping evolution in European scientific literature from 1999 to 2015. J. Archaeol. Sci. Rep. 2015, 4, 192–200. [Google Scholar] [CrossRef]
  3. Wiseman, J.; El-Baz, F. Remote Sensing in Archaeology. Interdisciplinary Contributions to Archaeology; Springer: New York, NY, USA, 2007.
  4. Chen, F.; Masini, N.; Yang, R.; Milillo, P.; Feng, D.; Lasaponara, R. A space view of radar archaeological marks: First applications of COSMO-SkyMed X-band data. Remote Sens. 2015, 7, 24–50. [Google Scholar] [CrossRef]
  5. Paillou, P.; Lopez, S.; Farr, T.; Rosenqvist, A. Mapping subsurface geology in Sahara using l-band SAR: First results from the ALOS/PALSAR imaging radar. IEEE J. Sel. Top. Appl. Earth Obs. Remote Sens. 2010, 3, 632–636. [Google Scholar] [CrossRef]
  6. Ulaby, T.; Moore, K.; Fung, K. Microwave Remote Sensing. Volume I: Microwave Remote Sensing Fundamentals and Radiometry; Artech House: Norwood, MA, USA, 1981; Volume 1. [Google Scholar]
  7. Ulaby, T.; Moore, K.; Fung, K. Microwave Remote Sensing. Volume II: Radar Remote Sensing and Surface Scattering and Emission Theory; Addison Wesley: New York, NY, USA, 1982; Volume 2. [Google Scholar]
  8. Farr, T.G.; Elachi, C.; Hartl, P.; Chowdhury, K. Microwave penetration and attenuation in desert soil-A field experiment with the shuttle imaging radar. IEEE Trans. Geosci. Remote Sens. 1986, GE-24, 590–594. [Google Scholar] [CrossRef]
  9. Roth, L.E.; Elachi, C. Coherent electromagnetic losses by scattering from volume inhomogeneities. IEEE Trans. Antennas Propag. 1975, 23, 674–675. [Google Scholar] [CrossRef]
  10. McCauley, J.F.; Schaber, G.G.; Breed, C.S.; Grolier, M.J.; Haynes, C.V.; Issawi, B.; Elachi, C.; Blom, R. Subsurface valleys and geoarcheology of the eastern Sahara revealed by shuttle radar. Science 1982, 218, 1004–1020. [Google Scholar] [CrossRef] [PubMed]
  11. Schaber, G.G.; McCauley, J.F.; Breed, C.S. The use of multifrequency and polarimetric SIR-C/X-SAR data in geologic studies of Bir Safsaf, Egypt. Remote Sens. Environ. 1997, 59, 337–363. [Google Scholar] [CrossRef]
  12. Paillou, P.; Grandjean, G.; Baghdadi, N.; Heggy, E.; August-Bernex, T.; Achache, J. Subsurface imaging in south-central Egypt using low-frequency radar: Bir Safsaf revisited. IEEE Trans. Geosci. Remote Sens. 2003, 41, 1672–1684. [Google Scholar] [CrossRef]
  13. McHugh, W.P.; Breed, C.S.; Schabers, G.G.; McCauley, J.F.; Szabo, B.J. Acheulian sites along the “radar rivers,” southern Egyptian Sahara. J. Field Archaeol. 1988, 15, 361–379. [Google Scholar] [CrossRef]
  14. Holcomb, D.W. Imaging radar and archaeological survey: An example from the Gobi Desert of southern Mongolia. J. Field Archaeol. 2001, 28, 131–141. [Google Scholar] [CrossRef]
  15. McCauley, J.F.; Breed, C.S.; Schaber, G.G.; McHugh, W.P.; Issawi, B.; Haynes, C.V.; Grolier, M.J.; Kilani, A.E. Paleodrainages of the eastern Sahara-the radar rivers revisited (Sir-A/B implications for a Mid-Tertiary Trans-Afnrcan Drainage System). IEEE Trans. Geosci. Remote Sens. 1986, GE-24, 624–648. [Google Scholar] [CrossRef]
  16. Stern, R.J.; Abdelsalam, M.G. The origin of the great bend of the Nile from Sir-C/X-Sar imagery. Science 1996, 274, 1696–1698. [Google Scholar] [CrossRef] [PubMed]
  17. El-Baz, F. Groundwater concentration beneath sand fields in the western desert of Egypt: Indications by radar images from space. Egypt. J. Remote Sens. Space Sci. 1999, 1, 1–24. [Google Scholar]
  18. Gaber, A.; Koch, M.; Griesh, M.H.; Sato, M.; El-Baz, F. Near-surface imaging of a buried foundation in the western desert, Egypt, using space-borne and ground penetrating radar. J. Archaeol. Sci. 2013, 40, 1946–1955. [Google Scholar] [CrossRef]
  19. Stewart, C.; Lasaponara, R.; Schiavon, G. ALOS PALSAR analysis of the archaeological site of Pelusium. Archaeol. Prospect. 2013, 20, 109–116. [Google Scholar] [CrossRef]
  20. Linck, R.; Busche, T.; Buckreuss, S.; Fassbinder, J.; Seren, S. Possibilities of archaeological prospection by high-resolution x-band satellite radar—A case study from Syria. Archaeol. Prospect. 2013, 20, 97–108. [Google Scholar] [CrossRef]
  21. Patruno, J.; Dore, N.; Crespi, M.; Pottier, E. Polarimetric multifrequency and multi-incidence SAR sensors analysis for archaeological purposes. Archaeol. Prospect. 2013, 20, 89–96. [Google Scholar] [CrossRef]
  22. Blom, R.; Hedges, G. Space technology and the discovery of the lost city of Ubar. In Proceedings of the IEEE Aerospace Conference, Snowmass, Aspen, USA, 13 February 1997; pp. 19–28.
  23. Comer, D.C.; Blom, R.G. Detection and identification of archaeological sites and features using synthetic aperture radar (SAR) data collected from airborne platforms. In Remote Sensing in Archaeology; Springer: New York, NY, USA, 2006; pp. 103–136. [Google Scholar]
  24. Stewart, C.; Lemmens, K.; Sala, M. Satellite radar in support to archaeological research in Egypt: Tracing ancient tracks between Egypt and southern Levant across north Sinai. In Egyptian Curses 2. A Research on Ancient Catastrophes; Capriotti Vittozzi, G., Ed.; Consiglio Nazionale Delle Ricerche (CNR), Istituto Di Studi Sul Mediterraneo Antico (ISMA): Rome, Italy, 2015; pp. 197–221. [Google Scholar]
  25. Stewart, C.; Lemmens, K.; Sala, M.; Vittozzi, G.C. A contribution of satellite radar to archaeological research in north Sinai, Egypt. In Archaeological Heritage & Multidisciplinary Egyptological Studies (AHMES); Consiglio Nazionale Delle Ricerche Istituto di Studi Sul Mediterraneo Antico: Rome, Italy, 2016; Volume 3, p. 11. [Google Scholar]
  26. Sever, T.L.; Irwin, D.E. Landscape archaeology: Remote-sensing investigation of the ancient Maya in the Peten rainforest of northern Guatemala. Anc. Mesoam. 2003, 14, 113–122. [Google Scholar] [CrossRef]
  27. Evans, D.; Pottier, C.; Fletcher, R.; Hensley, S.; Tapley, I.; Milne, A.; Barbetti, M. A comprehensive archaeological map of the world’s largest preindustrial settlement complex at Angkor, Cambodia. Proc. Natl. Acad. Sci. USA 2007, 104, 14277–14282. [Google Scholar] [CrossRef] [PubMed]
  28. Hermas, E.; Leprince, S.; El-Magd, I.A. Retrieving sand dune movements using sub-pixel correlation of multi-temporal optical remote sensing imagery, northwest Sinai Peninsula, Egypt. Remote Sens. Environ. 2012, 121, 51–60. [Google Scholar] [CrossRef]
  29. Siegal, Z.; Tsoar, H.; Karnieli, A. Effects of prolonged drought on the vegetation cover of sand dunes in the NW Negev Desert: Field survey, remote sensing and conceptual modeling. Aeolian Res. 2013, 9, 161–173. [Google Scholar] [CrossRef]
  30. Gad, M.; Zeid, S.; Khalaf, S.; Abdel-Hamid, A.; Seleem, E.; El Feki, A. Optimal management of groundwater resources in arid areas case study: North Sinai, Egypt. Water Resour. 2015, 42, 535–552. [Google Scholar] [CrossRef]
  31. Mumford, G. The Sinai Peninsula and its environs: Our changing perceptions of a pivotal land bridge between Egypt, the Levant, and Arabia. J. Anc. Egypt. Interconnect. 2015, 7, 1–24. [Google Scholar]
  32. Oren, E.D. Early Bronze Age settlement on northern Sinai: A model for Egypto-Canaanite interconnections. In L’urbanisation de la Palestine à l’âge du Bronze Ancien. Bilan et Perspectives des Recherches Actuelles. Actes du Colloque d’emmaüs (20–24 Octobre 1986); de Miroschedji, P., Ed.; British Archaeological Reports–International Series: Oxford, UK, 1989; Volume 527, pp. 389–405. [Google Scholar]
  33. Oren, E.D. The “ways of horus” in north Sinai. In Egypt, Israel, Sinai: Archaeological and Historical Relationships in the Biblical Period; Rainey, A.F., Ed.; Tel Aviv University Press: Tel Aviv, Israel, 1987; pp. 69–119. [Google Scholar]
  34. Hoffmeier, J.K.; Moshier, S.O. “A highway out of Egypt”: The main road from Egypt to Canaan. In Desert Road Archaeology in Ancient Egypt and Beyond; Riemer, H., Förster, F., Eds.; Heinrich-Barth-Institut: Koln, Germany, 2013; pp. 485–510. [Google Scholar]
  35. Abdel-Motelib, A.; Bode, M.; Hartmann, R.; Hartung, U.; Hauptmann, A.; Pfeiffer, K. Archaeometallurgical expeditions to the Sinai Peninsula and the eastern desert of Egypt (2006, 2008). Metalla (Bochum) 2012, 19, 56. [Google Scholar]
  36. Hoffmeier, J.K. Sinai in Egyptian, Levantine and Hebrew (biblical) perspectives. In The History of the Peoples of the Eastern Desert; Barnard, H., Duistermaat, K., Eds.; Cotsen Institute of Archaeology: Los Angeles, CA, USA, 2012; Volume Monograph 73, pp. 105–124. [Google Scholar]
  37. Tassie, G.J.; van Wetering, J.F.L. The wadi tumilat. In Encyclopedia of Ancient History; Bagnall, R.S., Brodersen, K., Champion, C.B., Erskine, A., Huebner, S.R., Eds.; Wiley-Blackwell: Oxford, UK, 2012; pp. 7035–7036. [Google Scholar]
  38. Hoffmeier, J.K. The exodus and wilderness narratives. In Ancient Israel’s History: An Introduction to Issues and Sources; Arnold, B.T., Hess, R.S., Eds.; Baker Academic: Grand Rapids, MI, USA, 2014; pp. 46–90. [Google Scholar]
  39. Mourad, A.L. The procession of Asiatics. In Beni Hassan. Volume I: The Tomb of Khnumhotep II; Kanawati, N., Evans, L., Eds.; Reports 36; Aris and Phillips: Oxford, UK, 2014; pp. 72–78. [Google Scholar]
  40. Beit-Arieh, I. Archaeology of Sinai: The Ophir Expedition; Emery and Claire Yass Publications in Archaeology: Tel Aviv, Israel, 2003; Volume 21. [Google Scholar]
  41. Dunstan, S. The Six Day War 1967: Sinai; Bloomsbury Publishing: New York, NY, USA, 2012. [Google Scholar]
  42. Gold, Z. Security in the Sinai: Present and Future; ICCT Research Paper; International Centre for Counter-Terrorism: The Hague, The Netherlands, 2014. [Google Scholar]
  43. Oren, E.D. North Sinai survey 1972–1978. In Sinai in Antiquity; Meshel, Z., Finkelstein, I., Eds.; Hakkibutz Hameu-Chad (Hebrew): Tel Aviv, Israel, 1980; pp. 101–158. [Google Scholar]
  44. Arthur, P.; Oren, E.D. The north Sinai survey and the evidence of transport amphorae for roman and byzantine trading patterns. J. Rom. Archaeol. 1998, 11, 193–212. [Google Scholar] [CrossRef]
  45. Valbelle, D. Recherches archéologiques récentes dans le nord-sinaï. Comptes Rendus Séances l’Académie Inscriptions Belles-Lettres 1989, 133, 594–607. [Google Scholar] [CrossRef]
  46. Di Iorio, A.; Straccia, N.; Carlucci, R. Advancement in automatic monitoring and detection of archaeological sites using a hybrid process of Remote Sensing, GIS techniques and a shape detection algorithm. In Proceedings of the 30th EARSeL Symposium, Paris, France, 31 May–4 June 2010; pp. 53–63.
  47. Misak, R.; Draz, M. Sand drift control of selected coastal and desert dunes in Egypt: Case studies. J. Arid Environ. 1997, 35, 17–28. [Google Scholar] [CrossRef]
  48. JAXA. DAICHI (ALOS) Operation Completion. Available online: http://global.jaxa.jp/press/2011/05/20110512_daichi_e.html (accessed on 2 June 2016).
  49. De Grandi, G.; Leysen, M.; Lee, J.; Schuler, D. Radar reflectivity estimation using multiple SAR scenes of the same target: Technique and applications. In Proceedings of the 1997 IEEE International Geoscience and Remote Sensing, IGARSS’97. Remote Sensing—A Scientific Vision for Sustainable Development, Singapore, 3–8 August 1997; pp. 1047–1050.
  50. Aspert, F.; Bach-Cuadra, M.; Cantone, A.; Holecz, F.; Thiran, J.-P. Time-varying segmentation for mapping of land cover changes. In Proceedings of the ENVISAT Symposium, Montreux, Switzerland, 23–27 April 2007.
  51. Quegan, S.; Le Toan, T.; Yu, J.J.; Ribbes, F.; Floury, N. Multitemporal ERS SAR analysis applied to forest mapping. IEEE Trans. Geosci. Remote Sens. 2000, 38, 741–753. [Google Scholar] [CrossRef]
  52. Tachikawa, T.; Kaku, M.; Iwasaki, A.; Gesch, D.B.; Oimoen, M.J.; Zhang, Z.; Danielson, J.J.; Krieger, T.; Curtis, B.; Haase, J. Aster Global Digital Elevation Model Version 2—Summary of Validation Results; NASA Land Processes Distributed Active Archive Center: Sioux Falls, SC, USA, 2011.
  53. Mukul, M.; Srivastava, V.; Mukul, M. Accuracy analysis of the 2014–2015 Global Shuttle Radar Topography mission (SRTM) 1 arc-sec C-Band height model using international Global Navigation Satellite System Service (IGS) network. J. Earth Syst. Sci. 2016, 125, 909–917. [Google Scholar] [CrossRef]
  54. Ulaby, F.T.; Dobson, M.C. Handbook of Radar Scattering Statistics for Terrain; Artech House: Norwood, MA, USA, 1989; p. 500. [Google Scholar]
  55. Quackenbush, L.J. A review of techniques for extracting linear features from imagery. Photogramm. Eng. Remote Sens. 2004, 70, 1383–1392. [Google Scholar] [CrossRef]
  56. Blom, R.; Elachi, C. Multifrequency and multipolarization radar scatterometry of sand dunes and comparison with spaceborne and airborne radar images. J. Geophys. Res. B 1987, 92, 7877–7889. [Google Scholar] [CrossRef]
  57. Iisaka, J.; Sakurai-Amano, T.; Lukowski, T.I. Automated detection of road intersections from ERS-1 SAR imagery. In Proceedings of the International Geoscience and Remote Sensing Symposium, IGARSS’95, ‘Quantitative Remote Sensing for Science and Applications’, Firenze Italy, 10–14 July 1995; pp. 676–678.
  58. Jaritz, H.; Favre, S.; Nogara, G.; Rodziewicz, M.; Carrez-Maratray, J.-Y. Pelusium Prospection Archéologique et Topographique de la Région de Tell el-Kana’is; Franz Steiner: Stuttgart, France, 1996. [Google Scholar]
  59. Arieh, I.B. An early Bronze Age ii site at Nabi Salah in southern Sinai. Tel Aviv 1974, 1, 144–156. [Google Scholar] [CrossRef]
  60. Moshier, S.O.; El-Kalani, A. Late Bronze Age paleogeography along the ancient ways of Horus in Northwest Sinai, Egypt. Geoarchaeology 2008, 23, 450–473. [Google Scholar] [CrossRef]
  61. Herbich, T. Reconstructing the layout of Pelusium. In Newsletter of the Polish Centre of Mediterranean Archaeology of the University of Warsaw; 2009; Available online: http://www.pcma.uw.edu.pl/en/pcma-newsletter/2009/hellenistic-and-graeco-roman-period/pelusium-tell-farama-egypt/ (accessed on 30 September 2016).
  62. Marcolongo, B. Evolution du paléo-environement dans la partie orientale du delta du Nil depuis la transgression flandrienne (8000 bp). Cahiers Recherches l’Institut Papyrologie d’Egyptologie Lille 1992, 14, 23–31. [Google Scholar]
  63. Stanley, J.-D.; Bernasconi, M.P.; Jorstad, T.F. Pelusium, an ancient port fortress on Egypt’s nile delta coast: Its evolving environmental setting from foundation to demise. J. Coast. Res. 2008, 24, 451–462. [Google Scholar] [CrossRef]
  64. Jakubiak, K. Tell Farama (Pelusium). The City on Sinai—Where Egypt and middle east meet. In SOMA 2012 Identity and Connectivity, Proceedings of the 16th Symposium on Mediterranean Archaeology, Florence, Italy, 1–3 March 2012; Bombardieri, L., D’Agostino, A., Guarducci, G., Orsi, V., Valentini, S., Eds.; Archaeopress: Oxford, UK, 2013; pp. 569–576. [Google Scholar]
  65. Yong, S.-S.; Ra, S.-W. The design of MSC (multi-spectral camera) system operation. In Proceedings of the 2004 IEEE International Geoscience and Remote Sensing Symposium IGARSS’04, Anchorage, AK, USA, 20–24 September 2004; pp. 3311–3313.
  66. Gascon, F.; Cadau, E.; Colin, O.; Hoersch, B.; Isola, C.; Fernández, B.L.; Martimort, P. Copernicus sentinel-2 mission: Products, algorithms and Cal/Val. In Proceedings of the SPIE Earth Observing Systems XIX, San Diego, CA, USA, 21 October 2014.
  67. Gleyzes, M.-A.; Perret, L.; Kubik, P. Pleiades system architecture and main performances. Int. Arch. Photogramm. Remote Sens. Spat. Inf. Sci. 2012, 39, B1. [Google Scholar] [CrossRef]
  68. Carrez-Maratray, J.-Y.; Wagner, G. Tell el-Kanaïs. In Cahiers de Recherches de l’Institut de Papyrologie et d’Egyptlogie de Lille n.15; Université Charles De Gaulle: Lille, France, 1993; pp. 105–110. [Google Scholar]
  69. Li, F.; Johnson, W. Ambiguities in spacebornene synthetic aperture radar systems. IEEE Trans. Aerosp. Electron. Syst. 1983, 3, 389–397. [Google Scholar] [CrossRef]
  70. Meyer, F.J.; Nicoll, J.B.; Doulgeris, A.P. Correction and characterization of radio frequency interference signatures in l-band synthetic aperture radar data. IEEE Trans. Geosci. Remote Sens. 2013, 51, 4961–4972. [Google Scholar] [CrossRef] [Green Version]
  71. Rosen, P.A.; Hensley, S.; Le, C. Observations and mitigation of RFI in ALOS PALSAR SAR data: Implications for the DESDynI mission. In Proceedings of the Radar Conference, Rome, Italy, 26–30 May 2008; pp. 1–6.
  72. Lee, J.-S.; Pottier, E. Polarimetric Radar Imaging: From Basics to Applications; CRC Press: Boca Raton, FL, USA, 2009. [Google Scholar]
Figure 1. Map of the study area. Background image is a near-infrared and visible false colour composite of the ENVISAT Medium Resolution Imaging Spectrometer (MERIS). 300 m resolution. Band 10 (754 nm) displayed as red, band 5 (560 nm) as green, and band 2 (443 nm) as blue. Overlain on the MERIS image are the footprints of the Phased Array type L-band Synthetic Aperture Radar (PALSAR-1) images used for the mosaic, with their corresponding track/frame identification numbers. Data provided by European Space Agency (ESA).
Remotesensing 08 00825 g001
Figure 2. Diagram summarising methodological steps. Each step is described in a separate section: Step 1 in Section 2.1, Step 2 in Section 2.2, and Step 3 in Section 2.3.
Remotesensing 08 00825 g002
Figure 3. PALSAR-1 mosaic processing chain. The last step (8) included analysis of the mosaics and extraction of the mean mosaic backscatter.
Remotesensing 08 00825 g003
Figure 4. (a) Linear feature detection algorithm with PALSAR-1 average, De Grandi filtered σ° as input and with local incidence angle mask from SRTM DEM; (b) Linear feature detection algorithm with PALSAR-1 average coherence as input. With the average coherence as input there is no longer a need for the local incidence angle mask to remove sand dune ridges.
Remotesensing 08 00825 g004
Figure 5. Final ALOS PALSAR-1 mosaic of North Sinai annotated with geographic features and showing the location of the Tells, where features of low relative backscatter were identified. PALSAR-1 data provided by ESA.
Remotesensing 08 00825 g005
Figure 6. (a) Map showing location of one of the circular features (as red star) in the context of the PALSAR-1 mosaic (grey filled polygon); (b) circular feature identified in PALSAR-1 mosaic of Average De Grandi filtered PALSAR-1 σ° backscatter. Feature is centred at 30.544° latitude and 32.452° longitude. PALSAR-1 data provided by ESA; (c) Optical image available on Google Earth acquired on 7 February 2007 and covering same extent as (b); (d) optical image available on Google Earth acquired on 5 May 2010 and covering same extent as (b).
Remotesensing 08 00825 g006
Figure 7. (a) Map showing subset region (AOI 1), marked by red rectangle, east of the Wadi Tumilat and west of Gebel Maghara; (b) average De Grandi filtered PALSAR-1 σ° backscatter over AOI 1. This was initially used as input to the linear feature detection algorithm. PALSAR-1 data provided by ESA. (c) Average coherence of consecutive PALSAR-1 acquisitions over AOI 1. This was the final input to the linear feature detection algorithm. PALSAR-1 data provided by ESA. (d) Sentinel-2 image over AOI 1 with WMS vectors (roads) overlain. Image acquired on 19 February 2016. Full resolution (10 m) true colour composite of band 4 (650 nm) displayed as red, band 3 (543 nm) displayed as green, and band 2 (458 nm) displayed as blue. All vectors correspond to roads. The only WMS vectors other than roads include an administrative boundary, but given that this does not correspond to a physical object on the ground, it is not shown here. The colour coding corresponds to the presence of the vectors on the various WMS’: GM = Google Maps, OS = Open Street Map, BM = Bing Maps, AM = Apple iPhoto map. Contains modified Copernicus Sentinel data 2016. (e) Lines extracted from average PALSAR-1 coherence (in yellow) overlain on same Sentinel-2 subset image as in (d). Red arrow shows location of detail in (f). Contains modified Copernicus Sentinel data 2016. (f) Detail of partially buried crossroads on optical remotely sensed images available on Google Earth acquired on 7 February 2007 (left) and 5 May 2010 (right). Lines extracted from average PALSAR-1 coherence overlain in yellow. The centre of the crossroads, as identified in the SAR imagery, is located at 30.539° latitude and 32.877° longitude. The crossroads is an example of a feature not present on any of the available WSM vector layers. It appears unchanged from 2007 to 2010 and is visible in multitemporal speckle filtered PALSAR-1 imagery also from 2007 to 2010. The width of the vectors shows the coarse resolution of the PALSAR-1 average coherence image with respect to the VHR imagery on Google Earth. However, despite the PALSAR-1 coherence pixel spacing far exceeding the width of the roads, the crossroads nonetheless appears far more clearly on the PALSAR-1 average coherence than on any of the available optical layers.
Remotesensing 08 00825 g007aRemotesensing 08 00825 g007bRemotesensing 08 00825 g007c
Figure 8. (a) Map showing subset region of Tell el-Farama, Tell el-Mahzan, and Tell el-Kanais (AOI 2) marked by red star; (b) average De Grandi filtered PALSAR-1 σ° backscatter over subset region of Tells shown in (a). Yellow ellipses highlight anomaly features. PALSAR-1 data provided by ESA. (c) Coefficient of variation of seven PALSAR-2 Spotlight multitemporal De Grandi speckle filtered images over same subset region of Tells. Yellow ellipses highlight anomaly features. PALSAR-2 data provided by JAXA. (d) Sentinel-2 image over same subset region of Tells, acquired on 19 February 2016. Full resolution (10 m) true colour composite of band 4 (650 nm) displayed as red, band 3 (543 nm) displayed as green, and band 2 (458 nm) displayed as blue. The red rectangle shows the coverage of an archaeological chart published by Jaritz, Favre, Nogara, Rodziewicz and Carrez-Maratray [58]. Yellow ellipses show locations of anomalous features identified in the PALSAR-1 and PALSAR-2 processed imagery. Contains modified Copernicus Sentinel data 2016. (e) Pleiades image acquired on 24 November 2015, covering area included in the red rectangle in (d). Pansharpened to 0.5 m pixel spacing. True colour composite of band 3 (660 nm) displayed as red, band 2 (550 nm) displayed as green, and band 1 (490 nm) displayed as blue. Yellow ellipses show locations of anomalous features identified in the PALSAR-1 and PALSAR-2 processed imagery. Pleiades data provided by ESA. (f) Coefficient of variation of 7 PALSAR-2 Spotlight multitemporal De Grandi speckle filtered images over same subset region as (e). Yellow ellipses show locations of anomaly features. PALSAR-2 data provided by JAXA. (g) Archaeological chart published by Jaritz, Favre, Nogara, Rodziewicz and Carrez-Maratray [58] covering same area as in (e,f). Red ellipses show locations of anomalous features identified in the PALSAR-1 and PALSAR-2 processed imagery. Courtesy of Jaritz, Favre, Nogara, Rodziewicz and Carrez-Maratray [58].
Remotesensing 08 00825 g008aRemotesensing 08 00825 g008bRemotesensing 08 00825 g008c
Figure 9. (a) Map showing subset region (as red polygon) where Radio Frequency Interference (RFI) has been detected on PALSAR-1 polarimetric data; (b) HV polarization backscatter amplitude of PALSAR-1 Polarimetric mode image subset acquired over area shown in (a), on 8 April 2009. The image has a pixel spacing of 25 m and has been geocoded to geographic latitude/longitude, WGS84. PALSAR-1 data provided by ESA; (c) VH polarization backscatter amplitude of same PALSAR-1 Polarimetric image subset as in (b). PALSAR-1 data provided by ESA.
Remotesensing 08 00825 g009
Table 1. ALOS PALSAR-1 data used in the mosaic. All scenes were acquired in ascending node, right looking, and with an incidence angle of 38.7 degrees. For the scene IDs of individual images, see Tables S1 and S2 in the Supplementary Materials. HV: Horizontal Transmit, Vertical Receive; HH: Horizontal Transmit, Horizontal Receive.
Track/Frame (see Figure 1 for Location)Number of ScenesSensor Mode (Polarisation)Acquisition Date Range
604/6102FBD (HH/HV)September 2007–June 2010
605/6007FBD (HH/HV)June 2007–June 2010
605/6102FBD (HH/HV)June 2007–May 2010
606/6007FBD (HH/HV)July 2007–September 2010
606/6102FBD (HH/HV)July 2007–June 2010
607/5908FBS (HH)October 2007–February 2011
O2110 FBS (HH), 11 FBD (HH/HV)June 2007–February 2011
607/6101910 FBS (HH), 9 FBD (HH/HV)June 2007–February 2011
608/6007FBD (HH/HV)November 2007–April 2010
Table 2. Acquisition dates and incidence angles of PALSAR-2 Spotlight images used for the analysis of Tell El-Farama, Tell El-Mahzan, and Tell El-Kanais. All were acquired in descending node, right looking, and with HH polarization. See Table S3 of the Supplementary Materials for the scene IDs of individual images.
Acquisition Date Incidence Angle (Degrees)
5 August 201549
10 August 201540
19 August 201549
16 September 201549
21 September 201540
30 September 201549
5 October 201540
Table 3. Sensor names, acquisition dates, and characteristics of remotely sensed optical imagery used in the analysis of features over Tell el-Farama, Tell el-Mahzan, and Tell el-Kanais.
SensorAcquisition DateImage Characteristics
Kompsat-211 July 2012Four spectral bands from 450 to 900 nm at 4 m spatial resolution. One panchromatic band from 500 to 900 nm at 1 m spatial resolution [65].
Sentinel-219 February 201613 spectral bands from 443 to 2190 nm [66], 4 of which (visible and near infrared) at 10 m spatial resolution were used in the analysis.
Pleiades24 November 2015Four spectral bands from 430 to 950 nm at 2.8 m spatial resolution. One panchromatic band from 480 to 830 nm at 0.7 m spatial resolution [67].
Imagery available on Google Earth (unknown sensor)17 August 2003True colour imagery
7 February 2007
1 August 2009
26 July 2013
5 February 2016

