1. Introduction
1.1. Aim: The Use of Airborne LiDAR Data to Address an Ecological Question
Mountains display sharp vegetation changes with elevation. Vegetation gradients along mountain slopes are often used as ecological laboratories for climate change research [
1,
2,
3]. Such studies assume that the main and foremost driver of altitudinal change is climate. Vegetation cover has also been shown to be strongly influenced by soil properties. Although such properties are also partly determined by climate, they can vary with bedrock geological composition and with erosion rate [
4,
5]. Bedrock geology and erosion rates can vary along elevation gradients in a way that can reinforce or obscure the patterns produced by the climatic gradient. Their effects are often difficult to capture using field surveys alone because such surveys need to be conducted over extensive areas. Here instead we use remote LiDAR data to examine variations in canopy height along an elevation gradient in the tropical mountains of Puerto Rico. Investigation carried out there in the Luquillo Critical Zone Observatory have found that a pulse of tectonic uplift which occurred during the rise of the Luquillo Mountains generated waves of erosion that affect soil mineralogy and soil nutrients [
6,
7]. Using the LiDAR data, we investigate whether these variations in erosion rate affect canopy height along elevation gradients.
1.2. Vegetation Metrics Derived from LiDAR Data
Airborne light detection and ranging (LiDAR) is the state-of-the-art method for observing three-dimensional structural properties of forests at landscape spatial scales [
8]. Of all vegetation metrics that can be derived from LiDAR datasets, forest height can be derived most consistently across sensor systems [
9]. Forest height is also considered a key ecosystem variable for earth observation [
10]. Forest height correlates strongly with other vegetation metrics, such as relative heights (e.g., RH50), and metrics describing the structure of the point cloud or waveform such as the height of maximum laser return density (or height of maximum laser energy) [
9]. Here we use LiDAR-derived forest height and analyze its variations at the scale of the Luquillo Mountains.
1.3. Physical Context: Mountain Uplift, Erosion, and Evolution of the Topography in the Study Area
Puerto Rico is a 200 km × 50 km wide island located near the northern boundary of the Caribbean Plate. Most of its landmass emerged from the ocean approximately 4.2 My ago, converting an archipelago of low elevation islands and surrounding marine platforms into high mountaintops [
7,
11]. The remnants of one such platform surround the Luquillo Mountains at an elevation of about 600 m [
6]. The platform encloses the remnant of a paleoisland, “El Yunque Island”, which peaks now protrude to 1100 m [
6,
7]. The uplift of the island and its surrounding platforms sparked vigorous incision of the newly elevated landmass, in the form of upstream migrating waves of river incision.
The Luquillo Mountains are dominantly composed of slightly metamorphosed volcanoclastic rocks of Jurassic-Cretaceous age of basaltic and andesitic composition, intruded by a stock of quartz diorite of Early Tertiary age [
6]. Upstream propagation of incision has been faster and more diffusive within the volcanoclastic bedrock than across the quartz diorite stock. As a result, streams draining the quartz diorite exhibit longitudinal profiles that are distinct from streams on the volcanoclastic. The upper parts of the profiles on the quartz diorite are concave and still gently graded to the elevation of the platform that once surrounded El Yunque island, while their downstream reaches are much steeper and connect the perched relict river profiles to the new coastal plain. The break in slope along the river profiles where the rivers start cascading down to the coast are called knickpoints. Knickpoints in the parts of the Luquillo Mountains underlain by quartz diorite are clustered at ~600 m elevation across the drainage network. These knickpoints do not coincide with lithological discontinuities, but instead represent the front to an upstream migrating wave of incision that originated at the paleoshoreline [
7]. Erosion into the surrounding mountain slopes produces steep hillslopes downstream of the knickpoints, while shallower hillslopes still prevail upstream of the knickpoints. There are no regional knickpoints on streams draining the portion of the range underlain by the volcanoclastics, where higher weathering rates may have facilitated the upward migration of stream profiles all the way through the range [
12].
Spatially explicit measurement of erosion rates has been conducted on the quartz diorite bedrock both above and below the knickpoints using sampling of quartz grains obtained from stream sediments and measurement of the cosmogenic isotope
10Be [
6]. The concentration of
10Be in quartz grains depends on the duration of time that the grains spend exposed to cosmic rays in the subsurface. The concentration of
10Be in quartz can therefore be used to estimate erosion rates.
10Be measured in quartz grains from stream sediments provides integrated erosion rate of the upstream quartz-feeding area.
10Be in stream sediment was measured in river catchments located upstream and downstream of the knickpoints on the quartz diorite. The measurements show that catchment scale erosion rates increase across the knickpoints, with higher erosion rates occurring downstream [
6].
Because erosion removes surface soils at a higher rate downstream of the knickpoints, mineral residence time in the weathering zone is shorter. As a result, soils downstream of the knickpoints host more primary minerals [
6] that supply nutrients near the soil surface [
13]. Upstream of the knickpoints soils and saprolite are generally deep and thoroughly depleted in weatherable minerals (e.g., feldspar and amphiboles) [
6]. Exchangeable cations downstream of the knickpoints are at some of the highest concentrations across the entire mountain range, whereas above the knickpoints cation concentrations of soils are relatively low [
13]. The consequence is two soil domains on the quartz diorite governed by erosional patterns set in place by tectonic uplift beginning around 4.2 My ago.
1.4. Additional Inferrences from Stream Longitudinal Profiles
Erosion rates using cosmogenic isotopes have been restricted to the area underlain by quartz diorite because the volcanoclastic rocks lack quartz in quantity and quality to conduct similar analyses. However, stream longitudinal profiles on volcanoclastics lack prominent knickpoints such as those on the quartz diorite [
6,
7]. Knickpoints, when present, are then more subtle and are spatially distributed across the mountain. The absence of knickpoints at a consistent elevation (as we see on the quartz diorite) suggests that the wave of incision moved up the mountain more rapidly due to the higher erodibility of the volcaniclastic bedrock [
6,
7,
13]. Because river incision ultimately controls the rate at which surrounding slopes are eroded, erosion rate on the volcaniclastic bedrock is likely more spatially diffuse across the elevation gradient than on the quartz diorite.
1.5. Hypothesis: Soil Erosion Rate Affects Forest Height and This Effect Is Detectable Using LiDAR Data
We expect forest height to decline systematically with increasing elevation on both the quartz dioritic and volcanoclastic bedrocks, due to changes in climate with elevation [
1,
2,
3]. Such changes should be progressive on the volcanoclastic bedrock, since there are no sudden mountain-wide systematic changes in erosion rate, slope, bedrock chemistry or soil properties with elevation. Some changes in the climatic variables with elevation, such as the mean cloud base elevation [
14] can potentially produce rapid changes in vegetation height, akin to the effect of the tropical inversion layer as observed on higher tropical mountains. If so they should appear in the volcanoclastic bedrock profile as well as the quartz diorite. If soil erosion rates and associated changes in soil mineralogy and nutrient content significantly affect forest height, then we expect forest height to change abruptly with elevation on the quartz diorite bedrock (at the elevation of the river knickpoints), but not on the volcaniclastic parent material.
2. Materials and Methods
2.1. Study Area
The Luquillo Mountains rise from sea level to >1050 m elevation over a distance of <20 km. Mean annual precipitation (MAP) ranges from 2300 mm year
−1 at the coast to >4500 mm year
−1 on the highest peaks, while mean annual temperature (MAT) declines from 23 °C to 19 °C. Geologic maps and field observations were used to assign areas of the landscape to quartz diorite or volcaniclastic bedrock [
6,
7,
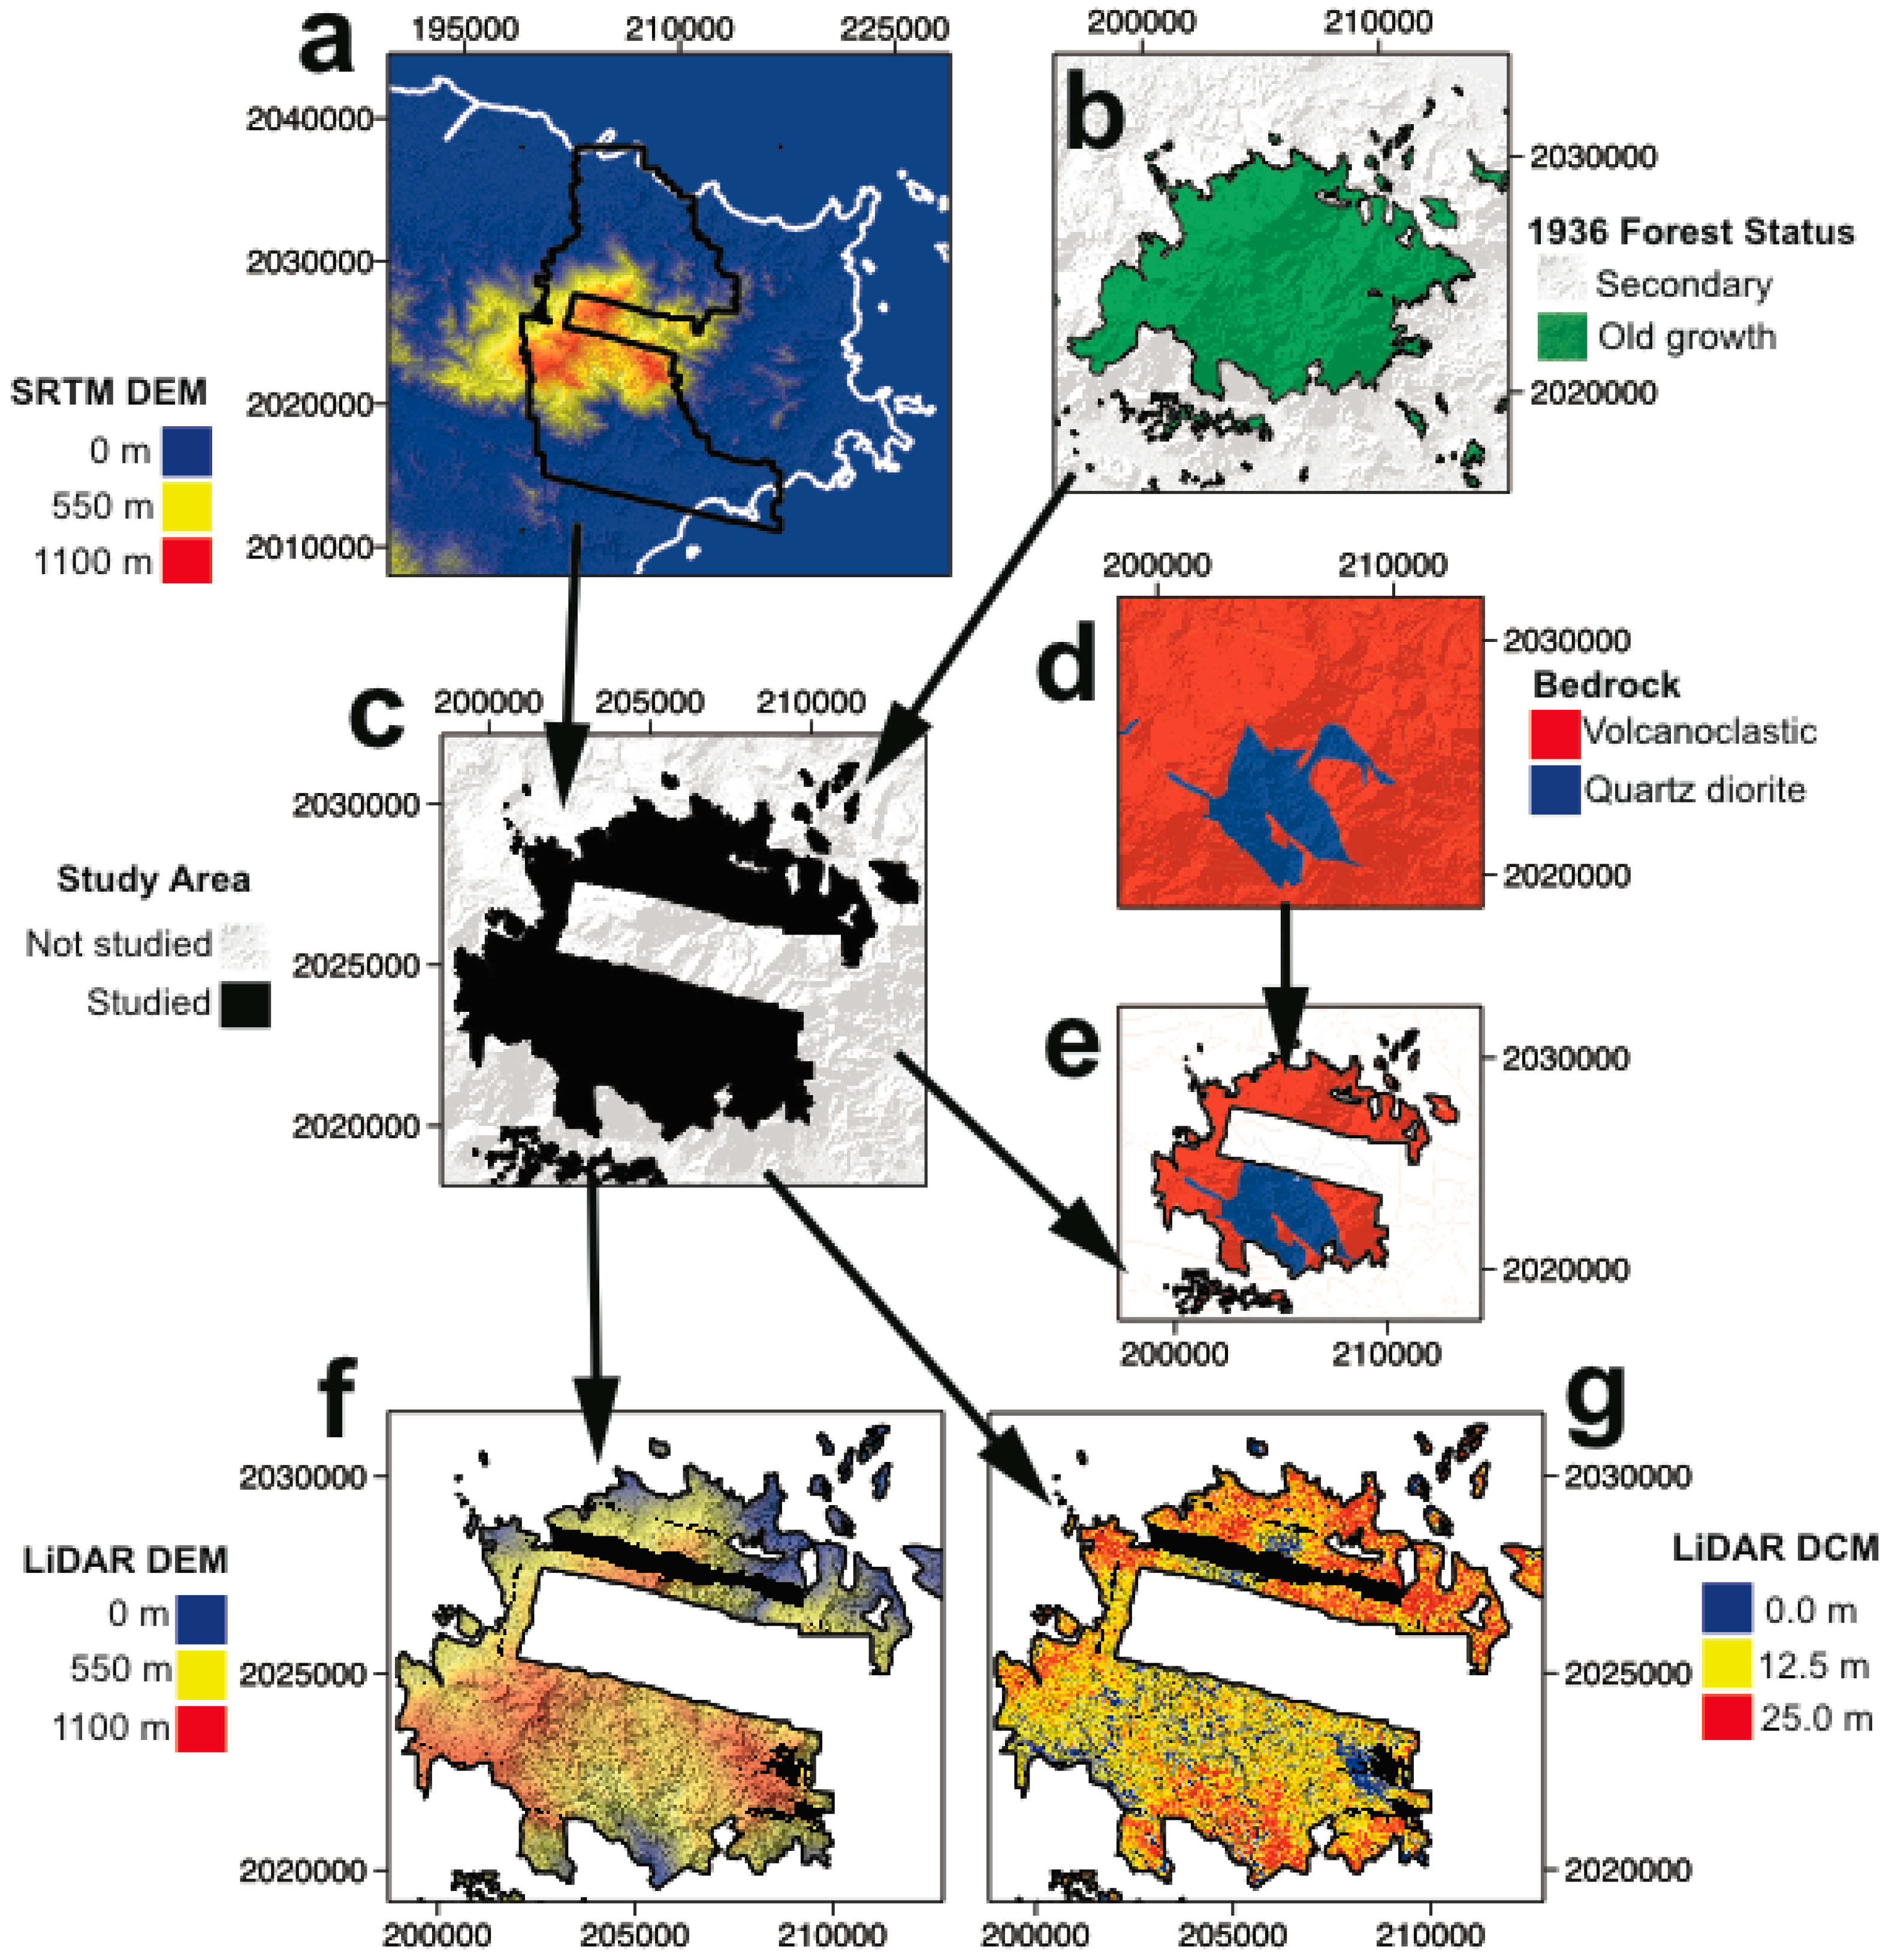
13]. We restricted our analysis to the extent of the LiDAR coverage and to the area of closed canopy forest since 1936 (based on aerial photographs). Inclement weather prevented the acquisition of a complete LiDAR coverage all over the mountain range despite repeated flights conducted over the cloudiest peaks. Our analysis is focused on the 400–800 m altitudinal range, centered on the quartz diorite knickpoints elevation of approximately 600 m [
6,
7]. This elevation interval covers 38.95 km
2 of old growth forest, with 16.31 km
2 on quartz diorite and 22.64 km
2 on volcaniclastic bedrock (
Figure 1).
2.2. Dataset
Airborne LiDAR data were collected by the National Center for Airborne Laser Mapping (NCALM) with an Optech GEMINI ALTM (Telodyne Optech, Ontario, ON, Canada) and Applanix POS/AV 510 OEM with embedded BD950 12 channel 10 Hz GPS receiver (Applanix Corp., Ontario, ON, Canada) onboard a Cessna Skymaster (Cessna, Witchita, KS, USA). Data used here acquired in May 2011. The laser wavelength was 1047 nm, laser pulse frequency was set to 100 Hz, beam divergence was 0.25 mrad (1/e), scan frequency was set to 55 Hz, scan angle was set to ±15°, and scan cutoff was ±2°. Flights were at an altitude of 600 m and speed of 60 m/s. The swath width was 277 m with 50% swath overlap. Point density was approximately 14 points m
−2. Discrete-returns were horizontally referenced to NAD 1983 UTM Zone 20N (EPSG: 26920) and vertically referenced to NADV 1988 (EPSG: 5703). Data are available online through OpenTopography [
15].
2.3. Data Processing
Following standard procedures discrete laser returns were rasterized at 1 m
2 spatial resolution into a digital surface model (DSM) and a digital elevation model (DEM). Maximum z-value of the first returns at 1 m
2 spatial resolution were used to generate the DSM while minimum z-values of the last-return ground classified points were used to construct the DEM. Elevations for DEM pixels without ground returns were estimated by triangulation of the point cloud. A digital canopy model (DCM) representing forest height was made by taking the difference of the DSM and DEM. To allow direct comparison with standard field measurements of above ground forest metrics, height data were averaged in 1-ha-wide cells using the 1 m
2 spatial resolution DCM, using the Geospatial Data Abstraction Library (GDAL) [
16].
2.4. Statistical Analysis
All datasets were analyzed at the hectare scale, resulting in sample sizes of 1631ha on quartz diorite and 2264 ha on volcaniclastic bedrock. Statistical analyses were done using the R Statistical Computing Environment (R Core Development Team, 2016). Hectare-scale data were then aggregated into 10 m-elevation bins to statistically summarize aggregated data at discrete elevation intervals.
We tested a series of functional forms to model stand-sized forest height in relation to elevation. We evaluated a linear functional form
a quadratic functional form
where
H is height and
βi is the coefficient for elevation
x to the power
i; and a sigmoidal (logistic) functional form,
where
k is a rate parameter,
x0 is the elevation where the inflection point in the forest height-elevation relationship occurs, while both
m and
b are scaling factors. We considered models with common parameters for both bedrock types (quartz diorite and volcanoclastic), and models with separate parameters for each bedrock. We also considered models with separate functional forms for the two bedrocks. Model fit was evaluated using the Akaike Information Criteria (AIC) with no corrections for sample size, because samples sizes were large (e.g., min. N = 1631 ha on quartz diorite). We used least-squares fits for the linear and quadratic models, which result in maximum likelihood estimates. The sigmoid model was fit by maximum likelihood using simulated annealing. The optimization procedure was run 1000 times from a random selection of different starting parameters.
2.5. Model Contrasts
We provide a quantitative test of mutually exclusive alternative hypotheses through contrasting models (
Supplementary Materials). We are able to test three mutually exclusive hypotheses based on models using either pooled or bedrock-specific data and the three different functional forms. First, we test the hypothesis that patterns of forest height across elevations are similar regardless of bedrock. We test this hypothesis by contrasting models for pooled data versus bedrock specific data. Second, we test the hypothesis that patterns of forest height differ across bedrock types, but follow similar functional forms. We test this hypothesis by comparing models with the same functional form, but bedrock specific parameters. Third, we test the hypothesis that patterns of forest height are different across elevations on the different bedrocks and follow different functional forms. We test this hypothesis using models with different functional forms for each bedrock. If the best model includes a sigmoidal function for the quartz diorite and either a linear or quadratic function for volcanoclastic bedrock, that would be consistent with a role for mountain building and deconstructing processes. Furthermore, the inflection point of the sigmoidal model (where the maximum rate of change occurs) is expected to occur near the knickpoints elevation.
3. Results
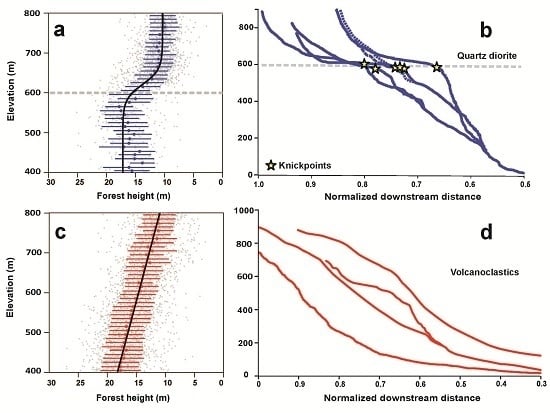
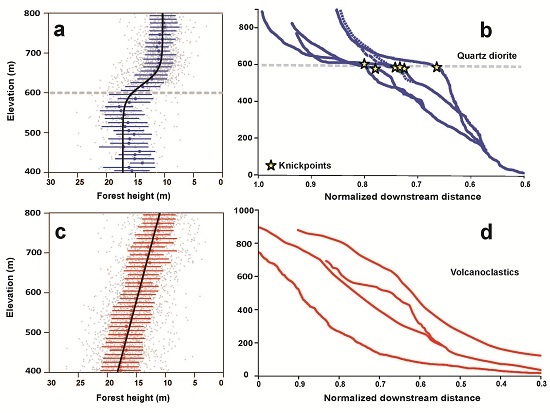
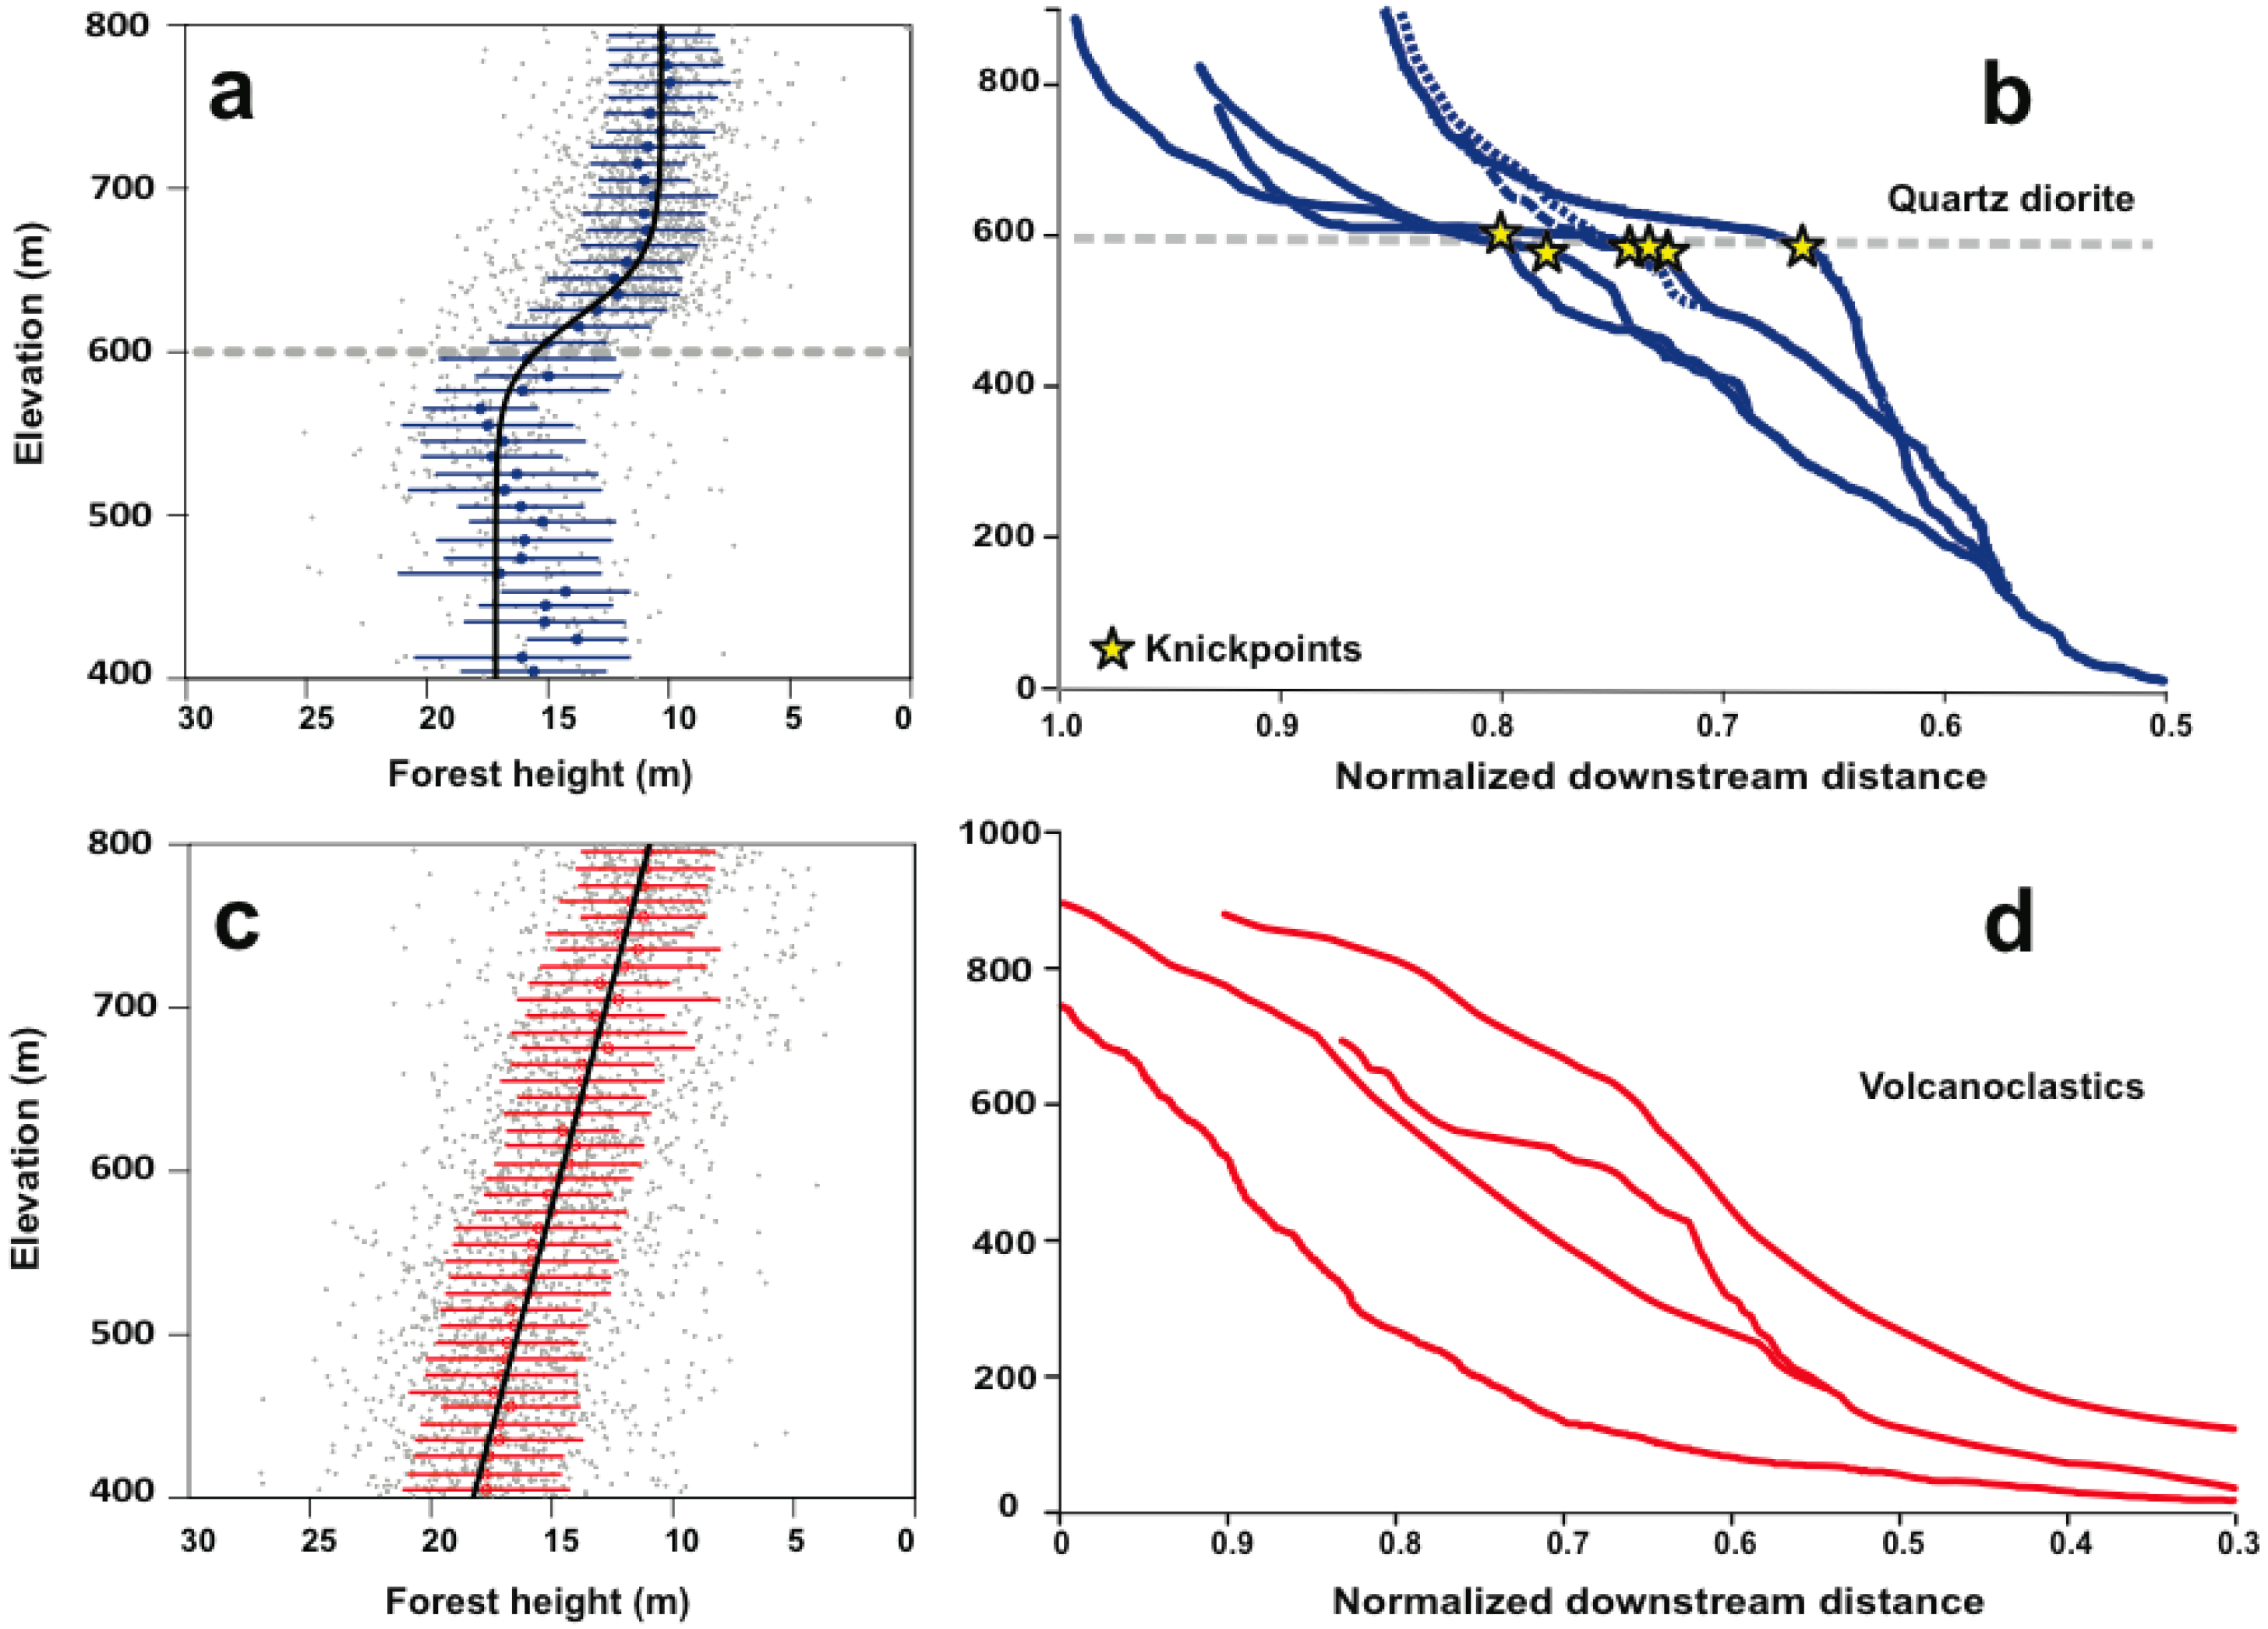
Abrupt changes in stand-sized forest height occur on the quartz diorite bedrock but not on volcaniclastic bedrock (
Figure 2,
Table 1). Models which use the same function to describe forest height changes with elevation but use different parameter values on each bedrock type describe the forest height-elevation response far better than models that use a common value for each bedrock type (
Tables S1 and S2). However, these models provide a looser fit to the data than models that use different functional forms to fit the forest height elevation changes for each bedrock type (
Table S2). The best-fit model includes a sigmoidal functional form over the quartz diorite bedrock and either a linear (AIC = 19407.06) or quadratic functional form over the volcaniclastic bedrock (AIC = 19405.23). The ΔAIC is small (<2) between these two best-fit models but is >100 between all other models (
Table S2). This is strong statistical evidence that a different functional form is required to describe forest height changes with elevation on each bedrock type. The stand-wise change in forest height with elevation on quartz diorite occurs near the elevation of the river knickpoints (k
QD = −0.0539 ± 0.0056, x0
QD = 621.8 ± 2.142 m;
Table 1). There, the decline in forest height is abrupt, and happens over a narrow range of elevations (<100 m). On the volcaniclastic bedrock forest height decreases by −0.0182 ± 0.0006 m/m according to the linear model (
Table 1).
Supplementary Materials includes summaries of all the other tested height-elevation models (
Tables S3–S11).
4. Discussion
4.1. Aims Revisited: Canopy Structure and Erosion Rates
We set out to test whether LiDAR-derived forest height can be used to address the possibility that changes in soil properties triggered by a wave or erosion can alter forest height in a detectable way. We find that forest height changes abruptly near the elevation of knickpoints that demarcate portions of the elevation gradient where erosion rates are high (e.g., lower elevations) from portions of the elevation gradient where erosion rates are low (e.g., higher elevations) on the quartz diorite bedrock type. On the volcanoclastic bedrock, on the other hand, the forest height-elevation patterns are well-approximated as linear. Since rivers flowing on the volcanoclastic bedrock do not exhibit pronounced knickpoints we conclude that no sharp changes in erosion rates occur with elevation, and that the linear decline with elevation is controlled by a climatic gradient. Forest height on the quartz diorite could vary abruptly due to sharp decreases in productivity without a change in species composition or may result from abrupt changes in species composition, however the LiDAR data alone cannot rigorously address whether forest composition changes across the knickpoints.
4.2. Canopy Structure and Geology
Average forest height declines by more than 10 m over an elevation interval of 400–800 m in the Luquillo Mountains (
Figure 1). The amplitude of the change, as well as its absolute values, are the same on either geologic substrate. However, forest height declines abruptly near the elevation of pronounced knickpoints on the quartz diorite bedrock. In contrast, forest height declines gradually with increasing elevation on volcaniclastic bedrock. Soil properties on the quartz diorite are known to change abruptly near the elevation of the knickpoints [
6,
13]. The finding that forest height also changes abruptly suggests that soil properties are the driver of differences in how forest height changes with elevation. Cation concentrations are high below the knickpoints and on average much lower above the knickpoints [
13]. Therefore, the decline in nutrient availability may be the underlying cause for why forest height decreases abruptly on the quartz diorite across the elevation of the knickpoints. It is also important to note that the bedrocks differ in aspect, with the quartz diorite bedrock facing primarily to the south and the volcancanoclastics facing complimentary aspects. There is currently no evidence indicating strong aspect-related climate effects in this mountain range, but it is possible that aspect related climate effects could in part contribute to bedrock-specific patterns in the Luquillo Mountains.
4.3. General Importance
These findings have general importance for understanding vegetation patterns in mountain ranges. Climate is often viewed as the primary driver of vegetation patterns in mountains and elevation gradients are interpreted as climate gradients [
1]. Nevertheless, elevation gradients are also edaphic, with soil development controlled not only by climate, but also by spatial variation in bedrock types [
17,
18], and erosion. Soil variation is generally recognized as important to understanding vegetation patterns in tropical forests [
19,
20,
21,
22], but the role of soils along elevation gradients is not yet well understood.
These results also highlight the importance of erosion rate, and by extension soil residence time, in controlling the properties of tropical forests. While the results of erosion rate on foliar chemistry have been explored both on the ground [
23] and from aircraft [
24], this is the first effort that uses LiDAR to detect the effects of erosion rate on forest structure in a tropical forest. Thus, this work indicates another mechanism by which differences across elevation lead to differences in forest structure and function, one of the longest standing observations in ecosystem science and biogeography [
25].
One of the most general patterns in biogeography is the mass-elevation effect [
25,
26,
27] where rates of change in forest properties with elevation vary as a function of mountain size and proximity to other mountains or large water bodies. Large mountains have slower rates of change in forest properties with elevation than smaller mountains. Hypotheses to explain the mass-elevation effect fall into two categories: direct and indirect climate control [
26,
27]. The primary indirect climate hypothesis is that increasing cloud cover at lower elevations in small mountains near large water bodies results in decreased rates of organic matter mineralization in soils, thereby decreasing rates of nutrient cycling and nutrient supply for plants, with plant productivity and species distributions along elevation gradients limited by nutrient availability. These hypotheses have been difficult to test. We suggest that using natural experiments where geological and geomorphological factors cause variation in soil nutrient availability, through variations in the overall bedrock chemistry and through variations in the residence time of the mineral fraction in the soil respectively, could provide important insights into understanding the role of bottom-up controls on phenomena such as the mass-elevation effect.
5. Conclusions
Using airborne LiDAR data, we conducted an analysis of forest height in a lower montane tropical forest in Puerto Rico. We then analyzed variations in forest height with elevation along two elevation profiles that summarize the changes occurring over volcanoclastic rocks and over a stock of quartz diorite, respectively.
We find that forest height decreases linearly with elevation over the volcanoclastic rocks. Over the quartz diorite, forest height decreases by the same amount (10 m) over the same elevation interval (400 m to 800 m), but displays a 5 m-drop in average canopy height over a 100 m interval, centered around an elevation of 622 ± 2 m. LiDAR processing of canopy height therefore provides a record of changes with a precision that no amount of ground surveys could ever achieve over such a large area.
The elevation of the rapid decrease in forest height coincides with the elevation of a cluster of dramatic river knickpoints in the longitudinal profiles of rivers that drain the quartz diorite. These knickpoints represent the front of a wave of erosion that propagates towards the upper mountain slopes. This wave of erosion has a major impact on soil properties. Upstream of the knickpoint, erosion rates are low, soils are intensely weathered and deeply depleted in soil-derived nutrients. Downstream of the knickpoints, erosion rates are higher, soils are less intensely weathered and enriched in soil-derived nutrients.
We therefore interpret the change in canopy height documented using the LiDAR data across the elevation of the knickpoints as an edaphic control of canopy height, driven by nutrient limitation. This control is superposed to the climatically controlled overall reduction of canopy height with elevation. The reduction in canopy height is either due to a general shrinkage of the forest with elevation or to a change in forest species composition, but the LiDAR data alone do not allow us to resolve this question.
The lack of similar drop in vegetation height on the volcanoclastic rocks reflects the fact that knickpoints are both more scattered with elevation and more subdued than on the quartz diorite. This absence of clustering, and likely less contrasted changes in erosion rates across the knickpoints blur the expression of the edaphic control of forest height along the elevation gradient on volcanoclastics.
Understanding geological processes, and their link to plants through soils, will be important to forecasting forest responses to climate change on elevation gradients. The geological processes that build and deconstruct mountains play a prominent role in spatial patterns of vegetation in relation to elevation in the Luquillo Mountains. Airborne remote sensing has provided a toolset for observing landscape scale vegetation patterns.
Supplementary Materials
The following are available online at
www.mdpi.com/2072-4292/8/10/864/s1, Table S1: Summary of AIC scores for models of forest height against elevation for data pooled by bedrock type, Table S2: Summary of AIC scores for models of forest height against elevation with separate parameters or functional forms by bedrock (QD: quartz diorite; VC: volcanoclastic), Table S3: Linear model for data pooled by bedrock, Table S4: Quadratic model for data pooled by bedrock, Table S5: Logistic model for data pooled by bedrock, Table S6: Linear model for quartz diorite bedrock, Table S7: Linear model for volcanoclastic bedrock, Table S8: Quadratic model for quartz diorite bedrock, Table S9: Quadratic model for volcanoclastic bedrock, Table S10: Logistic model for quartz diorite bedrock, Table S11: Logistic model for volcanoclastic bedrock.
Acknowledgments
We wish to thank the three anonymous reviewers of this manuscript. This is collaborative research between the Luquillo Critical Zone Observatory and Luquillo Long-Term Ecological Research site. This work was supported by National Science Foundation grants DEB-1546686, EAR-0722476, and EAR-0922307.
Author Contributions
All authors conceived and designed the research; Jeffrey Wolf performed the research; Jeffrey Wolf analyzed the data. All authors contributed reagents/materials/tools; Jeffrey Wolf and Gilles Brocard wrote the paper. All authors commented on drafts of the paper and revised the paper.
Conflicts of Interest
The authors declare no conflict of interest.
References
- Mahli, Y.; Silman, M.; Salinas, N.; Bush, M.; Saachi, S. Introduction: Elevation gradients in the tropics: Laboratories for ecosystem ecology and global change research. Glob. Chang. Biol. 2010, 16, 3171–3175. [Google Scholar]
- Duque, A.; Stevenson, P.R.; Feeley, K.J. Thermophilization of adult and juvenile tree communities in the northern tropical Andes. Proc. Natl. Acad. Sci. USA 2015, 112, 10744–10749. [Google Scholar] [CrossRef] [PubMed]
- Morueta-Holme, N.; Engemann, K.; Sandoval-Acuña, P.; Jonas, J.D.; Segnitz, R.M.; Svenning, J.C. Strong upslope shifts in Chimborazo’s vegetation over two centuries since Humbolt. Proc. Natl. Acad. Sci. USA 2015, 112, 12741–12745. [Google Scholar] [CrossRef] [PubMed]
- Hahm, W.J.; Riebe, C.S.; Lukens, C.E.; Araki, S. Bedrock composition regulates mountain ecosystems and landscape evolution. Proc. Natl. Acad. Sci. USA 2014, 111, 3338–3343. [Google Scholar] [CrossRef] [PubMed]
- Milodowski, D.T.; Mudd, S.M.; Mitchard, E.T.A. Erosion rates as a potential bottom-up control of forest structural characteristics in the Sierra Nevada Mountains. Ecology 2015, 96, 31–38. [Google Scholar] [CrossRef] [PubMed]
- Brocard, G.Y.; Willenbring, J.K.; Scatena, F.N.; Johnson, A.H. Effects of a tectonically-triggered wave of incision on riverine exports and soil mineralogy in the Luquillo Mountains of Puerto Rico. Appl. Geochem. 2015, 63, 586–598. [Google Scholar] [CrossRef]
- Brocard, G.Y.; Willenbring, J.K.; Miller, T.; Scatena, F.N. Resilience of a transport-limited relict landscape to dissection by upstream migrating knickpoints. J. Geophys. Res. Earth Surf. 2016. [Google Scholar] [CrossRef]
- Lefsky, M.A.; Cohen, W.B.; Parker, G.G.; Harding, D.J. LiDAR remote sensing for ecosystem studies. Bioscience 2002, 52, 19–30. [Google Scholar] [CrossRef]
- Asner, G.P.; Mascaro, J. Mapping tropical forest carbon: Calibrating plot estimates to a single liDAR metric. Remote Sens. Environ. 2014, 140, 614–624. [Google Scholar] [CrossRef]
- Skidmore, A.K.; Pettorelli, N.; Coops, N.C.; Geller, G.N.; Hansen, M. Environmental science: Agree on biodiversity metrics to track from space. Nature 2015, 523, 403–405. [Google Scholar] [CrossRef] [PubMed]
- Ten Brink, U. Vertical motions of the Puerto Rico Trench and Puerto Rico and their cause. J. Geophys. Res. 2005, 110. [Google Scholar] [CrossRef]
- Dosseto, A.; Buss, H.L.; Suresh, P.O. Rapid regolith formation over volcanic bedrock and implications for landscape evolution. Earth Planet. Sci. Lett. 2012, 337, 47–55. [Google Scholar] [CrossRef]
- Porder, S.; Johnson, A.H.; Xing, H.; Brocard, G.; Goldsmith, S.; Pett-Ridge, J. Linking geomorphology, weathering and cation availability in the Luquillo Mountains of Puerto Rico. Geoderma 2015, 249, 100–110. [Google Scholar] [CrossRef]
- Eugster, W.; Burkard, R.; Holwerda, F.; Scatena, F.N.; Bruijnzeel. Characteristics of fog and fogwater fluxes in a Puerto Rican elfin cloud forest. Agric. Meteorol. 2006, 139, 288–306. [Google Scholar] [CrossRef]
- OpenTopography. Available online: http://www.opentopography.org (accessed on 19 October 2016).
- GDAL: Geospatial Data Abstraction Library. Available online: http://www.gdal.org (accessed on 19 October 2016).
- Kitayama, K.; Aiba, S. Ecosystem structure and productivity of tropical rain forests along altitudinal gradients with constrasting soil phosphorus pools on Mount Kinabalu, Borneo. J. Ecol. 2002, 90, 37–51. [Google Scholar] [CrossRef]
- Aiba, S.; Kitayama, K. Structure, composition and species diversity in an altitude substrate matrix of rain forest tree communities on Mount Kinabalu, Borneo. Plant Ecol. 1999, 140, 139–157. [Google Scholar] [CrossRef]
- Fine, P.V.A.; Mesones, I.; Coley, P.D. Herbivores promote habitat specialization by trees in Amazonian forests. Science 2004, 305, 663–665. [Google Scholar] [CrossRef] [PubMed]
- Vitousek, P.; Asner, G.P.; Chadwick, O.A.; Hotchkiss, S. Landscape-scale variation in forest structure and biogeochemistry across a substrate age gradient in Hawaii. Ecology 2009, 90, 3074–3086. [Google Scholar] [CrossRef] [PubMed]
- Higgins, M.A.; Ruokolainen, K.; Tuomisto, H.; Llerena, N.; Cardenas, G.; Phillips, O.L.; Vásquez, R.; Räsänen, M. Geological control of floristic composition in Amazonian forests. J. Biogeogr. 2011, 38, 2136–2149. [Google Scholar] [CrossRef] [PubMed]
- Condit, R.; Englebrecht, B.M.J.; Pino, D.; Pérez, R.; Turner, B.L. Species distributions in response to individual soil nutrients and seasonal drought across a community of tropical trees. Proc. Natl. Acad. Sci. USA 2013, 110, 5064–5068. [Google Scholar] [CrossRef] [PubMed]
- Porder, S.; Asner, G.P.; Vitousek, P.M. Ground-based and remotely sensed nutrient availability across a tropical landscape. Proc. Natl. Acad. Sci. USA 2005, 102, 10909–10912. [Google Scholar] [CrossRef] [PubMed]
- Asner, G.P.; Knapp, D.E.; Anderson, C.B.; Martin, R.E.; Vaughn, N. Large-scale climatic and geophysical controls on the leaf economics spectrum. Proc. Natl. Acad. Sci. USA 2016, 113, E4043–4051. [Google Scholar] [CrossRef] [PubMed]
- Von Humbolt, A.; Bonpland, A. Essay on the geography of plants—with a physical tableau of the equinoctial regions (1807). In Essay on the Geography of Plants; Jackson, S.T., Ed.; University of Chicago Press: Chicago, IL, USA, 2008; pp. 61–155. [Google Scholar]
- Grubb, P.J. Interpretation of the ‘Massenerhebung’ effect on tropical mountains. Nature 1971, 229, 44–45. [Google Scholar] [CrossRef] [PubMed]
- Grubb, P.J. Control of forest growth and distribution on wet tropical mountains: With special reference to mineral nutrition. Annu. Rev. Ecol. Syst. 1977, 8, 83–107. [Google Scholar] [CrossRef]
© 2016 by the authors; licensee MDPI, Basel, Switzerland. This article is an open access article distributed under the terms and conditions of the Creative Commons Attribution (CC-BY) license (http://creativecommons.org/licenses/by/4.0/).


