
Forest Fragmentation in the Lower Amazon Floodplain: Implications for Biodiversity and Ecosystem Service Provision to Riverine Populations


Abstract
:
1. Introduction
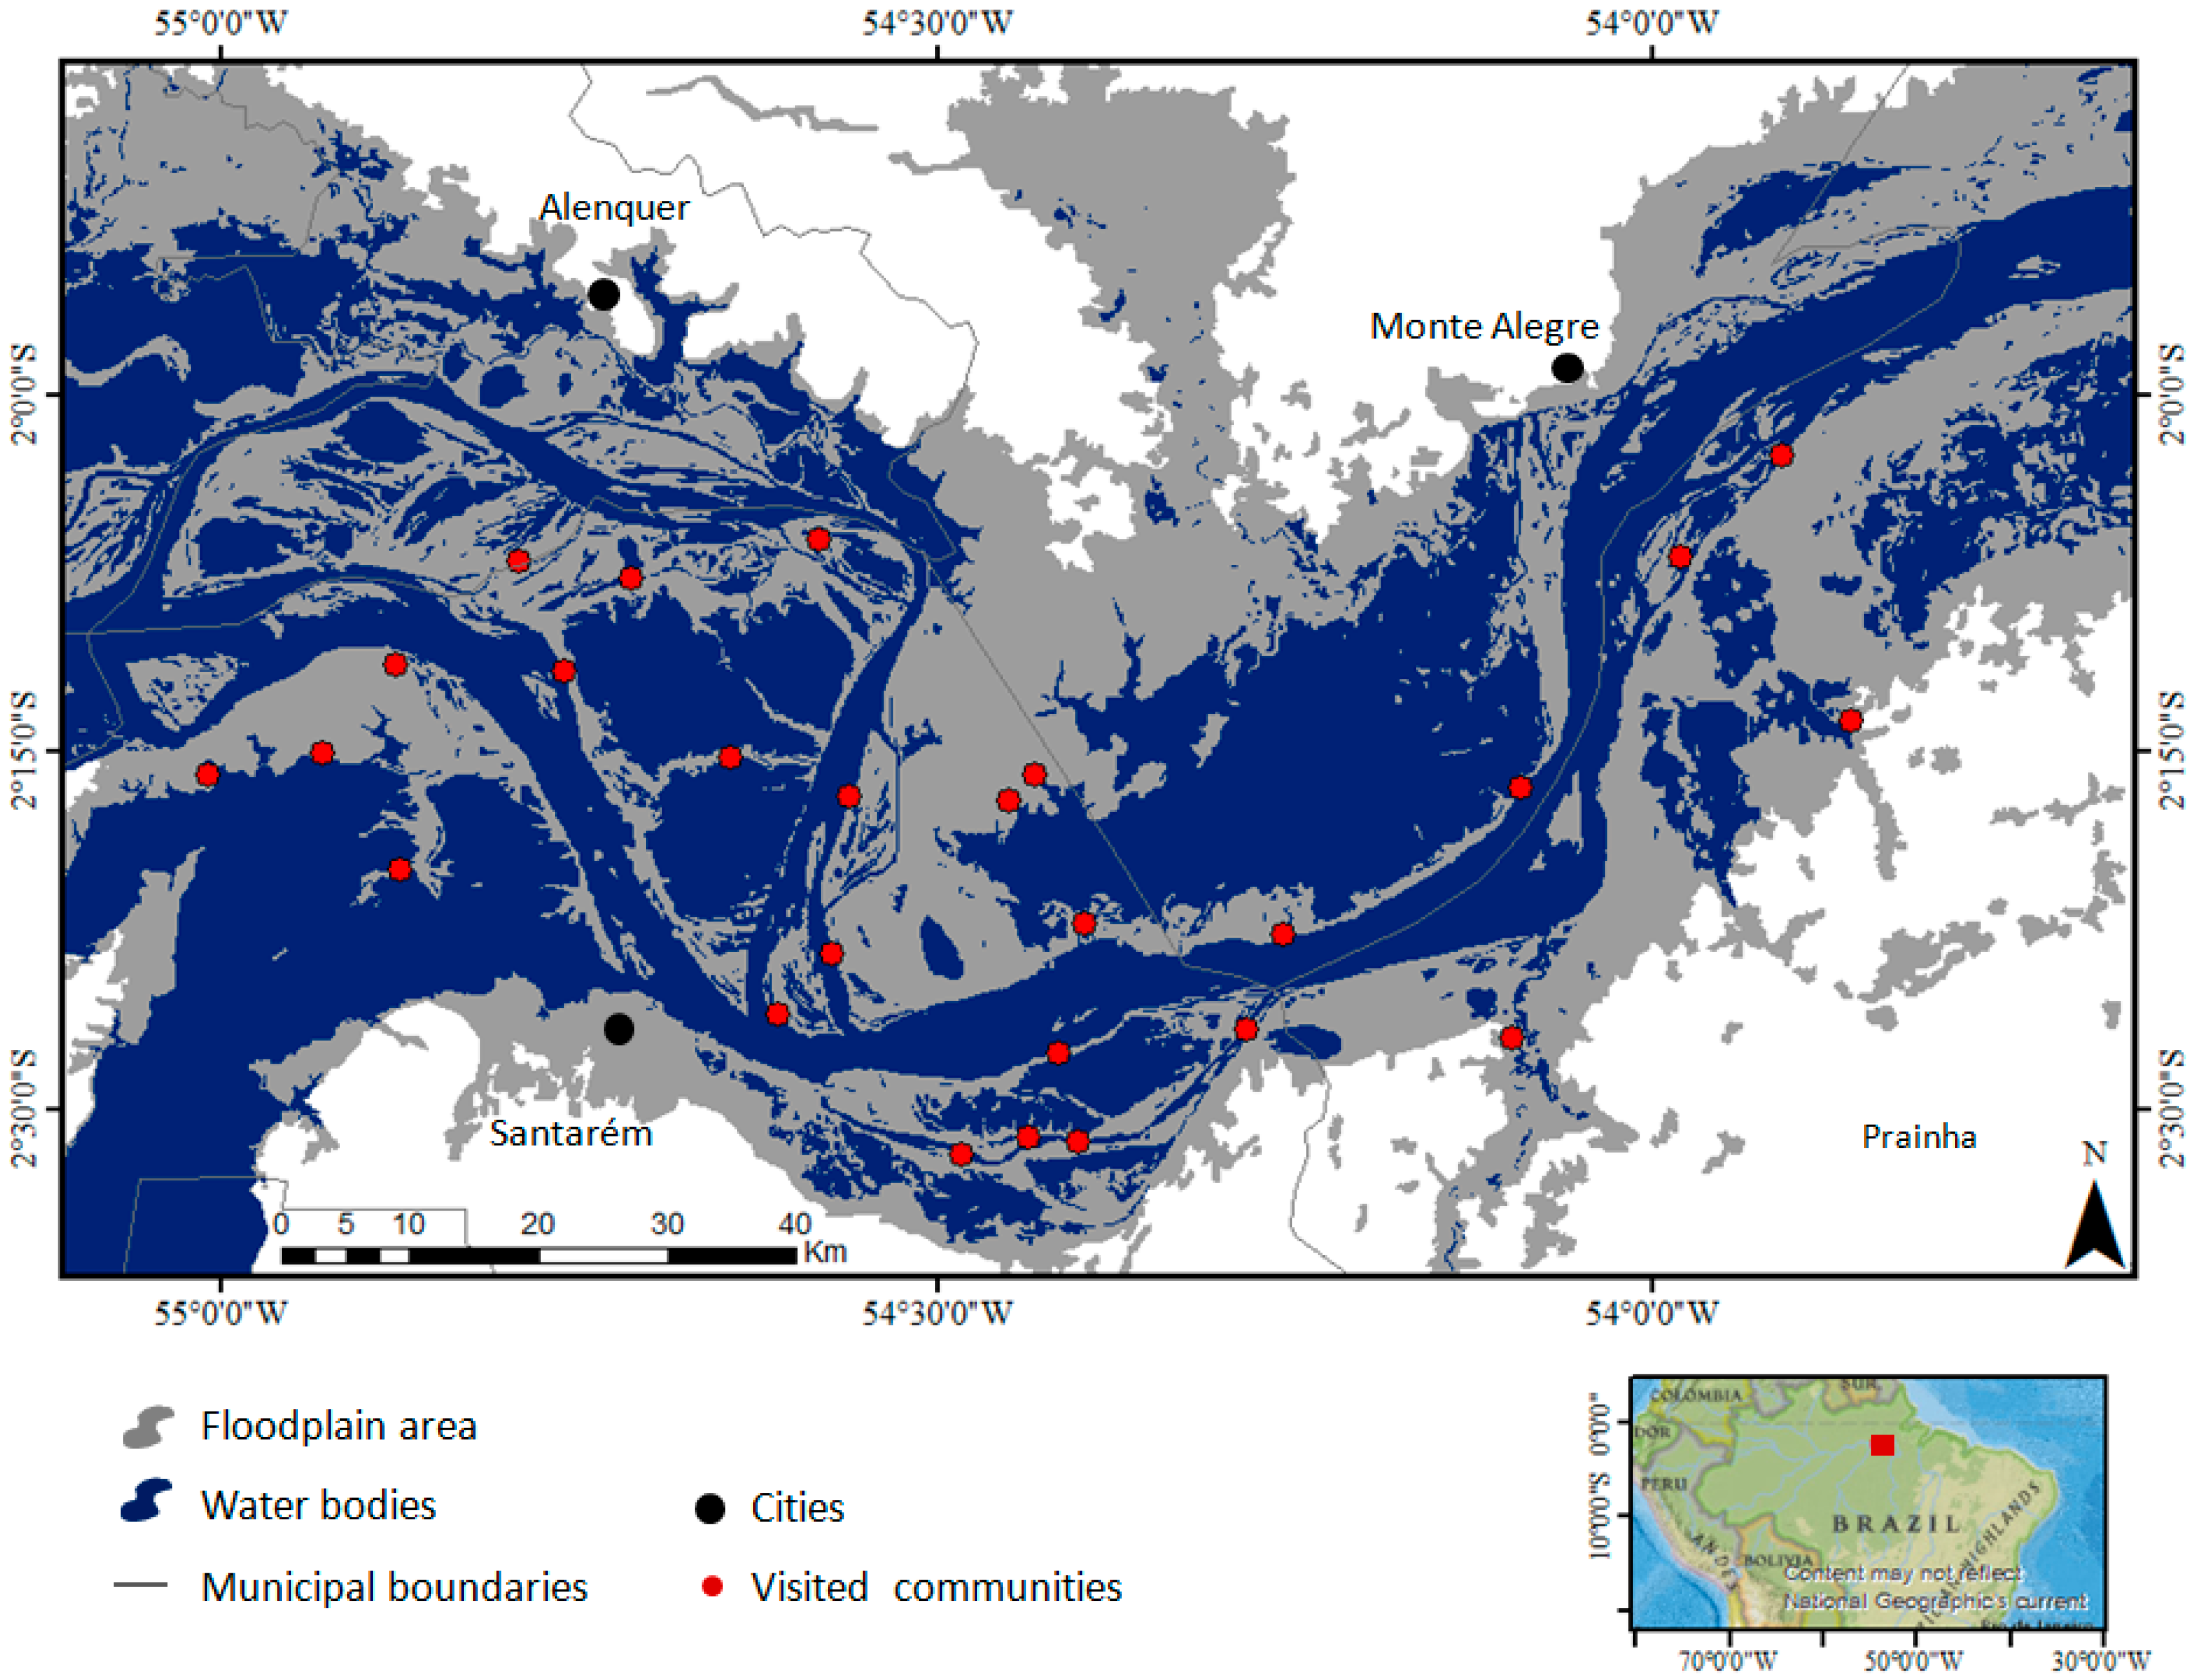
2. Study Area
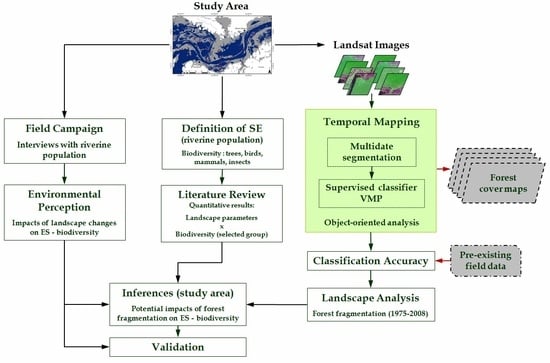
3. Materials and Methods
3.1. Definition of Ecosystem Services
3.2. Literature Review
3.3. Temporal Mapping of Forest Cover
3.4. Potential Impacts of Fragmentation
3.5. Environmental Perception of the Local Populations
4. Results
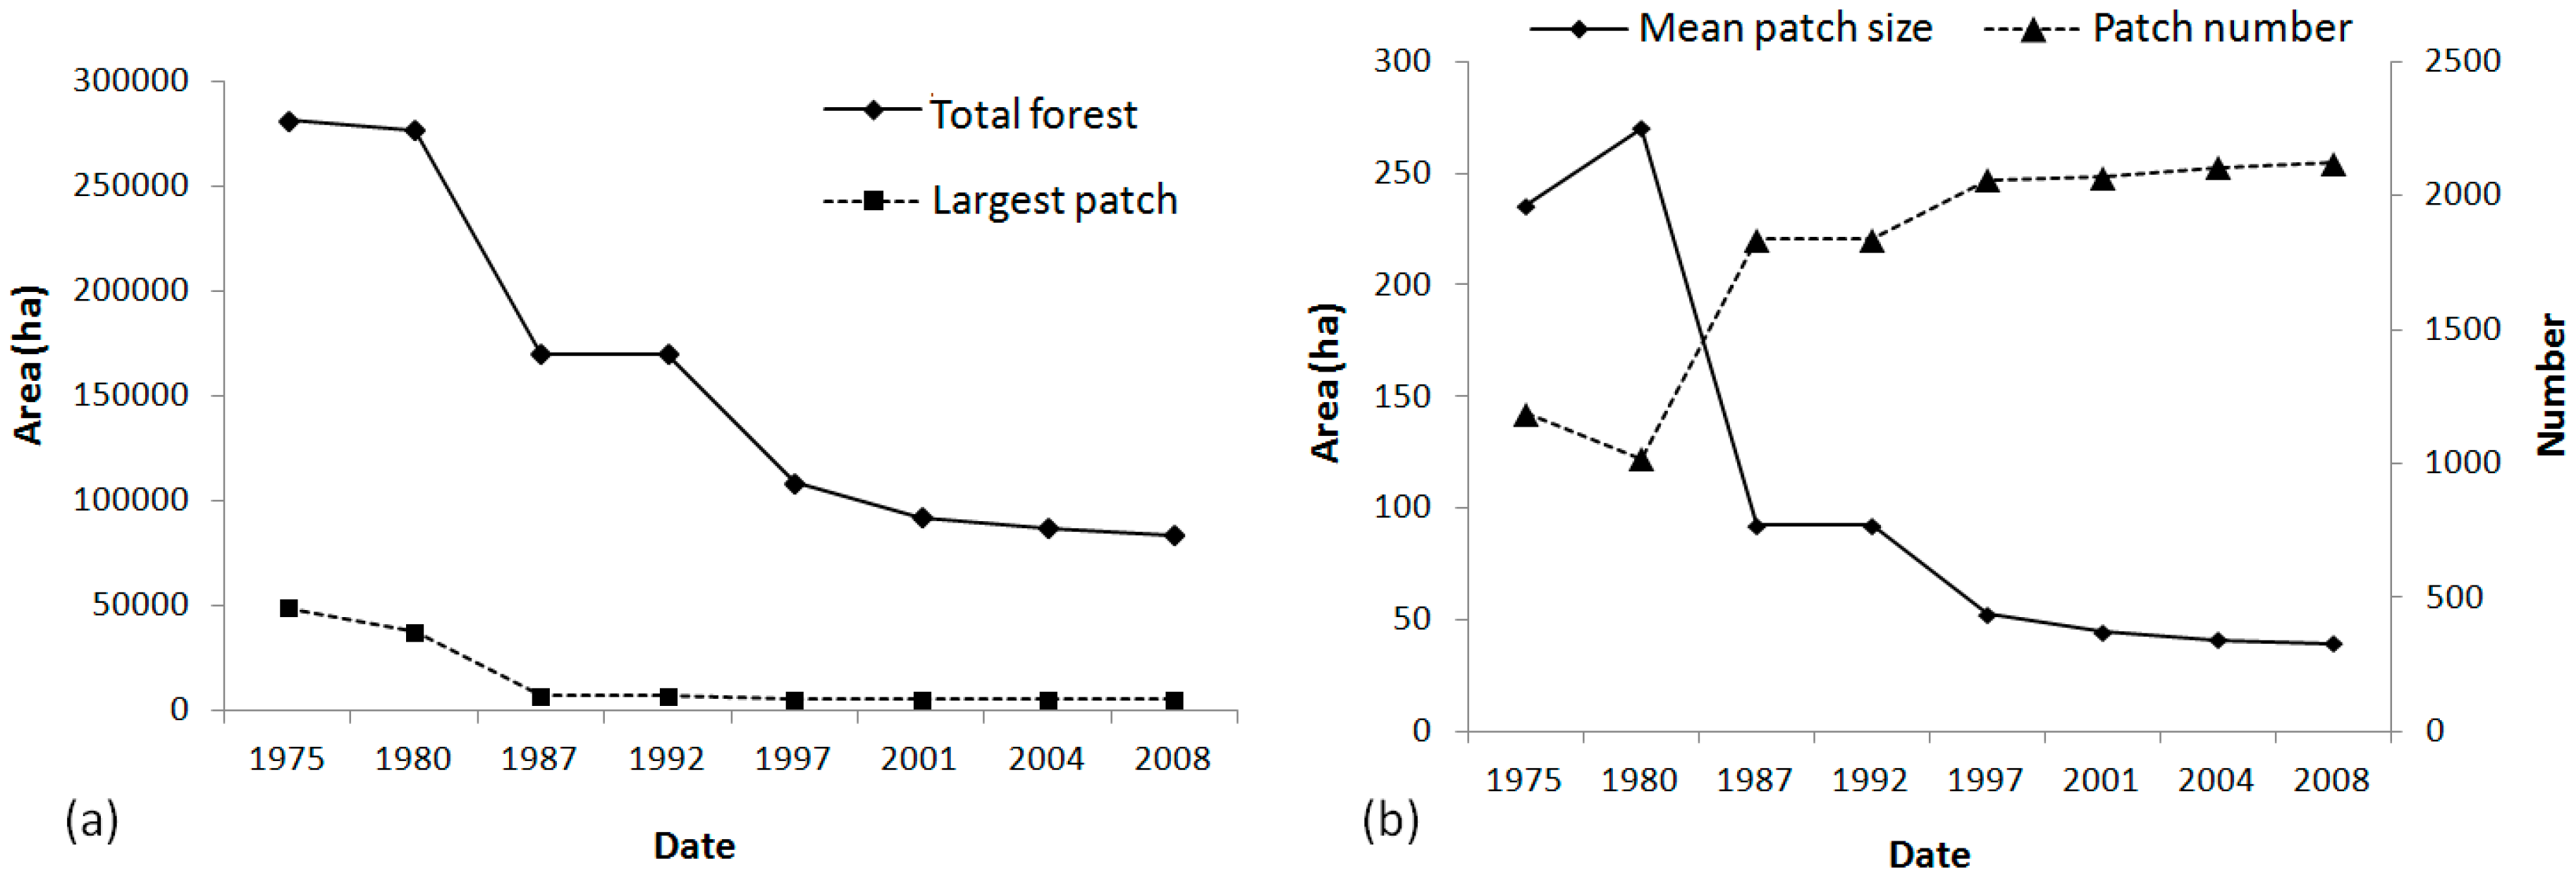
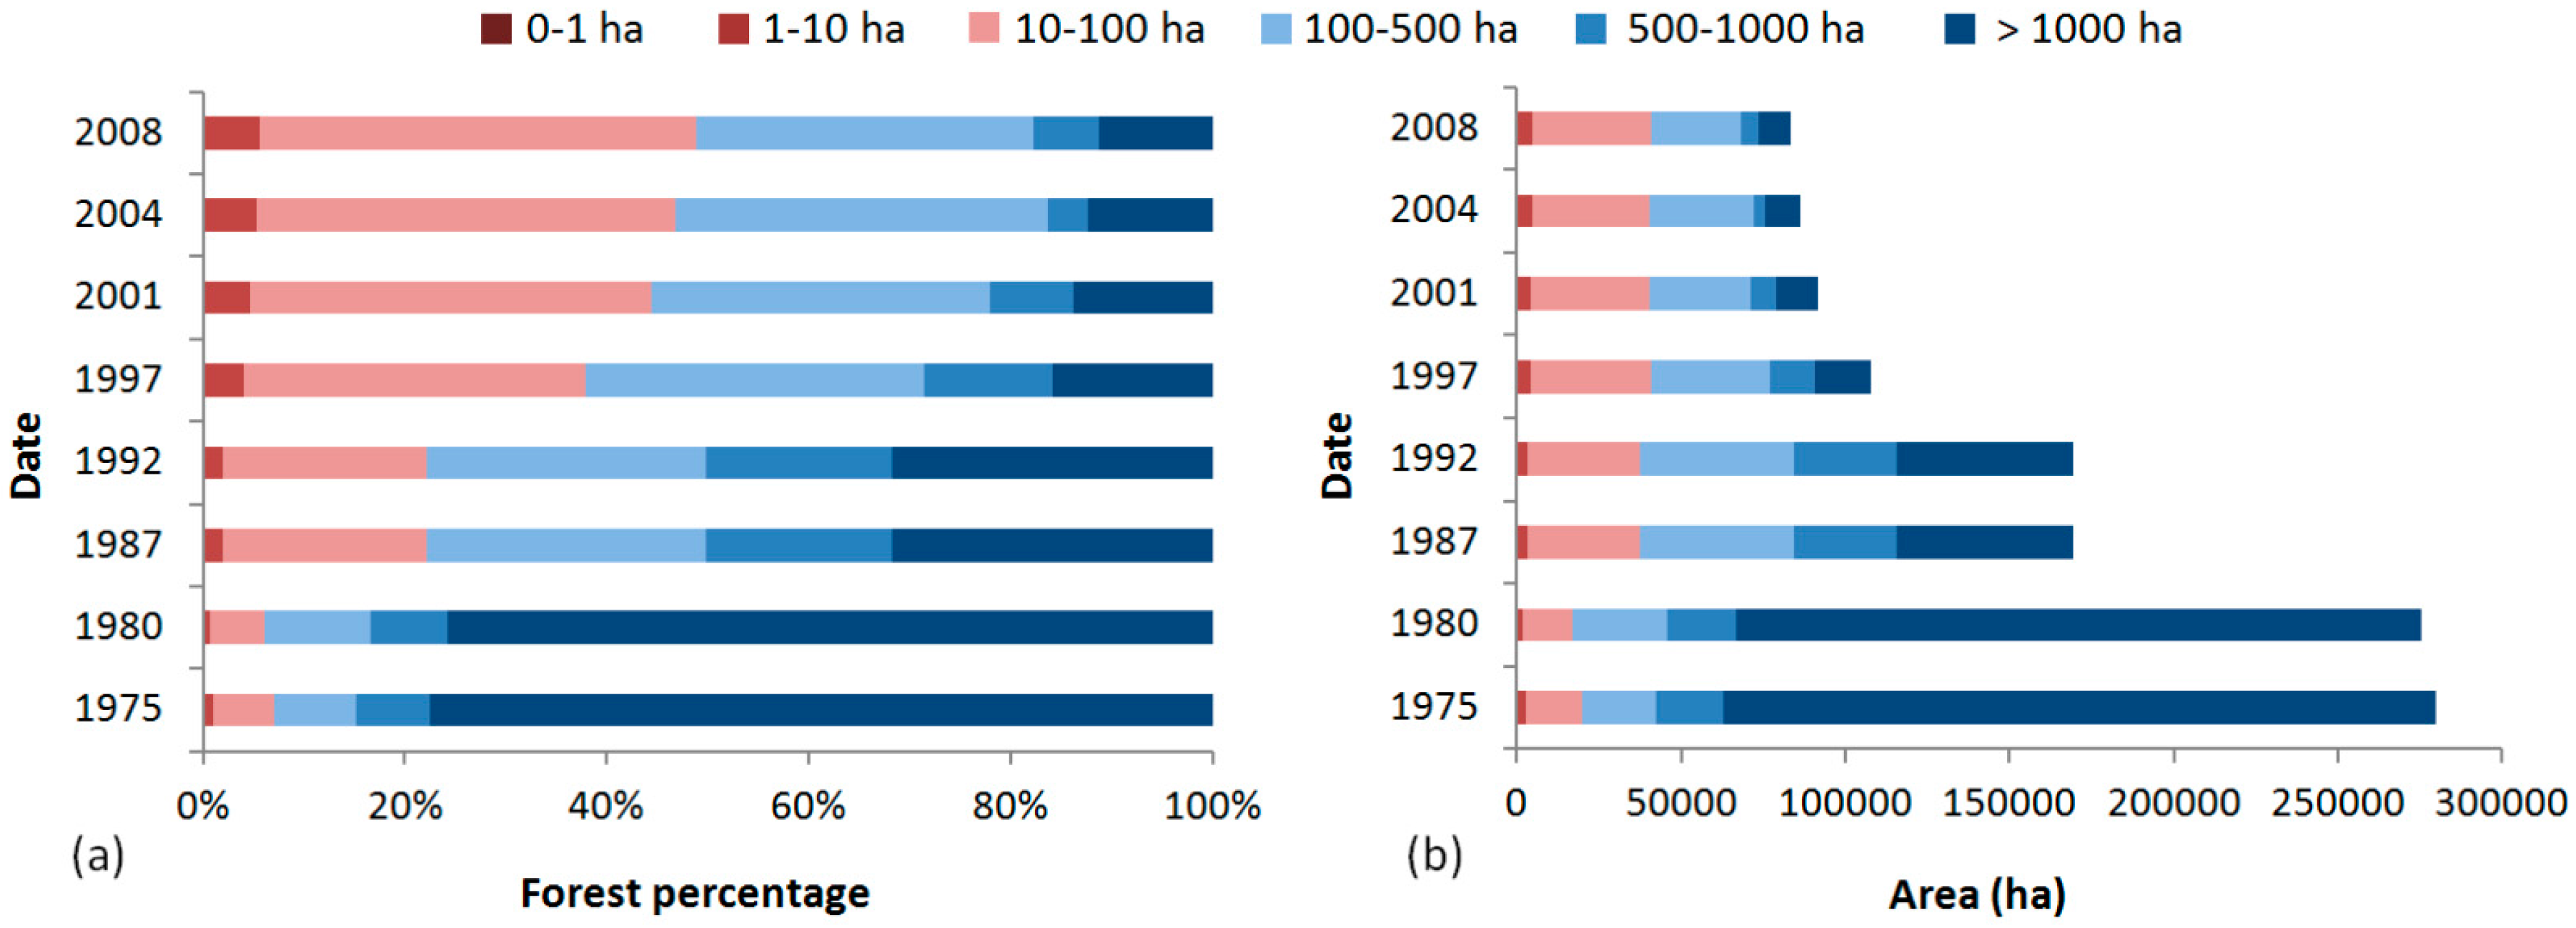
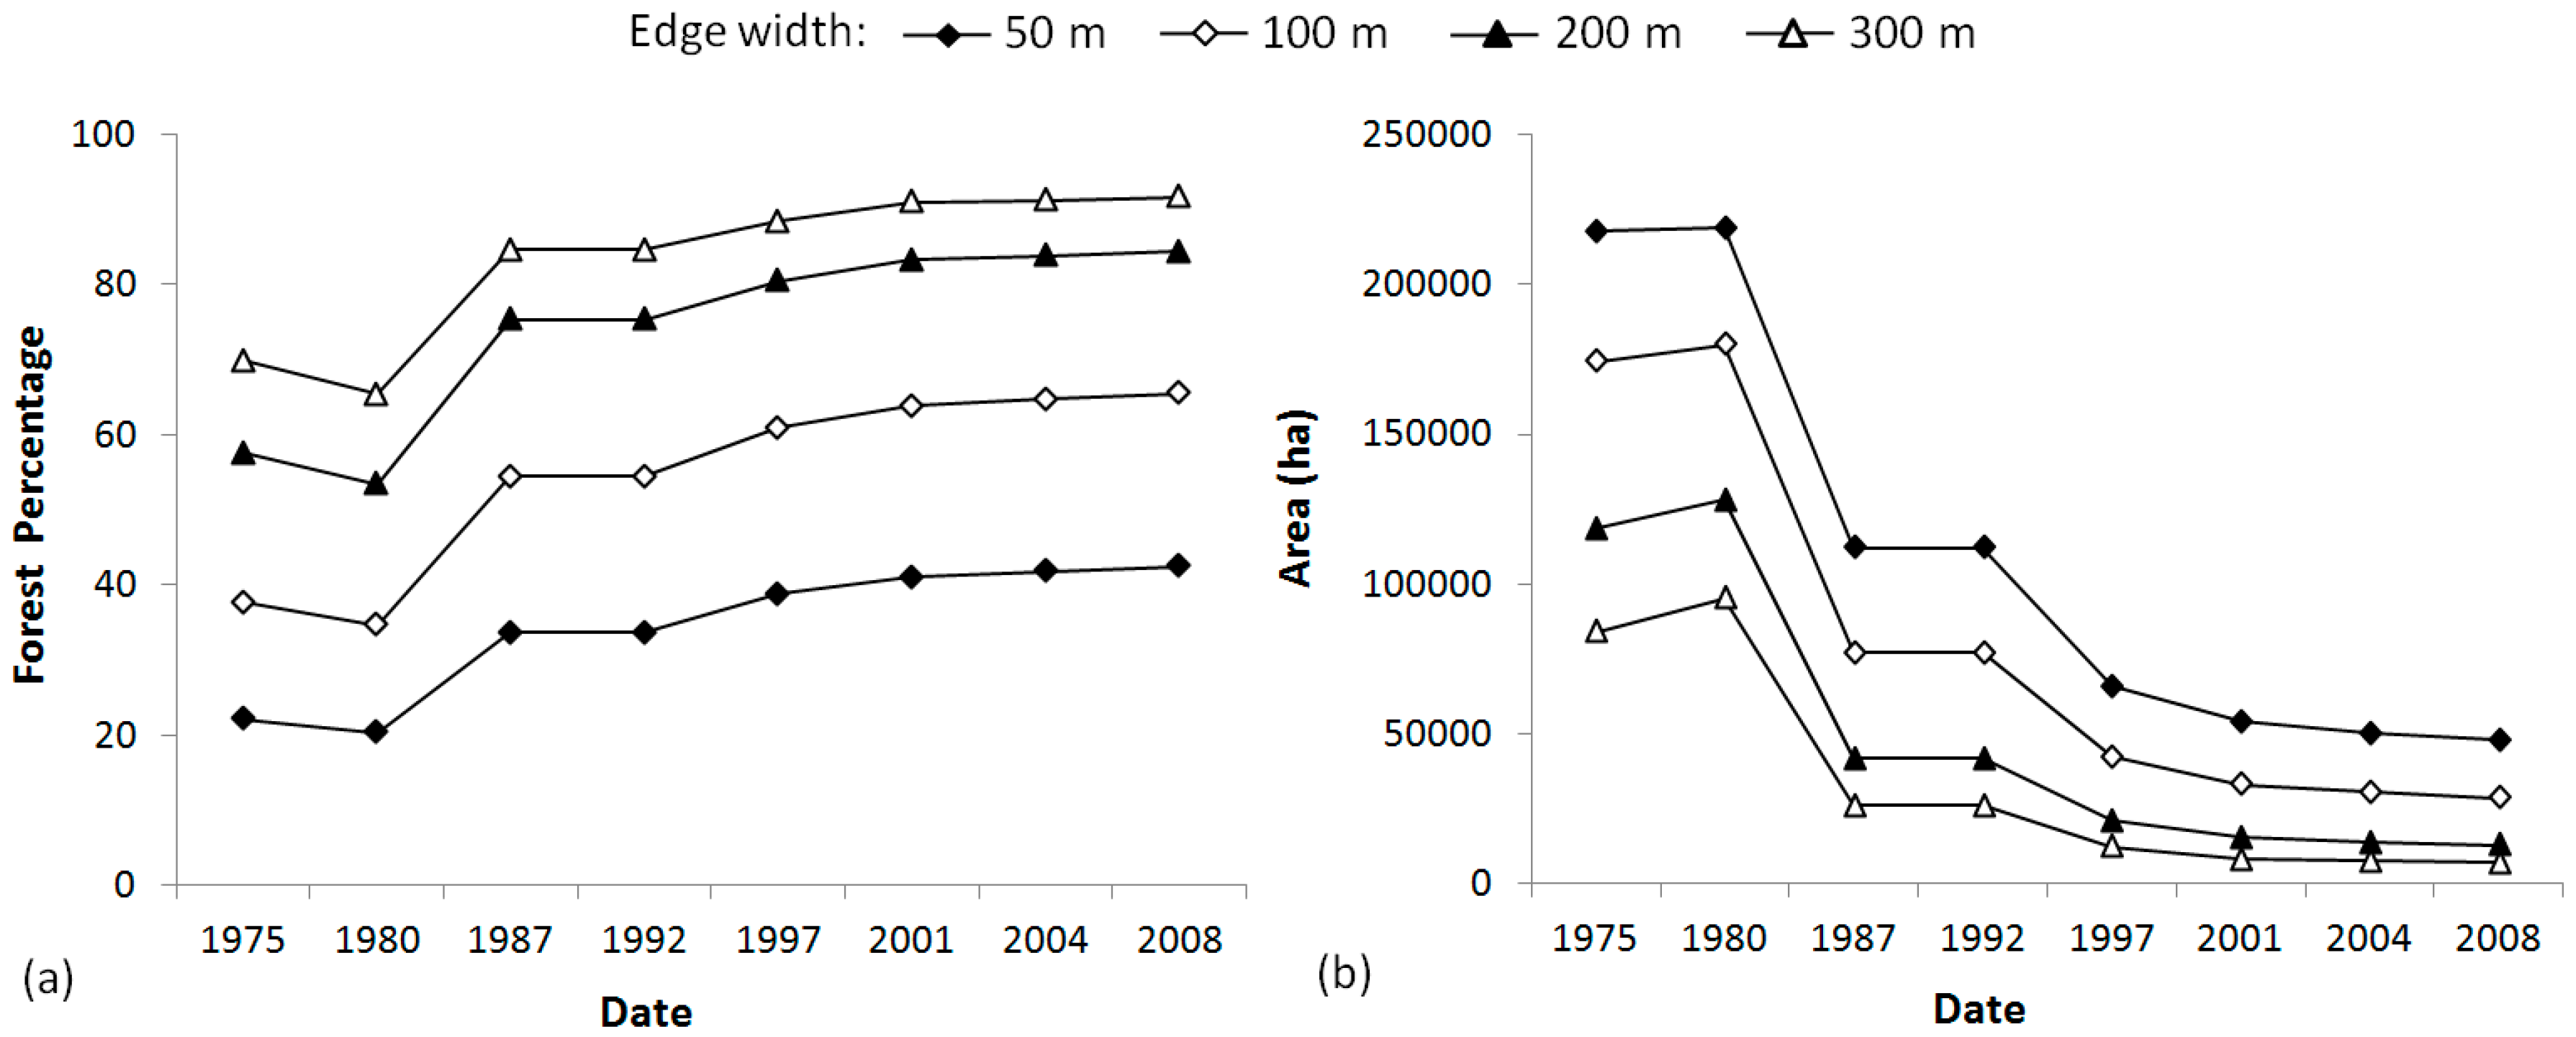
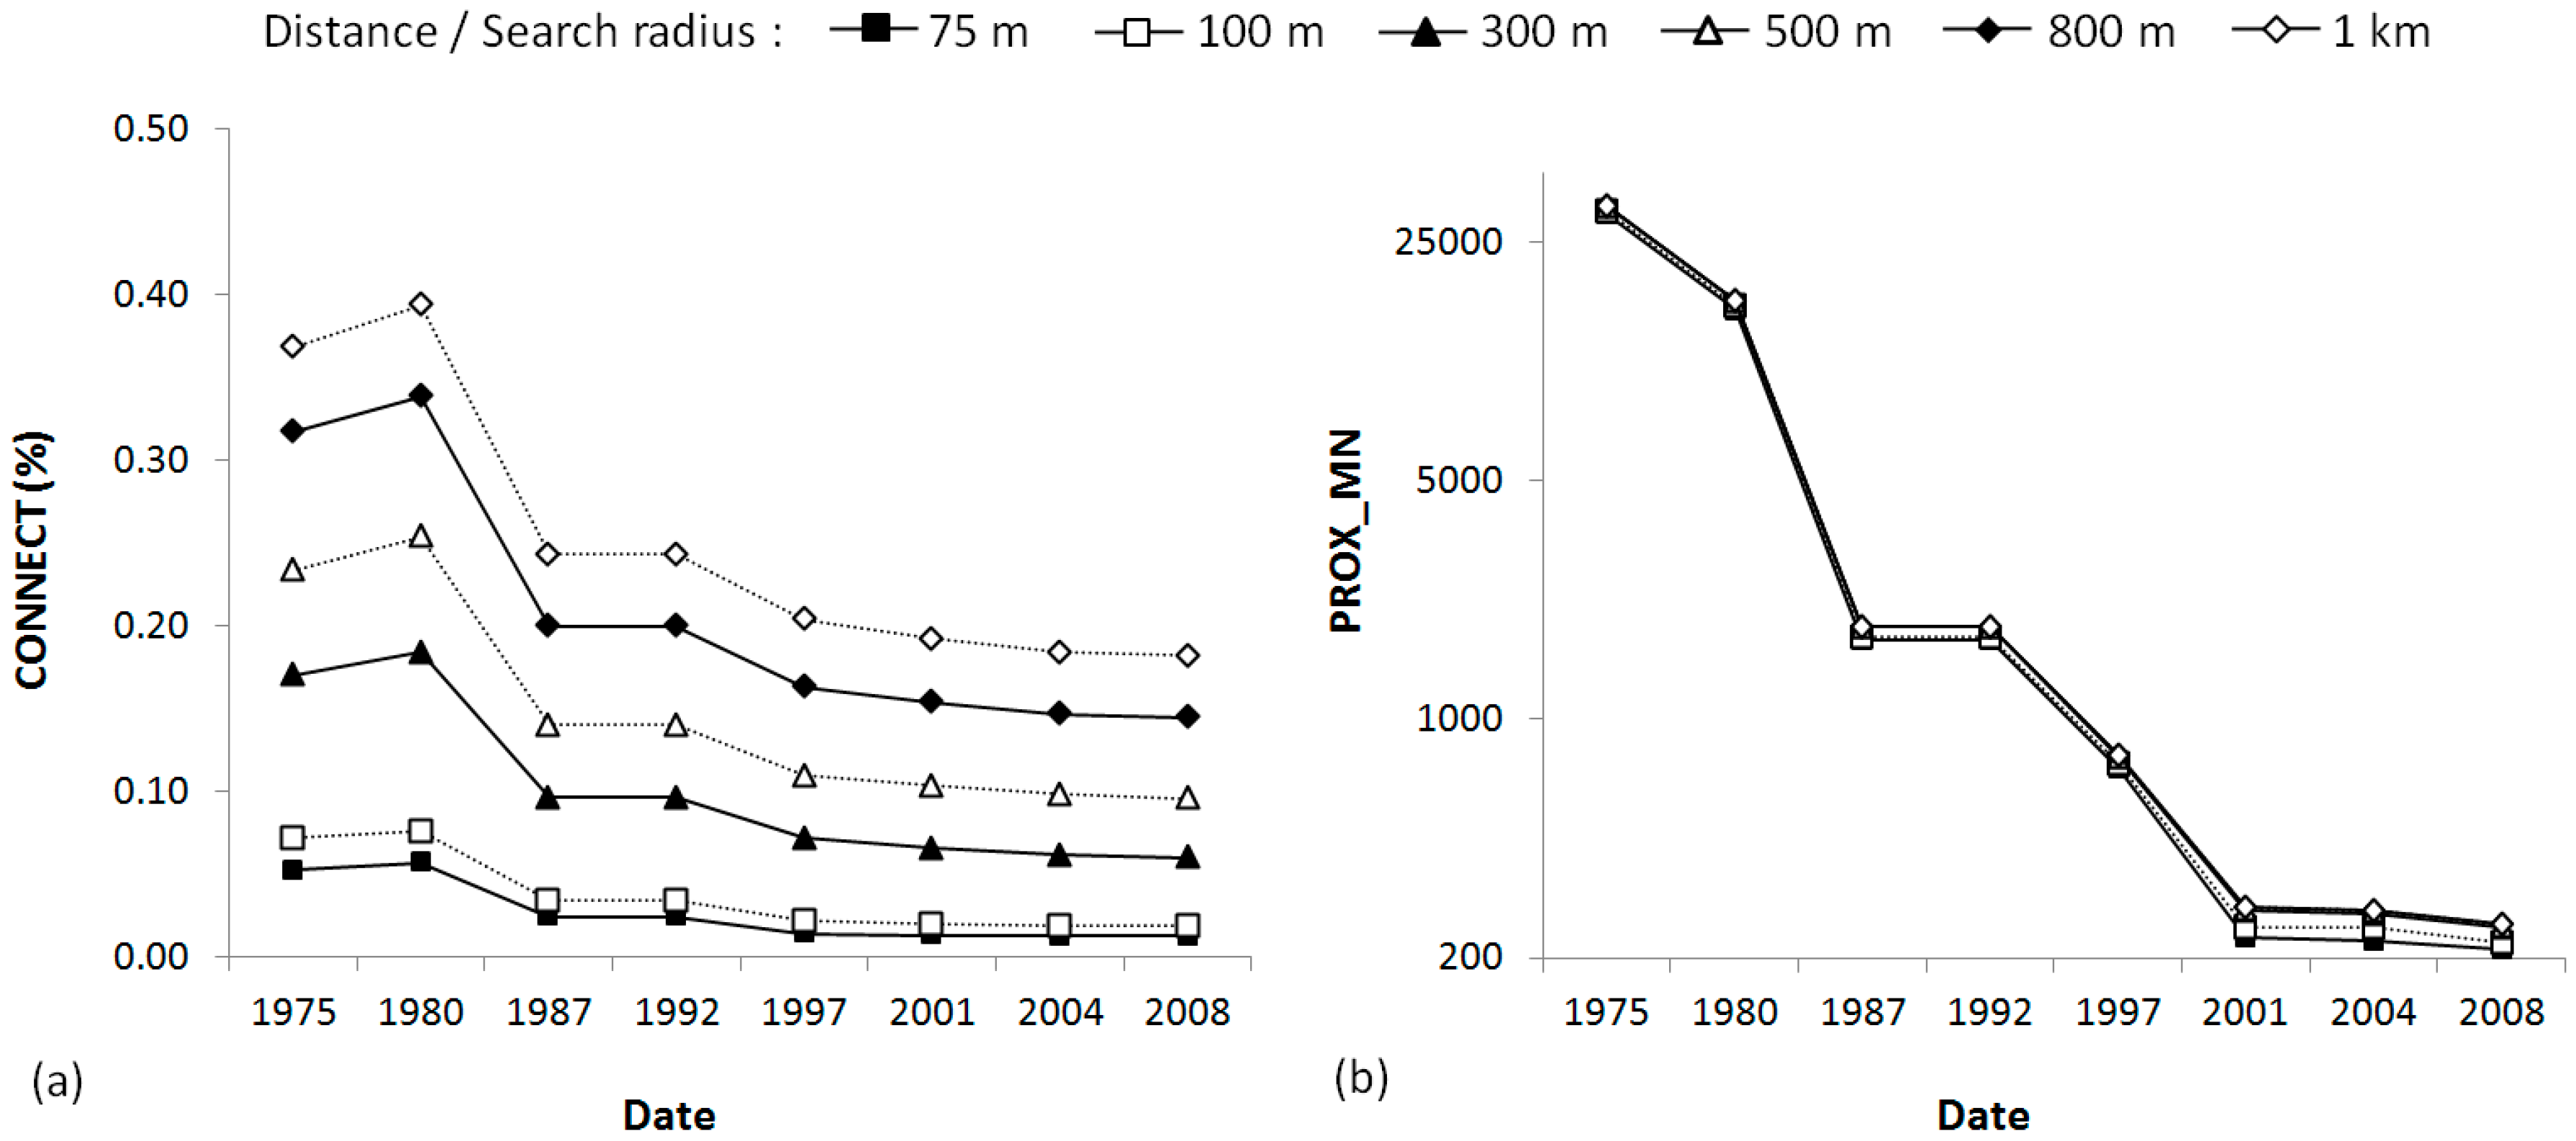
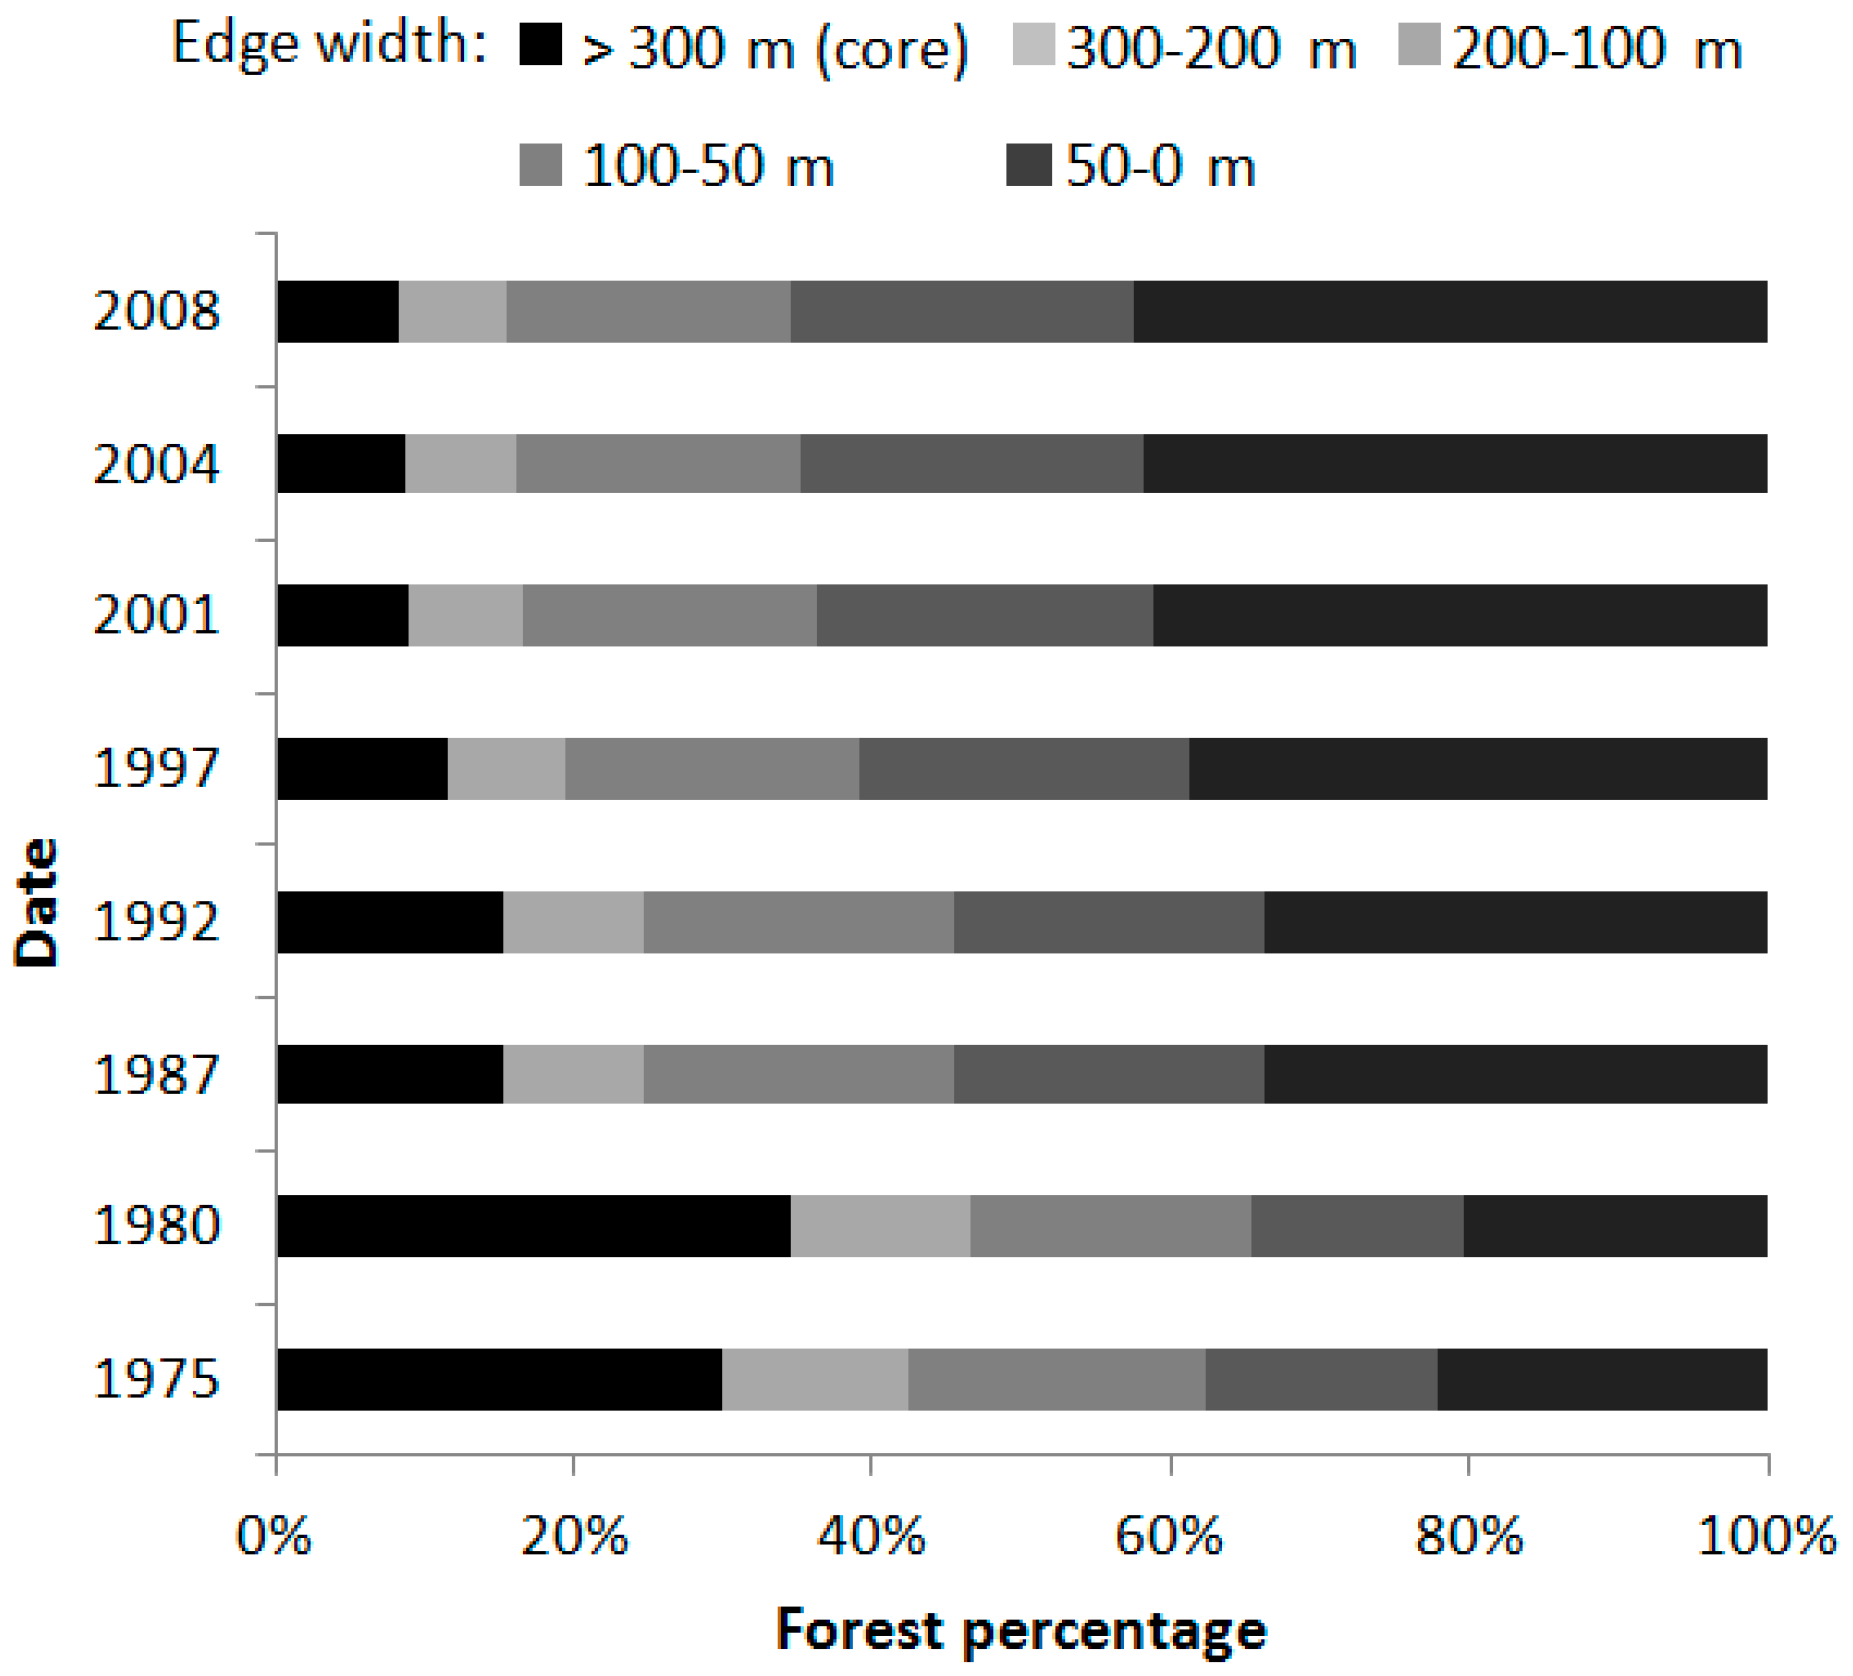
4.1. Dynamic of the Landscape
4.2. Fragmentation and Biodiversity
4.2.1. Biodiversity of Trees
4.2.2. Biodiversity of Birds
4.2.3. Biodiversity of Mammals
4.2.4. Biodiversity of Insects
4.3. Environmental Perception of Riverine Populations
5. Discussion
6. Conclusions
Supplementary Materials
Acknowledgments
Author Contributions
Conflicts of Interest
References
- Millennium Ecosystem Assessment. Ecosystems and Human Well-Being: A Framework for Assessment; Island Press: Washington, DC, USA, 2003. [Google Scholar]
- DeGroot, R.S.; Alkemade, R.; Braat, L.; Hein, L.; Willemen, L. Challenges in integrating the concept of ecosystem services and values in landscape planning, management and decision making. Ecol. Complex. 2010, 7, 260–272. [Google Scholar] [CrossRef]
- Ash, N.; Blanco, H.; Brown, C.; Garcia, K.; Henrichs, T.; Lucas, N.; Raudsepp-Hearne, C.; Simpson, R.D.; Scholes, R.; Tomich, T.P.; et al. Ecosystems and Human Well-Being: A Manual for Assessment Practitioners; Island Press: Washington, DC, USA; Covelo, CA, USA; London, UK, 2010. [Google Scholar]
- Ewel, K.C. Appreciating tropical coastal wetlands from a landscape perspective. Front. Ecol. Environ. 2010, 8, 20–26. [Google Scholar] [CrossRef]
- Millennium Ecosystem Assessment. Ecosystems and Human Well-Being: Synthesis—Wetlands and Water; Island Press: Washington, DC, USA, 2005. [Google Scholar]
- Hess, L.L.; Melack, J.M.; Affonso, A.G.; Barbosa, C.; Gastil-Buhl, M.; Novo, E.M.L.M. Wetlands of the Lowland Amazon Basin: Extent, Vegetative Cover, and Dual-season Inundated Area as Mapped with JERS-1 Synthetic Aperture Radar. Wetlands 2015, 35, 745–756. [Google Scholar] [CrossRef]
- Goulding, M.; Smith, N.; Mahar, D. Floods of Fortune: Ecology and Economy along the Amazon; Columbia University Press: New York, NY, USA, 1996. [Google Scholar]
- Ohly, J.J. Development of Central Amazonia in the Modern era. In The Central Amazon Floodplain: Actual Use and Options for a Sustainable Management; Junk, W.J., Ohly, J.J., Soares, M.G.M., Eds.; Backhuys Publishers: Leiden, The Netherlands, 2000. [Google Scholar]
- Schöngart, J. Growth-Oriented Logging (GOL): A new concept towards sustainable forest management in Central Amazonian várzea floodplains. For. Ecol. Manag. 2008, 256, 46–58. [Google Scholar] [CrossRef]
- Wittmann, F.; Wittmann, A.O. Use of Amazonian floodplain trees. In Amazonian Floodplain Forests: Ecophysiology, Biodiversity and Sustainable Management; Junk, W.J., Piedade, M.T.F., Wittmann, F., Schongart, J., Parolin, P., Eds.; Springer: Berlin, Germany, 2010; pp. 389–418. [Google Scholar]
- IBGE Population Census 2010: Brazilian Institute of Geography and Statistics (IBGE) Brazilian Institute of Geography and Statistics. Available online: http://www.ibge.gov.br/ (accessed on 1 January 2015).
- McGrath, D.G.; Almeida, O.T.; Merry, F.D. The influence of community management agreements on household economic strategies: Cattle grazing and fishing agreements on the Lower Amazon floodplain. Int. J. Commons 2007, 1, 67–87. [Google Scholar] [CrossRef]
- Somoza, R.C.D. Impacto do Desflorestamento na Velocidade de Propagação da Água em Zonas de Várzea do Baixo Amazonas; Instituto Nacional de Pesquisas Espaciais (INPE): São José dos Campos, Brazil, 2015. [Google Scholar]
- Bayley, P.B. Understanding large river: Floodplain ecosystems. Bioscience 1995, 45, 153–158. [Google Scholar] [CrossRef]
- Malmqvist, B.; Rundle, S. Threats to the running water ecosystems of the world. Environ. Conserv. 2002, 29, 134–153. [Google Scholar] [CrossRef]
- Castello, L.; McGrath, D.G.; Hess, L.L.; Coe, M.T.; Lefebvre, P.A.; Petry, P.; Macedo, M.N.; Renó, V.F.; Arantes, C.C. The vulnerability of Amazon freshwater ecosystems. Conserv. Lett. 2013, 6, 217–229. [Google Scholar] [CrossRef]
- Renó, V.F.; Novo, E.M.L.M.; Suemitsu, C.; Rennó, C.D.; Silva, T.S.F. Assessment of deforestation in the Lower Amazon floodplain using historical Landsat MSS/TM imagery. Remote Sens. Environ. 2011, 115, 3446–3456. [Google Scholar] [CrossRef]
- Winklerprins, A.M.G.A. Jute cultivation in the lower Amazon, 1940–1990: An ethnographic account from Santarém, Pará, Brazil. J. Hist. Geogr. 2006, 32, 818–838. [Google Scholar] [CrossRef]
- Barbarisi, B.F.; Renó, V.F.; Barbosa, C.C.F.; Novo, E.M.L.M. Integração de dados censitários e de sensoriamento remoto para estimar o rebanho bovino e bubalino da várzea do Baixo Amazonas. In Novas Tecnologias para o Monitoramento e Estudo de Reservatórios Hidrelétricos e Grandes Lagos; Alcântara, E.H., Novo, E.M.L.M., Stech, J.L., Eds.; Parêntese Editora: São José dos Campos, Brazil, 2010; Volume 1, pp. 257–273. [Google Scholar]
- Barros, A.C.; Uhl, C. Padrões, Problemas e Potencial da Extração Madeireira ao Longo do Rio Amazonas e do seu Estuário; IMAZOM: Belém, Brasil, 1997; Volume 4. [Google Scholar]
- Sheikh, P.A.; Merry, F.D.; McGrath, D.G. Water buffalo and cattle ranching in the Lower Amazon Basin: Comparisons and conflicts. Agric. Syst. 2006, 87, 313–330. [Google Scholar] [CrossRef]
- Renó, V.F.; Novo, E.M.L.M. Alterações da paisagem de várzea do Baixo Amazonas entre 1970 e 2008. In Anais XVI Simpósio Brasileiro de Sensoriamento Remoto—SBSR; Instituto Nacional de Pesquisas Espaciais (INPE): Foz do Iguaçu, Brasil, 2013; pp. 7778–7785. [Google Scholar]
- Fu, B.; Wang, S.; Su, C.; Forsius, M. Linking ecosystem processes and ecosystem services. Curr. Opin. Environ. Sustain. 2013, 5, 4–10. [Google Scholar] [CrossRef]
- Naeem, S.; Bunker, D.E.; Hector, A.; Loreau, M.; Perrings, C. Biodiversity, Ecosystem Functioning, and Human Wellbeing: An Ecological and Economic Perspective; Naeem, S., Bunker, D.E., Hector, A., Loreau, M., Perrings, C., Eds.; Oxford University Press: New York, NY, USA, 2009. [Google Scholar]
- Naveh, Z. Landscape ecology and sustainability. Landsc. Ecol. 2007, 22, 1437–1440. [Google Scholar] [CrossRef]
- Turner, M.G.; Donato, D.C.; Romme, W.H. Consequences of spatial heterogeneity for ecosystem services in changing forest landscapes: Priorities for future research. Landsc. Ecol. 2013, 28, 1081–1097. [Google Scholar] [CrossRef]
- Farwig, N.; Bailey, D.; Bochud, E.; Herrmann, J.D.; Kindler, E.; Reusse, N.; Schuepp, C.; Martin, H.; Schmidt-Entling, M.H. Isolation from forest reduces pollination, seed predation and insect scavenging in Swiss farmland. Landsc. Ecol. 2009, 24, 919–927. [Google Scholar] [CrossRef]
- Kruess, A.; Tscharntke, T. Habitat fragmentation, species loss, and biological control. Science 1994, 264, 1581–1584. [Google Scholar] [CrossRef] [PubMed]
- Marichal, R.; Grimaldi, M.; Feijoo, M.A.; Oszwald, J.; Praxedes, C.; Ruiz Cobo, D.H.; del Pilar Hurtado, M.; Desjardins, T.; da Silva Junior, M.L.; da Silva Costa, L.G.; et al. Soil macroinvertebrate communities and ecosystem services in deforested landscapes of Amazonia. Appl. Soil Ecol. 2014, 83, 177–185. [Google Scholar] [CrossRef]
- Ouyang, W.; Skidmore, A.K.; Hao, F.; Wang, T. Soil erosion dynamics response to landscape pattern. Sci. Total Environ. 2010, 408, 1358–1366. [Google Scholar] [CrossRef] [PubMed]
- Ricketts, T.H.; Regetz, J.; Steffan-Dewenter, I.; Cunningham, S.A.; Kremen, C.; Bogdanski, A.; Gemmill-Herren, B.; Greenleaf, S.S.; Klein, A.M.; Mayfield, M.M.; et al. Landscape effects on crop pollination services: Are there general patterns? Ecol. Lett. 2008, 11, 499–515. [Google Scholar] [CrossRef] [PubMed]
- Burkhard, B.; Kroll, F.; Müller, F. Landscapes’ Capacities to Provide Ecosystem Services—A Concept for Land-Cover Based Assessments. Landsc. Online 2009, 15, 1–22. [Google Scholar] [CrossRef]
- Ferraz, S.F.B.; Ferraz, K.M.P.M.B.; Cassiano, C.C.; Brancalion, P.H.S.; Luz, D.T.A.; Azevedo, T.N.; Tambosi, L.R.; Metzger, J.P. How good are tropical forest patches for ecosystem services provisioning? Landsc. Ecol. 2014, 29, 187–200. [Google Scholar] [CrossRef]
- Franco, D.; Mannino, I.; Zanetto, G. The impact of agroforestry networks on scenic beauty estimation: The role of a landscape ecological network on a socio-cultural process. Landsc. Urban Plan. 2003, 62, 119–138. [Google Scholar] [CrossRef]
- Frank, S.; Fürst, C.; Koschke, L.; Makeschin, F. A contribution towards a transfer of the ecosystem service concept to landscape planning using landscape metrics. Ecol. Indic. 2012, 21, 30–38. [Google Scholar] [CrossRef]
- Haines-Young, R.; Potschin, M.; Kienast, F. Indicators of ecosystem service potential at European scales: Mapping marginal changes and trade-offs. Ecol. Indic. 2012, 21, 39–53. [Google Scholar] [CrossRef]
- Junk, W.J.; Bayley, P.B.; Sparks, R.E. The Flood Pulse Concept in River-Floodplain Systems. Int. Large River Symp. 1989, 106, 110–127. [Google Scholar]
- ANA National Water Agency Brazil (ANA). HidroWeb. Available online: http://www.snirh.gov.br/hidroweb/ (accessed on 1 July 2015).
- Benchimol, M.; Peres, C.A. Edge-mediated compositional and functional decay of tree assemblages in Amazonian forest islands after 26 years of isolation. J. Ecol. 2015, 103, 408–420. [Google Scholar] [CrossRef]
- Kapos, V.; Ganade, G.; Matsui, E.; Victoria, R.L. ∂^13C as an indicator of edge effects in tropical rainforest reserves. J. Ecol. 1993, 81, 425–432. [Google Scholar] [CrossRef]
- Laurance, W.F.; Ferreira, L.V.; Rankin-de Merona, J.M.; Laurance, S.G. Rain forest fragmentation and the dynamics of Amazonian tree communities. Ecology 1998, 79, 2032–2040. [Google Scholar] [CrossRef]
- Laurance, W.F.; Lovejoy, T.E.; Vasconcelos, H.L.; Bruna, E.M.; Didham, R.K.; Stouffer, P.C.; Gascon, C.; Bierregaard, R.O.; Laurance, S.G.; Sampaio, E. Ecosystem decay of Amazonian forest fragments: A 22-year investigation. Conserv. Biol. 2002, 16, 605–618. [Google Scholar] [CrossRef]
- Metzger, J.P. Tree functional group richness and landscape structure in a brazilian tropical fragmented landscape. Ecol. Appl. 2000, 10, 1147–1161. [Google Scholar] [CrossRef]
- Michalski, F.; Nishi, I.; Peres, C.A. Disturbance-mediated drift in tree functional groups in Amazonian forest fragments. Biotropica 2007, 39, 691–701. [Google Scholar] [CrossRef]
- Santos, B.A.; Tabarelli, M.; Melo, F.P.L.; Camargo, L.C.; Andrade, A.; Laurance, S.G.; Laurance, W.F. Phylogenetic Impoverishment of Amazonian Tree Communities in an Experimentally Fragmented Forest Landscape. PLoS ONE 2014, 9, e113109. [Google Scholar] [CrossRef] [PubMed]
- Lees, A.C.; Peres, C.A. Avian life-history determinants of local extinction risk in a hyper-fragmented neotropical forest landscape. Anim. Conserv. 2008, 11, 128–137. [Google Scholar] [CrossRef]
- Lees, A.C.; Peres, C.A. Gap-crossing movements predict species occupancy in Amazonian forest fragments. Oikos 2009, 118, 280–290. [Google Scholar] [CrossRef]
- Lovejoy, T.E.; Bierregaard, R.O.; Rylands, A.B.; Malcom, J.R.; Quintela, C.E.; Harper, L.H.H.; Brown, K.S.; Powell, A.H.; Powell, G.V.N.; Shubart, H.O.R.; et al. Edge and other effects of isolation on Amazon forest fragments. In Conservation Biology: The Science of Scarcity and Diversity; Soulé, M.E., Ed.; Sinauer Associates: Sunderland, MA, USA, 1986; pp. 257–285. [Google Scholar]
- Stouffer, P.C.; Bierregaard, R.O. Effects of Forest Fragmentation on Understory Hummingbirds in Amazonian Brazil. Conserv. Biol. 1995, 9, 1085–1094. [Google Scholar] [CrossRef]
- Stouffer, P.C.; Bierregaard, R.O. Use of Amazonian Forest Fragments by Understory Insectivorous Birds. Ecology 1995, 76, 2429–2445. [Google Scholar] [CrossRef]
- Stratford, J.A.; Stouffer, P.C. Local extinctions of terrestrial insectivorous birds in a fragmented landscape near Manaus, Brazil. Conserv. Biol. 1999, 13, 1416–1423. [Google Scholar] [CrossRef]
- Stratford, J.A.; Stouffer, P.C. Forest fragmentation alters microhabitat availability for Neotropical terrestrial insectivorous birds. Biol. Conserv. 2015, 188, 109–115. [Google Scholar] [CrossRef]
- Lees, A.C.; Peres, C.A. Conservation value of remnant riparian forest corridors of varying quality for Amazonian birds and mammals. Conserv. Biol. 2008, 22, 439–449. [Google Scholar] [CrossRef] [PubMed]
- Lyra-Jorge, M.C.; Ribeiro, M.C.; Ciocheti, G.; Tambosi, L.R.; Pivello, V.R. Influence of multi-scale landscape structure on the occurrence of carnivorous mammals in a human-modified savanna, Brazil. Eur. J. Wildl. Res. 2009, 56, 359–368. [Google Scholar] [CrossRef]
- Michalski, F.; Peres, C.A. Disturbance-Mediated Mammal Persistence and Abundance-Area Relationships in Amazonian Forest Fragments. Conserv. Biol. 2007, 21, 1626–1640. [Google Scholar] [CrossRef] [PubMed]
- Santos-Filho, M.; Peres, C.A.; Silva, D.J.; Sanaiotti, T.M. Habitat patch and matrix effects on small-mammal persistence in Amazonian forest fragments. Biodivers. Conserv. 2012, 21, 1127–1147. [Google Scholar] [CrossRef]
- Stevens, S.M.; Husband, T.P. The influence of edge on small mammals: Evidence from Brazilian Atlantic forest fragments. Biol. Conserv. 1998, 85, 1–8. [Google Scholar] [CrossRef]
- Bianchi, F.J.J.A.; Booij, C.J.H.; Tscharntke, T. Sustainable pest regulation in agricultural landscapes: A review on landscape composition, biodiversity and natural pest control. Proc. Biol. Sci. 2006, 273, 1715–1727. [Google Scholar] [CrossRef] [PubMed]
- Brosi, B.J.; Daily, G.C.; Ehrlich, P.R. Bee community shifts with landscape context in a tropical countryside. Ecol. Appl. 2007, 17, 418–430. [Google Scholar] [CrossRef] [PubMed]
- Brown, C.; Albrecht, C. The Effect of Tropical Deforestation on Stingless Bees of the Genus Melipona (Insecta: Hymenoptera: Apidae: Meliponini) in Central Rondonia, Brazil. J. Biogeogr. 2001, 28, 623–634. [Google Scholar] [CrossRef]
- Carvalho, K.S.; Vasconcelos, H.L. Forest fragmentation in central Amazonia and its effects on litter-dwelling ants. Biol. Conserv. 1999, 91, 151–157. [Google Scholar] [CrossRef]
- Didham, R.K.; Ghazoul, J.; Stork, N.E.; Davis, A.J. Insects in fragmented forests: A functional approach. Trends Ecol. Evol. 1996, 11, 255–260. [Google Scholar] [CrossRef]
- Dohm, C.; Leal, I.R.; Tabarelli, M.; Meyer, S.T.; Wirth, R.; Dohm, C.; Leal, I.R.; Tabarelli, M.; Meyer, S.T.; Wirth, R. Leaf-cutting ants proliferate in the Amazon: an expected response to forest edge? J. Trop. Ecol. 2011, 27, 645–649. [Google Scholar] [CrossRef]
- Guimarães, C.; Viana, J.P.R.; Cornelissen, T. A meta-analysis of the effects of fragmentation on herbivorous insects. Environ. Entomol. 2014, 43, 537–545. [Google Scholar] [CrossRef] [PubMed]
- Hadley, A.S.; Betts, M.G. The effects of landscape fragmentation on pollination dynamics: Absence of evidence not evidence of absence. Biol. Rev. Camb. Philos. Soc. 2012, 87, 526–544. [Google Scholar] [CrossRef] [PubMed]
- Ricketts, T.H.; Williams, N.M.; Mayfield, M.M. Connectivity and ecosystem services: crop pollination in agricultural landscapes. In Connectivity Conservation; Crooks, K.R., Sanjayan, M.A., Eds.; Cambridge University Press: Cambridge, UK, 2006; pp. 255–290. [Google Scholar]
- Powell, A.; Powell, G. Population dynamics of male euglossine bees in Amazonian forest fragments. Biotropica 1987, 19, 176–179. [Google Scholar] [CrossRef]
- Kruess, A.; Tscharntke, T. Species richness and parasitism in a fragmented landscape: Experiments and field studies with insects on Vicia sepium. Oecologia 2000, 122, 129–137. [Google Scholar] [CrossRef]
- Urbas, P.; Araújo, M.V., Jr.; Leal, I.R.; Wirth, R. Cutting more from cut forests: Edge effects on foraging and herbivory of leaf-cutting ants in Brazil. Biotropica 2007, 39, 489–495. [Google Scholar] [CrossRef]
- Brown, K.S. Diversity, disturbance, and sustainable use of Neotropical forests: Insects as indicators for conservation monitoring. J. Insect Conserv. 1997, 1, 25–42. [Google Scholar] [CrossRef]
- Wittmann, F.; Junk, W.J.; Piedade, M.T.F. The várzea forests in Amazonia: flooding and the highly dynamic geomorphology interact with natural forest succession. For. Ecol. Manag. 2004, 196, 199–212. [Google Scholar] [CrossRef]
- Wittmann, F.; Schöngart, J.; Montero, J.C.; Motzer, T.; Junk, W.J.; Piedade, M.T.F.; Queiroz, H.L.; Worbes, M. Tree species composition and diversity gradients in white-water forests across the Amazon Basin. J. Biogeogr. 2006, 33, 1334–1347. [Google Scholar] [CrossRef]
- Bispo, P.D.C.; Valeriano, M.D.M.; Kuplich, T.M. Variáveis geomorfométricas locais e sua relação com a vegetação da região do interflúvio Madeira-Purus (AM-RO). Acta Amazon. 2009, 39, 81–90. [Google Scholar] [CrossRef]
- Definiens. Definiens Professional 5: Reference Book; Definiens, Ed.; The Imaging Intelligence Company: Munich, Germany, 2006. [Google Scholar]
- Desclée, B.; Bogaert, P.; Defourny, P. Forest change detection by statistical object-based method. Remote Sens. Environ. 2006, 102, 1–11. [Google Scholar] [CrossRef]
- Baatz, M.; Schäpe, A. Multiresolution Segmentation—An optimization approach for high quality multi-scale image segmentation. In Proceedings of the XII Angewandte Geographische Informationsverarbeitung, Salzburg, Austria, 5–7 July 2000; pp. 12–23.
- Definiens. Definiens Developer 7: User Guide; Definiens, Ed.; The Imaging Intelligence Company: Munich, Germany, 2008. [Google Scholar]
- Hess, L.L.; Melack, J.M.; Novo, E.M.L.M.; Barbosa, C.C.F. Dual-season mapping of wetland inundation and vegetation. Remote Sens. Environ. 2003, 87, 404–428. [Google Scholar] [CrossRef]
- Melack, J.M.; Hess, L.L. Remote Sensing of the Distribution and Extent of Wetlands in the Amazon Basin. In Amazonian Floodplain Forests: Ecophysiology, Biodiversity and Sustainable Management; Junk, W.J., Piedade, M.T.F., Wittmann, F., Schöngart, J., Parolin, P., Eds.; Springer: Berlin/Heidelberg, Germany, 2010; Volume 210, pp. 43–59. [Google Scholar]
- Rennó, C.D.; Novo, E.M.L.M.; Banon, L.C. Correção geométrica da máscara de áreas alagáveis da bacia amazônica. In XVI Simpósio Brasileiro de Sensoriamento Remoto; Instituto Nacional de Pesquisas Espaciais (INPE): Foz do Iguaçu, Brasil, 2013; pp. 5507–5514. [Google Scholar]
- Ferreira, R.D.; Leão, J.A.D.; Silva, T.S.F.; Rennó, C.D.; Novo, E.M.L.M.; Barbosa, C.C.F. Atualização e correção do delineamento de áreas alagáveis para a bacia Amazônica. In XVI Simpósio Brasileiro de Sensoriamento Remoto; Instituto Nacional de Pesquisas Espaciais (INPE): Foz do Iguaçu, Brasil, 2013; pp. 5864–5871. [Google Scholar]
- Novo, E.M.L.M. Relatório Projeto Geoma: Efeito de Perturbações Antrópicas Sobre a Estrutura Florística e Funcionamento das Florestas de Várzea e seu Impacto Sobre os Ecossistemas Aquáticos da Calha Central do Solimões-Amazonas; Instituto Nacional de Pesquisas Espaciais (INPE): São José dos Campos, Brasil, 2013. [Google Scholar]
- ArcGIS Desktop, Environmental Systems Research Institute (ESRI): Redlands, CA, USA, 2012.
- McGarigal, K.; Marks, B. FRAGSTATS: Spatial Pattern Analysis Program for Quantifying Landscape Structure; FRAGSTATS: Corvallis, OR, USA, 1994. [Google Scholar]
- Junk, W.J. The Central Amazon Floodplain: Ecology of a Pulsing System; Springer: Berlin, Germany, 1997. [Google Scholar]
- Junk, W.J.; Piedade, M.T.F. The Amazon River basin. In The World’s Largest Wetlands; Fraser, H., Keddy, A., Eds.; Cambridge University Press: Cambridge, UK, 2005; pp. 63–117. [Google Scholar]
- Parolin, P.; de Simone, O.; Haase, K.; Waldhoff, D.; Rottenberger, S.; Kuhn, U.; Kesselmeier, J.; Kleiss, B.; Schmidt, W.; Piedade, M.T.F.; et al. Central Amazonian Floodplain Forests: Tree Adaptations in a Pulsing System. Bot. Rev. 2004, 70, 357–380. [Google Scholar] [CrossRef]
- Universidade Federal do Amazonas (UFAM). Comunidades Ribeirinhas Amazônicas: Modos de Vida e uso dos Recursos Naturais; de Fraxe, T.J.P., Pereira, H.S., Witkoski, A.C., Eds.; UFAM: Manaus, Brasil, 2007. [Google Scholar]
- Instituto de Pesquisa Ambiental da Amazônia (IPAM). Projeto Básico de Desenvolvimento Sustentável do Assentamento Agroextrativista : Urucurituba; IPAM: Santarém, Portugal, 2010. [Google Scholar]
- Ariti, A.T.; Vliet, J.V.; Verburg, P.H. Land-use and land-cover changes in the Central Rift Valley of Ethiopia: Assessment of perception and adaptation of stakeholders. Appl. Geogr. 2015, 65, 28–37. [Google Scholar] [CrossRef]
- Tasser, E.; Walde, J.; Tappeiner, U.; Teutsch, A.; Noggler, W. Land-use changes and natural reforestation in the Eastern Central Alps. Agric. Ecosyst. Environ. 2007, 118, 115–129. [Google Scholar] [CrossRef]
- Mottet, A.; Ladet, S.; Coqué, N.; Gibon, A. Agricultural land-use change and its drivers in mountain landscapes: A case study in the Pyrenees. Agric. Ecosyst. Environ. 2006, 114, 296–310. [Google Scholar] [CrossRef]
- Malek, Ž.; Scolobig, A.; Schröter, D. Understanding land cover changes in the Italian Alps and Romanian Carpathians combining remote sensing and stakeholder interviews. Land 2014, 3, 52–73. [Google Scholar] [CrossRef]
- Leitão, S.; da Falcão, J.T.R.; Maluf, M.R. Ethical Standards of Scientific Research Involving Human Subjects in Brazil: Perspectives Concerning Psychology. Psicol. Reflexão e Crítica 2015, 28, 40–48. [Google Scholar] [CrossRef]
- De Castro-Santos, L.A. A critique of Brazil’s current research ethics committees. História Ciências Saúde-Manguinhos 2014, 21, 364–366. [Google Scholar]
- Richards, P.W. The Tropical Rain Forest, 2nd ed.; Cambridge University Press: Cambridge, UK, 1996. [Google Scholar]
- Michel, N.L.; Sherry, T.W.; Carson, W.P. The omnivorous collared peccary negates an insectivore-generated trophic cascade in Costa Rican wet tropical forest understorey. J. Trop. Ecol. 2013, 30, 1–11. [Google Scholar] [CrossRef]
- Stratford, J.A.; Şekercioğlu, Ç.H. Birds in Forest Ecosystems. In Handbook of Forest Ecology; Corlett, R., Peh, K., Bergeron, Y., Eds.; Routeledge Press: London, UK, 2015; pp. 281–296. [Google Scholar]
- Jones, K.E.; Safi, K. Ecology and evolution of mammalian biodiversity. Philos. Trans. R. Soc. B 2011, 366, 2451–2461. [Google Scholar] [CrossRef] [PubMed]
- Henle, K.; Davies, K.F.; Kleyer, M.; Margules, C.; Settele, J. Predictors of species sensitivity to fragmentation. Biodivers. Conserv. 2004, 13, 207–251. [Google Scholar] [CrossRef]
- Wilcox, B.A.; Murphy, D.D. Conservation Strategy: The Effects of Fragmentation on Extinction. Am. Nat. 1985, 125, 879–887. [Google Scholar] [CrossRef]
- Seastedt, T.R.; Crossley, D.A. The Influence of Arthropods on Ecosystems. Bioscience 1984, 34, 157–161. [Google Scholar] [CrossRef]
- Kerr, W.E. A importância da meliponicultura para o país. Rev. Biotecnol. Ciência Desenvolv. 1997, 1, 42–44. [Google Scholar]
- Kerr, W.E.; Carvalho, G.A.; Silva, A.C.; Assis, M.G.P. Aspectos pouco mencionados da biodiversidade amazônica. Mensagem Doce 2001, 80, 45–60. [Google Scholar]
- Barreto, L.S.; Teixeira, A.F.R. Manejo Avançado e Conservação de Meliponíneos. In Congresso Brasileiro de Apicultura; Confederação Brasileira de Apicultura (CBA): Aracajú, Brasil, 2006. [Google Scholar]
- Silveira-Neto, S.; Monteiro, R.C.; Zucchi, R.A.; Moraes, R.C.B. Uso da análise faunística de insetos na avaliação do impacto ambiental. Sci. Agric. 1993, 52, 9–15. [Google Scholar] [CrossRef]
- Hammond, P.C.; Miller, J.C. Comparison of the Biodiversity of Lepidoptera within Three Forested Ecosystems. Ann. Entomol. Soc. Am. 1998, 91, 323–328. [Google Scholar] [CrossRef]
- Marengo, J.A.; Espinoza, J.C. Extreme seasonal droughts and floods in Amazonia: Causes, trends and impacts. Int. J. Climatol. 2016, 36, 1033–1050. [Google Scholar] [CrossRef]
- Forzieri, G.; Degetto, M.; Righetti, M.; Castelli, F.; Preti, F. Satellite multispectral data for improved floodplain roughness modelling. J. Hydrol. 2011, 407, 41–57. [Google Scholar] [CrossRef]
- Peres, C.A. Synergistic Effects on Amazonian Forest Vertebrates Fragmentation. Conserv. Biol. 2001, 15, 1490–1505. [Google Scholar] [CrossRef]
- Tabarelli, M.; Cardoso da Silva, J.M.; Gascon, C. Forest fragmentation, synergisms and the impoverishment of netropical forests. Biodivers. Conserv. 2004, 13, 1419–1425. [Google Scholar] [CrossRef]
- McGrath, D.G.; Cardoso, A.; Almeida, O.T.; Pezzuti, J. Constructing a policy and institutional framework for an ecosystem-based approach to managing the Lower Amazon floodplain. Environ. Dev. Sustain. 2008, 10, 677–695. [Google Scholar] [CrossRef]
- Lobón-Cerviá, J.; Hess, L.L.; Melack, J.M.; Araujo-Lima, C.A. The importance of forest cover for fish richness and abundance on the Amazon floodplain. Hydrobiologia 2015, 750, 245–255. [Google Scholar] [CrossRef]
- Maeda, E.E.; de Almeida, C.M.; de Carvalho Ximenes, A.; Formaggio, A.R.; Shimabukuro, Y.E.; Pellikka, P. Dynamic modeling of forest conversion: Simulation of past and future scenarios of rural activities expansion in the fringes of the Xingu National Park, Brazilian Amazon. Int. J. Appl. Earth Observ. Geoinform. 2011, 13, 435–446. [Google Scholar] [CrossRef]
- Malek, Z.; Boerboom, L. Participatory Scenario Development to Address Potential Impacts of Land Use Change: An Example from the Italian Alps. Mt. Res. Dev. 2015, 35, 126–138. [Google Scholar] [CrossRef]
- Van Berkel, D.B.; Verburg, P.H. Combining exploratory scenarios and participatory backcasting: Using an agent-based model in participatory policy design for a multi-functional landscape. Landsc. Ecol. 2012, 27, 641–658. [Google Scholar] [CrossRef] [PubMed]


| Biodiversity | Landscape Parameters (Metrics and Thresholds) | Data Sources | ||||
|---|---|---|---|---|---|---|
| Habitat % | Patch Size | Edge Width | Isolation Length | Isolation Time | ||
| Trees | - | 1–2–100 ha | 60–100–300 m | * | 14–20 years | [39,40,41,42,43,44,45] |
| Birds | - | 1–10–100 ha | 50 m | 0–75–100–300–425 m | - | [42,46,47,48,49,50,51,52] |
| Mammals | - | 100 ha | 50–100–180 m | 300 m | - | [48,53,54,55,56,57] |
| Insects | 20%–70% | 0.3–1–10 ha | 50–100–200–300 m | 50–100–200–500–800 m–1 km | - | [28,31,42,48,58,59,60,61,62,63,64,65,66,67,68,69,70] |
| Mortality, Damage, Turnover | Canopy Gaps | Functional Diversity | Species Diversity | Species Richness | Pioneers Abundance | |
|---|---|---|---|---|---|---|
| Patch size | ||||||
| 2 ha | 300% ↑ [41,42] | - | 36% ↓ [39] | 44% ↓ [39] | 45% ↓ [43] | 400% ↑ [44] |
| 100 ha | 50% ↑ [41,42] | - | 20% ↓ [39] | 20% ↓ [39] | - | * ↑ [39] |
| Edge width | ||||||
| 0–60 m | 189% ↑ [41,42] | 500% ↑ [40,42] | - | - | - | - |
| 10–100 m | - | - | - | - | - | 75% ↑ [39] |
| 60–100 m | 64% ↑ [41,42] | - | - | - | - | - |
| 100–300 m | 18% ↑ [41,42] | - | - | - | - | - |
| Isolation length | ||||||
| >0 m (*) | - | - | - | * ↓ [66] | * ↓ a [43] | - |
| Isolation time | ||||||
| 1–20 years | - | - | - | - | - | * ↑ [44] |
| 14 years | Phylogenetic dispersion = 50% ↓ [45]/Genus richness = 2.3% ↓ [45] | |||||
| Gap-Crossing Movements | Species Richness | Species Abundance | |
|---|---|---|---|
| Patch size | |||
| 1 ha | - | 86% ↓ [46] | 94% ↓ [49,50,51,52] |
| 10 ha | - | - | 71% ↓ [49,50,51,52] |
| 100 ha | - | - | 28% ↓ [49,50,51,52] |
| Edge width | |||
| 0–50 m | - | * ↓ [42,48] | - |
| Isolation length | |||
| >0 m | 37% ↓ [47] | - | - |
| >75 m | 66% ↓ [47] | - | 100% ↓ (1 ha); 30% ↓ (10 ha) [51] |
| >100 m | - | - | 100% ↓ (1 ha); 30% ↓ (10 ha) [51] |
| >300 m | - | 30% ↓ [47] | - |
| >425 m | 100 % ↓ [47] | - | - |
| Species Richness | Species Abundance | |
|---|---|---|
| Patch size | ** 90% [55] | |
| 100 ha | 83% ↓; 100% ↓ a [55] | - |
| Edge width | ** 74% [56] | ** 83% [55] |
| 0–50 m | * ↓ [55] | - |
| 0–100 m | - | * ↓ [55] |
| 0–180 m | 78% ↓ [57] | 94% ↓ [57] |
| Isolation length | ||
| >300 m | 50% ↓ [53] | - |
| Herbivores | Parasitoids | Pollinators | ||||||
|---|---|---|---|---|---|---|---|---|
| Richness | Abundance | Herbivory (h) Invasion (i) | Richness | Parasitism | Host Mortality | Diversity (d) Richness (r) | Visitation | |
| Patch size | ||||||||
| 0.3 ha | 25% ↓ [68] | - | - | - | 52% ↓ [28] | * ↓ [28] | - | - |
| 1 ha | - | - | - | 80% ↓ [68] | - | - | - | |
| 10 ha | - | - | - | - | 50%–100% ↓ f [68] | - | - | |
| Edge width | ||||||||
| ≤50 m | - | 1625% ↑ a [63,69] | - | - | - | - | - | - |
| 100 m | 65% ↑ [64] | 14% ↑ [64] | h 85% ↑ [63,69] | - | * ↓ [63,64,69] | - | - | - |
| 200 m | - | - | i * ↑ b [42,62] | - | - | - | - | - |
| 300 m | - | - | i * ↑ c [42,48] | - | - | - | d * ↓ [42,48] | - |
| Isolation length | ||||||||
| >50 m | - | - | - | - | - | - | - | 9% ↓ [66] |
| >100 m | 25% ↓ [68] | - | - | - | 50% ↓ [68] | - | - | 56% ↓ d [67] |
| >200 m | 50% ↓ [68] | - | - | 100% ↓ [68] | 100% ↓ [68] | - | - | - |
| >500 m | 25% ↓ [28] | - | - | 23% ↓ [68] | 25%–70% ↓ f [28] | 80% ↓ [28] | - | 50% ↓ [31] |
| >800 m | - | - | - | - | - | - | r 50% ↓ [60] | 54% ↓ [66] |
| >1 km | - | - | - | - | - | - | r 50% ↓ [31,66] | * ↓ e [66] |
| Metrics | Description | Unit | Threshold |
|---|---|---|---|
| Total forest area | Area and percent of the landscape comprised by forest | ha/% | Edge width (m): 0 m |
| Mean patch size/number of patches | Mean size and total number of forest patches | ha/- | Edge width (m): 0 m |
| Largest patch | Area and percent of the forest cover comprised by the largest patch | ha/% | Edge width (m): 0 m |
| Patch size distribution | Number of fragments, area and percentage of forest cover for different size classes | ha/% | Size classes (ha): <1 ha, 1–10 ha, 10–100, 100–500, 500–1000, >1000 Edge width (m): 0 m |
| Edge area | Area and percentage of forest submitted to edge effects for different edge widths | ha/% | Edge width (m): 50, 100, 200, 300 |
| Connectivity (CONNECT) | Proportion of functional joins between all forest patches considering different distance | % | Distance (m): 75, 100, 300, 500, 800, 1000 |
| Mean proximity (PROX_MN) | Mean Euclidean distance among patches that are within a specific search radius | - | Search radius (m): 75, 100, 300, 500, 800, 1000 |
| Environmental Perception | Visited Communities |
|---|---|
| Flora | |
| Reports of alterations | 96% |
| Types of alteration: | |
| Forest cover loss | 88% |
| ↓ abundance/variety | 22% |
| Reasons for alterations: | |
| Deforestation (plantations) | 40% |
| Deforestation (pasture) | 30% |
| Selective logging | 15% |
| Extreme floods | 15% |
| Most reported period: | |
| ~1984 | 56% |
| Fauna | |
| Reports of alterations | 100% |
| Types of alteration: | |
| ↓ abundance/variety (fish) | 100% |
| ↓ abundance/variety (game animals) | 62% |
| Reasons for alterations: | |
| Overexploitation | 92% |
| Deforestation (plantation/pasture) | 12% |
| Most reported period: | |
| ~1984 | 73% |
| Agriculture | |
| Reports of alterations | 50% |
| Types of alteration: | |
| Pest incidence | 19% |
| Decrease in productivity | 46% |
© 2016 by the authors; licensee MDPI, Basel, Switzerland. This article is an open access article distributed under the terms and conditions of the Creative Commons Attribution (CC-BY) license (http://creativecommons.org/licenses/by/4.0/).
Share and Cite
Renó, V.; Novo, E.; Escada, M. Forest Fragmentation in the Lower Amazon Floodplain: Implications for Biodiversity and Ecosystem Service Provision to Riverine Populations. Remote Sens. 2016, 8, 886. https://0-doi-org.brum.beds.ac.uk/10.3390/rs8110886
Renó V, Novo E, Escada M. Forest Fragmentation in the Lower Amazon Floodplain: Implications for Biodiversity and Ecosystem Service Provision to Riverine Populations. Remote Sensing. 2016; 8(11):886. https://0-doi-org.brum.beds.ac.uk/10.3390/rs8110886
Chicago/Turabian StyleRenó, Vivian, Evlyn Novo, and Maria Escada. 2016. "Forest Fragmentation in the Lower Amazon Floodplain: Implications for Biodiversity and Ecosystem Service Provision to Riverine Populations" Remote Sensing 8, no. 11: 886. https://0-doi-org.brum.beds.ac.uk/10.3390/rs8110886