Article

Investigation on Mining Subsidence Based on Multi-Temporal InSAR and Time-Series Analysis of the Small Baseline Subset—Case Study of Working Faces 22201-1/2 in Bu’ertai Mine, Shendong Coalfield, China

1
Department of Remote Sensing Science and Technology, Henan Polytechnic University, Jiaozuo 454000, China
2
Key Laboratory of Mine Spatial Information Technologies of SBSM, Henan Polytechnic University, Jiaozuo 454000, China
3
School of Public Administration, Hohai University, Nanjing 210098, China
*
Author to whom correspondence should be addressed.
Submission received: 9 June 2016 / Revised: 6 November 2016 / Accepted: 8 November 2016 / Published: 16 November 2016
(This article belongs to the Special Issue Earth Observations for Geohazards)

Abstract

:
High-intensity coal mining (large mining height, shallow mining depth, and rapid advancing) frequently causes large-scale ground damage within a short period of time. Understanding mining subsidence under high-intensity mining can provide a basis for mining-induced damage assessment, land remediation in a subsidence area, and ecological reconstruction in vulnerable ecological regions in Western China. In this study, the mining subsidence status of Shendong Coalfield was investigated and analyzed using two-pass differential interferometric synthetic aperture radar (DInSAR) technology based on high-resolution synthetic aperture radar data (RADARSAT-2 precise orbit, multilook fine, 5 m) collected from 20 January 2012 to June 2013. Surface damages in Shendong Coalfield over a period of 504 days under open-pit mining and underground mining were observed. Ground deformation of the high-intensity mining working faces 22201-1/2 in Bu’ertai Mine, Shendong Coalfield was monitored using small baseline subset (SBAS) InSAR technology. (1) DInSAR detected and located 85 ground deformation areas (including ground deformations associated with past-mining activity). The extent of subsidence in Shendong Coalfield presented a progressive increase at an average monthly rate of 13.09 km2 from the initial 54.98 km2 to 225.20 km2, approximately, which accounted for 7% of the total area of Shendong Coalfield; (2) SBAS-InSAR reported that the maximum cumulative subsidence area reached 5.58 km2 above the working faces 22201-1/2. The advance speed of ground destruction (7.9 m/day) was nearly equal to that of underground mining (8.1 m/day).

Graphical Abstract

1. Introduction

Shendong Coalfield is one of the largest coal production bases in the world. The high-density fields and high-intensity mining in Shendong Coalfield will profoundly influence the ecological environment of northwestern China. Therefore, assessing mining-induced damage and understanding mining subsidence in the high-intensity mining environment of Shendong Coalfield are important for the land remediation and ecological reconstruction of mining subsidence areas. Traditional mining subsidence monitoring approaches mainly include geodesy, global navigation satellite system measurements, and electronic distance measurements. These approaches exhibit the following shortcomings. (1) They are labor-intensive, time-consuming, costly, and difficult to keep the monitoring flags in good condition for a long time; (2) The survey crew has to enter the region being monitored, which increases the difficulty and risks of the task; (3) These approaches are inapplicable to fast and accurate large-scale real-time monitoring of mines and cannot monitor subsidence in unknown regions because of the limited spatial extent of monitoring, the low spatial resolution, and the long work cycle; (4) Theoretical analysis is restricted within-data observation of discrete points; hence, identifying the ground deformation characteristics while satisfying the actual requirements of mining subsidence prediction and disaster prevention is difficult [1,2].
Interferometric synthetic aperture radar (InSAR) offers a novel Earth observation approach and can provide all-weather, all-day, and cloud influence free monitoring. Differential InSAR (DInSAR), as an extension of InSAR in terms of monitoring ground deformation, is mainly used to capture centimeter-level or smaller ground deformations along the line of sight (LOS) of a radar satellite. Considerable developments related to DInSAR monitoring of earthquake deformation [3,4], volcanic activities [5,6], glacial shift [7,8], urban water-loss settlement [9,10], mining subsidence [11,12], and landslides [13,14] have been achieved. However, DInSAR technology can easily cause interference decorrelation for mining subsidence with immense deformation and short deformation period. Moreover, for the conventional DInSAR, it is a challenging task to distinguish, and thus, effectively eliminate orbit residue error, residual terrain, atmospheric delay, and other phase errors. Nevertheless, several successful applications of the conventional DInSAR have been reported. In the past 10 years, many scholars have monitored mining subsidence in selected mines using DInSAR and have conducted corresponding experimental research. Perski et al. successfully measured ground settlement caused by underground mining using DInSAR [15,16,17,18,19,20]. Other scholars have successfully applied DInSAR to mining subsidence monitoring experiments, thereby confirming the feasibility of using DInSAR in large-scale mining subsidence monitoring and geological disaster assessment [21,22,23,24,25,26,27,28]. Therefore, the conventional DInSAR coupled with an appropriate interferometric strategy can recognize ground deformation associated with past-mining activities and atmospheric effects (e.g., water vapor in the troposphere and fluctuations in the ionosphere). It can also reduce data costs and increase observation efficiency [29].
To overcome the shortcomings of DInSAR and to acquire accurate subsidence data, the deformation velocity of highly coherent target points was computed via least squares (LS) estimation [30]. In 2002, Berardino et al. proposed the small baseline subset (SBAS) algorithm based on the LS model [31,32,33]. SBAS was developed from the traditional DInSAR. It combined multiple small baseline subsets via the singular value decomposition (SVD) method based on InSAR data pairs with small spatial and temporal baselines. Therefore, SBAS does not only inherit the advantages of the traditional DInSAR, but can also effectively solve the time discontinuous problem caused by extremely long spatial baselines among SAR data sets, thereby obtaining subsidence values with high coherence targets during different periods. SBAS becomes increasingly optimized and its monitoring accuracy increases accordingly with the development of three-dimensional (3D) phase unwrapping algorithms, extraction algorithms of coherent target points, and error elimination algorithms, as well as the improvement of the time-series deformation model [34,35,36,37,38,39,40]. Nevertheless, it still has low computational efficiency. Moreover, precise observation is limited within a small scale, and thus, a substantial part of mining subsidence (i.e., maximum subsidence) cannot be covered.
Therefore, given the limited data set, macroscopic and microscopic studies on global and local ground displacement features caused by mining subsidence were performed by combining conventional and advanced interferometric techniques (DInSAR and SBAS-InSAR). On the one hand, the large-scale dynamic characteristics of mining subsidence were identified through a comparative analysis of multi-temporal data by combining two DInSAR interferences. On the other hand, a time-series analysis of a typical working face was conducted based on SBAS-InSAR and several ground displacement parameters were determined. These processes not only provide complete control of the maturity and stability of DInSAR to perform a fast assessment of mining-induced damage in the entire coalfield, but also fully utilize the technical advantages of SBAS-InSAR in increasing the time sampling rate as well as in inhibiting terrain and atmospheric delay influences on the algorithm. Consequently, an accurate analysis of the subsidence feature of a typical working face is realized.

2. Site Selection and Methods
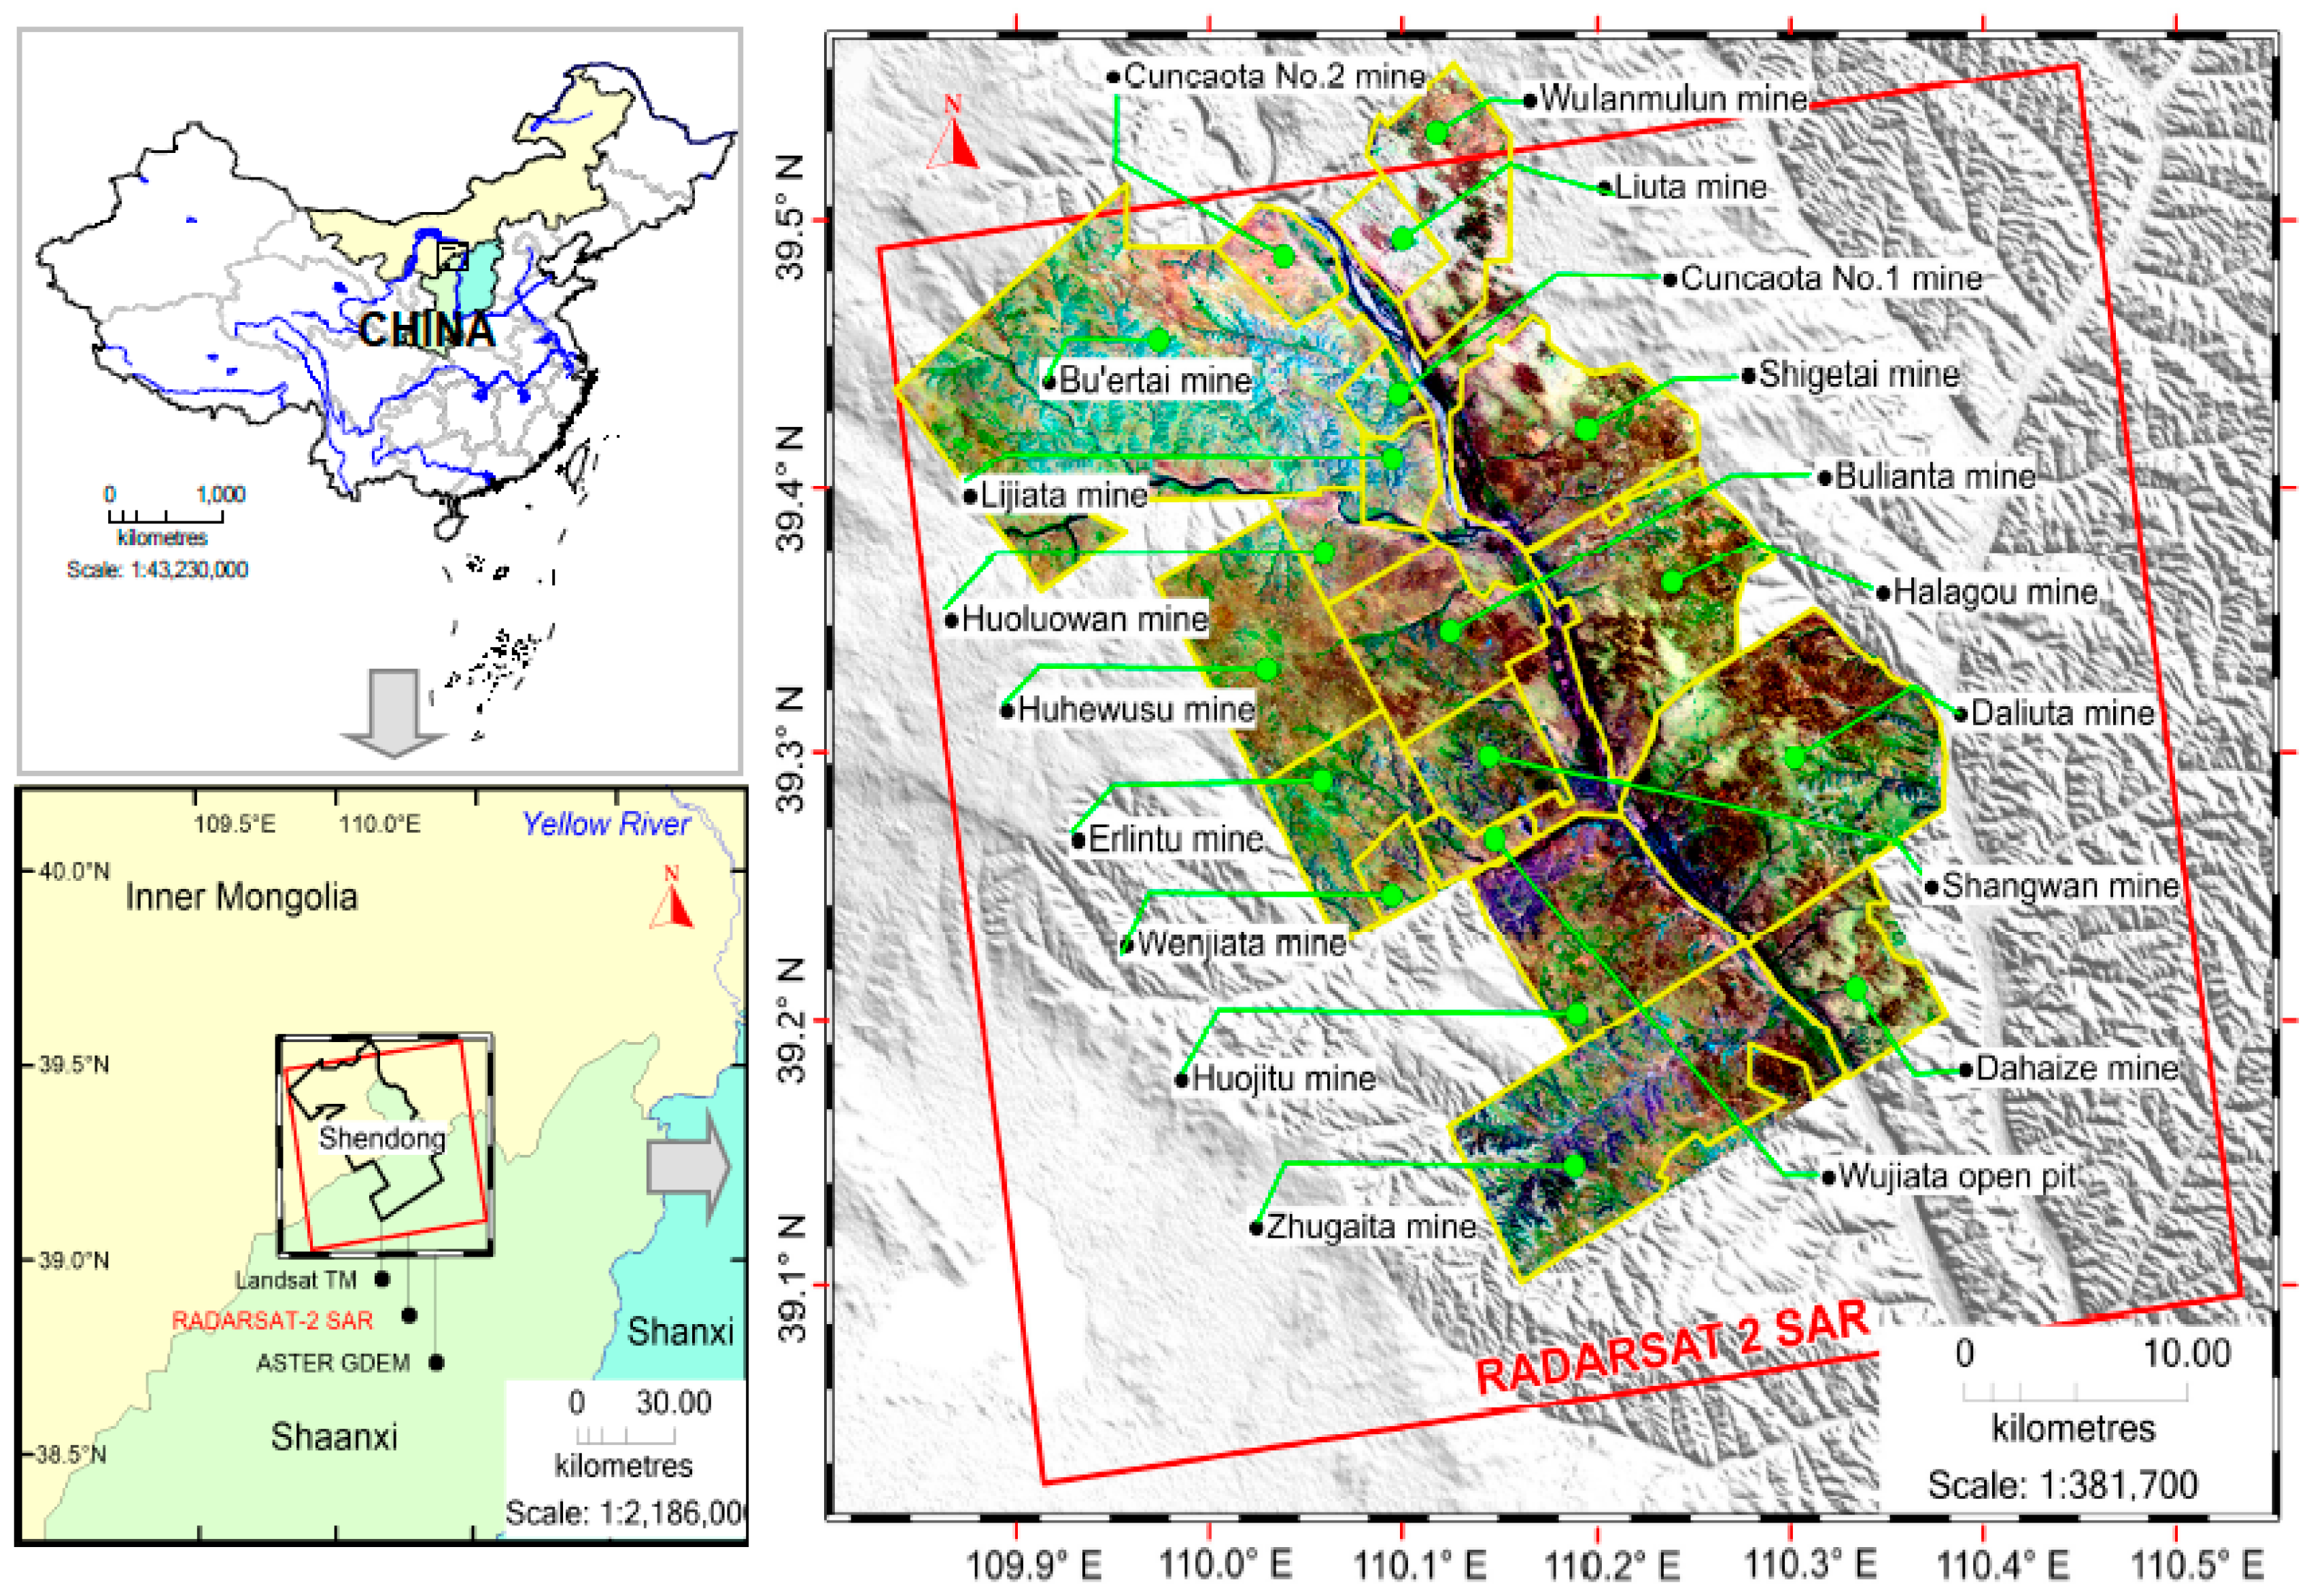
2.1. Site Selection

2.1.1. Study Area 1: Shendong Coalfield

Shendong Coalfield, an immense coal production base in China, is located in the northern region of Shenmu County, the western region of Fugu County (Yunlin City, Shaanxi Province) and Ejin Horo County, and the southern region of Dongsheng District and Junggar County (Ordos City, Inner Mongolia). Its geographical coordinates are 38°52′–39°41′N and 109°51′–110°46′E. Its north–south length is approximately 38–90 km and its east–west width is approximately 35–55 km, thereby covering an area of approximately 3481 km2. The proven reserves are 727 Gt. Shendong Coalfield covers a cluster of the mines of 10-million-tons annual production that comprise 14 underground coal mines, including Bu’ertai (20.0 Mt/year), Daliuta (25.0 Mt/year), Bulianta (21.0 Mt/year), Halagou (12.0 Mt/year), Shangwan (10.0 Mt/year), and Shigetai (10.0 Mt/year) mine, as well as 5 open-pit mines, including Ha'erwusu (30.0 Mt/year) and Heidaigou (31.0 Mt/year) mine. Shendong Coalfield is one of the largest combined open-pit–underground mining enterprises with the highest degree of modernization in the world (Figure 1). Shendong coalfield is suffering from a large-scale, centralized distribution of mining subsidence and ground damage because it is being large-scale exploitation, the main mineable coal beds is particularly thick, and the ratio of mining depth/mining thickness is smaller. (Figure 2).

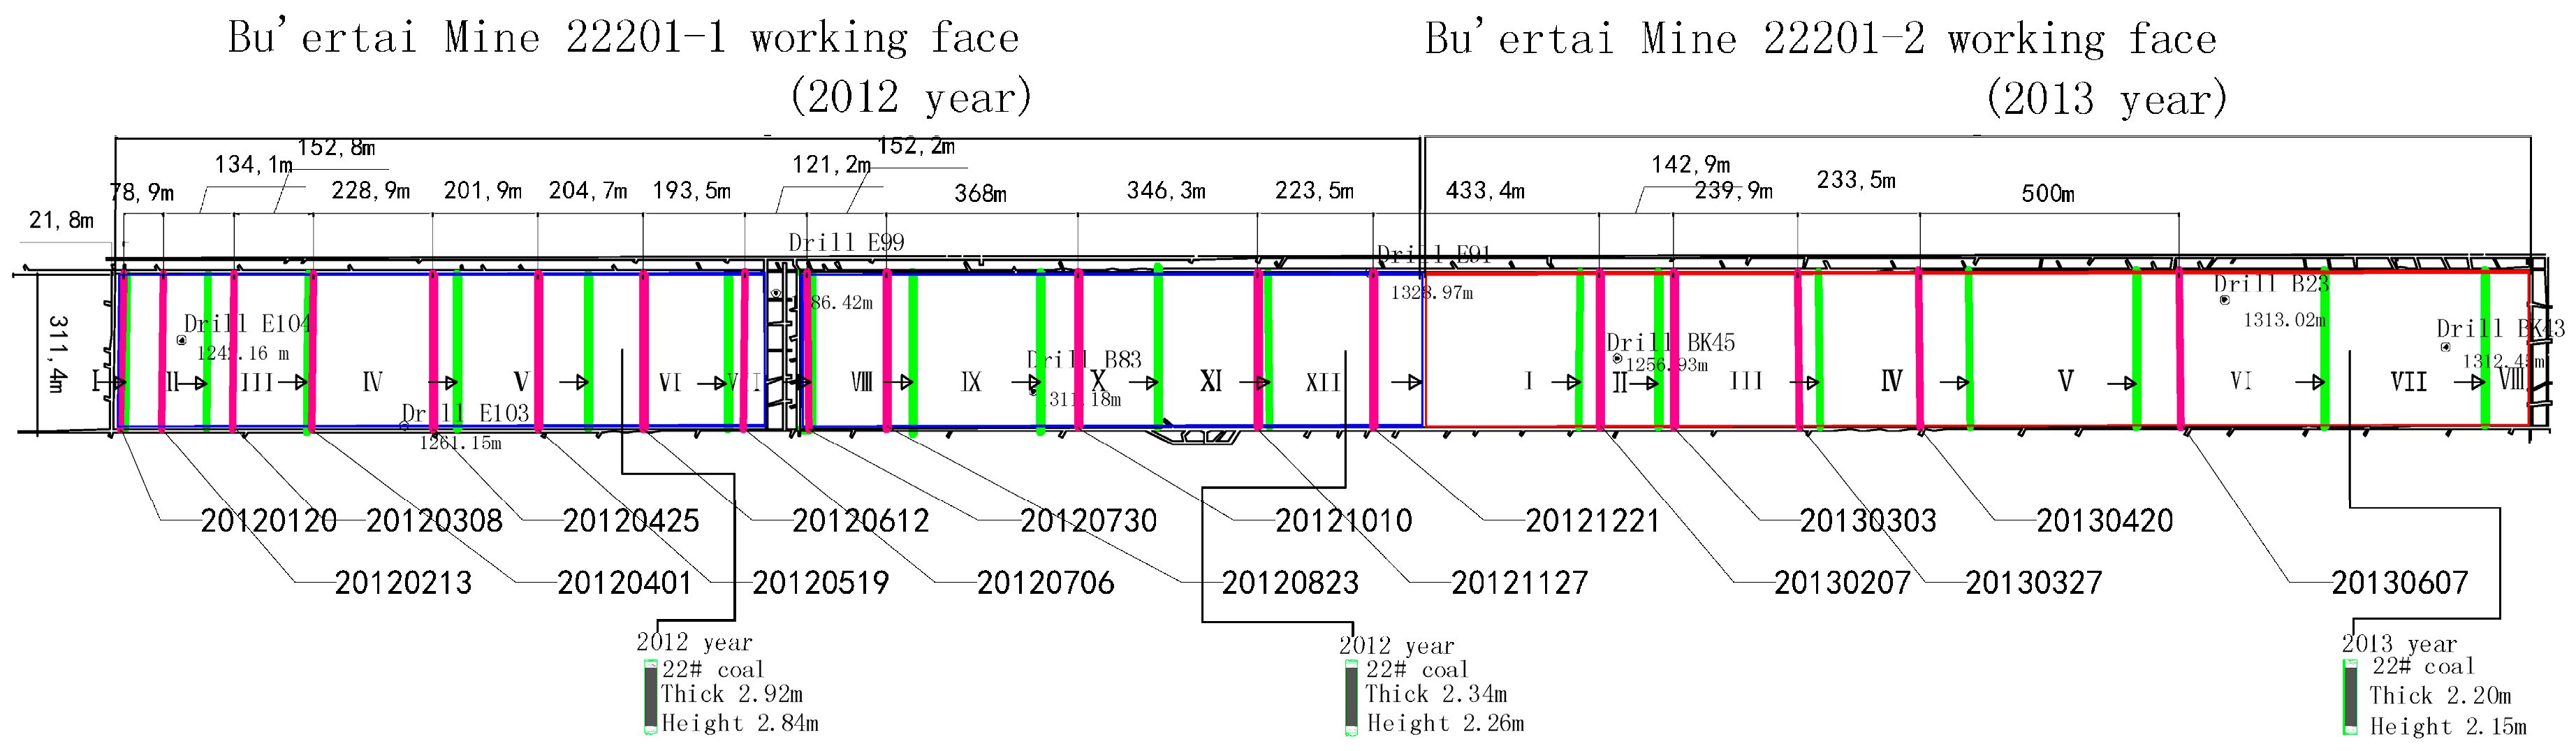
2.1.2. Study Area 2: 22201-1/2 Working Face

The 22201-1/2 long wall belongs to Bu’ertai Mine and is composed of two columns of working faces. 22201-1 was exploited in 2012, whereas 22201-2 was exploited in 2013 (Figure 3). The mining width of the working face that corresponded to the subsidence area was about 300 m. The mining length from 20 January 2012 to June 2013 was about 3950 m. The 22# coal bed was exploited. The mining seam thickness was 2.2–2.9 m (2.5 m on average), and the average mining depth was about 260 m [41].
In Figure 2, the mining boundaries (the purple vertical line) of the working face, while the RADARSAT-2 were imaging, were calculated according to the monthly stopping lines (the green vertical line marked by the arrow symbol) of the coal excavation plans.

2.1.3. Data used

RADARSAT-2 data from 20 January 2012 to June 2013 were used, and the data revisit period was set to 24 day. The spatial resolution was 5 m. Moreover, this study adopted the C wave band as the working wave band, HH polarization mode, multilook fine beam, and 50 × 50 km2 coverage area. The digital elevation model (DEM) data required for processing were 90 m elevation data of the Shuttle Radar Topography Mission (SRTM DEM). Images that covered the entire Bu’ertai Mine (within 39°24′–39°26′N and 109°58′–110°1′E) were collected by subset 18 SAR scenes via region of interests (ROIs) Data from September 2012, 20 January13, and May 2013 were missing, but the remaining revisit period data were all collected (Table 1).

2.2. Methods

In view of the lack of field data, we will adopt a joint calculation and mutual authentication method, such as consecutive DInSAR, cumulative DInSAR and SBAS-InSAR, in order to achieve a high reliability by the way.

2.2.1. Multi-Temporal InSAR Technology

The interferometric principle of mining subsidence based on DInSAR has been discussed in many studies [11,12,15,16,17,18,19,20,21,22,23,24,25,26,27,28,29], and will not be duplicated in this work. Instead, multi-temporal InSAR technology was applied and two interferometric processing techniques were used for the entire coalfield: the consecutive (i.e., adjacent acquisitions) DInSAR interferometry and the cumulative DInSAR interferometry. These techniques require various physical values and mathematical methods. They use different temporal and spatial baseline combinations, and thus, the corresponding results provide varying geological significance. The consecutive DInSAR interferometry, which is defined that the two adjacent scenes of time series of SAR data (their temporal baseline is the shortest) carry out an interferometry one another and eventually achieve a complete time series interferemetric results (e.g., φ1,2, φ2,3, …, φn−1,n), is convenient for the quantitative analysis of interferometric phase changes and can obtain a subsidence extent within a single period. The cumulative DInSAR interferometry, which is defined that the master image is fixed the first scene of time series of SAR data, meanwhile the next scene is selected (their temporal baseline is gradually lengthened) to implement interferometry with it and eventually achieve a complete time series interferograms(e.g., φ1,2, φ1,3, …, φ1,n = φ1,2 + φ2,3 + … + φn−1,n), is convenient for identifying the phase change features in a mining area and can obtain the maximum subsidence magnitude. This technique is conducive to evaluating the variation characteristics for mining subsidence on a deformation field from different spatio-temporal perspectives.

2.2.2. Brief Description of SBAS-InSAR

To improve the monitoring accuracy of the InSAR technique, one of the advanced InSAR techniques termed short baseline subsets (SBAS) InSAR was developed and has been frequently applied since 2002 [31,32,33,42,43].
This algorithm uses interferograms with small baselines that overlap in time in order to reduce spatial decorrelation, and to mitigate atmospheric artifacts and topographic errors in time-sequential interferometric pairs. The differential phase for a generic coherent pixel of the range and azimuth coordinates (x, r) in interferogram j that is generated by combining SAR acquisitions at times tB and tA is
δ φ j ( x , r ) = φ ( t B , x , r ) φ ( t A , x , r ) 4 π λ [ d ( t B , x , r ) d ( t A , x , r ) ] + 4 π λ B j Δ z R sin θ + [ φ a t m ( t B , x , r ) φ a t m ( t A , x , r ) ] + Δ n j , j = 1 , , M
where λ is the transmitted radar wavelength; ϕ(tB,x,r) and ϕ(tA,x,r) are the phases that correspond to times tB and tA; and d(tB,x,r) and d(tA,x,r) are the radar LOS projection of the cumulative deformation referenced to the first scene, which implies ϕ(t0,x,r) = 0. We also include a phase term related to possible errors Δz in the applied DEM used to generate differential interferograms. This phase component is proportional to the perpendicular baseline for each interferogram Bj, range distance R, and beam incident angle θ. A possible atmospheric signal is included in the terms ϕatm (tB,x,r) and ϕatm (tA,x,r). Decorrelation effects and other noise sources are included in the last term Δnj.
Therefore, Equation (1) can be expressed as follows:
δ φ j ( x , r ) = δ φ d i s p j ( x , r ) + δ φ t o p o j ( x , r ) + δ φ a t m j ( x , r ) + δ φ n o i s e j ( x , r ) , j = 1 , , M
where δ φ d i s p is the slant deformation phase between tB and tA; δ φ t o p o represents the topographic phase error of the external DEM used for differential interferogram generation; δ φ a t m accounts for temporal atmospheric variation at different SAR acquisition tB and tA; and δ φ n o i s e denotes temporal decorrelation, orbital errors, thermal noise effects, etc.
The cumulative deformation between tB and tA can also be expressed as follows:
δ φ d i s p j ( x , r ) = 4 π λ k = A B 1 v t k , t k + 1 ( t k + 1 t k )
where k indicates the sequence index of SAR acquisition time between tB and tA, and v represents the mean phase velocity in the period from k to k+1.
Given M unwrapped interferograms, the cumulative deformation at different SAR acquisition times can be achieved using the LS or SVD methods.

3. Results

3.1. DInSAR Data Processing

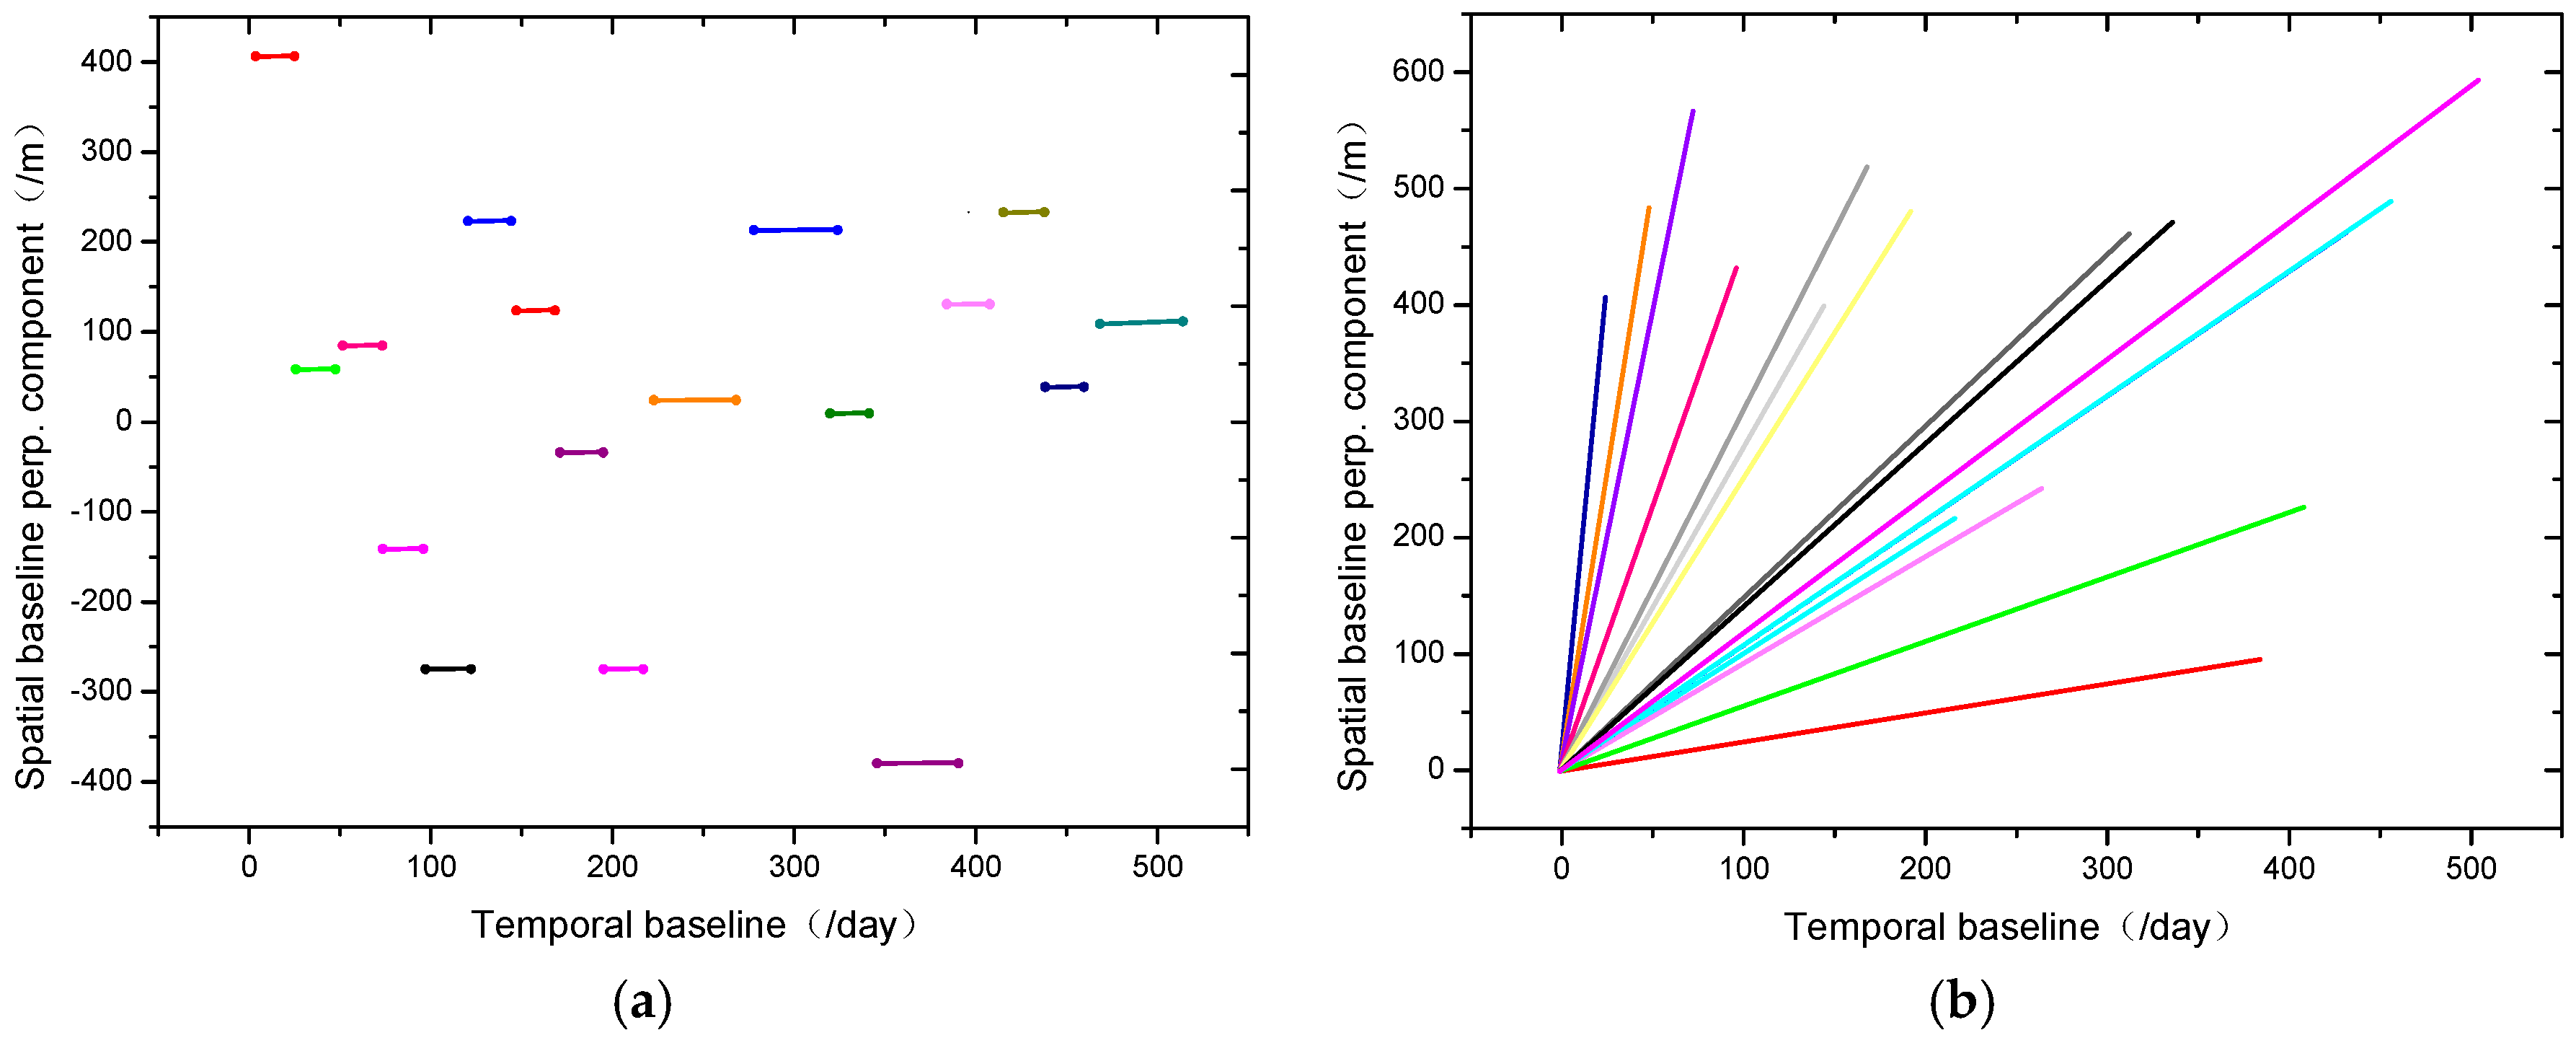
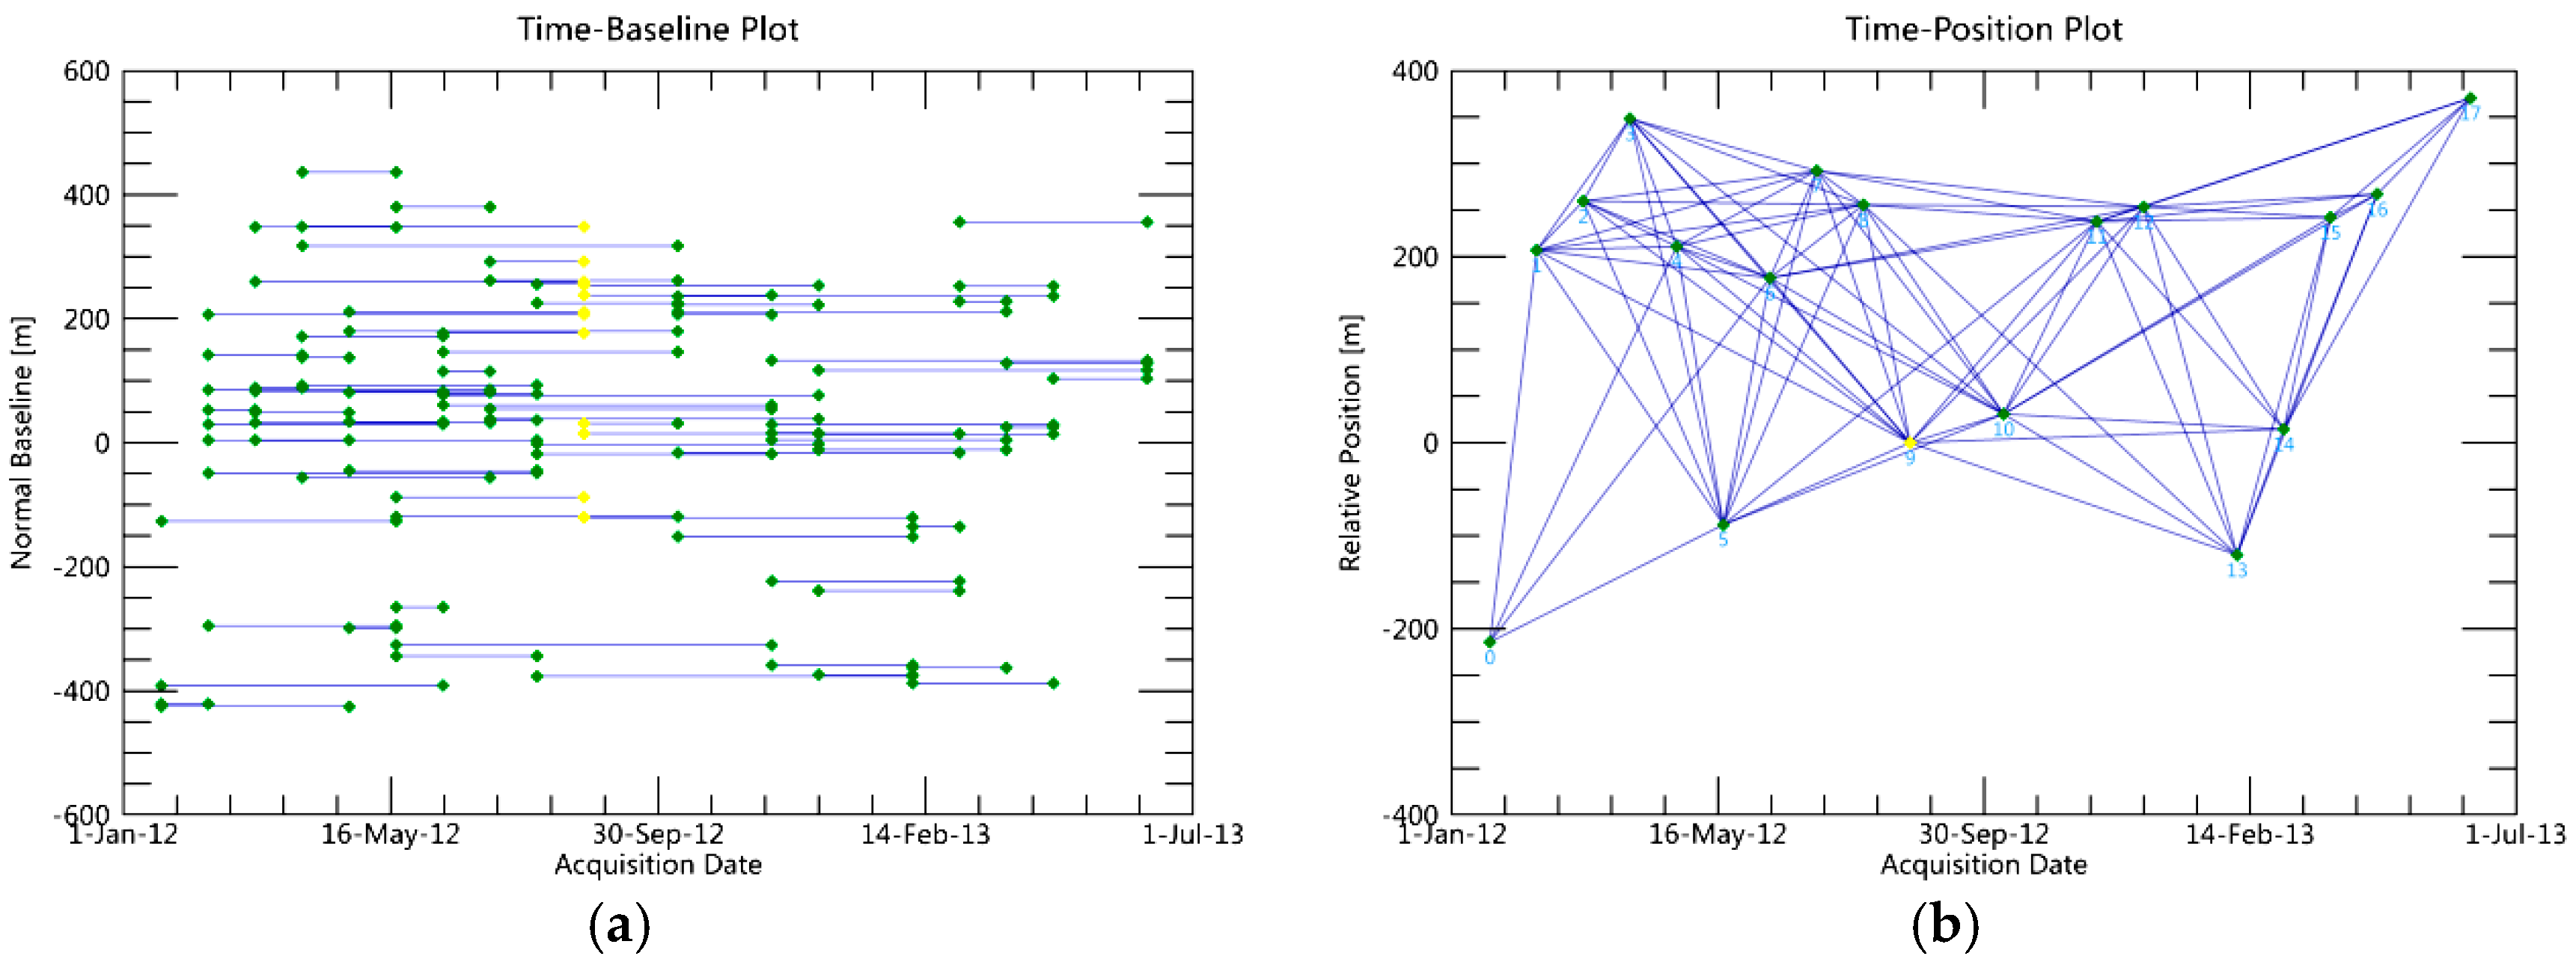
3.1.1. Spatio-Temporal Baselines of Two Interferometric Strategies

The temporal baseline of the consecutive DInSAR interferometry can be controlled efficiently within 24–48 days (Figure 4a), which will produce an ideal interferometric effect. However, the temporal baseline of the cumulative DInSAR interferometry increased continuously from the initial 24 days to the final 504 days (Figure 4b), which indicated that the influence of temporal decorrelation increasingly intensified.

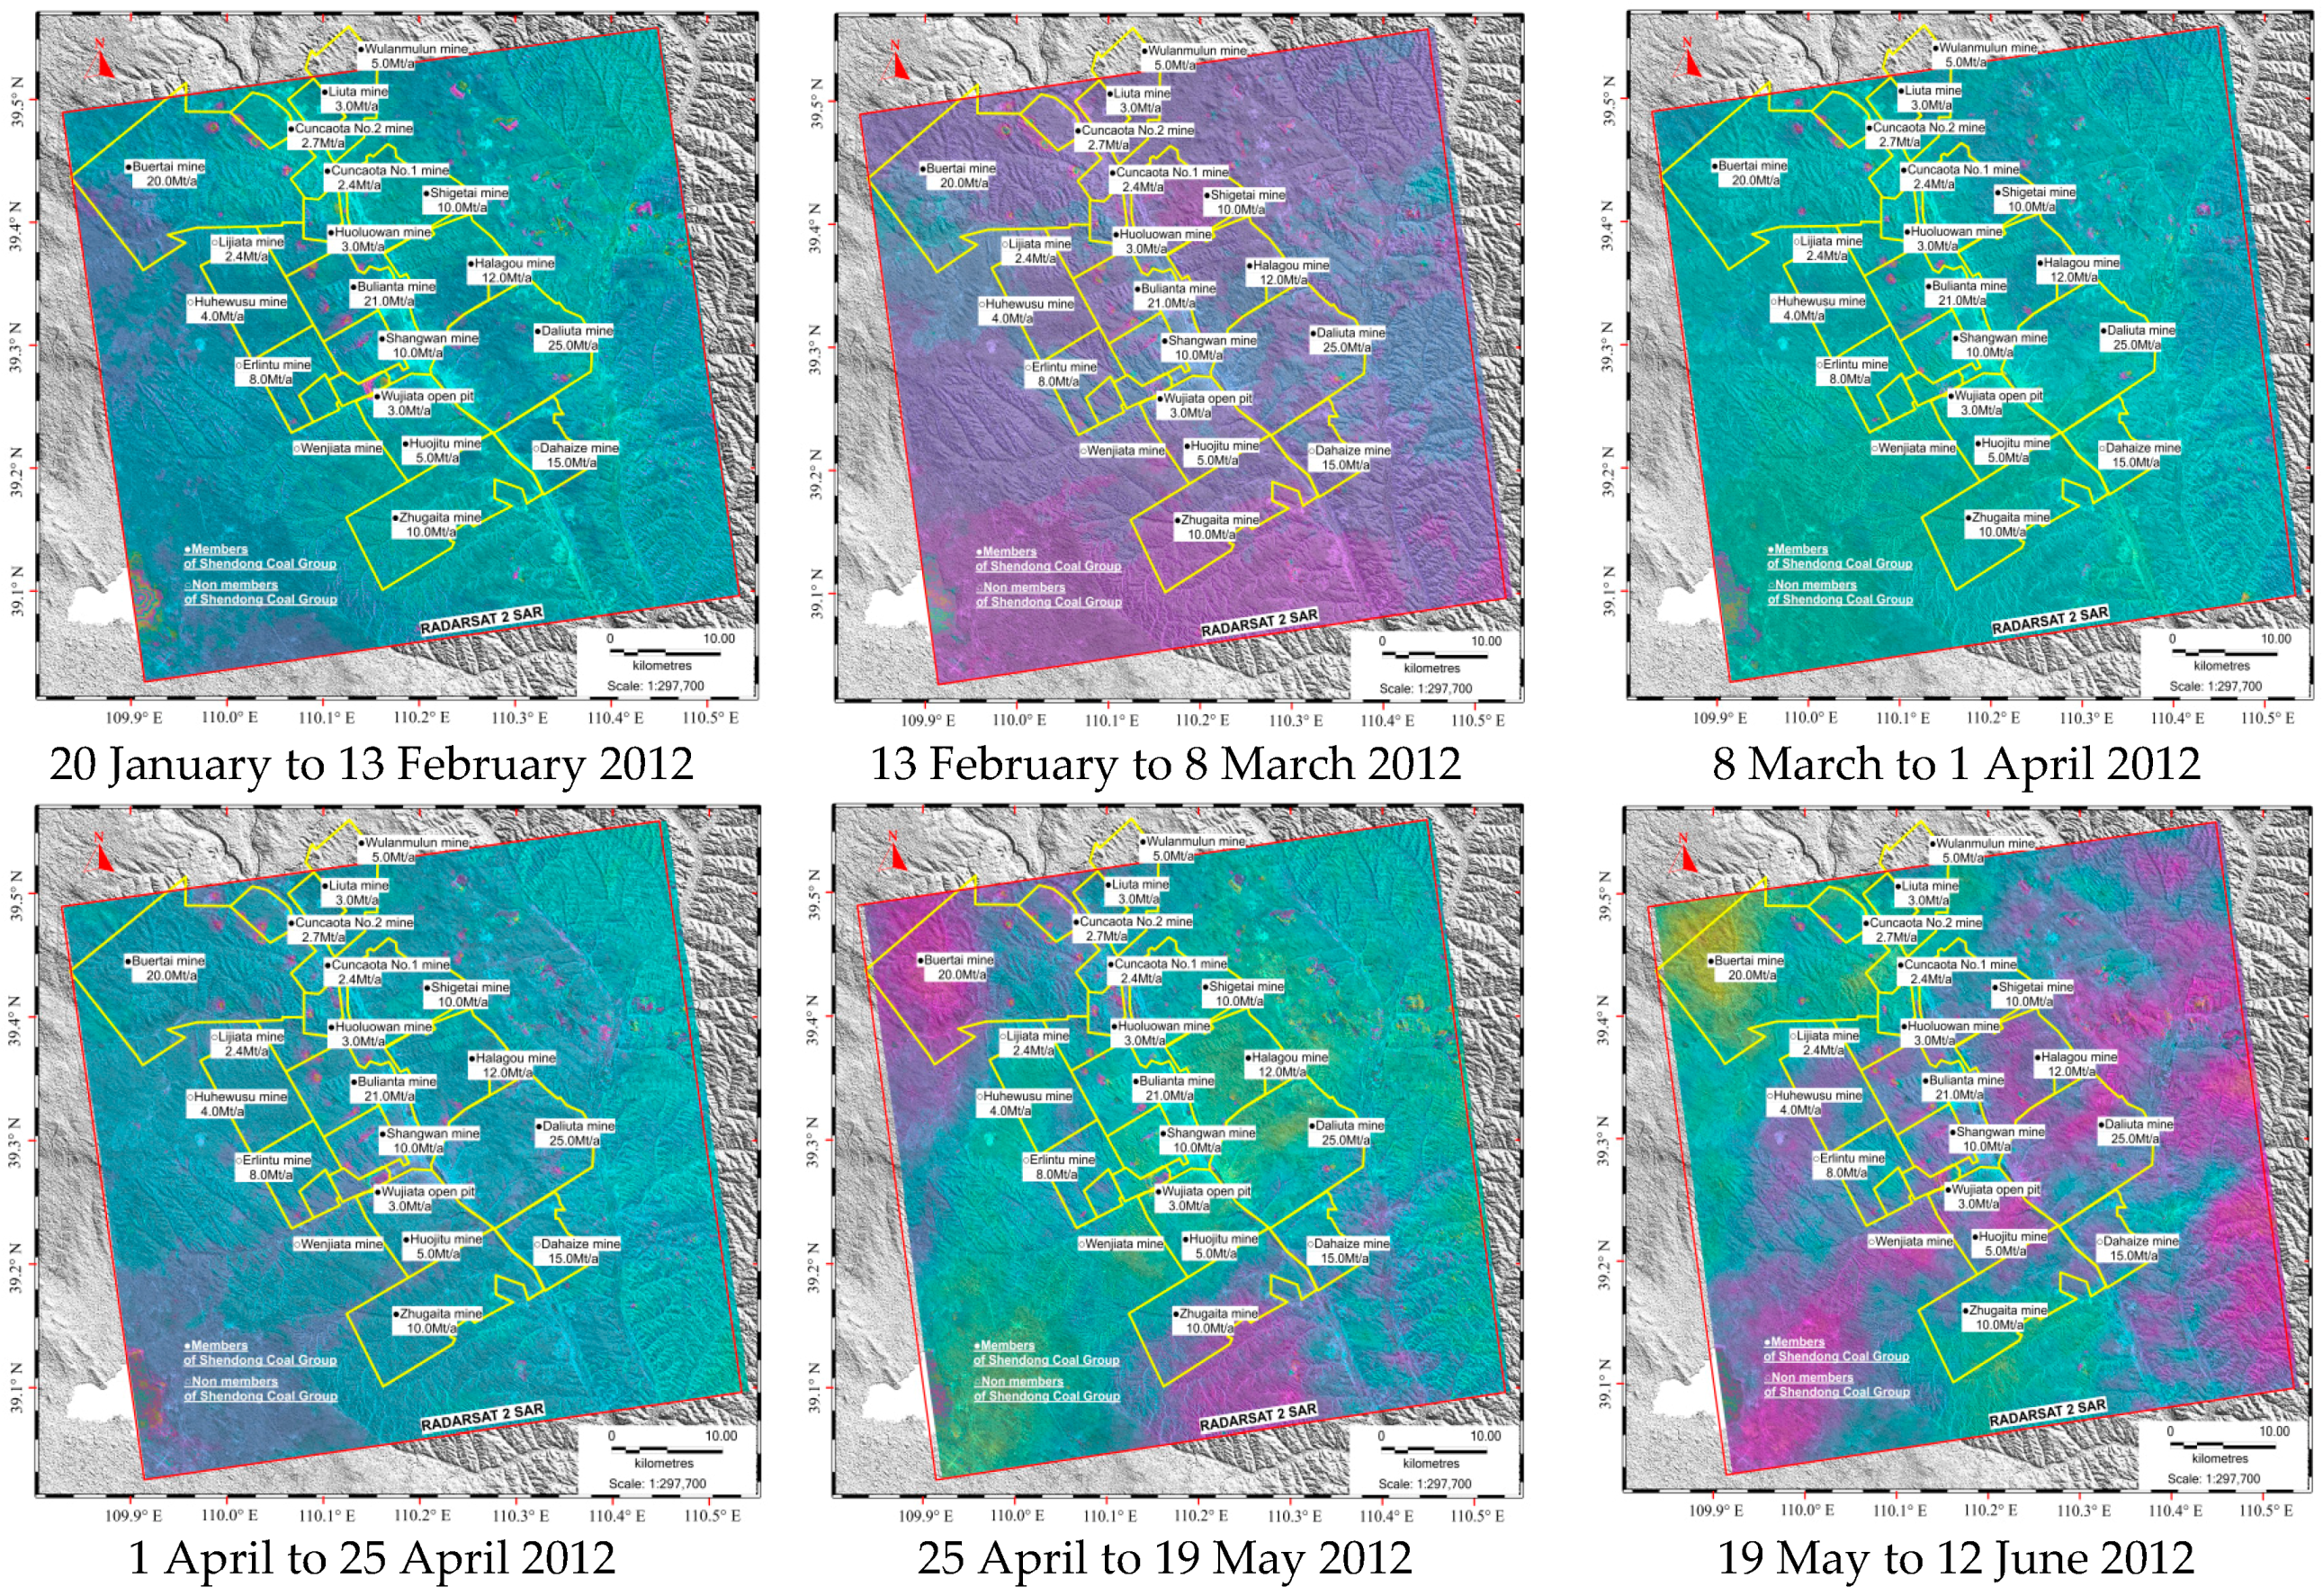
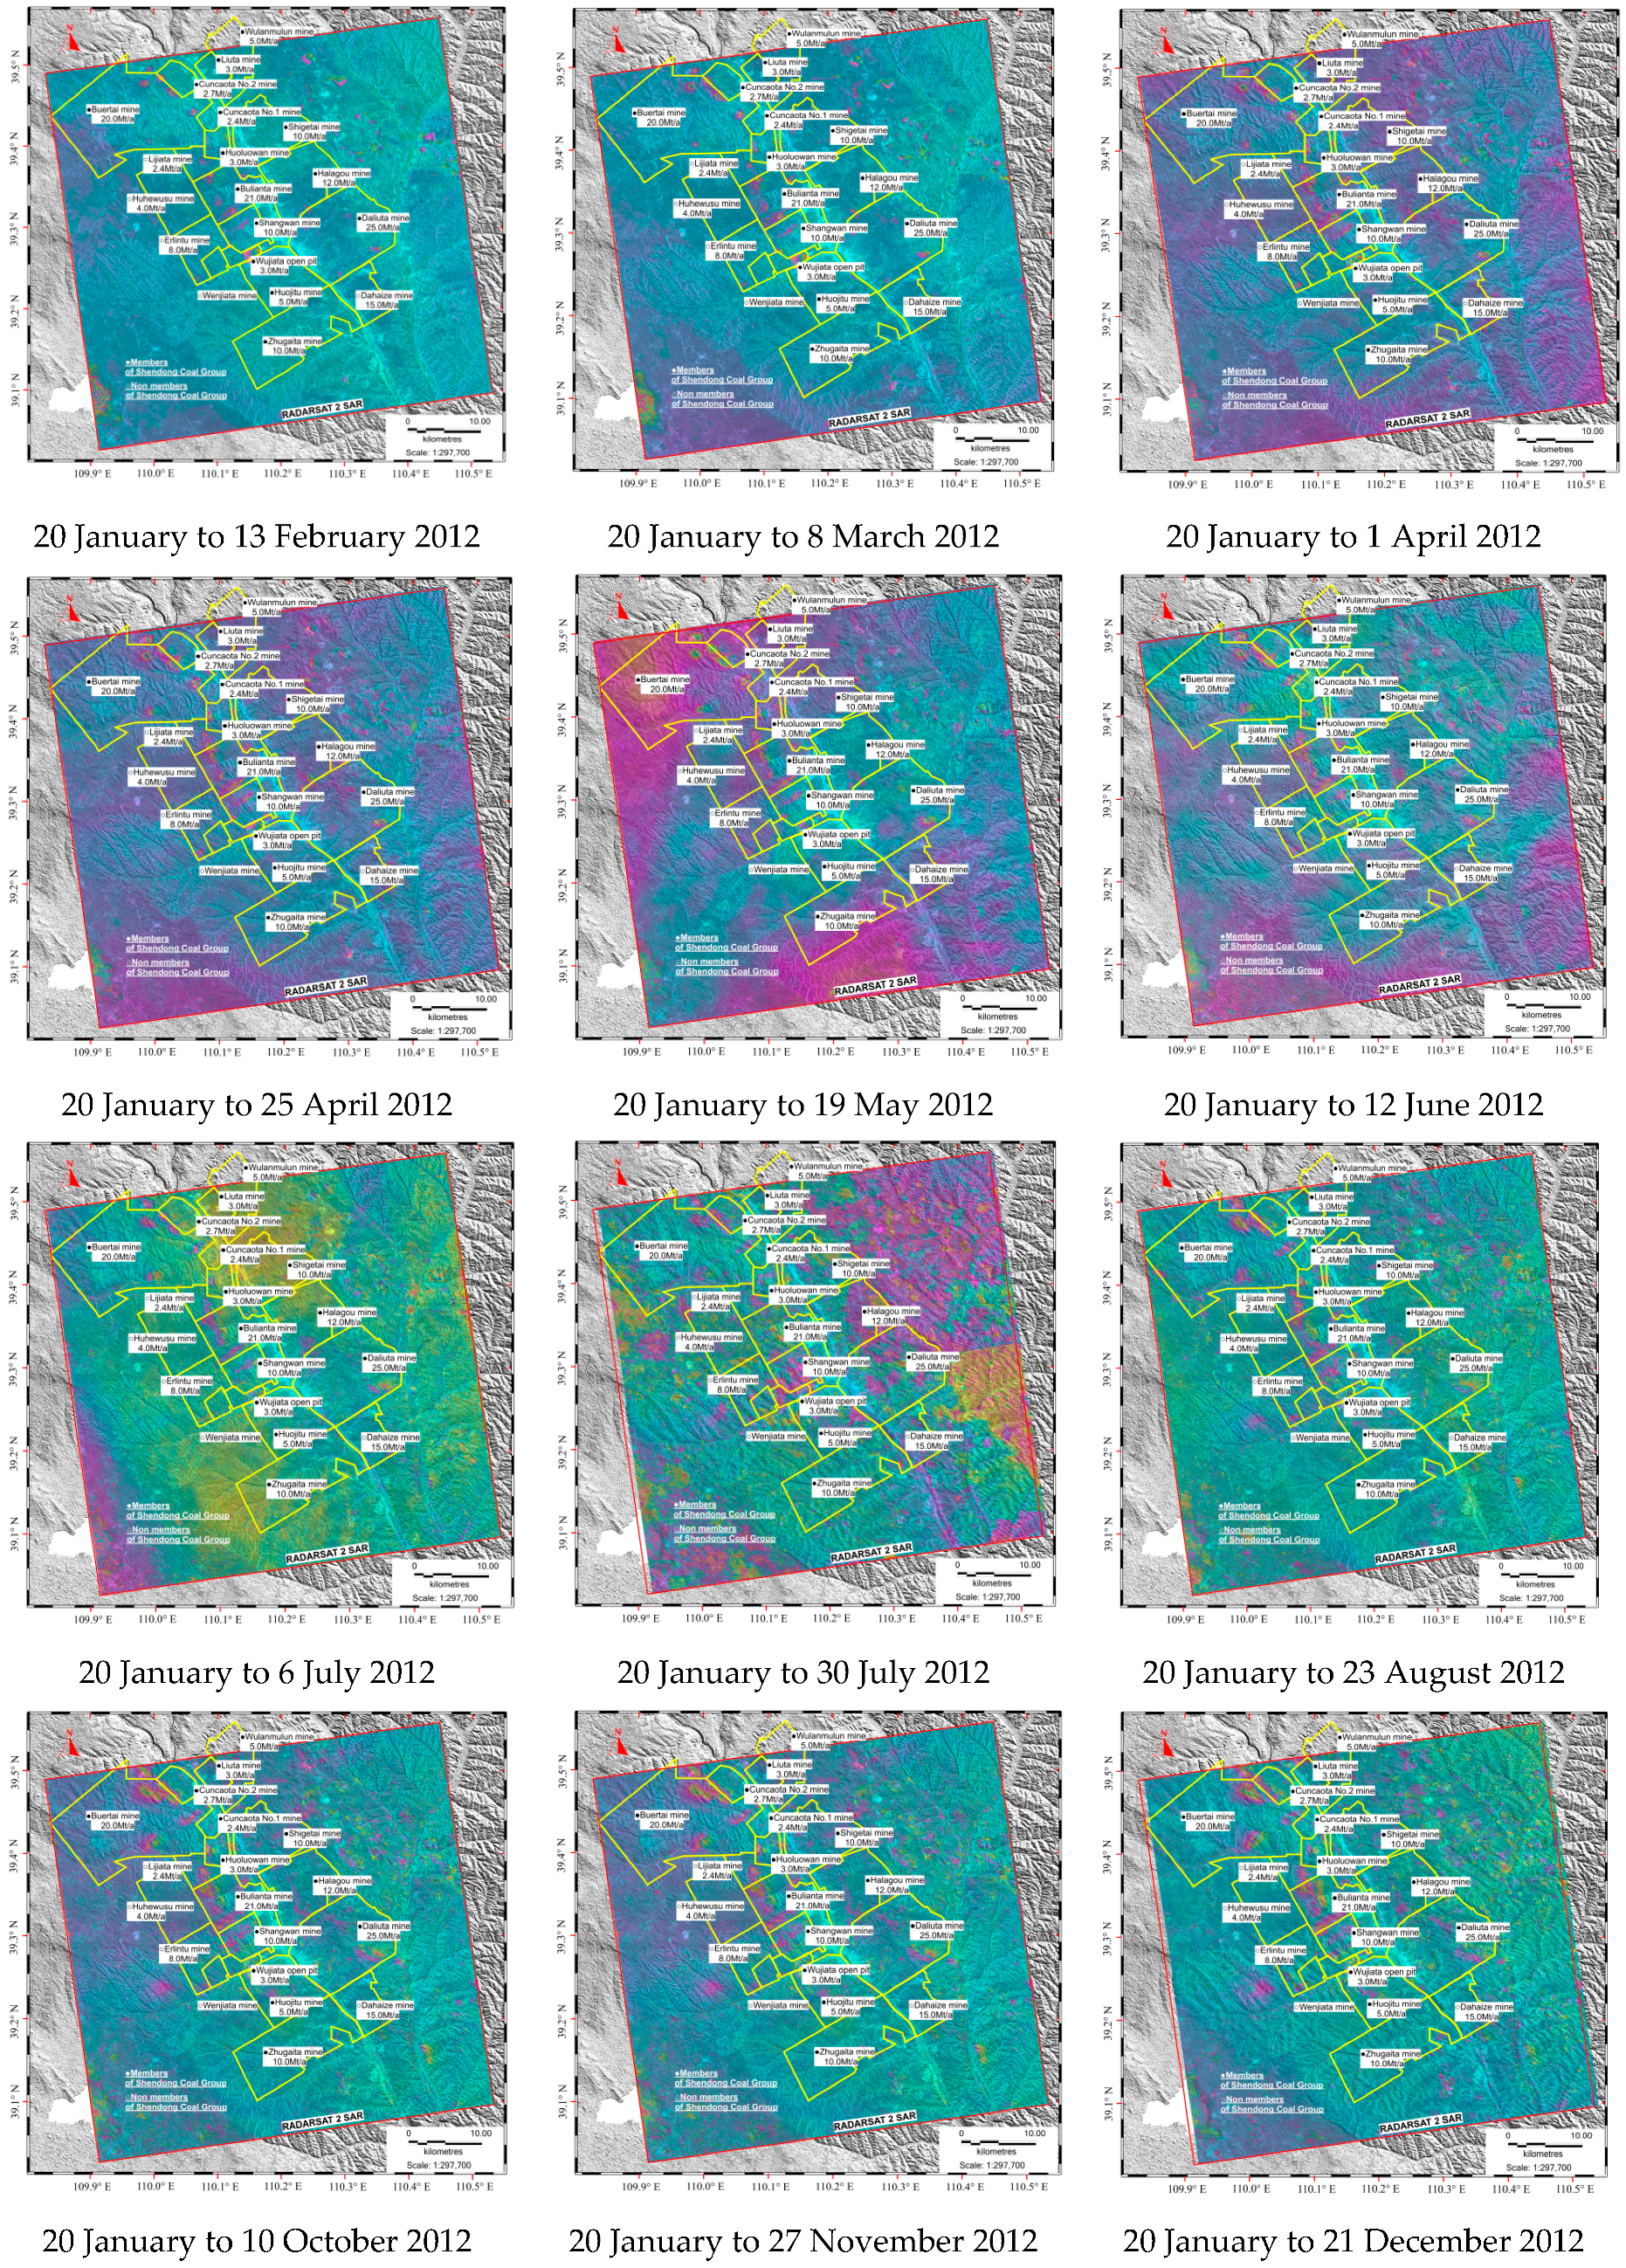
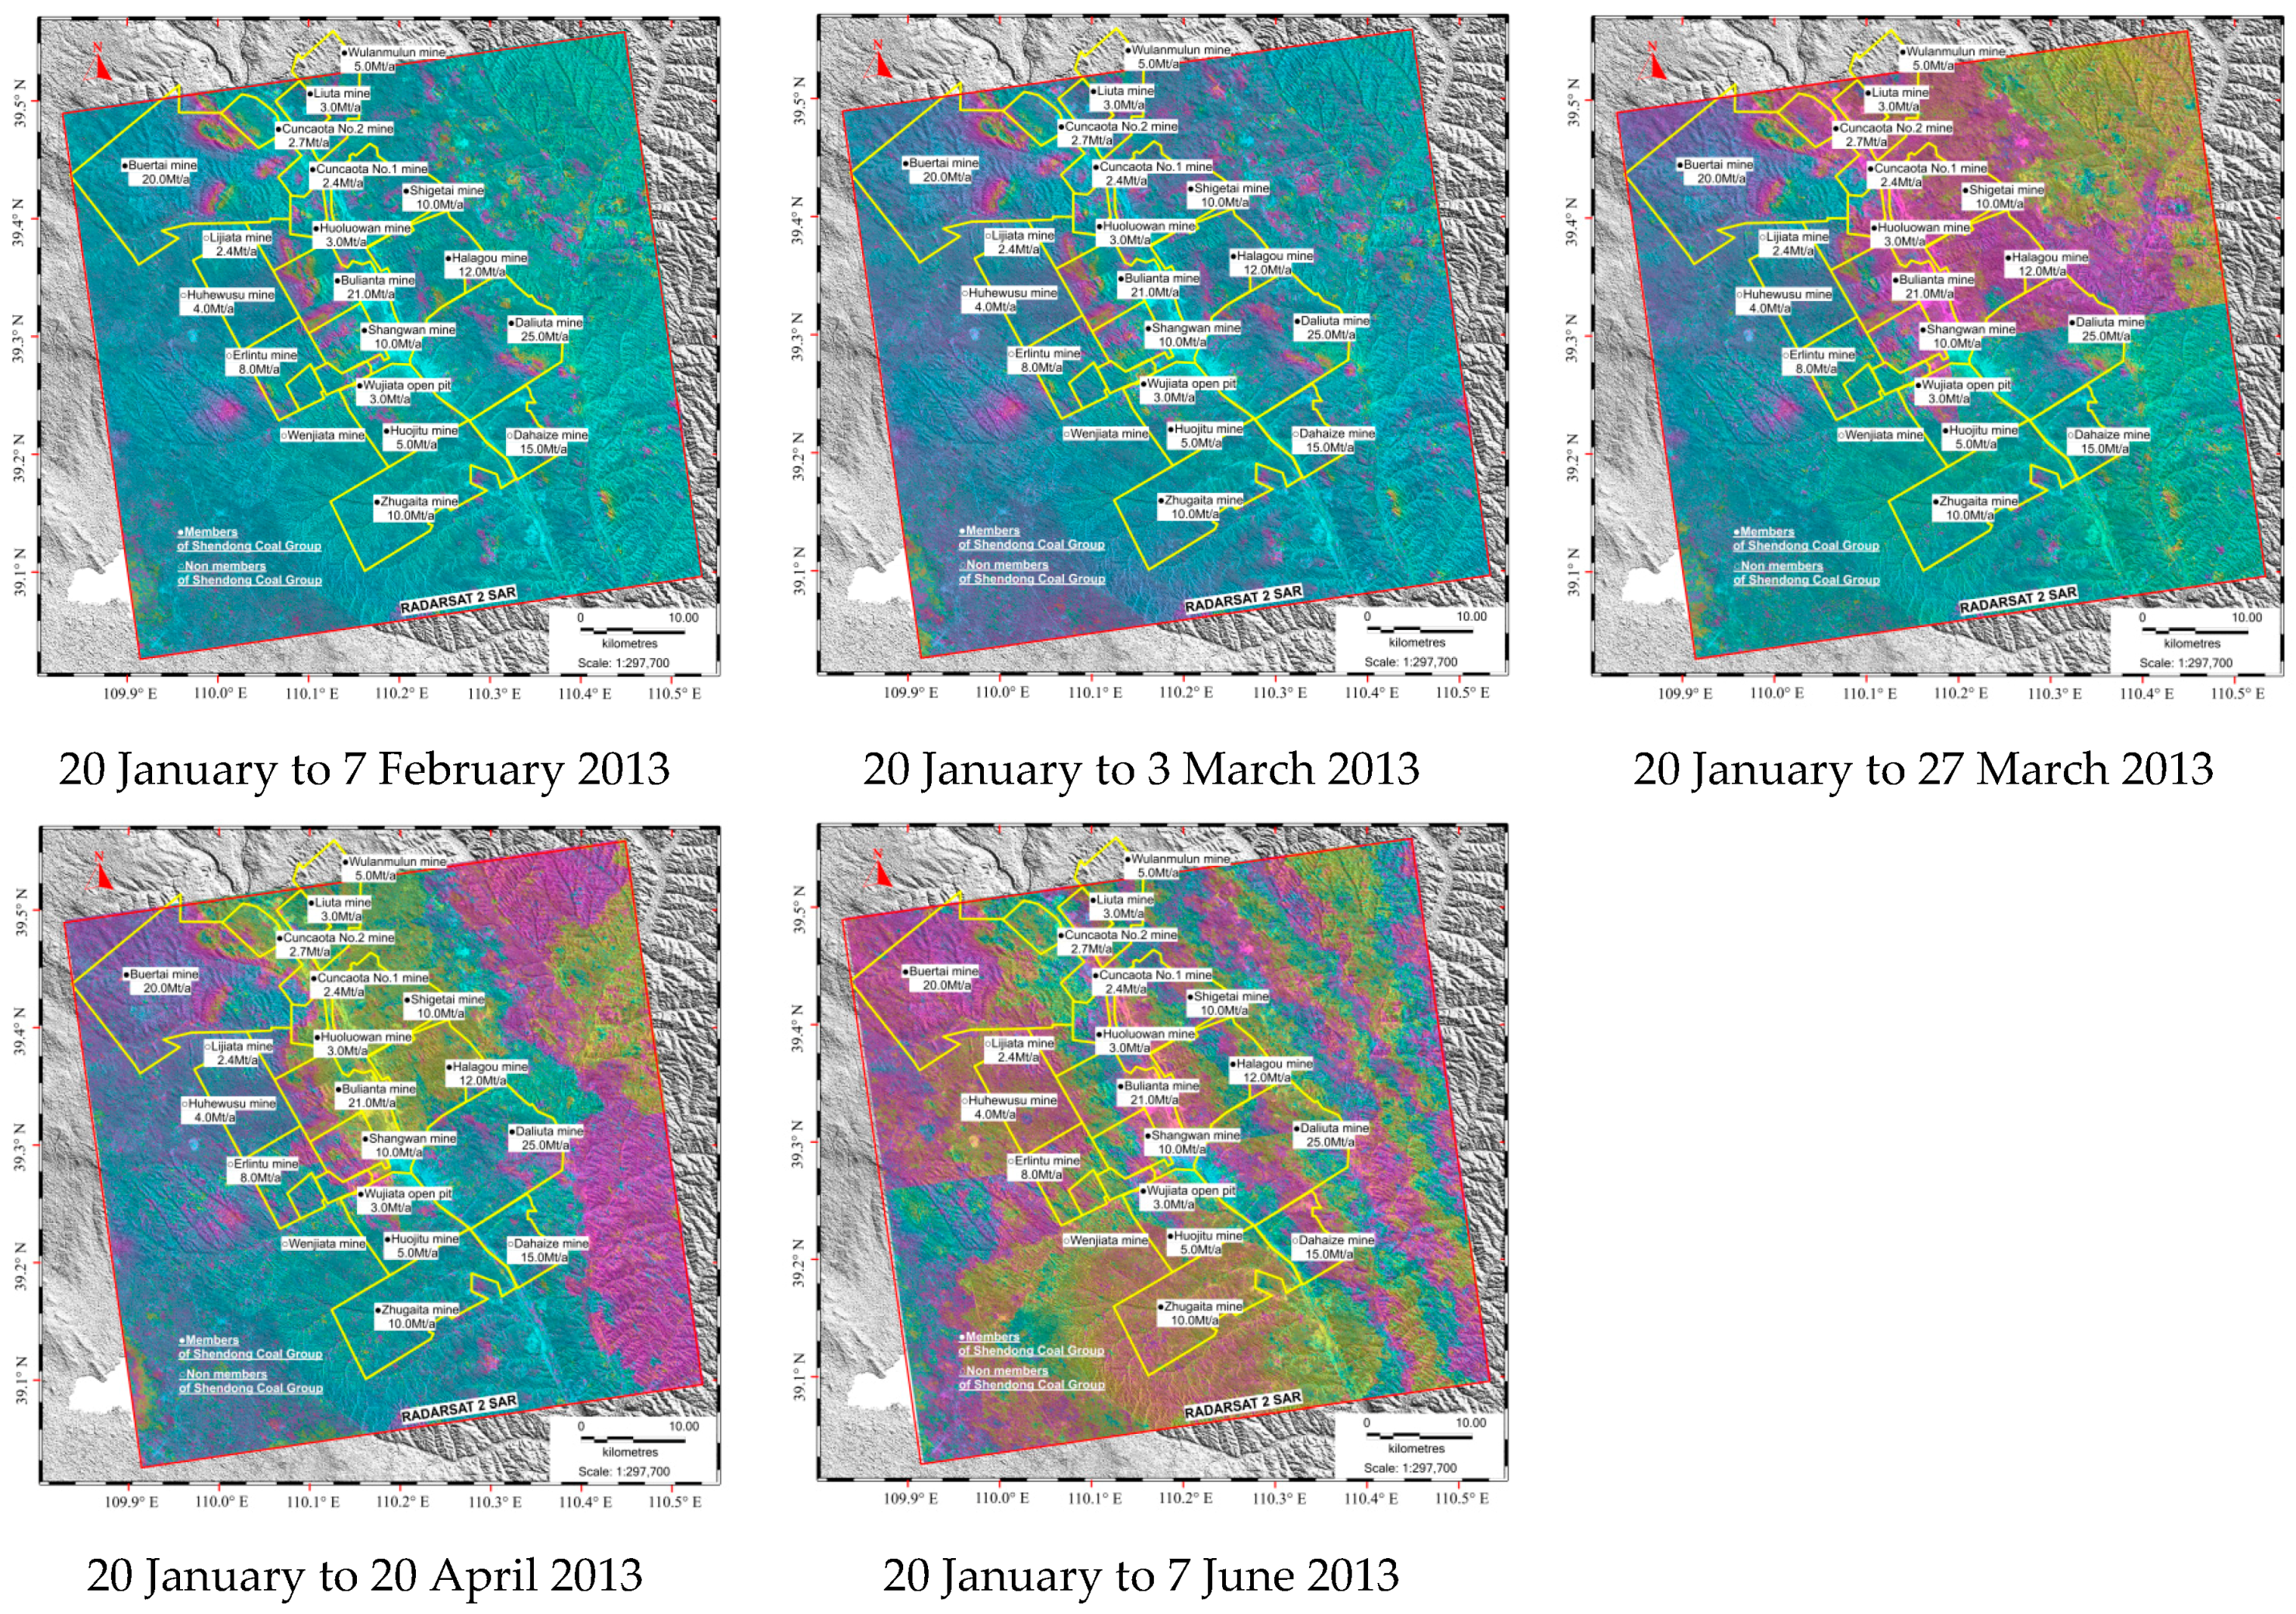
3.1.2. Results of Consecutive and Cumulative DInSAR Interferometries

(1) For the consecutive DInSAR interferometry, no image is fixed to a master image. The advanced 17 images were in turn used as the master image, whereas the subsequent image was used as the slave image. The temporal baseline was the same with the revisit period. The interferogram was characterized by independent differential phase changes in various periods and a forward movement of the footprint of the deformation phase of mining subsidence (Figure 5).
An ionospheric disturbance occurred during the interference process. Large reverse phase regions were observed from two interferometric pairs, namely, 20120425–20120519 and 20120519–20120612, which indicated that an atmospheric effect was present during the imaging of 20120519. The large reverse phase of 20120612–20120706 and 20120706–20120730 implied the presence of an atmospheric effect during the imaging of 20120706.
(2) For the cumulative DInSAR interferometry, the first image was set as the master image (Master, 20 January 2012) and the subsequent 17 images were alternately used as slave images. The interferogram indicated that the differential phase changes covered all previous phase changes, the deformation phase center of mining subsidence moved forward, and the deformation region expanded monthly (Figure 6).
The cumulative DInSAR interferometry was influenced simultaneously by temporal and spatial decorrelations. The interferogram had many unstable patches and several phase residues. It failed in retaining coherence and phase unwrapping during the last three periods.

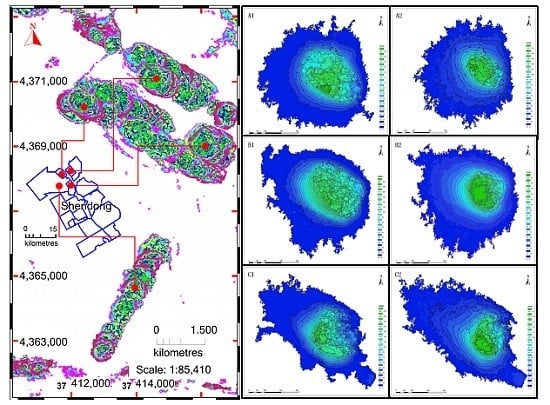
3.2. SBAS-InSAR Data Processing

To eliminate spatiotemporal decorrelation and atmospheric effects, an experimental plot was selected to test SBAS-InSAR, which was expected to reduce or eliminate the influences of decorrelation factors during DInSAR data processing by selecting appropriate spatiotemporal baseline thresholds.

3.2.1. Spatiotemporal Baseline Optimization of SBAS

All interferometric pairs within the thresholds of the spatial and temporal baselines were screened based on a preset spatial baseline threshold, a temporal baseline threshold, and relevant input parameters, thereby generating the SAR data pair connection diagram (Figure 7). In this experiment, the maximum critical baseline percentage was set at 5%. The maximum perpendicular component of the spatial baseline was 422 m. The maximum temporal baseline was set 200 days. The system automatically screened the super master image (20120823). Interferometric pairs with low coherence and poor unwrapping were eliminated, and finally, 47 interferometric pairs were selected.

3.2.2. Interferometry Results of SBAS

Considering significant computational efforts and necessary disk space, SBAS was applied finely in a single working face of the 22201-1/2 long wall. Interferometry was performed on each image pair according to their connection relationship based on the aforementioned optimized baselines of SBAS, and 47 interferograms were obtained. A total of 17 time-series cumulative phase deformation diagrams were collected through orbit refining, reflatting, phase unwrapping, and geocoding. Subsequently, a −10 mm subsidence contour map was acquired based on the further processing of these diagrams (Figure 8a–q).

4. Discussions

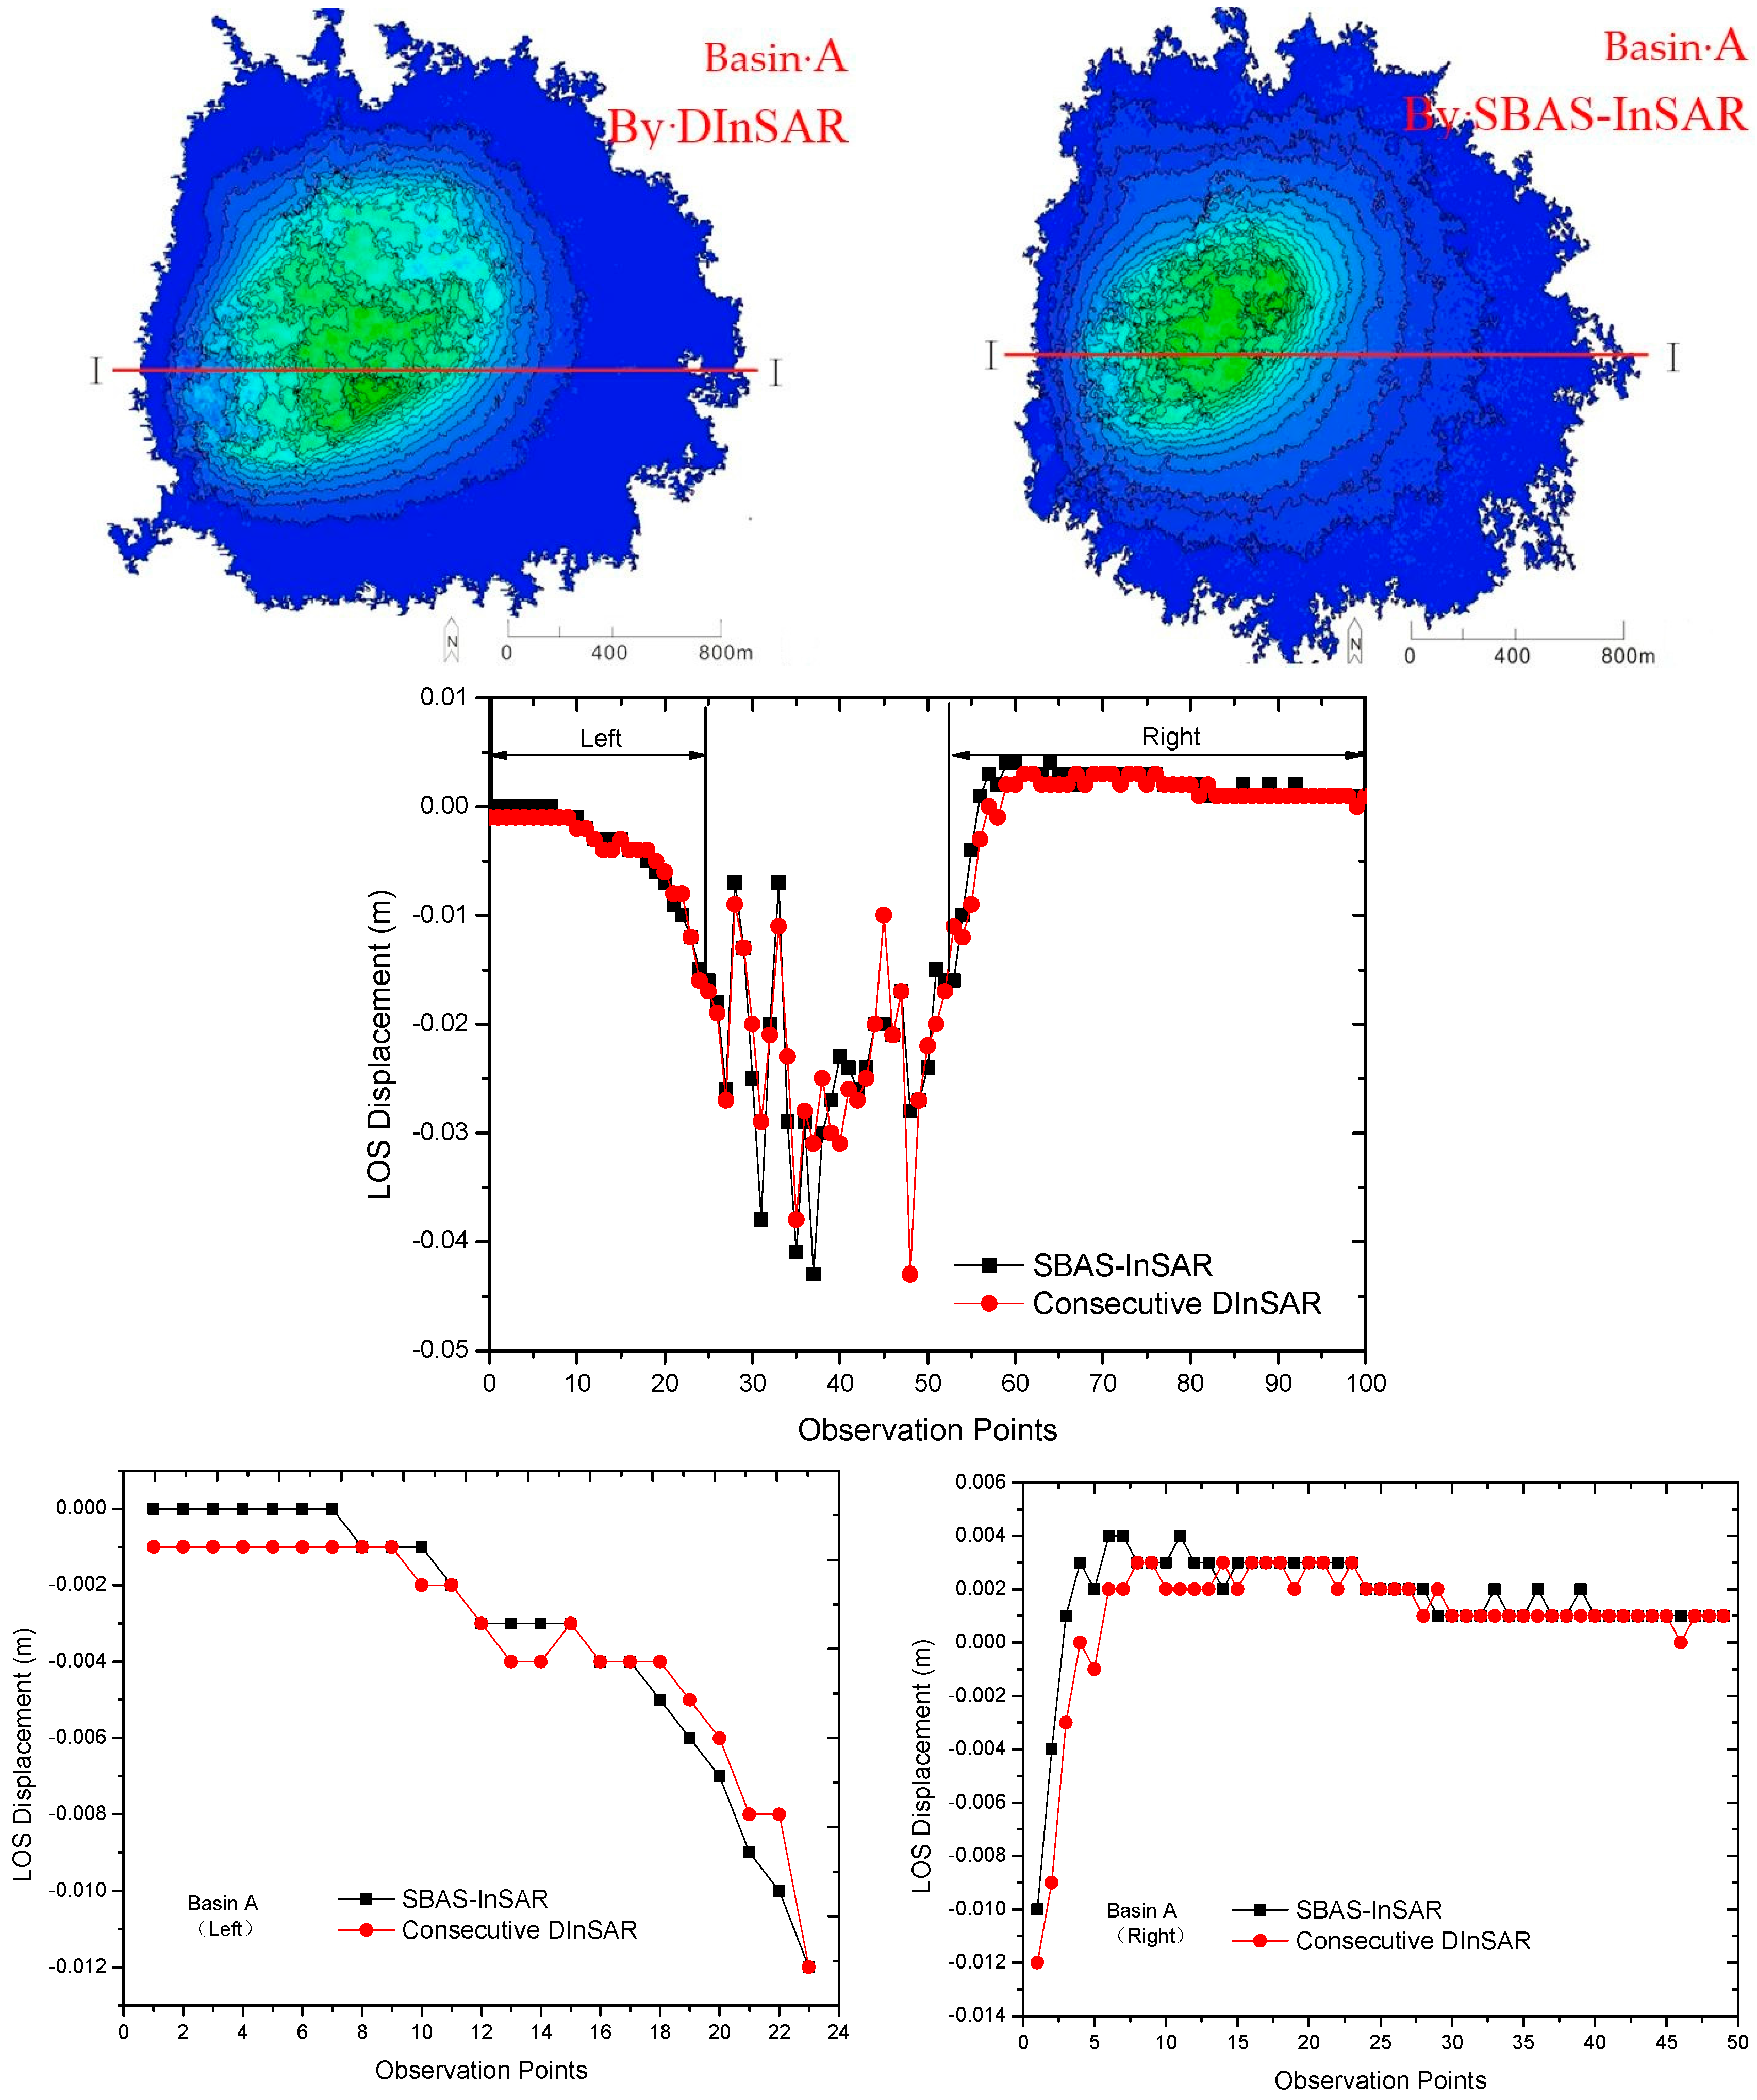
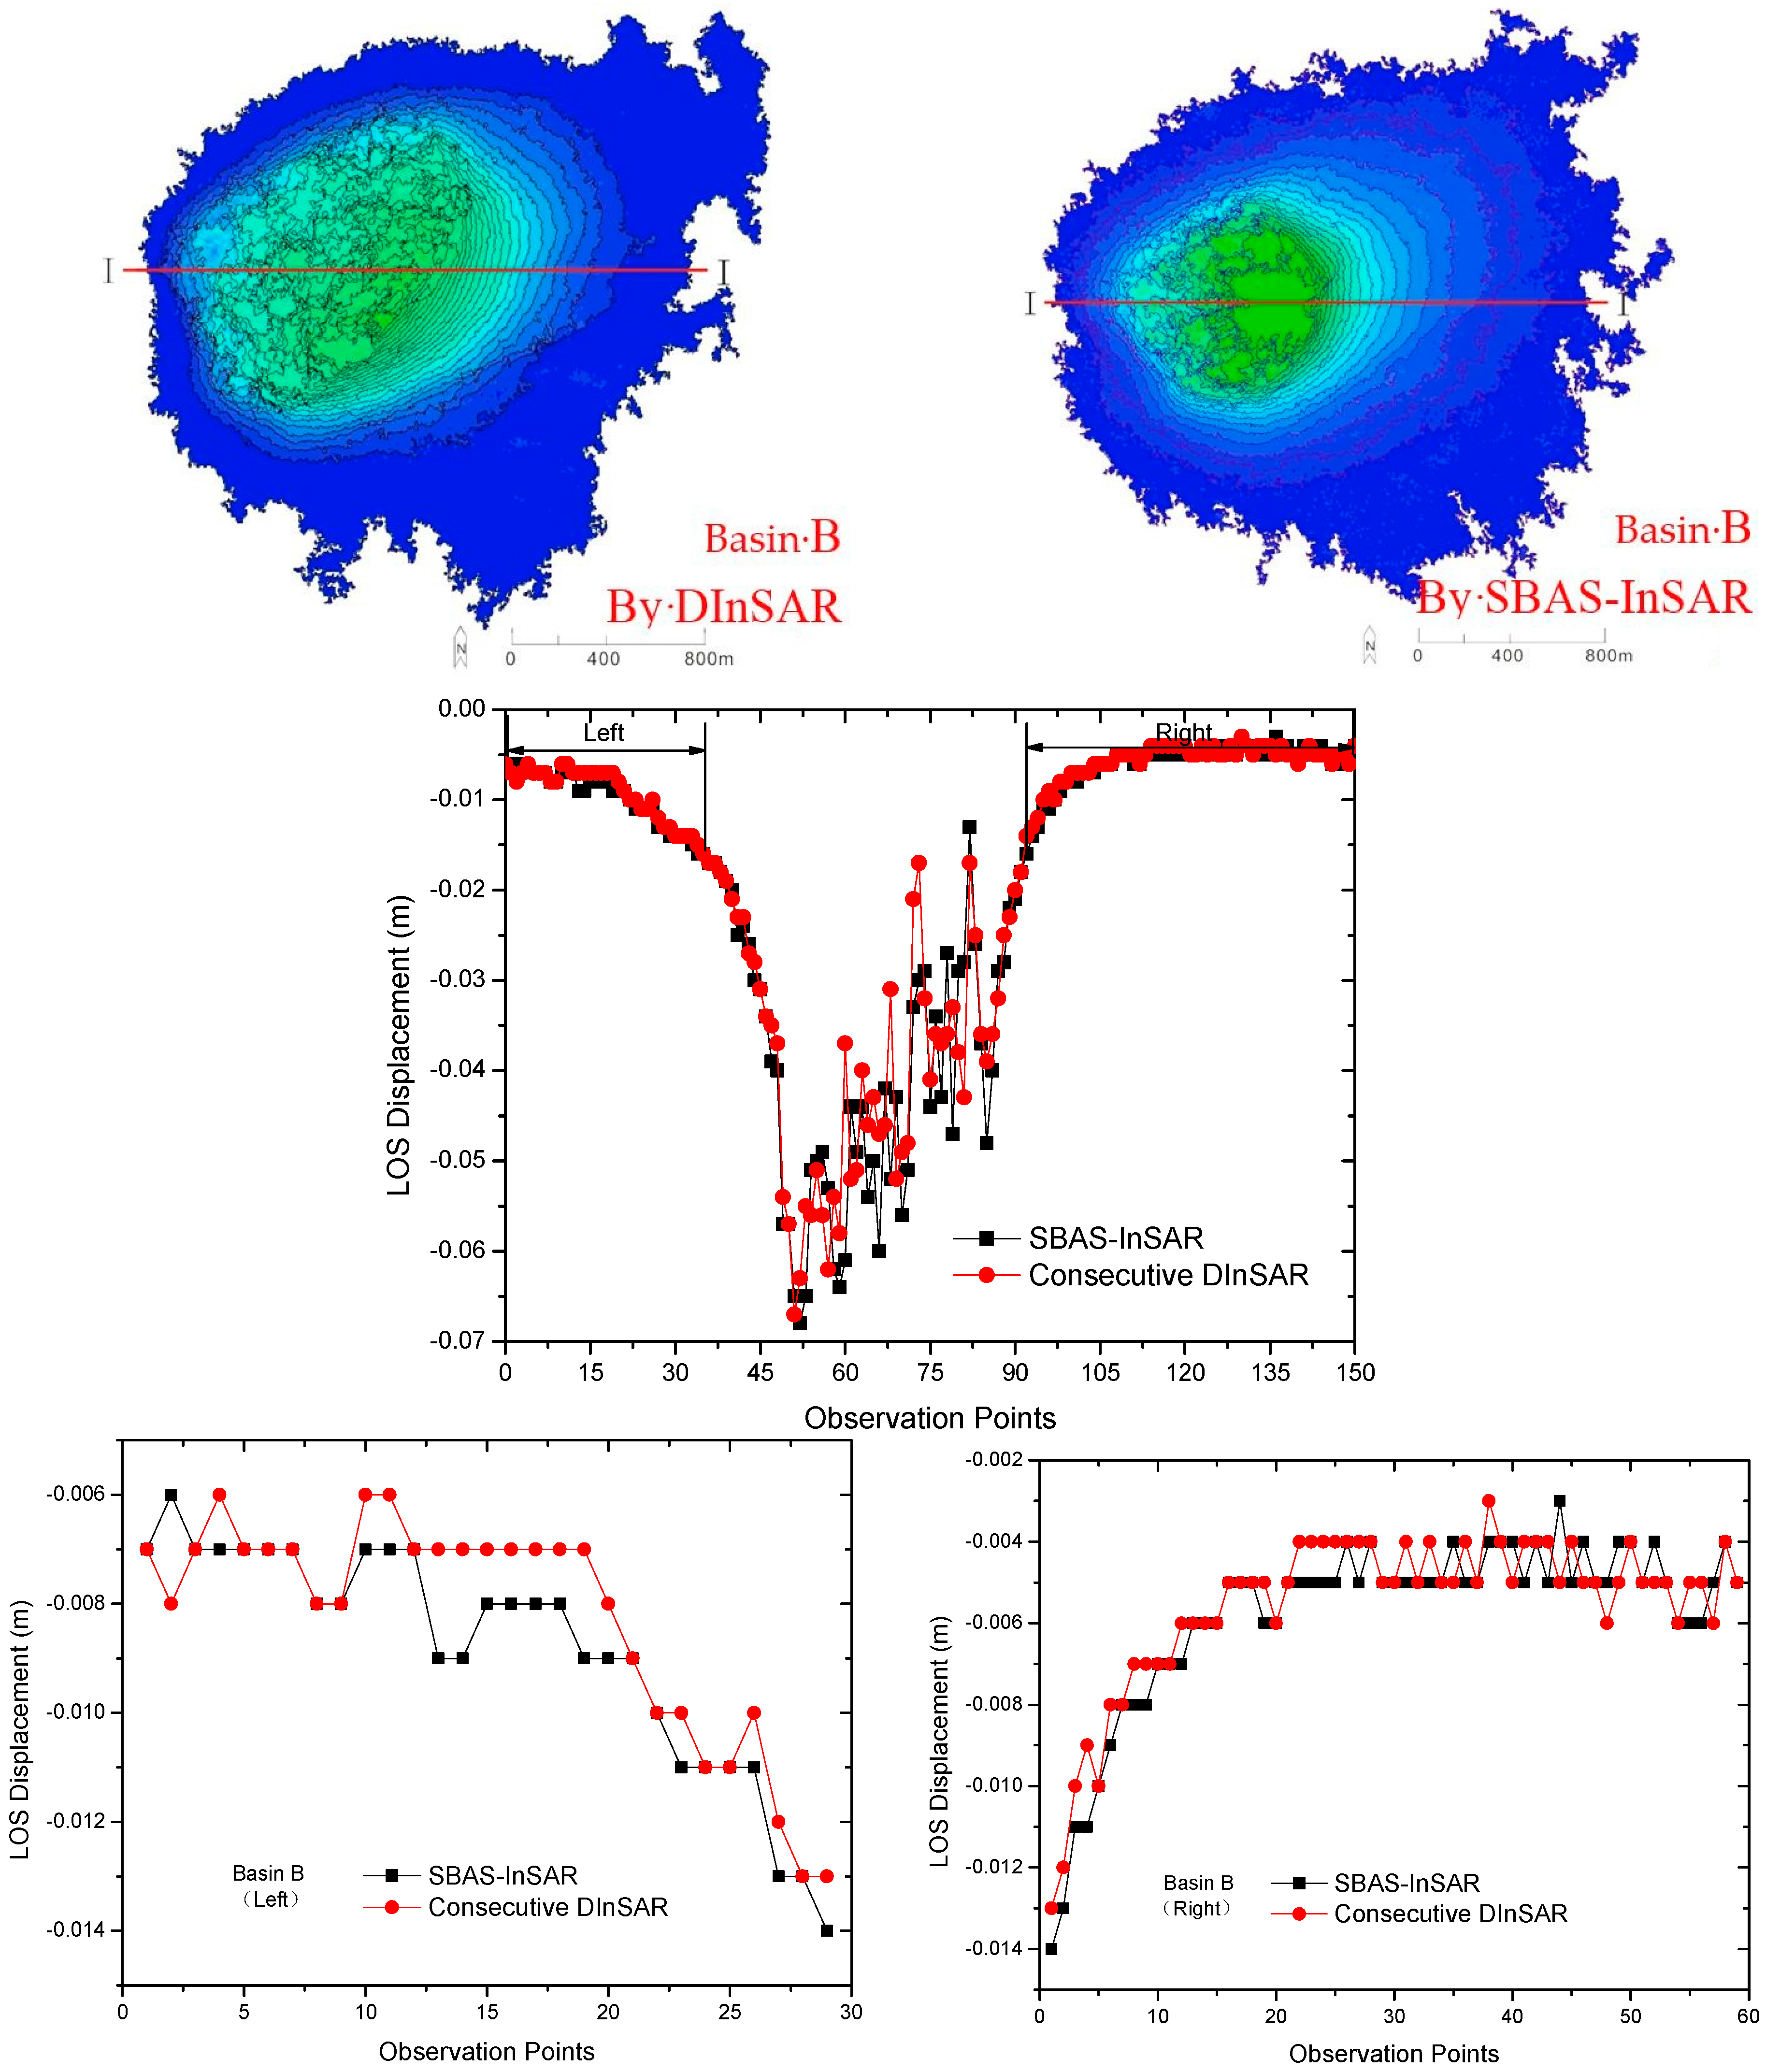
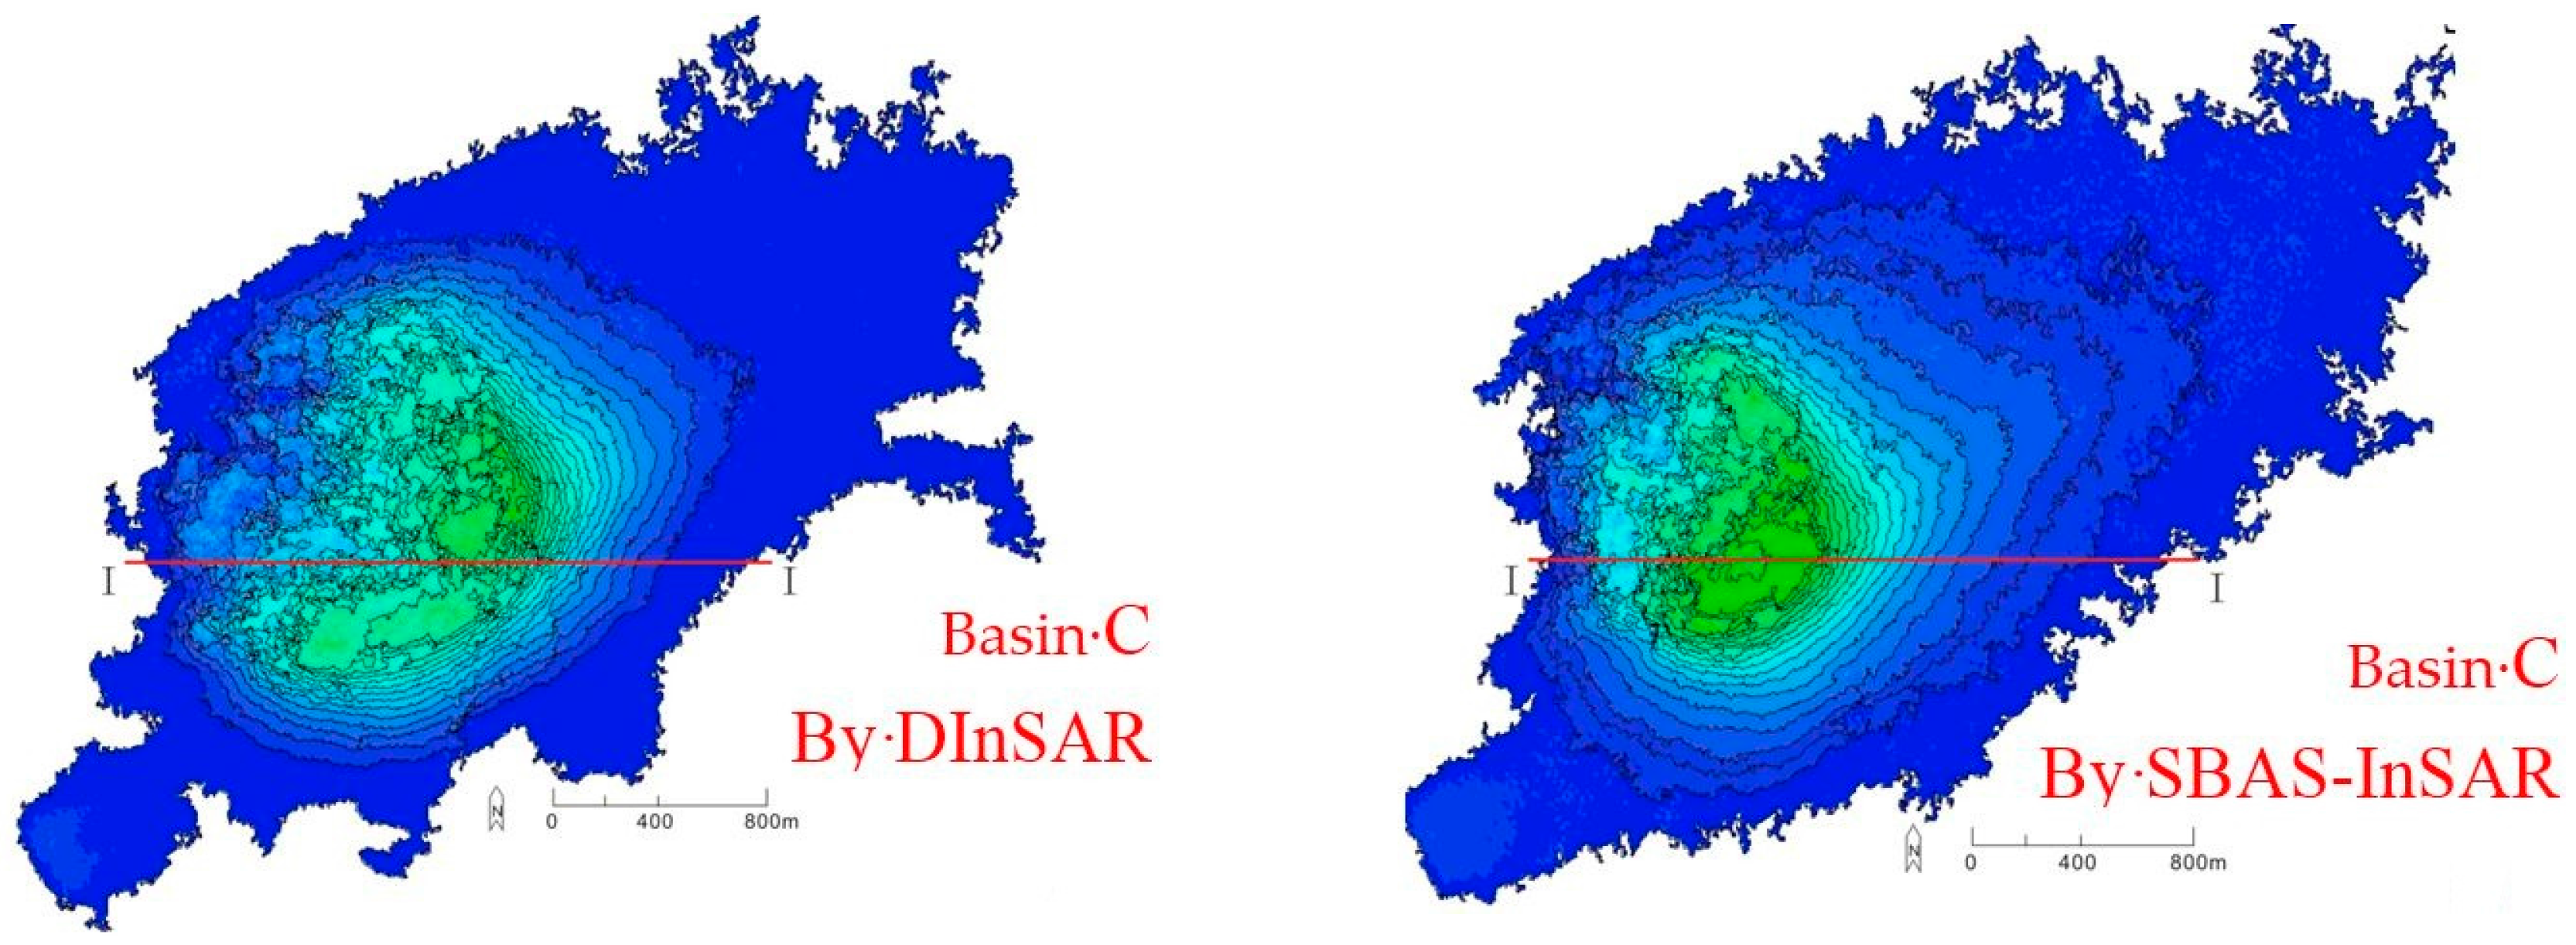
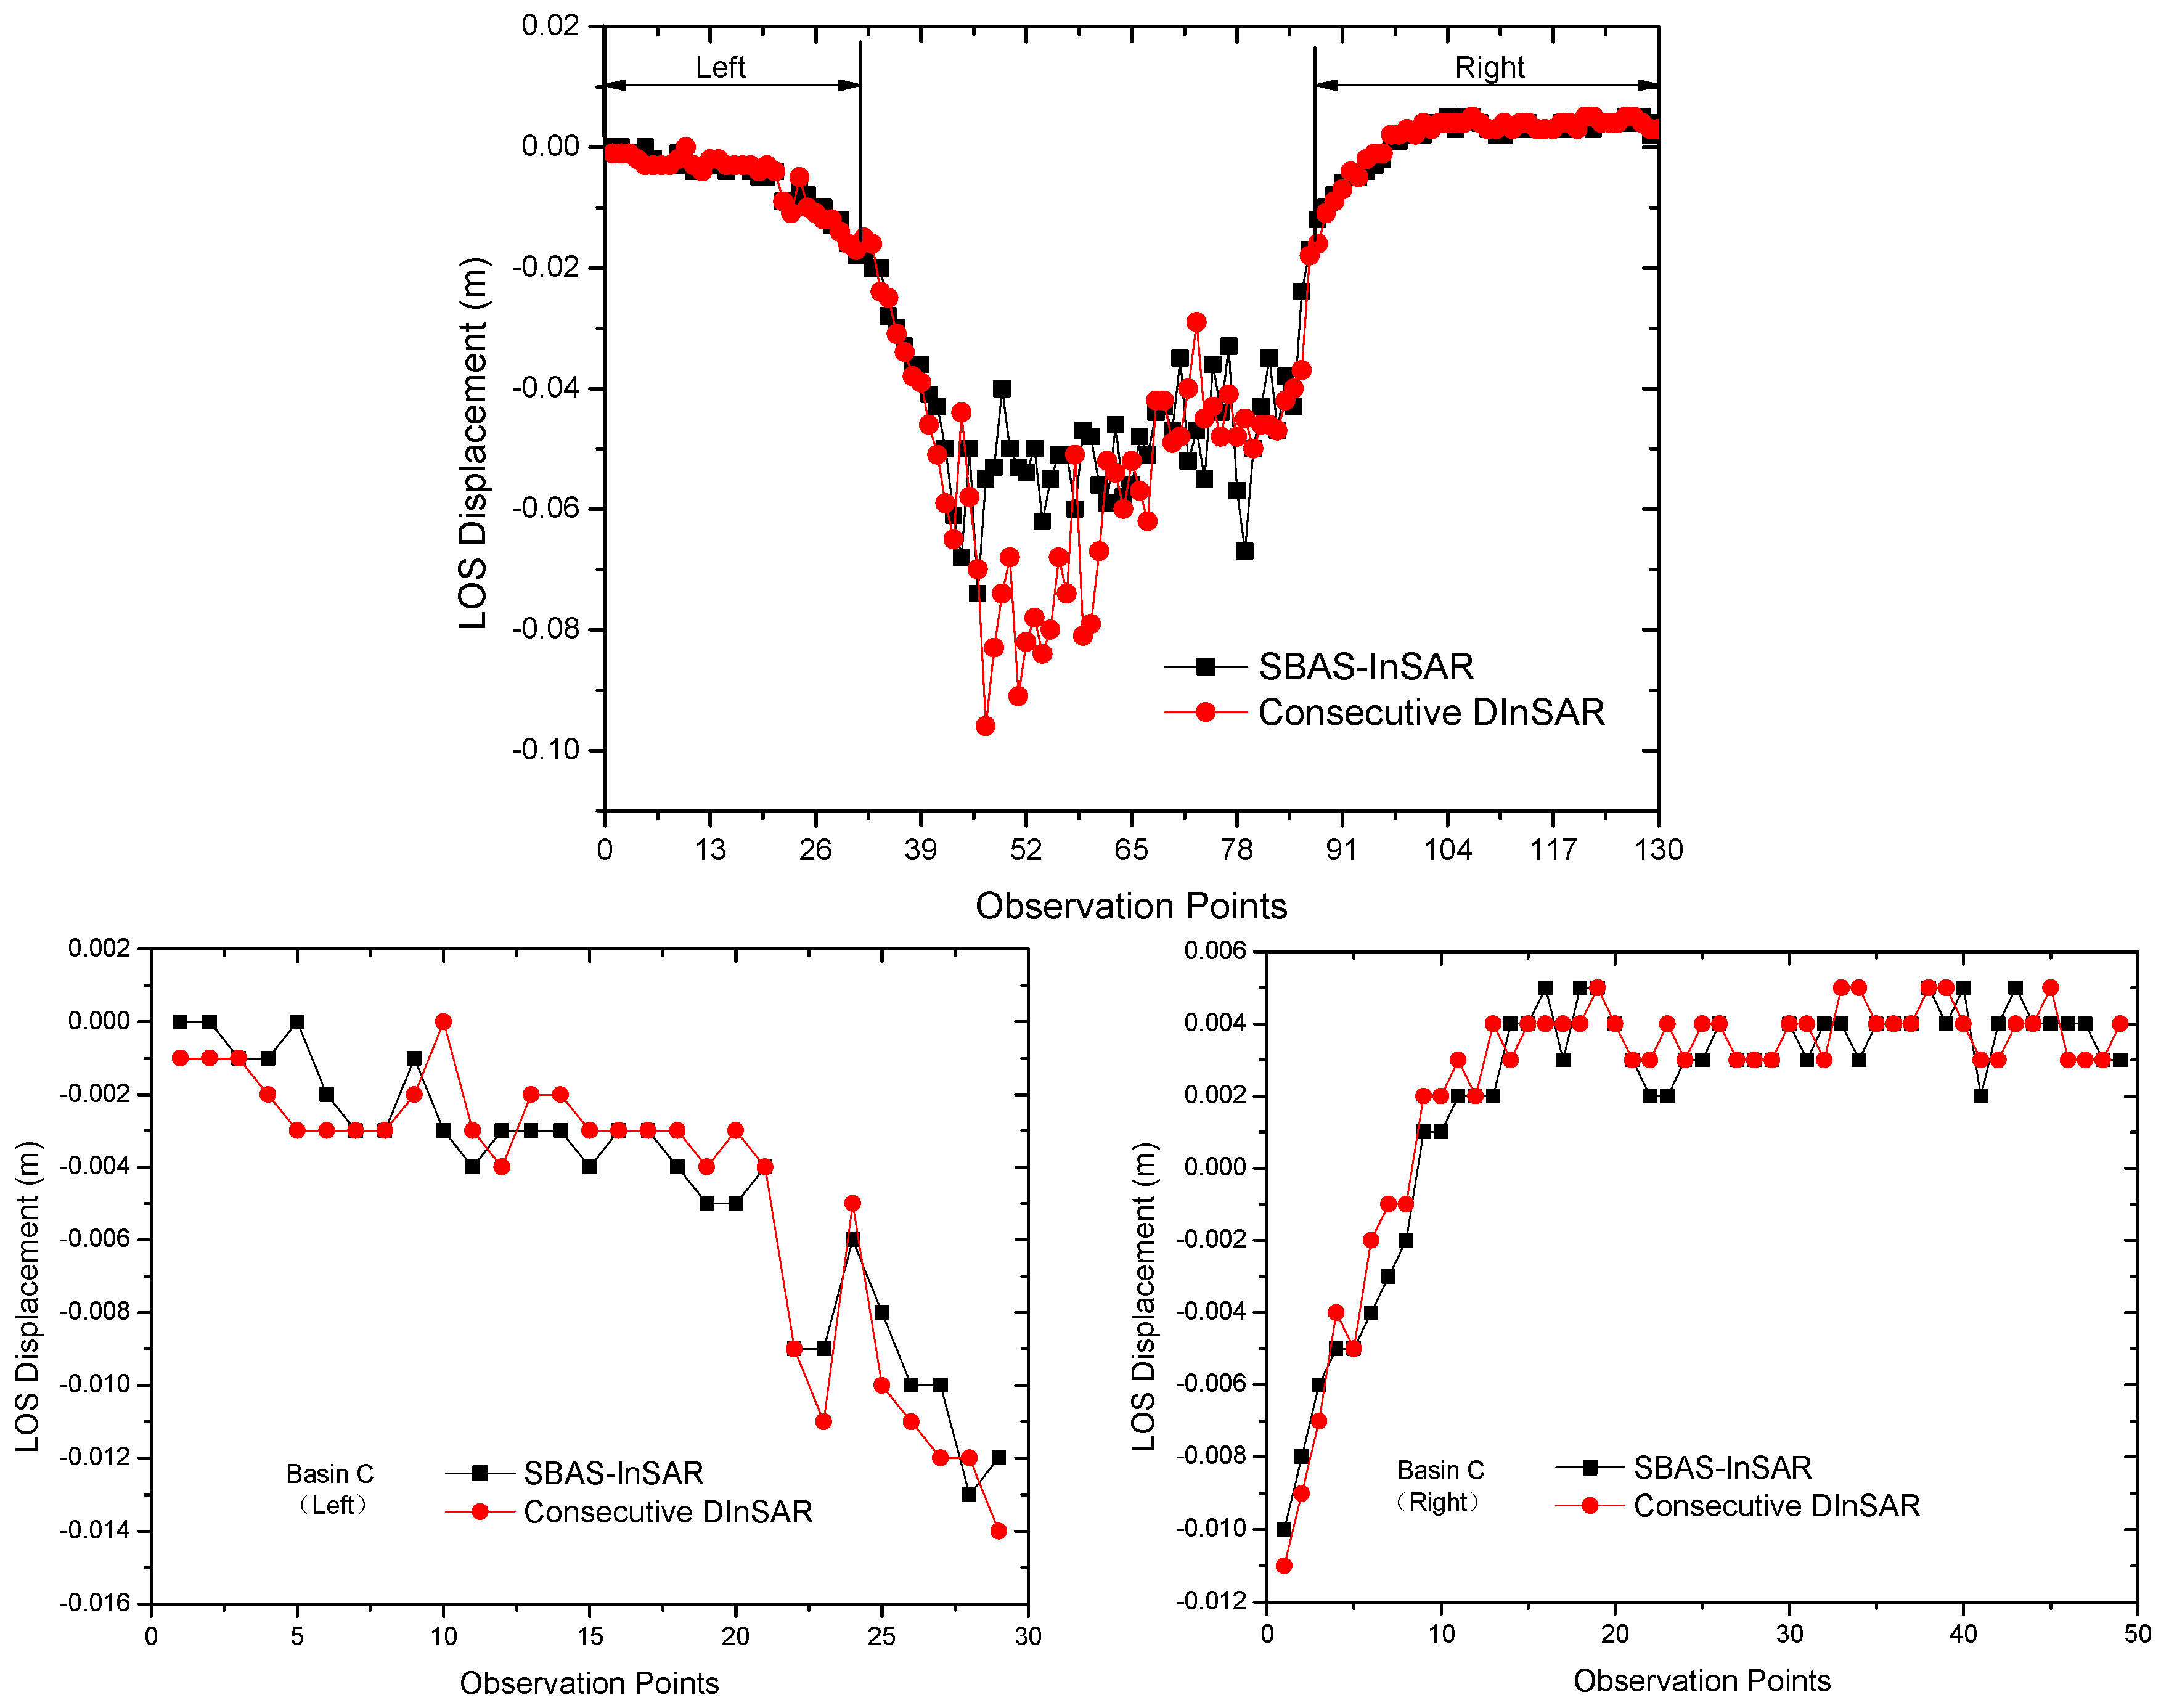
4.1. The Reliability Validation of the Interferometry

Because of the past mining subsidence and lack of field data, the reliability of interferometric measurements needs to be verified and validated. We randomly selected three subsidence basins (basin A,B,C) and some understanding are gotten by comparing the results of the two interferometry measurements(i.e., SABS-InSAR and the consecutive DInSAR).
See Figure 9, Figure 10 and Figure 11, using the same profile line, we extract the subsidence values in the two subsidence basins by SABS-InSAR and the consecutive DInSAR, and then perform the overlay analysis.
The unwrapping of the central area of the subsidence basin is erroneous due to the influence of decoherence. So we only compare the information at the edge of the subsidence basins. We found that the results of two interferometric measurements coincide each other fairly well. For example, the Root Mean Square Error (RMSE) of the subsidence values on both sides of basin A are ±0.6 mm (left) and ±0.3 mm (right) respectively (see Figure 9), the RMSE of the subsidence values on both sides of basin B are ±0.6 mm (left) and ±0.2 mm (right) respectively (see Figure 10), and the RMSE of the subsidence values on both sides of basin C are ±0.4 mm (left) and ±0.1 mm (right) respectively (see Figure 11). Therefore, through the above cross-validation, we believe that our data processing scheme is highly reliable, and it can be used for large-scale investigation of past mining subsidence.

4.2. Mining Subsidence Status in Shendong Coalfield

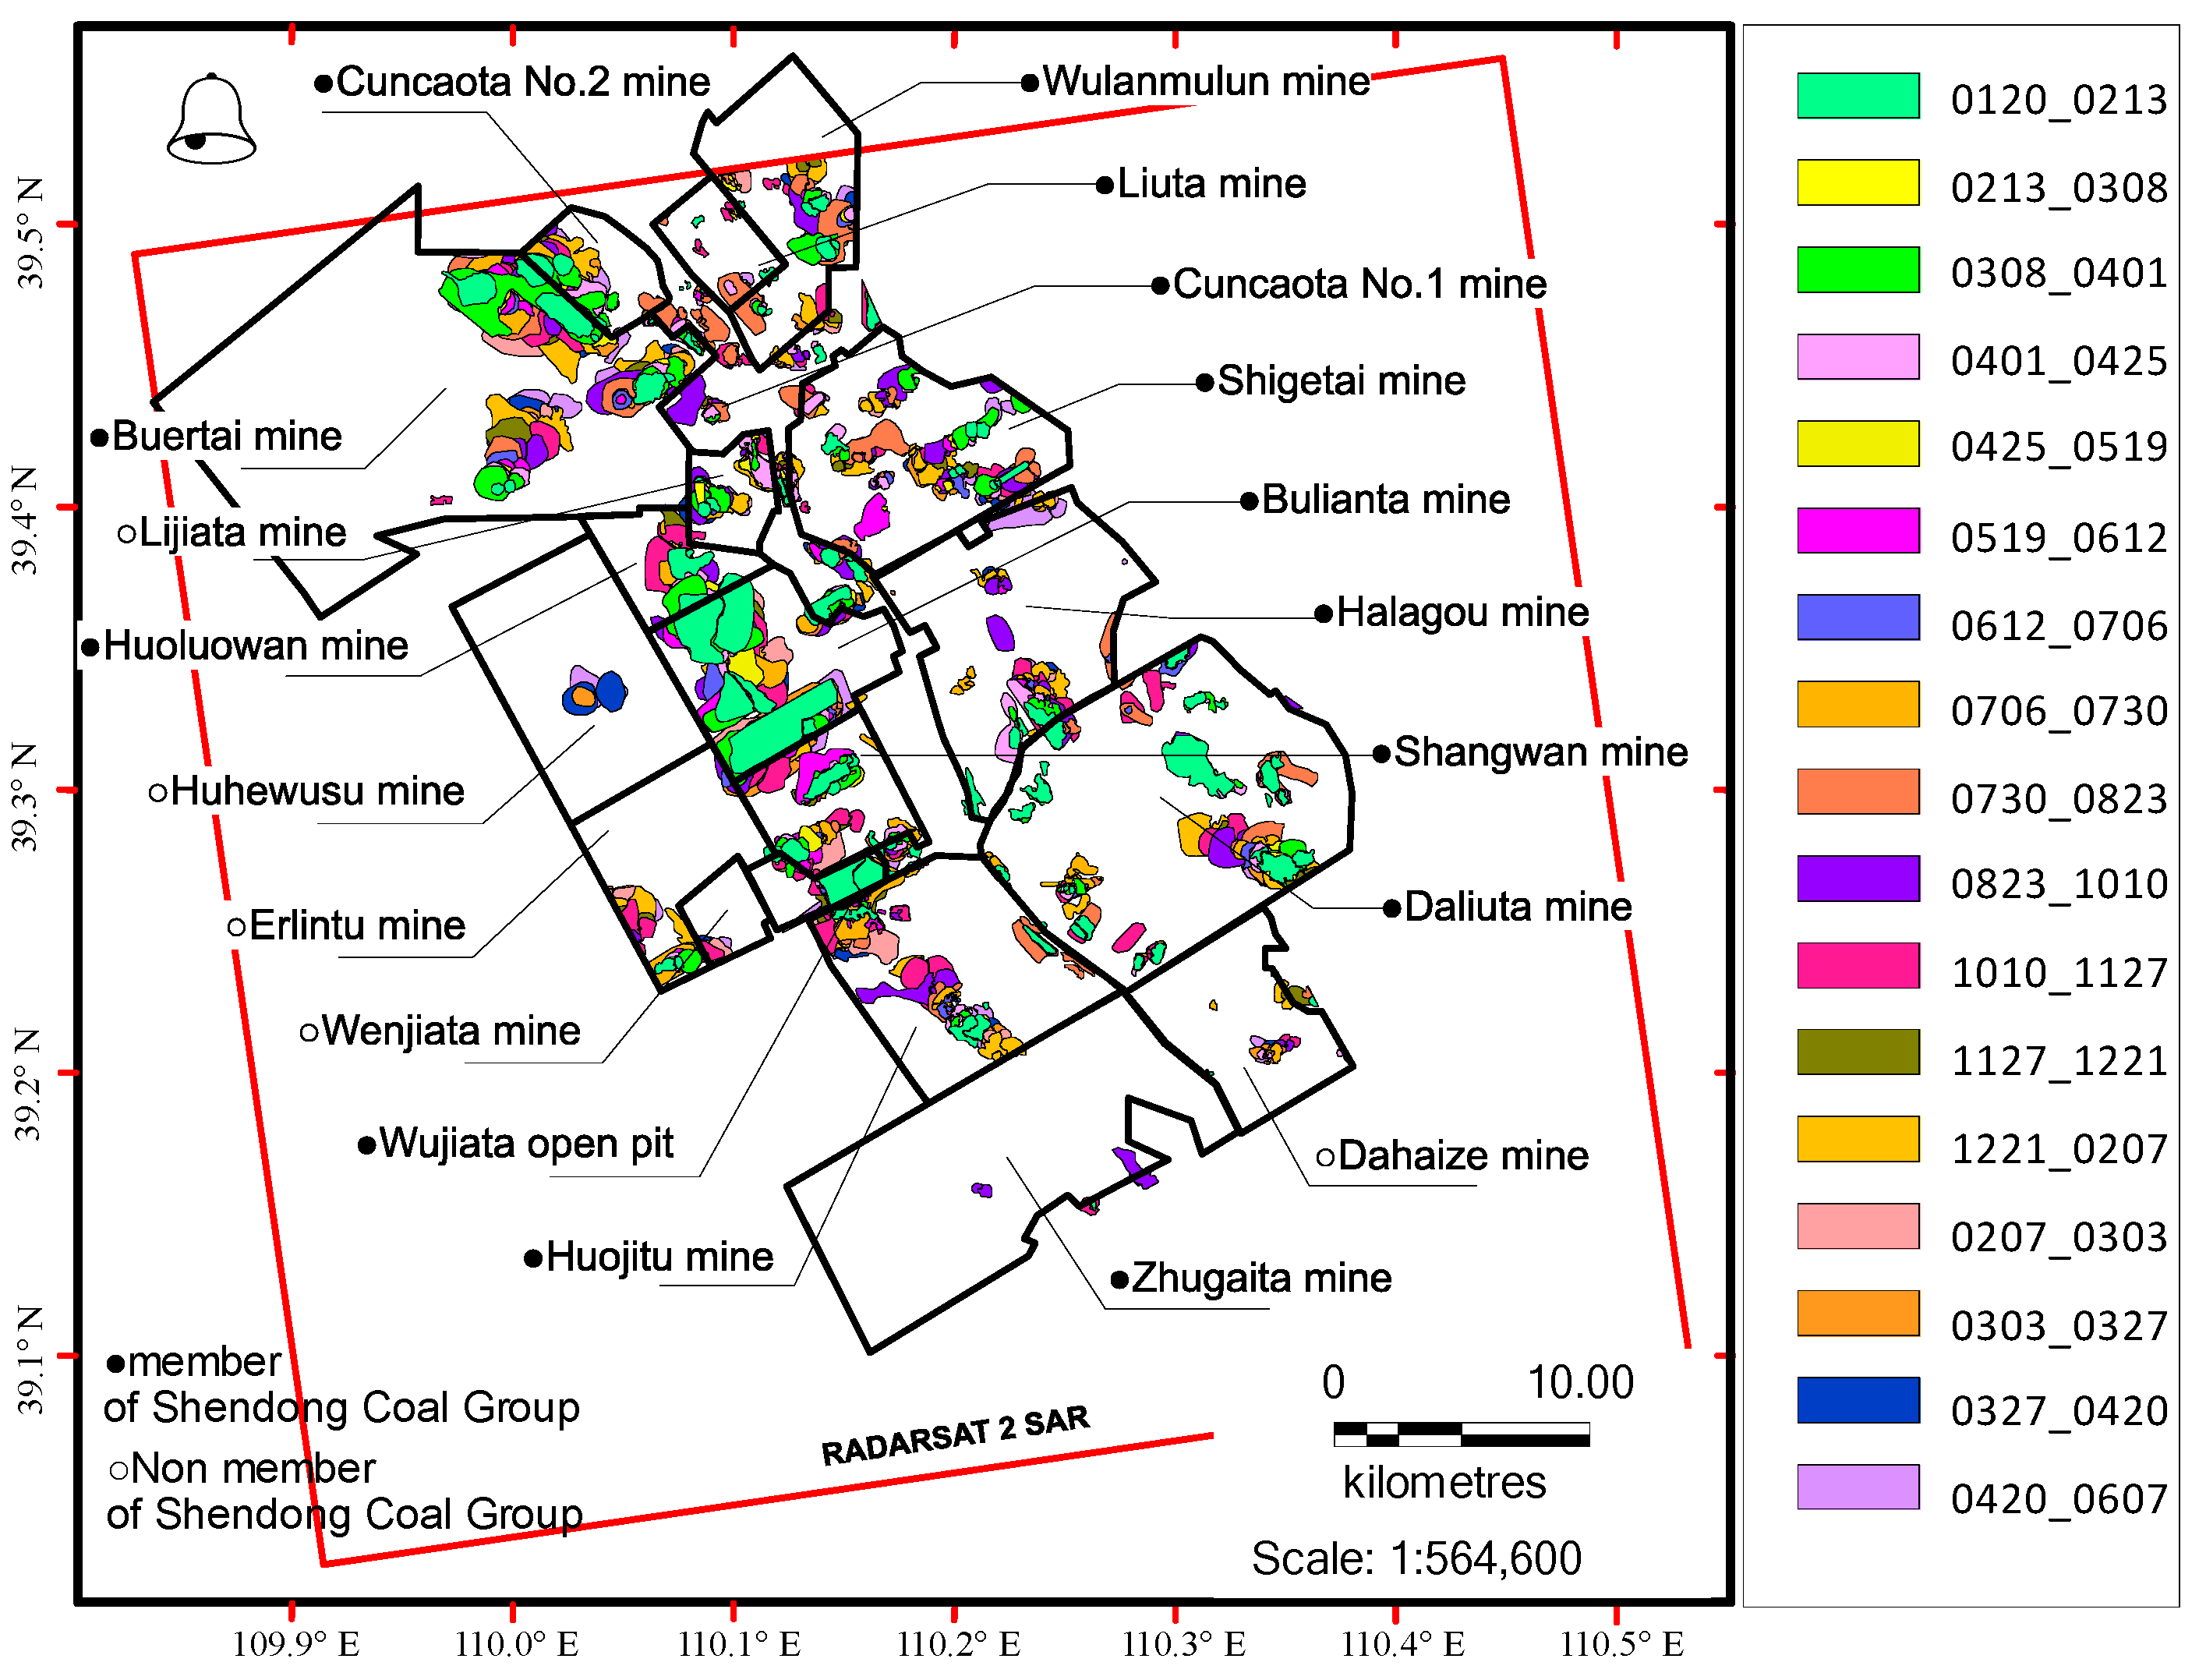
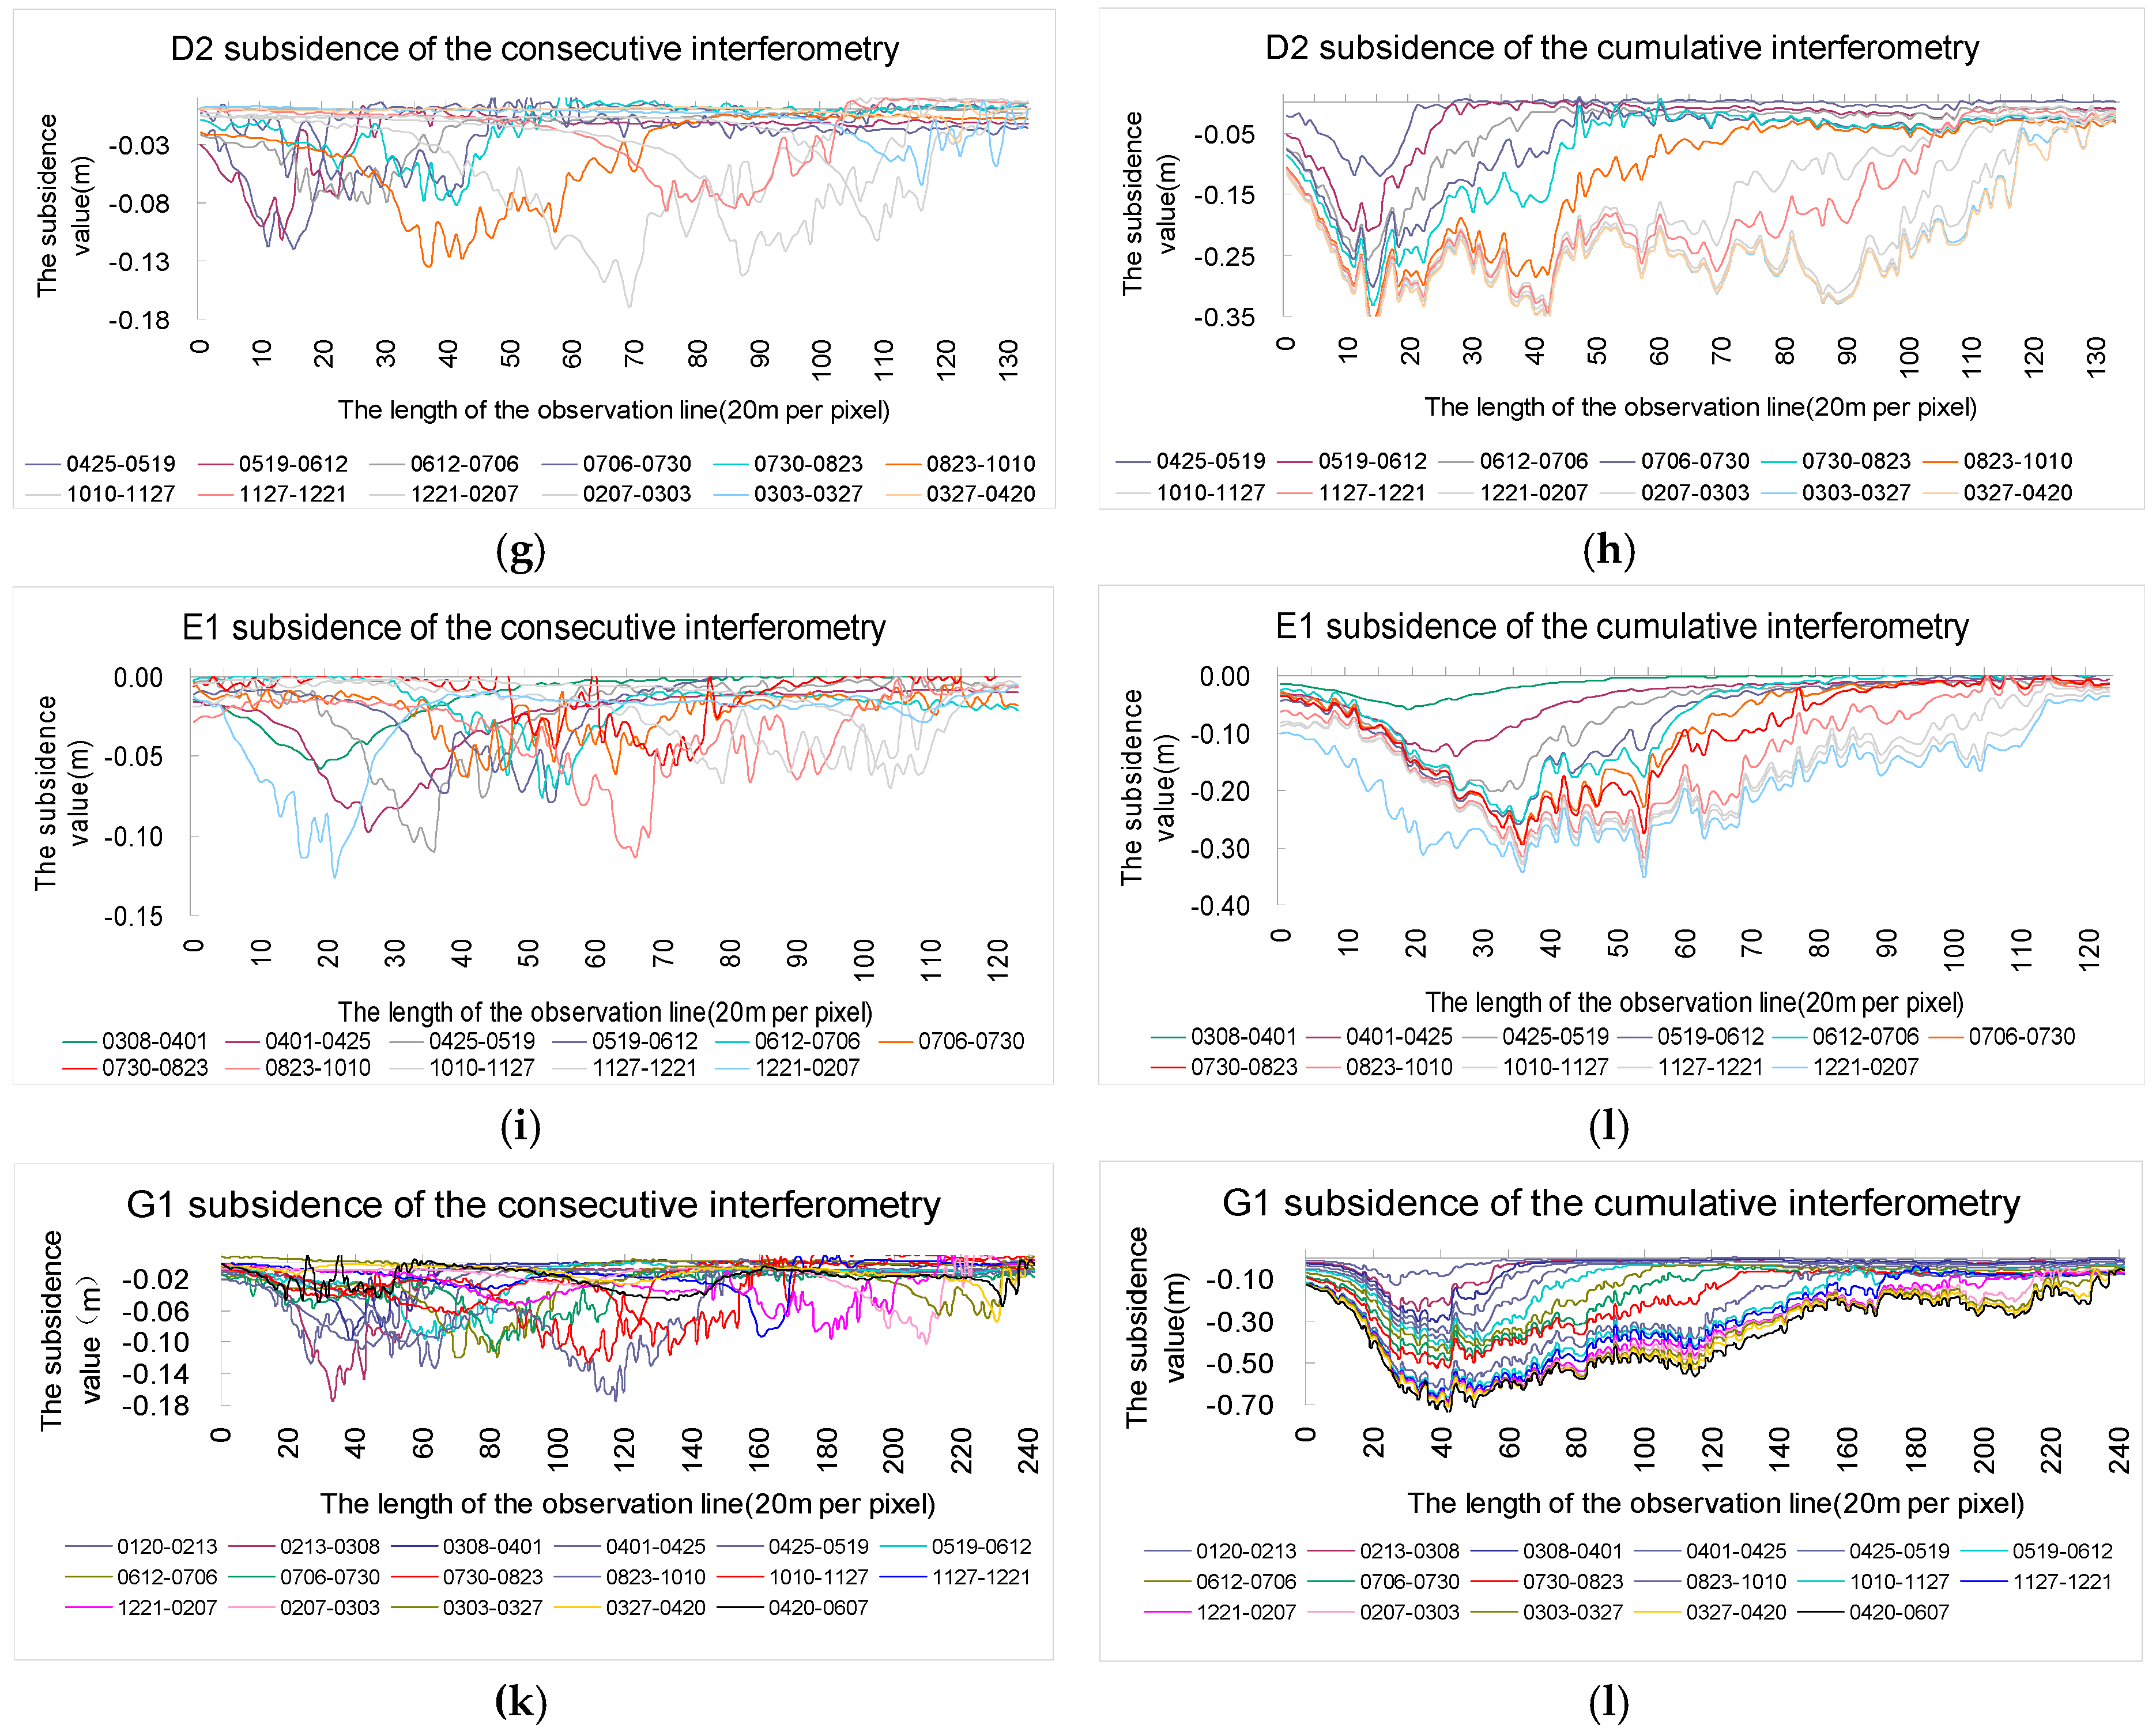
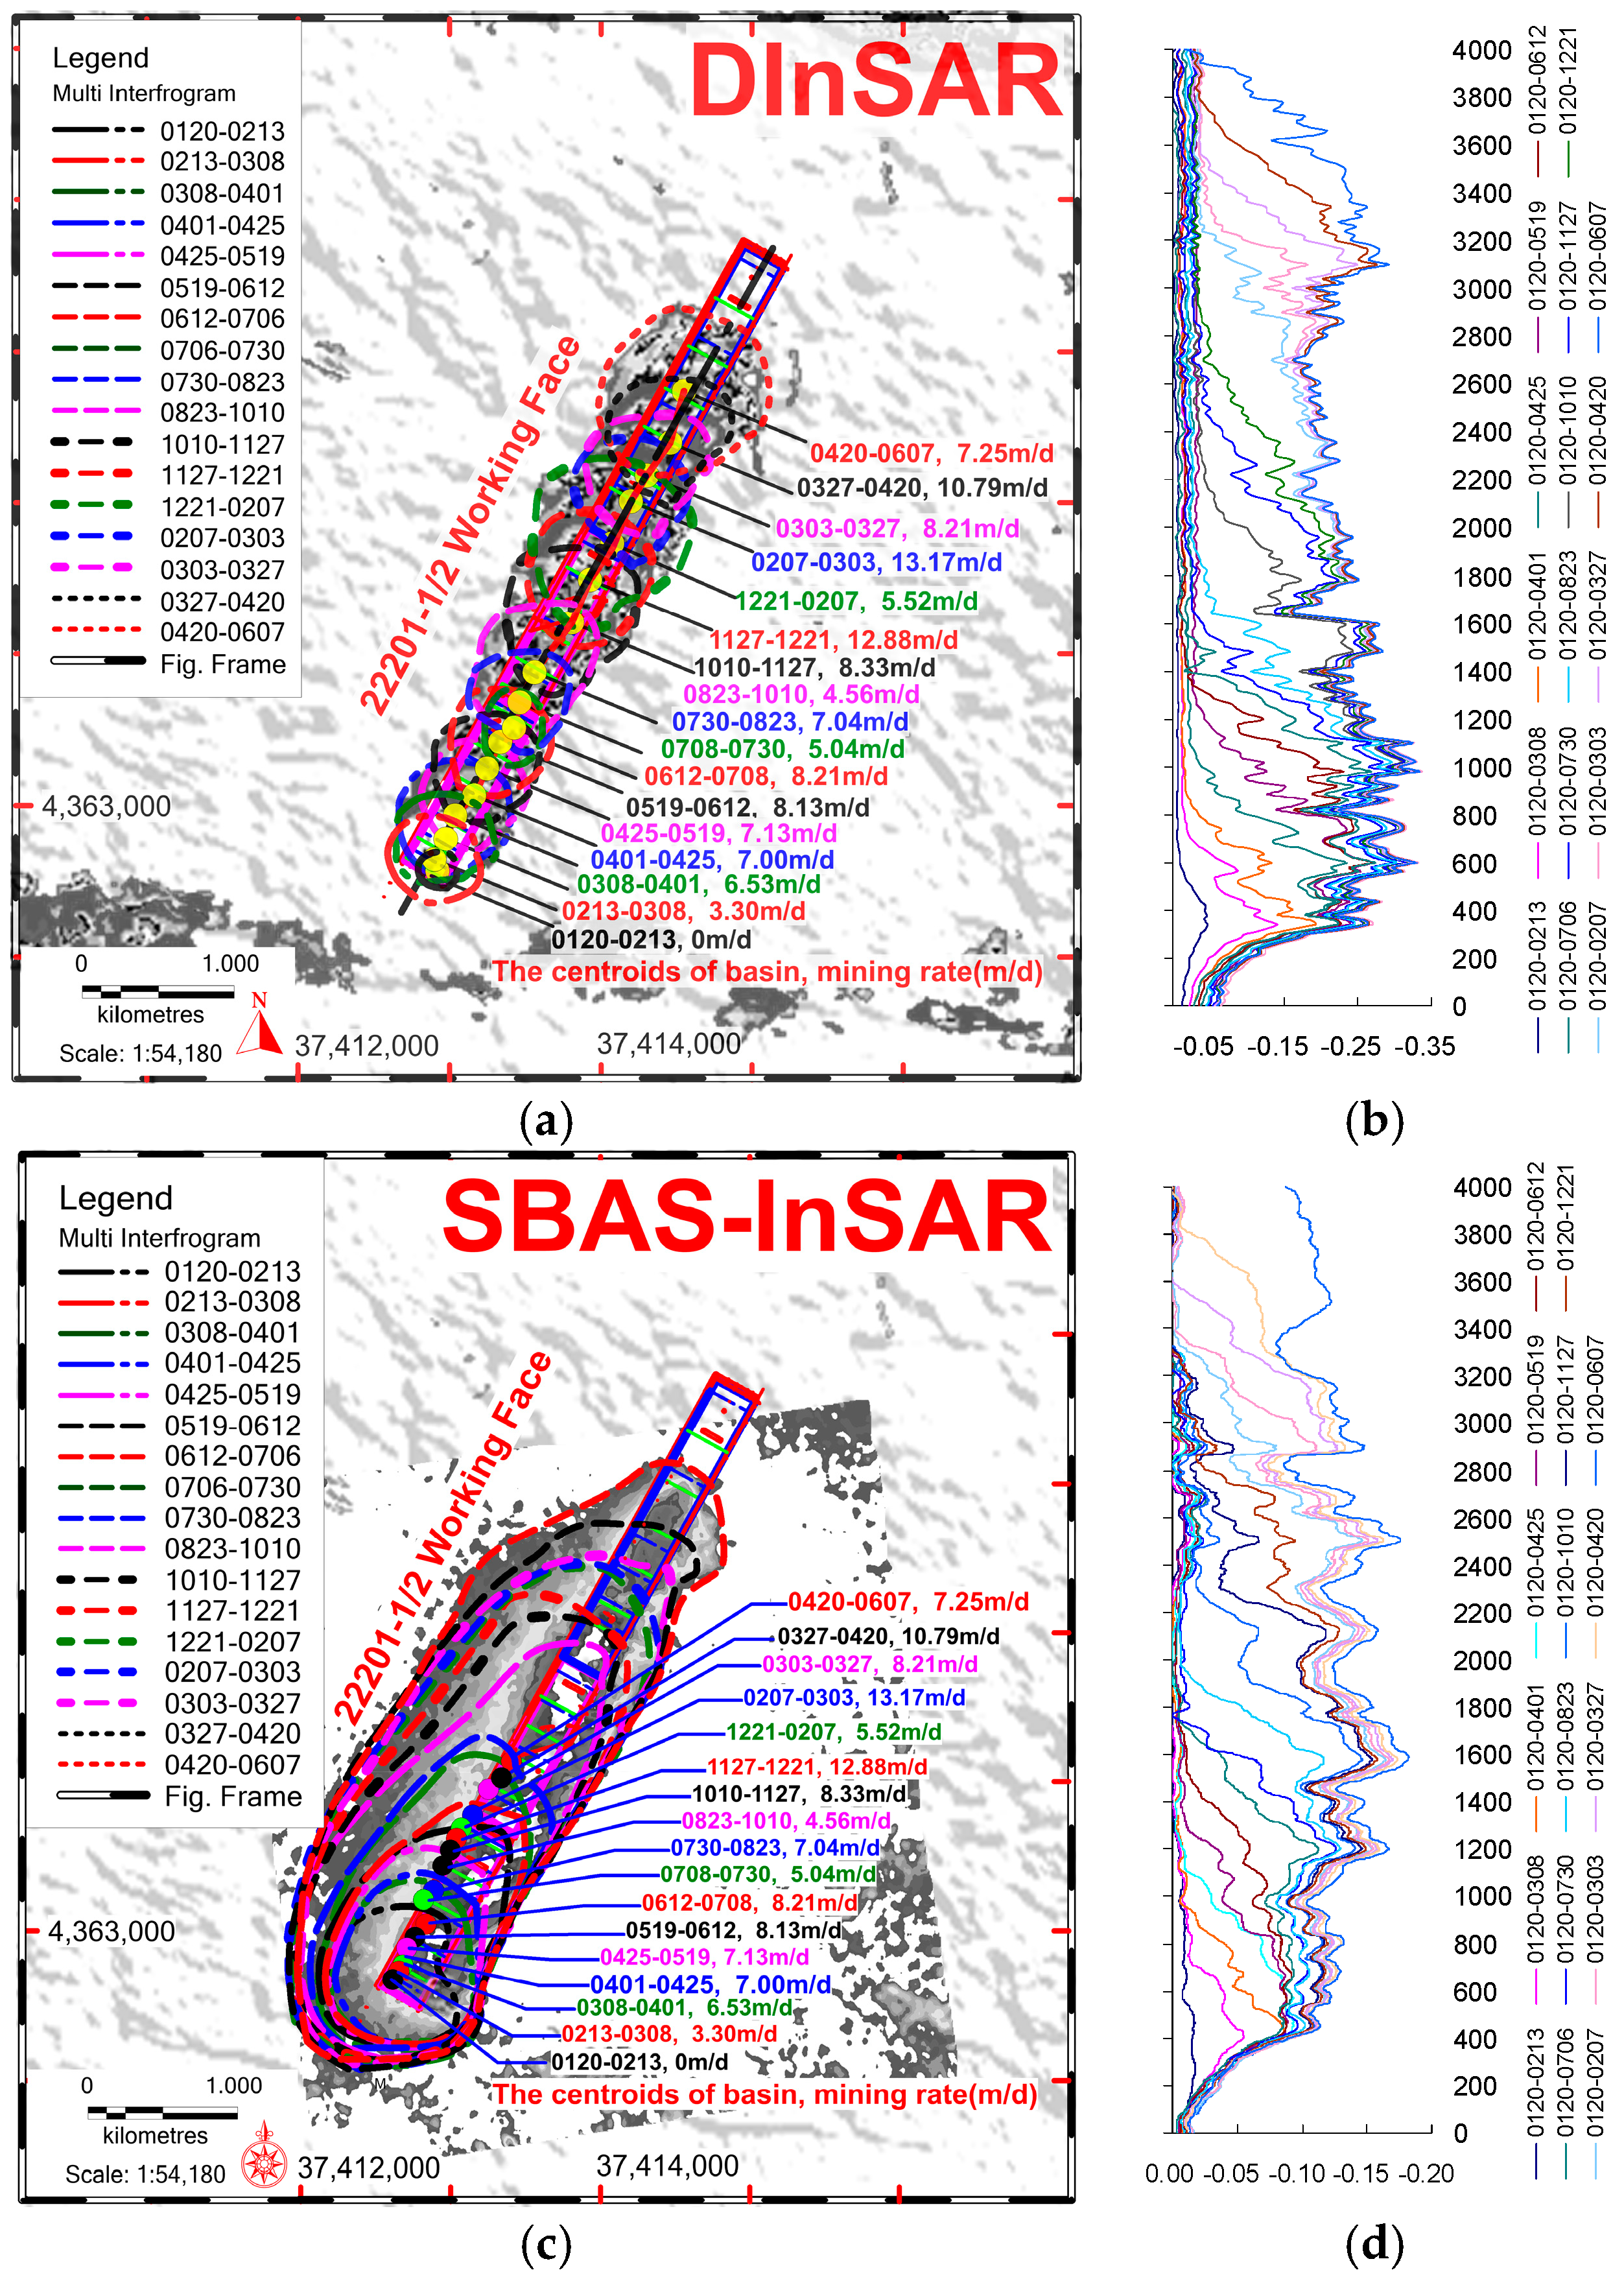
4.2.1. Interpretation based on the consecutive DInSAR interferometry

The results of the 17-temporal the consecutive DInSAR interferometry were interpreted using the subsidence value of −10 mm recommended by a literature as the outer boundary of mining subsidence [44]. Polygons with low speckle in the interpreted subsidence were further screened. Some polygons, which did not change during three revisit periods (According [44], the zone, where mining subsidence is less than −50 mm during 3 months, is considered to be the residual deformation zone.), will be removed, thereby obtaining the time-series subsidence map of the consecutive DInSAR interferometry (Figure 12).
The interpretation results indicated that Huhewusu Mine, Erlintu Mine, Zhugaita Mine, and Dahaize Mine in Shendong Coalfield had been hardly any exploited, whereas the remaining mines produced an average of 45 ± 3 dynamic subsidence regions during each observation period from 20 January 2012 to 7 June 2013. The average mining extent during each observation period reached as high as 57.00 ± 0.24 km2, which indicated the active production activities in the coalfield. Approximately 45 mining areas were exploited simultaneously, which caused serious mining subsidence. Interpretation was a difficult task accomplished through team cooperation. The concerned subsidence quantity and area would differ to a certain extent given that the team members had varying work experiences.

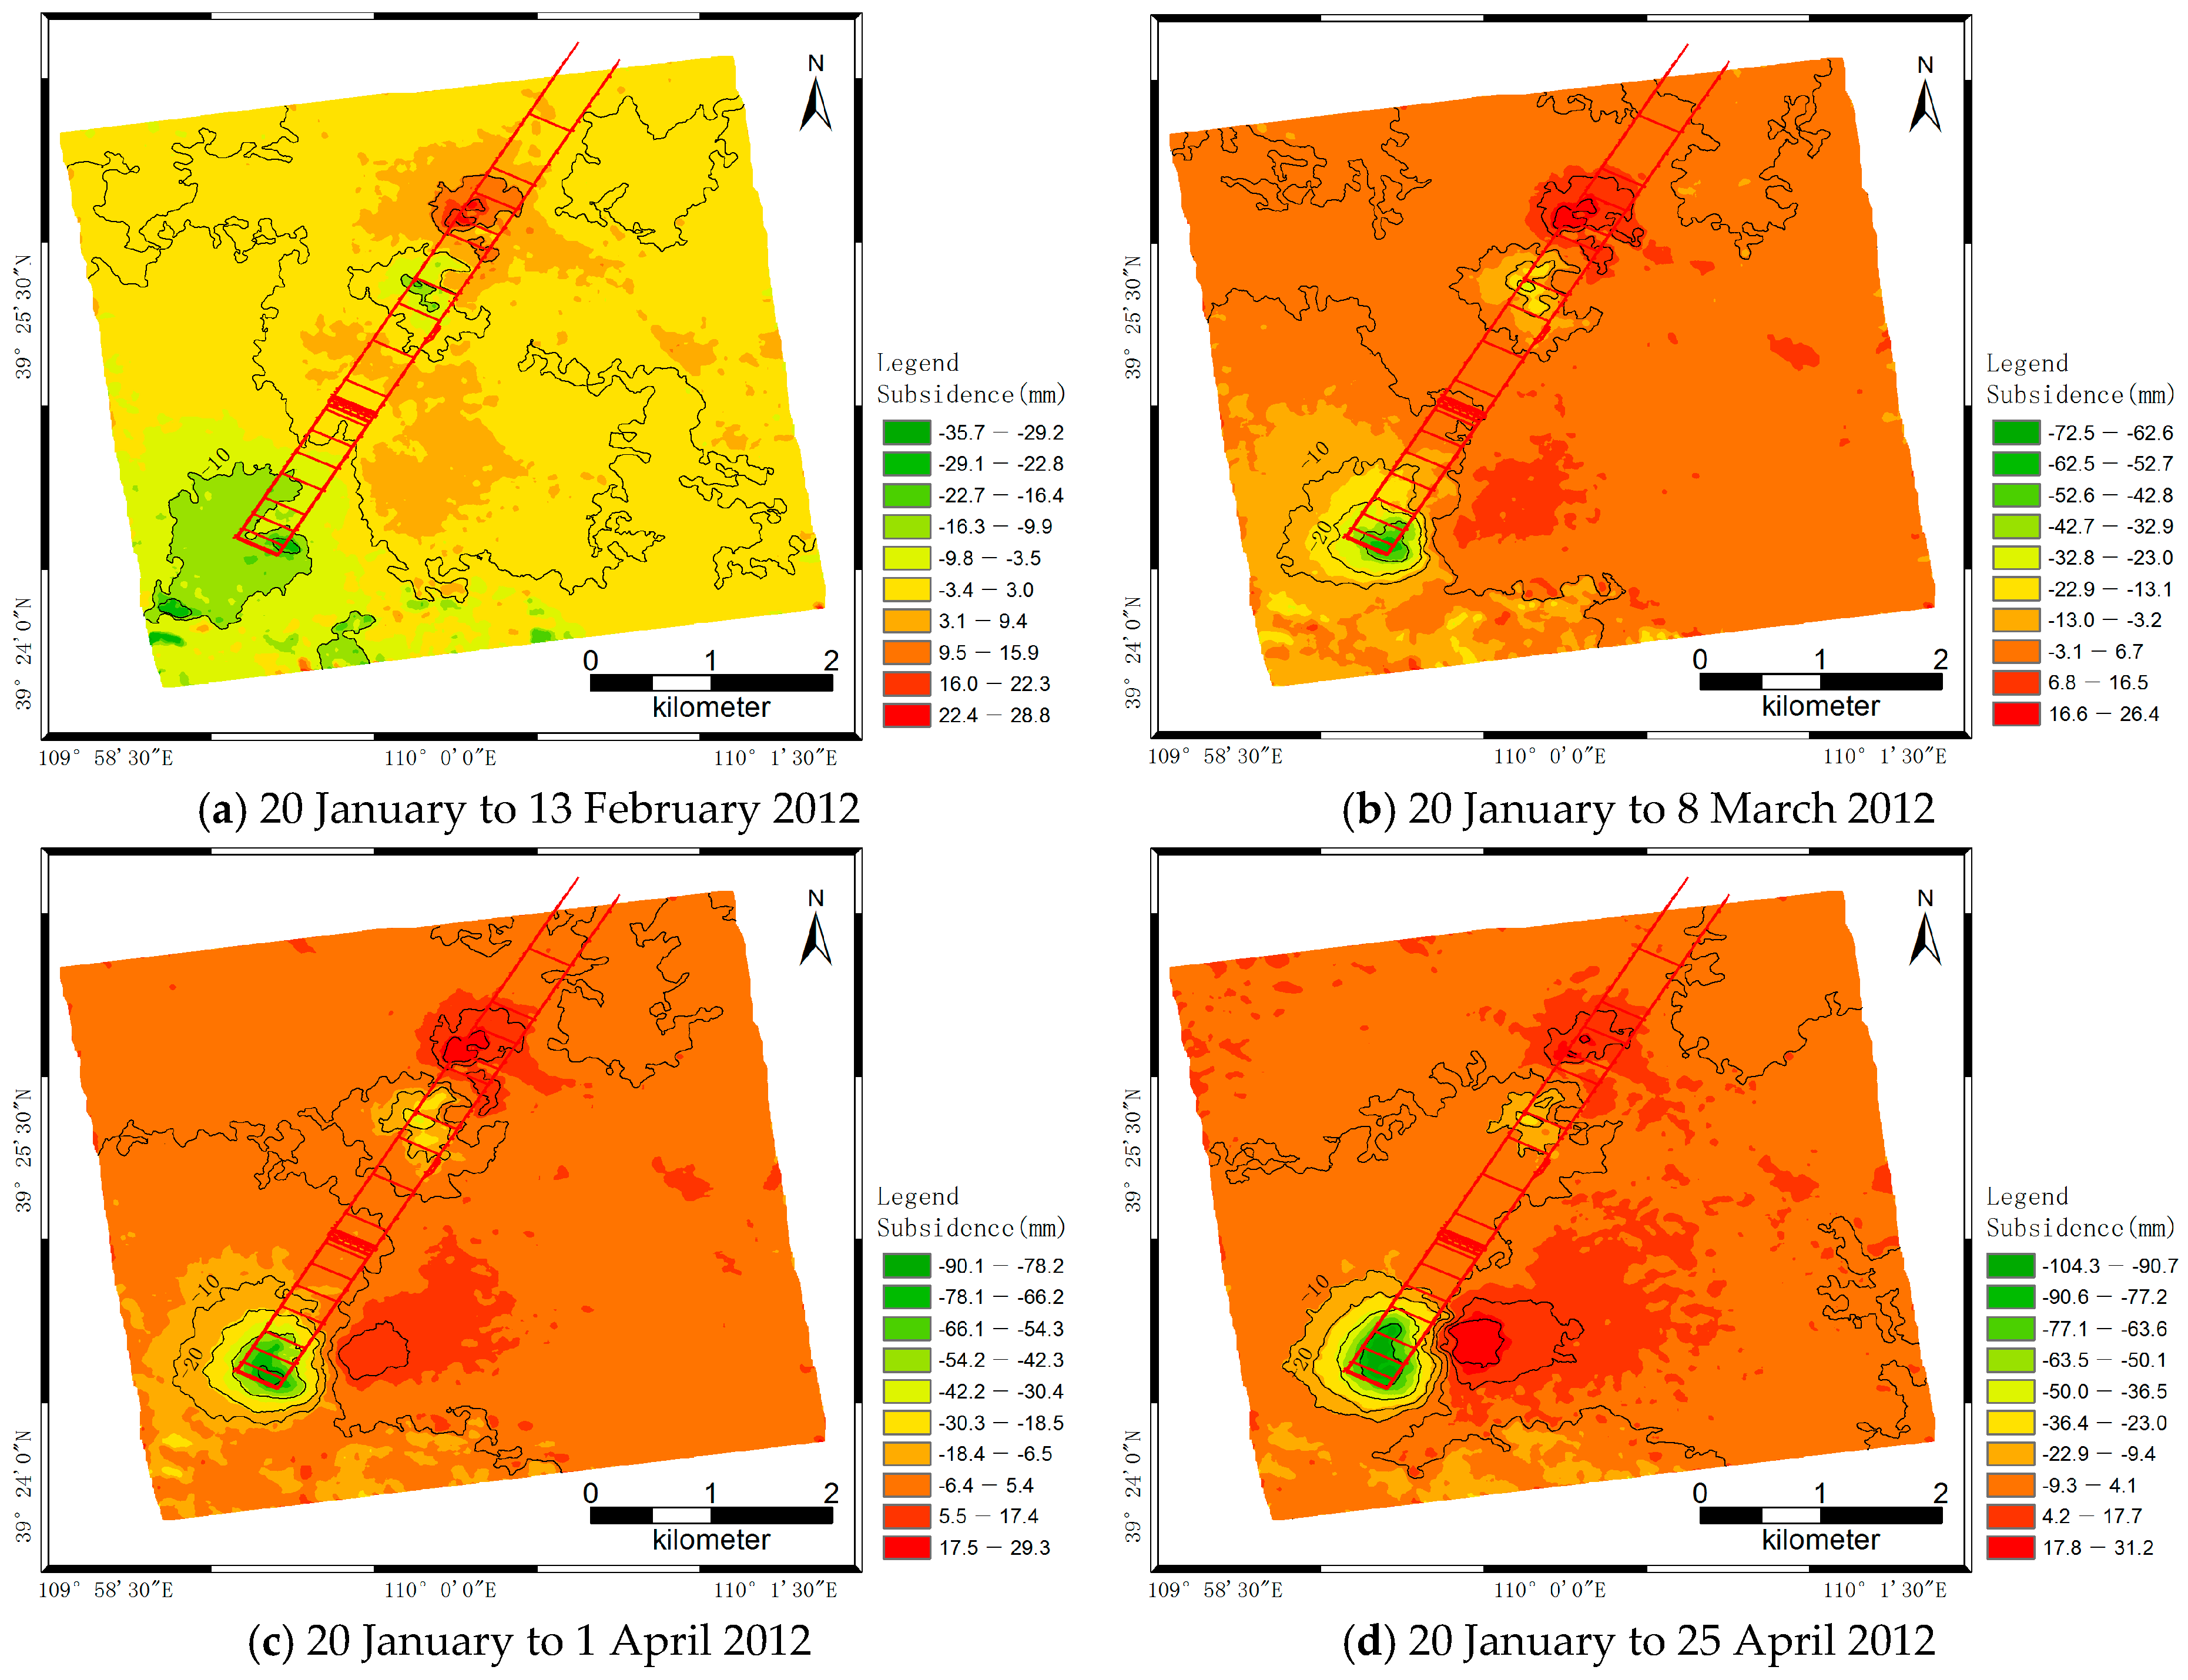
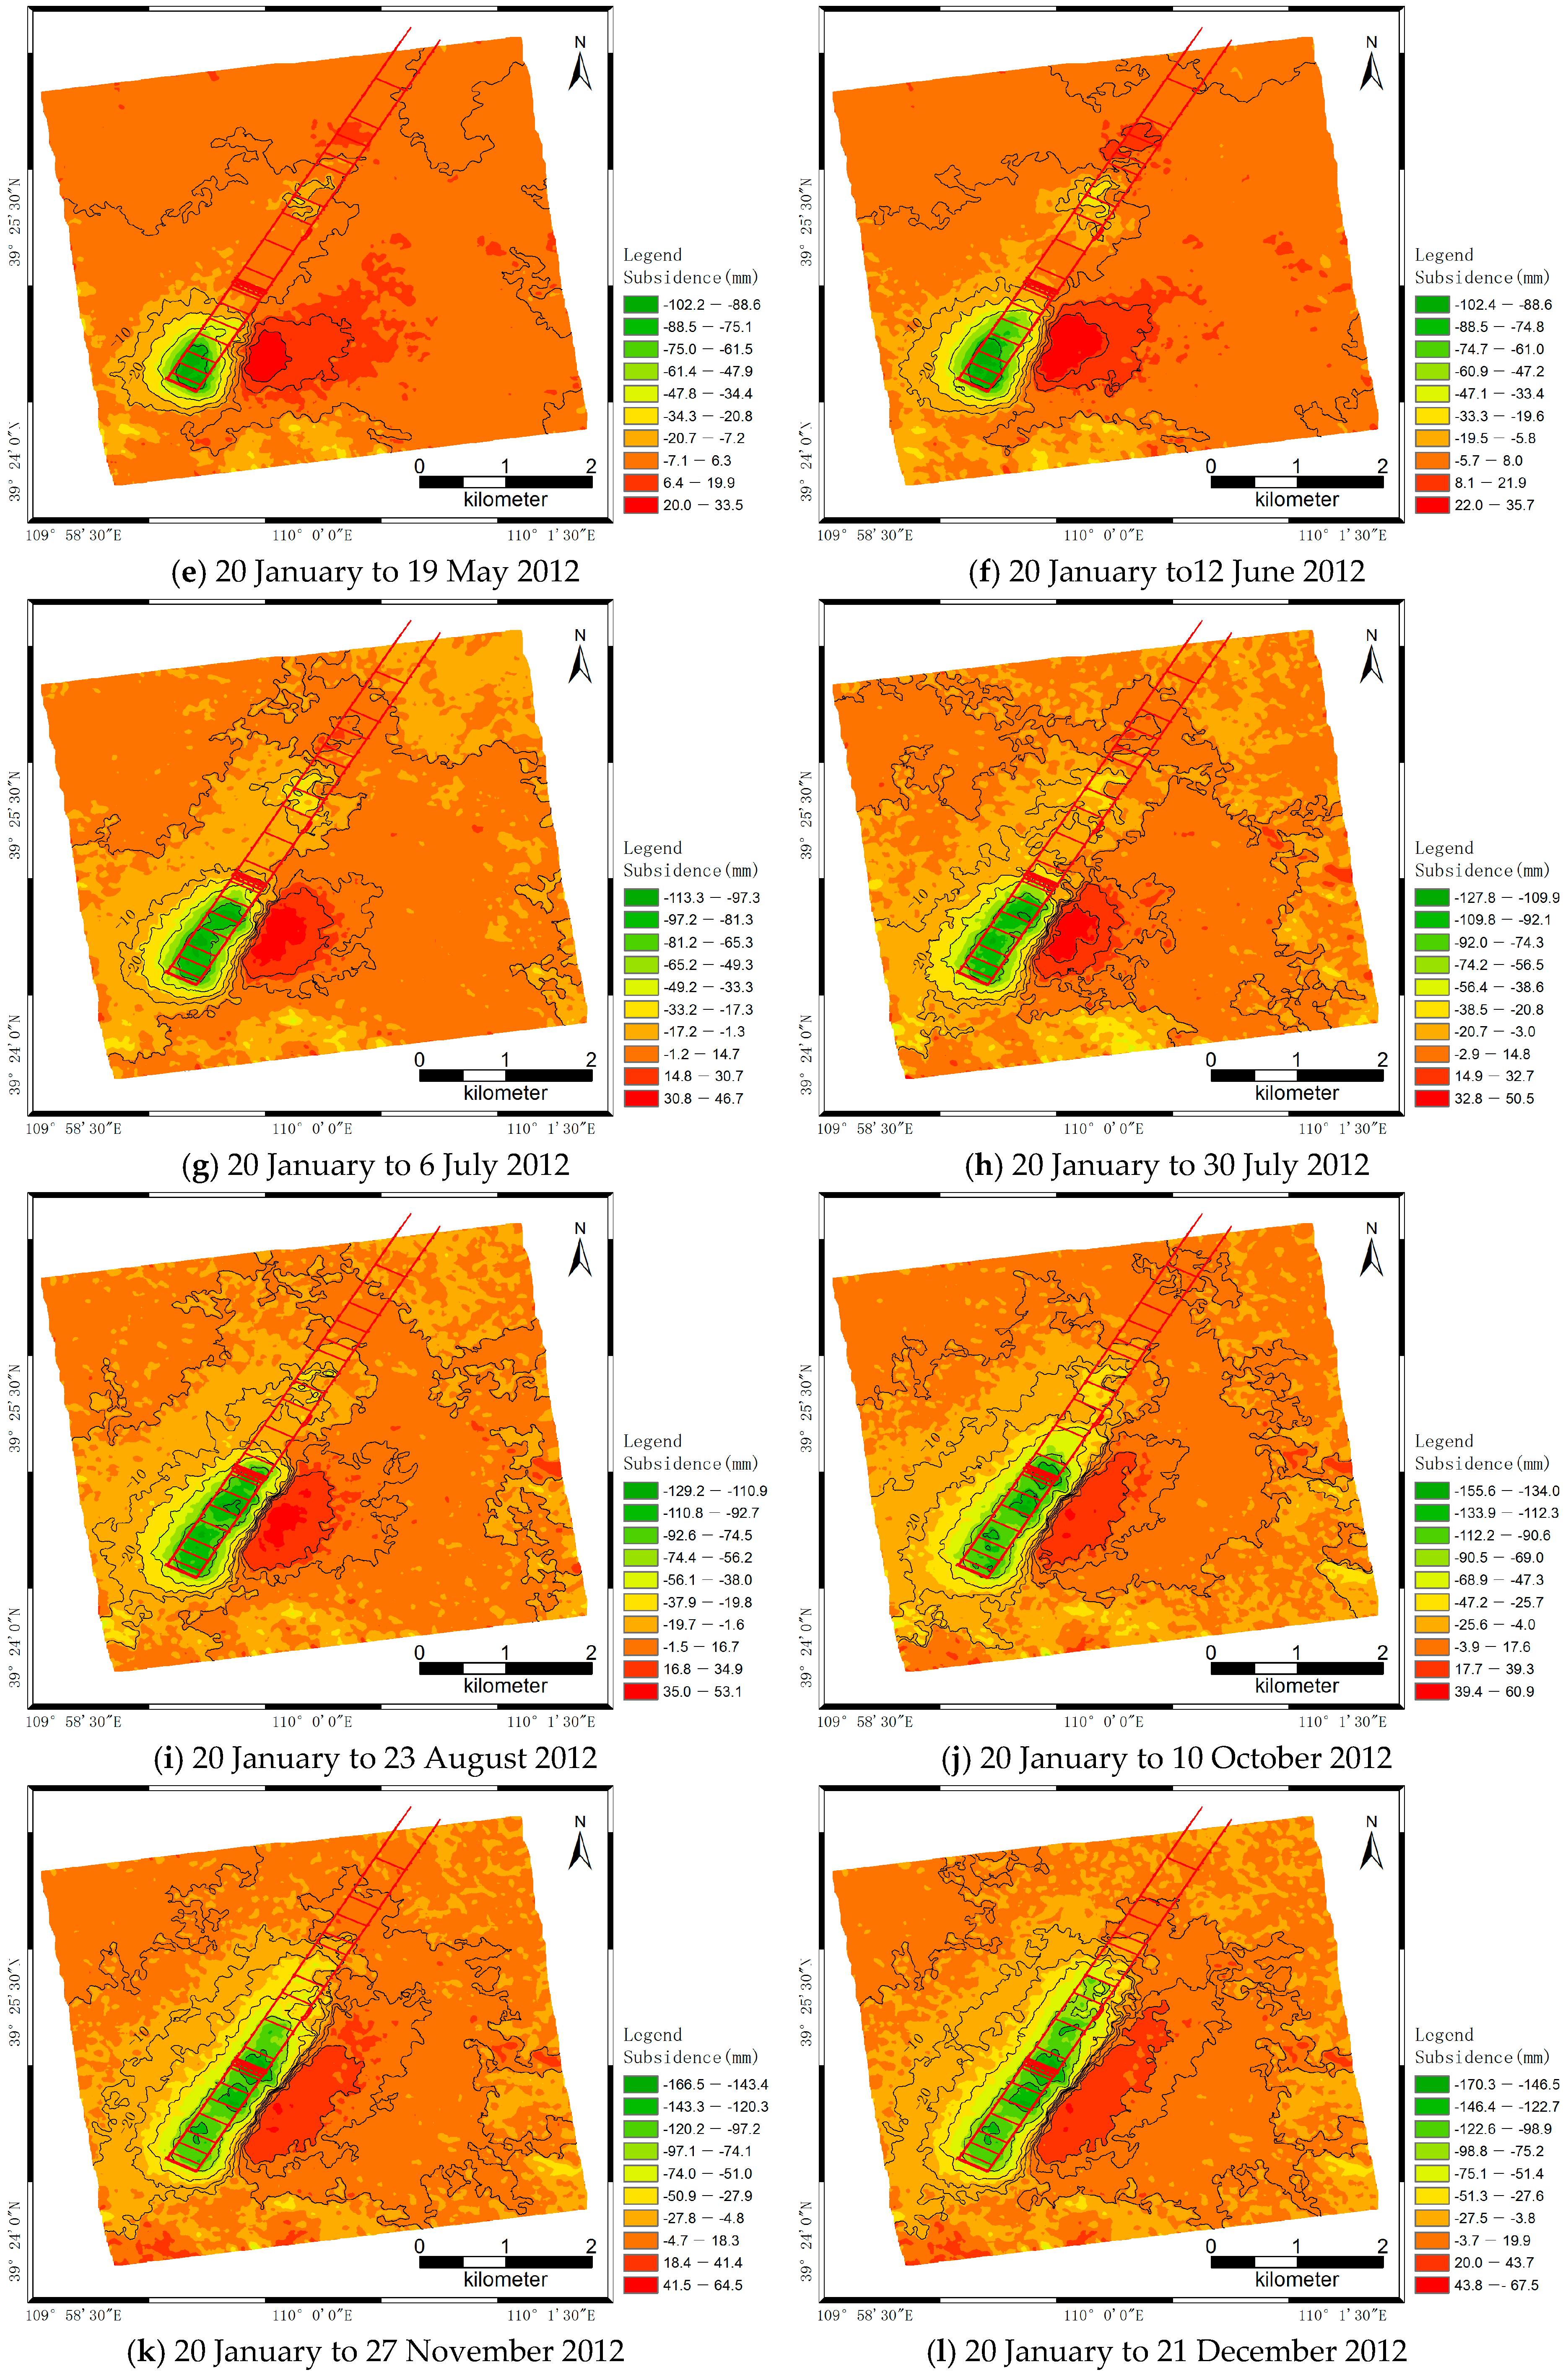
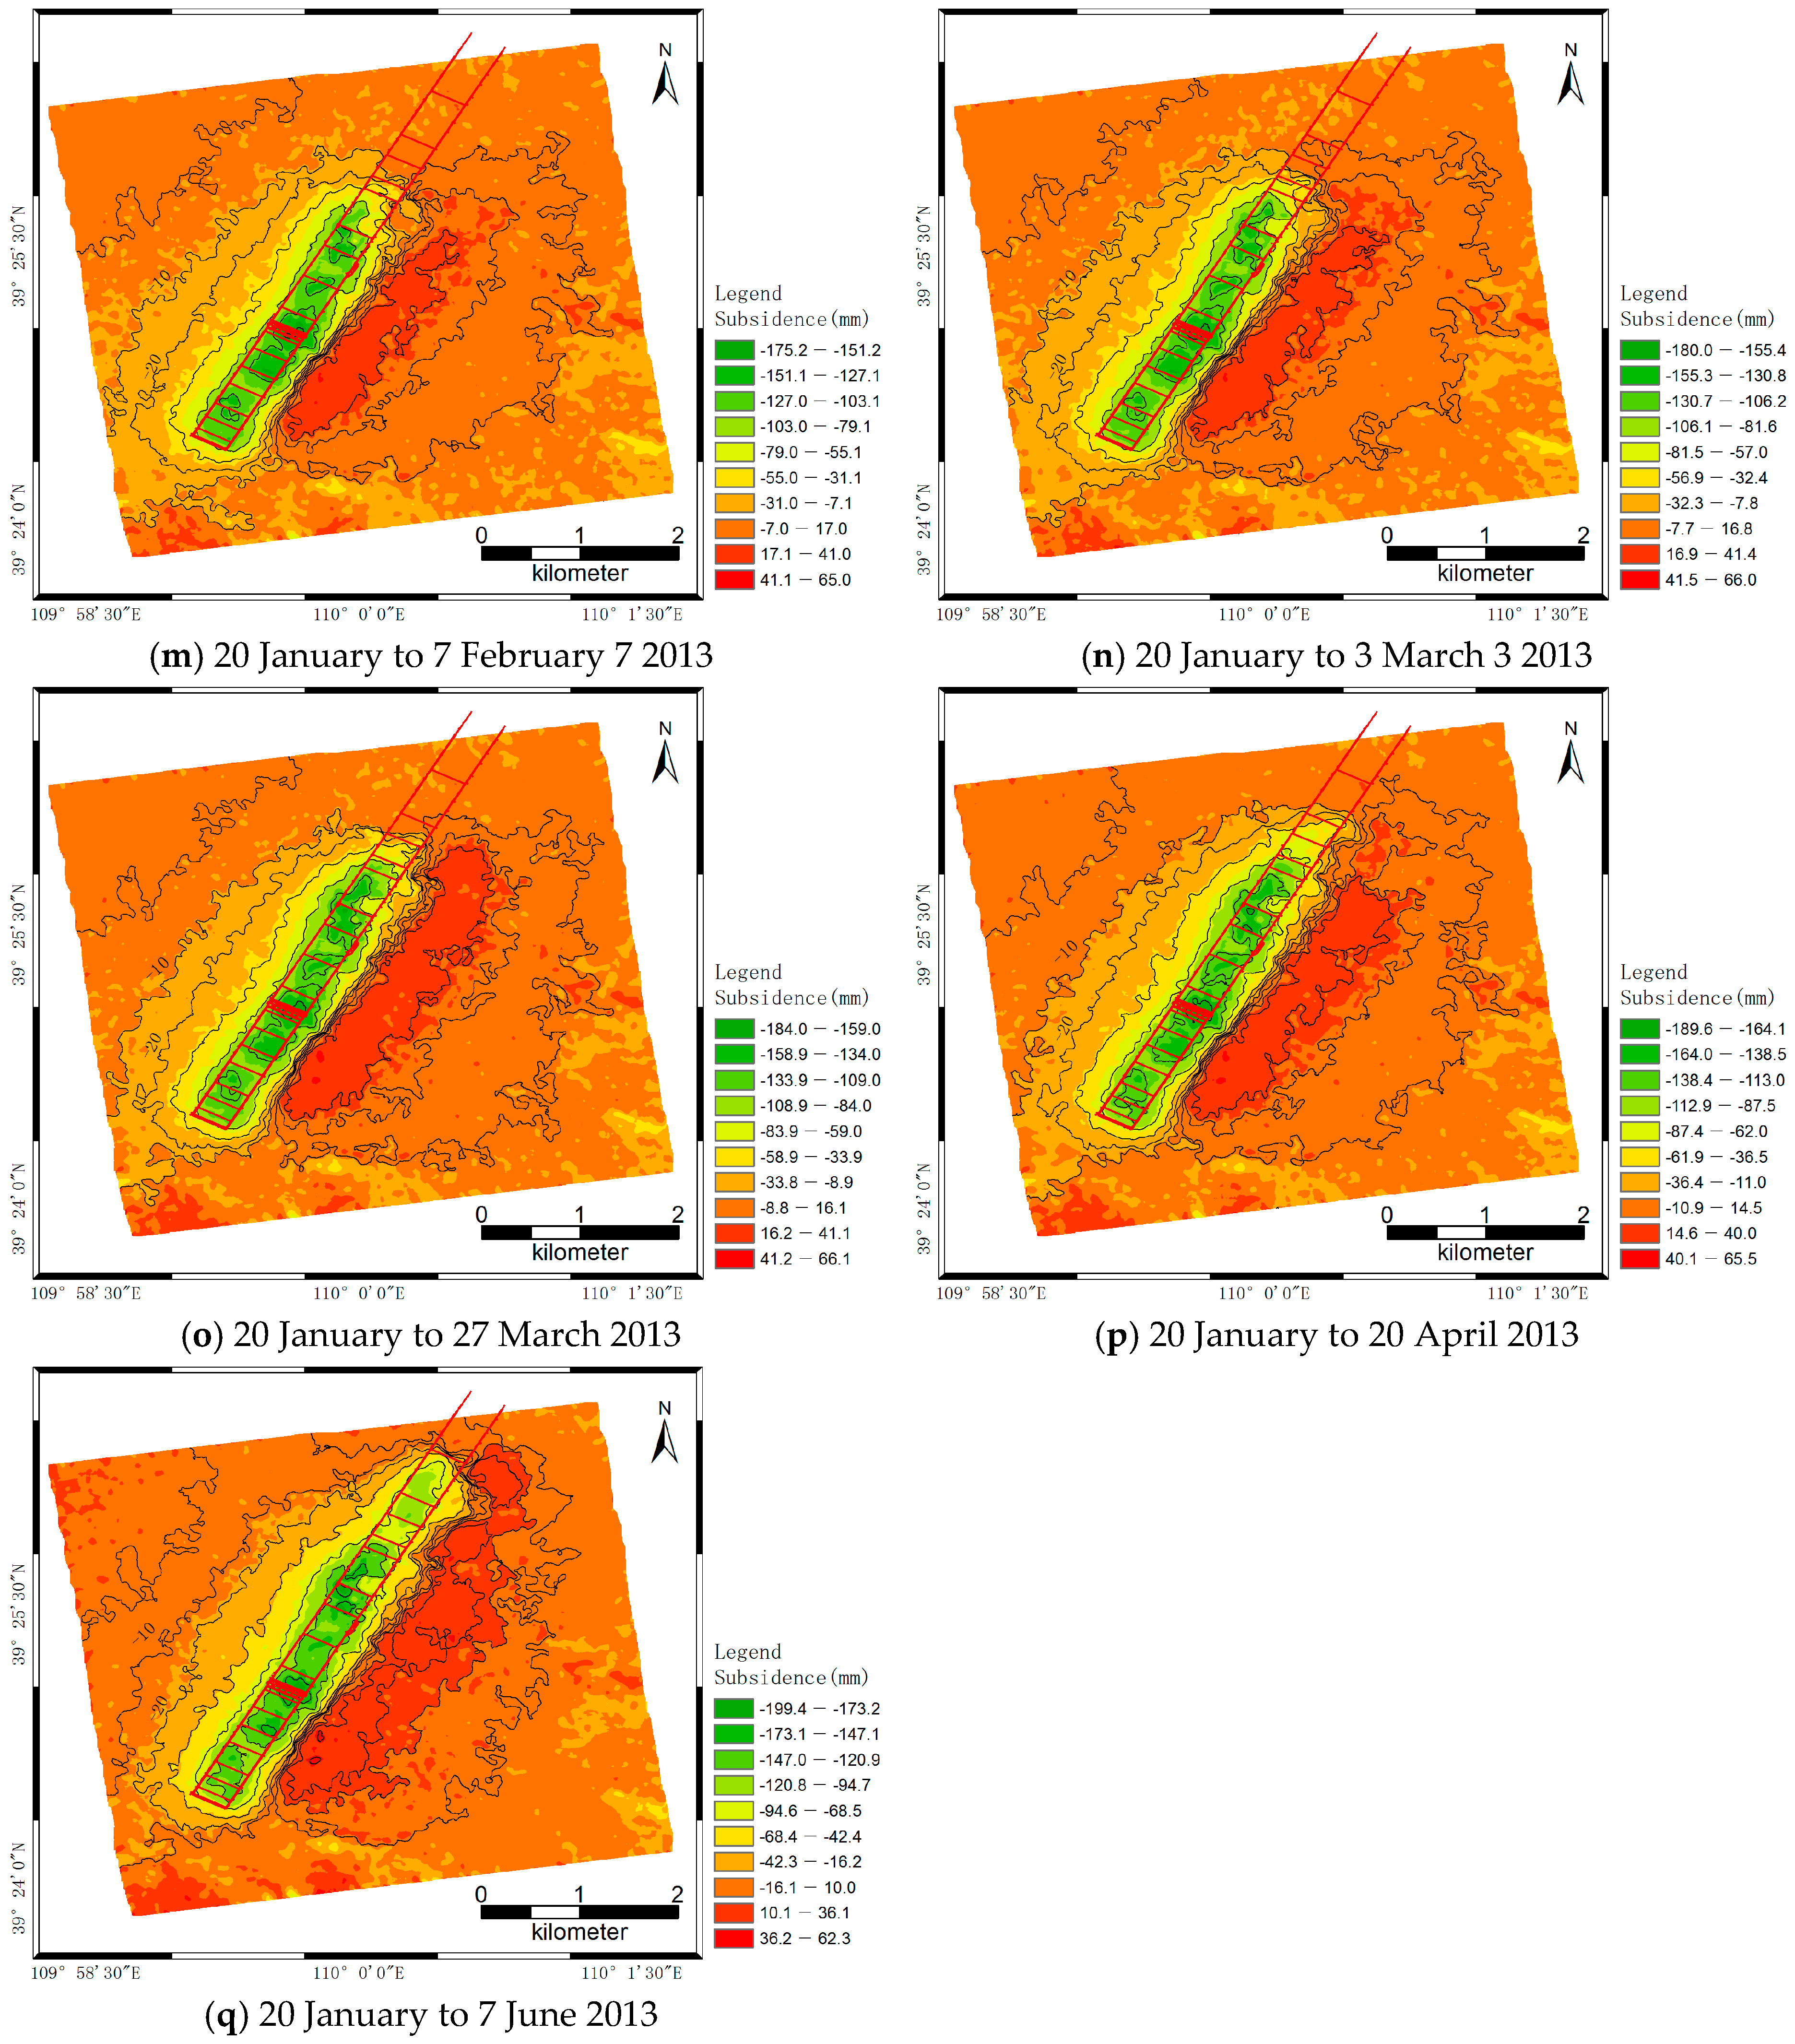
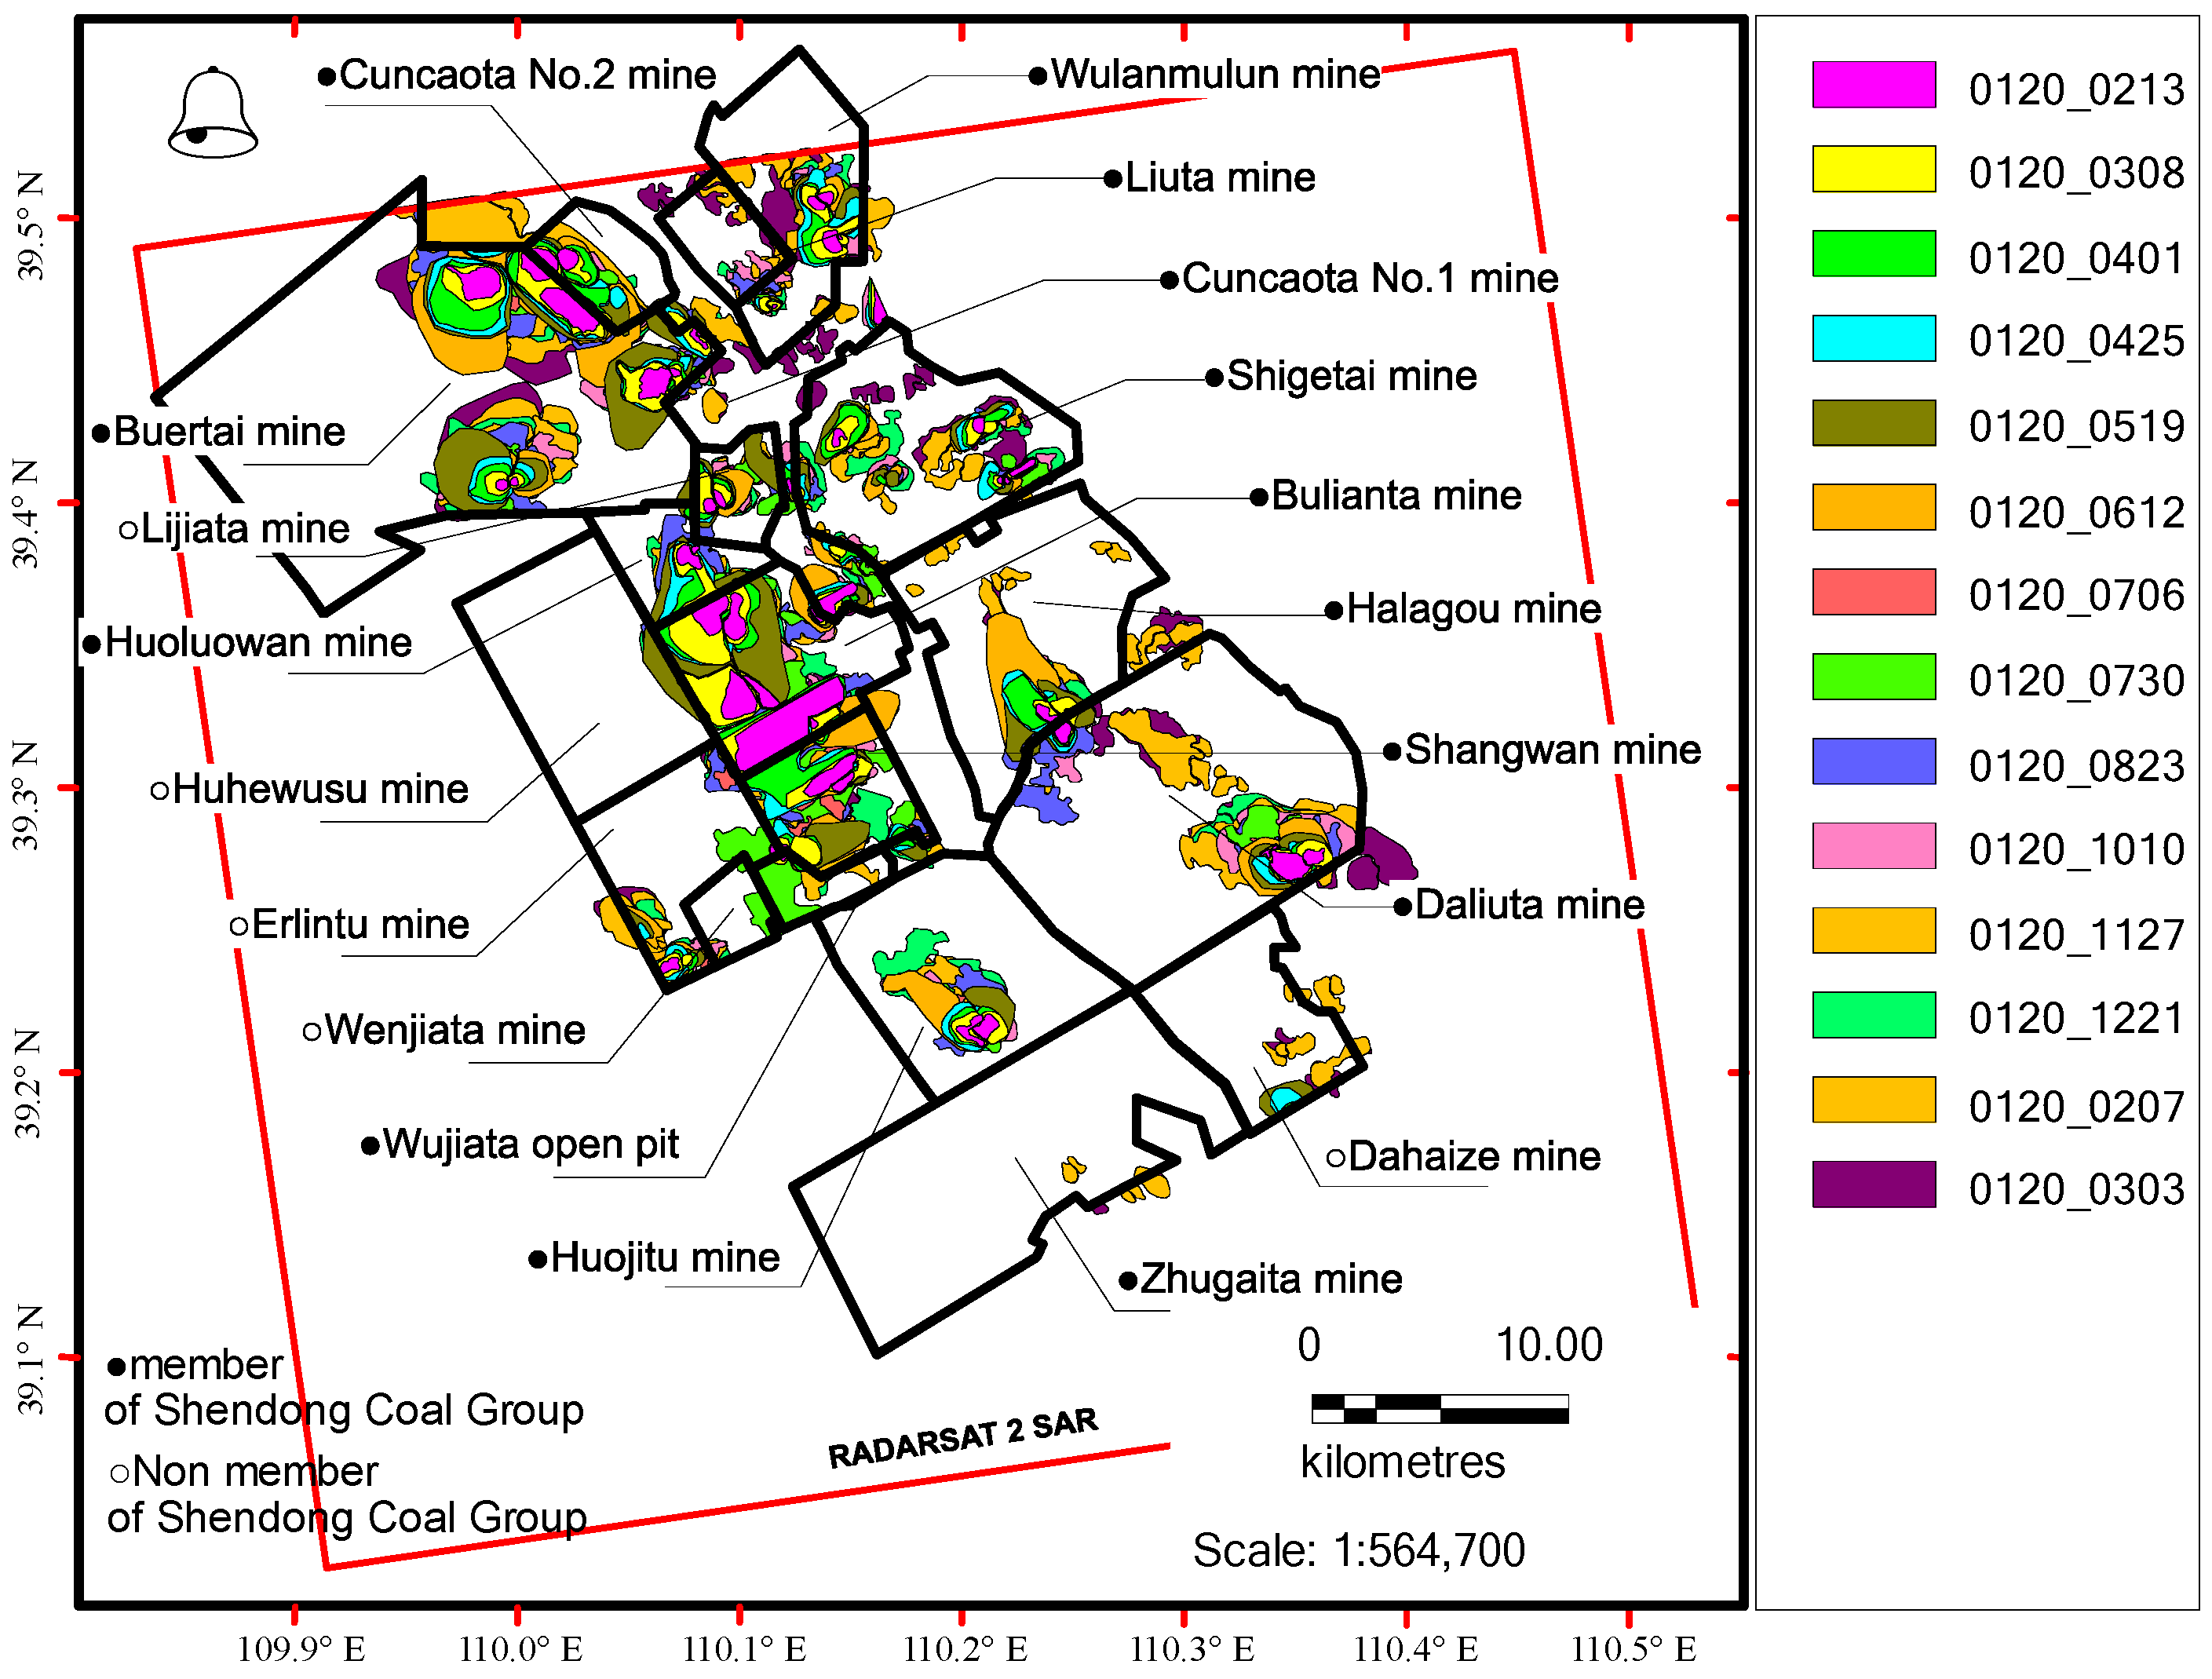
4.2.2. Interpretation Based on the cumulative DInSAR Interferometry

Similarly, the results of the 14-temporal the cumulative DInSAR interferometry were interpreted using the subsidence value of −10 mm recommended by [44] as the outer boundary of mining subsidence. The polygons with low speckle in the interpreted subsidence were further screened, and those that did not change successively will be removed. Finally, the time-series subsidence map was obtained (Figure 13).
Interpretation became more difficult given the influence of temporal decorrelation, and the interpretable degree was lower than that of the consecutive DInSAR interferometry. Evidently, the characteristic of the time series of the cumulative DInSAR interferometry was that polygons with low speckle in the subsidence range expanded to a fixed direction. An average of 46 ± 5 subsidence areas expanded stably during each study period from 20 January, 2012 to 21 December 2012. The subsidence area increased from an initial value of 54.98 km2/24 day to 225.20 km2/504 day throughout the observation period (20 January 2012 to June 2013), which indicated an average rate of 13.09 km2.
In general, it is still difficult to obtain a continuous series of subsidence areas. On the one hand, mine production regarded mine as a unit, which was not uniform. Several subsidence areas were caused by ground deformation associated with post-mining activities, others resulted from the preparation of alternate long walls, whereas some areas were produced by trial mining. On the other hand, mining developments in different mines varied because of the different geological conditions of the mines. Moreover, surface construction might also cause misjudgment of interpretations.

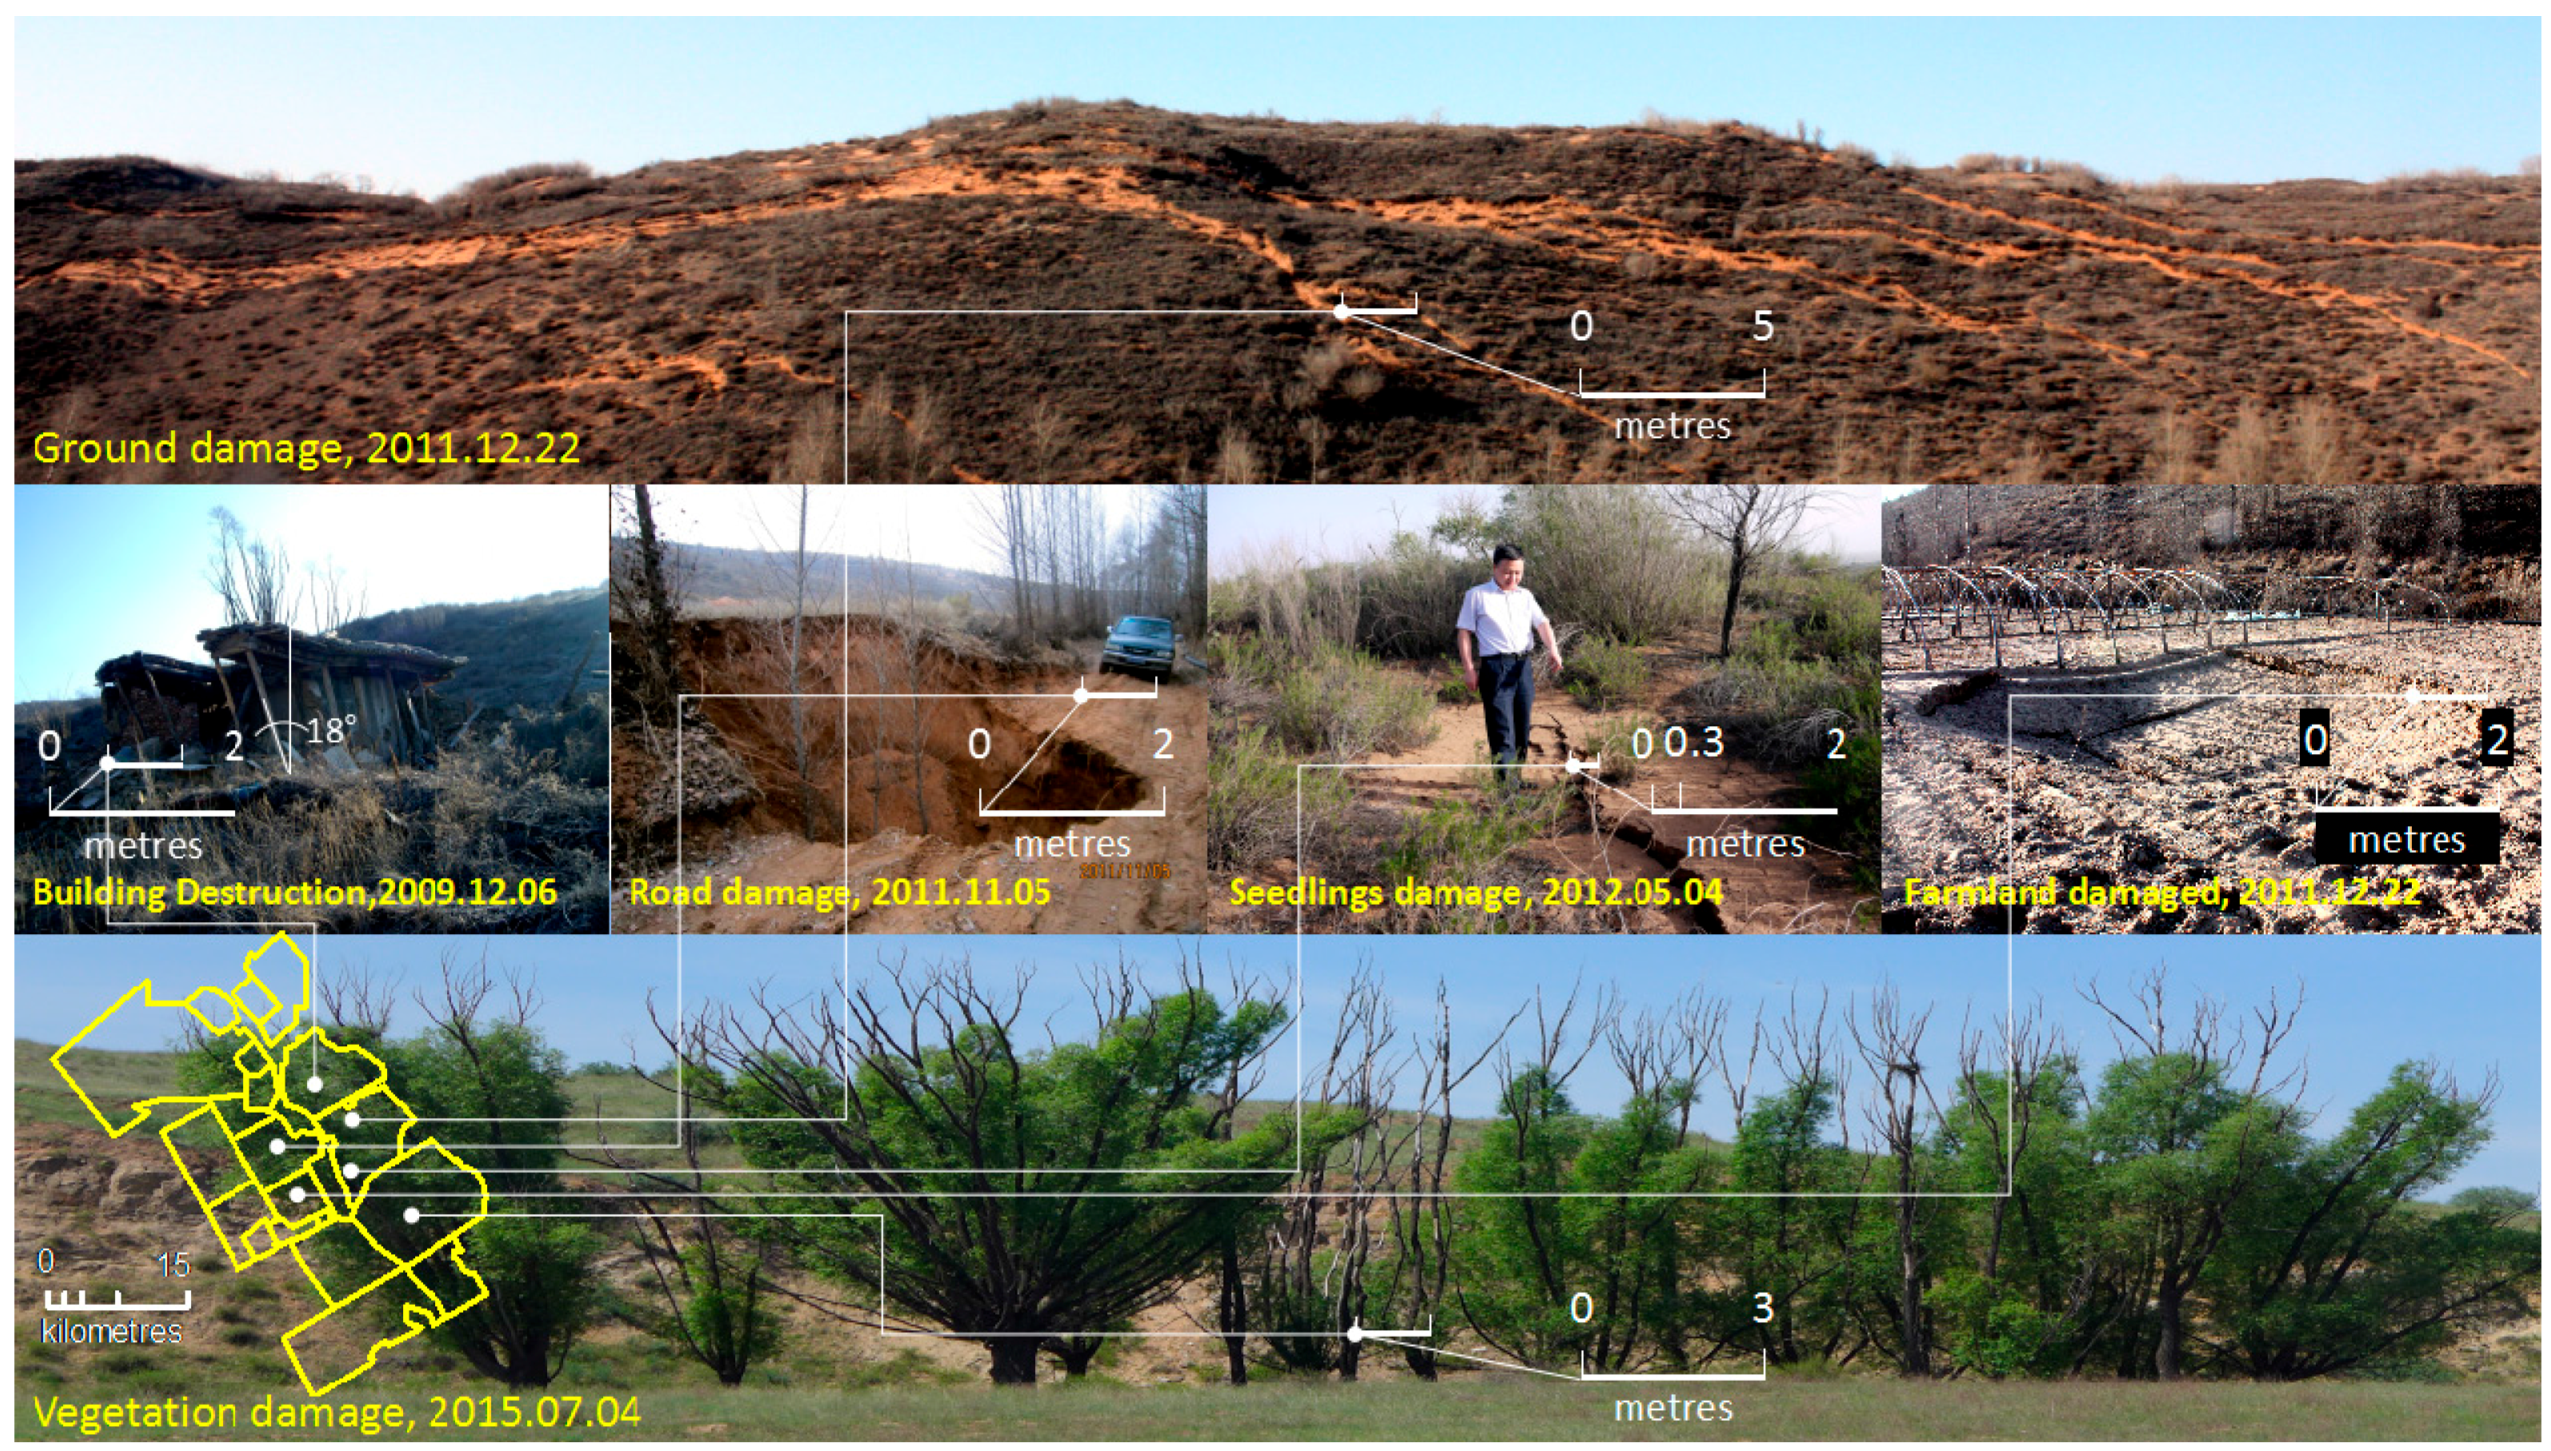
4.3. Mining Subsidence Characteristics in Shendong Coalfield

To identify the mining subsidence characteristics in high-intensity mines, 19 continuous deformation areas with mining subsidence in the west bank of Wulanmulun River were investigated. These study areas were divided into A (A1, A2, A3, A4, and A5), B (B1, B2, and B3), C (C1), D (D1, D2, D3, and D4), E (E1, E2, and E3), F (F1 and F2), and G (G1) (Figure 14 A–G).
In order to ensure that the section lines of each period would pass through the maximum subsidence point, the coherence images of the consecutive DInSAR interferometry were used, in which mining subsidence areas were determined as low-coherence areas. The centroids (i.e., geometric centers) of low-coherence areas were connected, thereby forming the principal sectional line of the maximum subsidence. Subsequently, this sectional line was used to extract the subsidence values under the consecutive DInSAR interferometry and the cumulative DInSAR interferometry. Then, the subsidence characteristic curve of 19 continuous deformation areas was drawn (Figure 15).
Only several representative working faces were illustrated and analyzed in this paper given the limit in article length.
In Figure 14, the subfigures(‘A’–’G’) show 7 sub-regions of the focused investigation in the west bank of Wulanmulun River, and they contain a total of 19 continuous deformation areas. The Subfigure ‘H’ is a regional aerial view that represents the relative spatial relationships of the 7 sub-regions.
In Figure 15, in a sectional graph way, interferometric results from 6 working faces (A3, B2, C1, D2, E1, and G1) are shown concentrately, which comprise that of the consecutive DInSAR interferometry located in left and that of the cumulative DInSAR interferometry located in right. The 6 working faces are located in Cuncaota No. 2 Mine, Cuncaota No.1 Mine, Bu’ertai Mine, Buliantai Mine, Shangwan Mine, and Huojitu Mine respectively (see also Figure 1 and Figure 14).
Along the centroids of subsidence basin of the working faces (see also Figure 14), 6 observation lines (length difference from 2200 m (B2) to 4840 m (G1)) were set, and re-sampled at an interval of 20 m along the line. So a series of subsidence curves were drawn along the time axis (interval difference from 336 day (A3, B2, and E1) to 504 day (C1 and G1)).
In Figure 15, a common attribute is in that the results of the consecutive DInSAR interferometry reappear some phenomena of a forward movement of the footprint of the deformation area with a series of perfect subsidence basins of subcritical mining such as the Figure 15a,c,e,g. Only in Figure 15i,k it represents a bit of fluctuate due the influence of near mining. Mean over, another common attribute is in that the results of the cumulative DInSAR interferometry represent a pattern of the subsidence basin area continuously expanded and the center of mining subsidence continuously moved forward (such as the Figure 15b,d,f,h,j,l).
Nevertheless, the Figure 15 also represents the characteristic of high-intensity mining subsidence. Firstly, it is in that maximum subsidence cannot be obtained from the results of the consecutive DInSAR interferometry due to strong phase discontinuities caused by the large deformation gradient. In other words, the subsidence curve is incorrect in the bottom of the bowl. Secondly, the results of the consecutive DInSAR interferometry express three different patterns of subsidence that the subcritical mining (Figure 15d,j), the critical mining (Figure 15b,l), and the supercritical mining respectively (Figure 15f,h). Finally, the results of the average subsidence rate during the observation period were range from 240 mm/year to 720 mm/year, which is a far less than that of the Poland [43] and of the Australia (a private communications, Ge, L.L., 2016.7 [45]).

4.4. Mining Subsidence Characteristics in Working Face 22201-1/2 in Bu’ertai Mine

Time-series analysis was conducted to discriminate ground deformation associated with past-mining activity and atmospheric effects, and consequently, acquire the spatial distribution characteristics, deformation pattern, development direction, evolution property, and temporal correlation of the multi-temporal mining subsidence phase-changing areas. For the determined boundaries of mining-induced damages, the classification of ground displacement and the calculated ground displacement parameters have practical significance. The experimental research only focused on working face 22201-1/2 in Bu’ertai Mine considering the heavy computing and analysis workloads. Multi-temporal DInSAR interferometry and SBAS-InSAR interferometry were adopted to calculate the available parameters. The subsidence patterns obtained using these two interferometric strategies were compared. The results are shown in Figure 16.
The subsidence curves of multi-temporal DInSAR interferometry with SBAS-InSAR interferometry were compared, and the following conclusions were drawn.
(1) In Figure 16a,b, the 17-temporal subsidence curves were obtained from the superposition of multi-temporal DInSAR interferometry, which could reflect general mining subsidence characteristics. That is, underground mining caused subsidence. With the expansion of the mining area, the subsidence area gradually expanded toward the advancing direction and subsidence continuously increased. The maximum subsidence became stable when it reached a certain extent, thereby forming a critical mining-induced subsidence bowl. However, rapid considerable subsidence caused by high-intensity mining (large mining height, thin bedrock, and fast advancing) brought serious decorrelation, and the principal value of phase change could not be effectively extracted. Accordingly, only the first temporal subsidence curve was connected smoothly because subsidence was within the unwrapping capacity of DInSAR (λ/4 = 14 mm) [46].
By contrast, in the subsequent observation the large deformation gradient resulted unwrapping failure and had a noise phase that was beyond the calculation capacity of the DInSAR. Such subsidence curves had no practical significance and could not obtained maximum subsidence. Furthermore, the effect of temporal decorrelation increased with temporal baseline, and the subsidence curve became insensitive. This condition was accompanied by a certain delay in the middle-temporal and late-temporal subsidence curves. The accumulation of residual phase changes also caused unexpected subsidence in non-mining areas.
(2) As shown in Figure 16c,d, SBAS-InSAR interferometry optimized the spatio-temporal baselines and improved the spatio-temporal sampling rates. The obtained results were more reliable than those of DInSAR. The 17-temporal subsidence curves of SBAS-InSAR did not only reflect the mining subsidence characteristics more accurately, but was also closer to the subsidence curve of probability integral estimation and maintained good continuity. However, it still failed to extract the principal value of phase changes because of the large deformation caused by mining subsidence. The acquired maximum subsidence was smaller than 200 mm, which was significantly different from that in practical situations.
(3) The mining area (1.23 km2) and subsidence area (5.58 km2) of the 22201-1/2 working face were calculated by further interpreting the results of SBAS-InSAR. The ratio of the mining area to the subsidence area was 1:4.5. The daily average advance rate of the working face was 8.1 m/day, and the daily average advance rate of subsidence area was 7.9 m/day. The average maximum subsidence angle was 67.3°. The advance angles of influence of DInSAR and SABS-InSAR were 53.5° and 50.5°, respectively.

5. Conclusions

In this study, InSAR and SBAS-InSAR techniques allow us understand the annual growing characteristics of subsidence disasters under high-intensity mining in Shendong Coalfield, and recognize the ground deformation features above a single working face.
(1) Conventional DInSAR is an effective approach for investigating ground damages caused by mining subsidence in coal mining areas. It demonstrates our tremendous destructive capability of the high-intensity coal exploitation. Over 85 phase change regions are identified within 504 days (20 January 2012 to June 2013) in Shendong Coalfield, including at that time and in the past, and including open-pit mining and underground mining areas. Annual subsidence area is about 150km2, approximately, which accounted for 4% of the total area of Shendong Coalfield (3481 km2).
(2) The time-series analysis of SBAS-InSAR achieves more reliable results and more accurately reflects the mining subsidence characteristics of a single working face. It makes some important parameters (such as the advance distance of influence and the advance angle of influence, which parameters can be used to predict the extent of mining subsidence so that action can be taken to prevent buildings from being damaged or other measures taken to control potential geohazards, etc.) is possible to be obtained.
(3) We find that the ground damage rate(7.9 m/day) caused by the high-intensity mining, is almost equal to mining rate of the working face(8.1 m/day), which should be a unique phenomenon occurred only at high-intensity mining conditions. In addition, we find that the advance distance of influence is much greater than the distance of the exploitation, but the advance angle of influence(50.5°–53.5°) is much smaller than the angle of conventional mining(67.0°–70.0°), this may be due to the rate of water-loss settlement is much than that of mining subsidence.
(4) We find that some uplift are occurred at the front of working face in the direction of advancing, which may be caused systematically by orbit error, or by an inappropriate selection of the reference points. It is more likely a unique phenomenon associated with high-intensity mining. Although we have not yet to find a well-received explanation, it should be the focus of our future work, and we will try to understand and explain this phenomenon by means of the in-situ field measurements.

Acknowledgments

This research is jointly supported by the project of the National Natural Science Foundation of China and the Shenhua Coal Industry Group Co., Ltd. (Grant No. U1261106: Scattering Variation of Mining Subsidence Area Based on High-resolution SAR and Grant No. U1261206: The Mechanism of Surface Ecological Environment Evolution and Its Control due to High-Intensity Coal Mining) and the project of the Henan Province University Technological Innovation Team Support Program in 2013 (Grant No. 13IRTSTHN029: Monitoring and protection of mining-induced deformation in coal mining area). The authors would like to thank Ge, L.L., (UNSW) for his English editing in enhancing the quality of the paper.

Author Contributions

All the authors participated in the writing of the manuscript and have read and approved the final manuscript. Ma, C. and Zou, Y. conceived and designed the experiments. Cheng, X. and Yang, Y. processed the SAR data and performed the experiments. Zhang, X. implemented the coordinate transformation; Ma, C. and Guo, Z. analyzed the data.

Conflicts of Interest

The authors declare no conflict of interest.

References

  1. Chen, G.; Liu, Y.; Shan, X. Application of PS-InSAR technique in the deformation monitoring in mining collapse areas in Beijing. Chin. J. Geol. Hazard Control 2010, 21, 59–63. [Google Scholar]
  2. Wang, Z.; Zhang, J.; Huang, G. Precise monitoring and analysis of the land subsidence in Jining coal mining area based on InSAR technique. J. China Univ. Min. Technol. 2014, 43, 169–174. [Google Scholar]
  3. Massonnet, D.; Rossi, M.; Carmona, C.; Adragna, F.; Peltzer, G.; Feigl, K.; Rabaute, T. Displacement field of the Landers earthquake mapped by Radar Interferometry. Nature 1993, 364, 138–142. [Google Scholar] [CrossRef]
  4. Ma, C.; Shan, X.J. A multi-segment analytic modeling of hypocentral geometric characteristic parameters of the Ms 8.1 earthquake at the Kunlun Mountains. Chin. J. Geophys. 2006, 49, 428–437. [Google Scholar] [CrossRef]
  5. Zebker, H.A.; Rosen, P.; Hensley, S.; Mouginis-Mark, P.J. Analysis of active lava flows on Kilauea volcano, Hawaii, using SIR-C radar correlation measurements. Geology 1996. [Google Scholar] [CrossRef]
  6. Schaefer, L.N.; Zhong, L.; Oommen, T. Post-eruption deformation processes measured using ALOS-1 and UAVSAR InSAR at Pacaya Volcano, Guatemala. Remote Sens. 2016. [Google Scholar] [CrossRef]
  7. Muskett, R.R.; Lingle, C.S.; Sauber, J.M.; Rabus, B.T.; Tangborn, W.V. Acceleration of surface lowering on the tidewater glaciers of Icy Bay, Alaska, U.S.A. from InSAR DEMs and ICESat altimetry. Earth Planet. Sci. Lett. 2008, 265, 345–359. [Google Scholar] [CrossRef]
  8. Necsoiu, M.; Onaca, A.; Wigginton, S.; Urdea, P. Rock glacier dynamics in Southern Carpathian Mountains from high-resolution optical and multi-temporal SAR satellite imagery. Remote Sens. Environ. 2016, 177, 21–36. [Google Scholar] [CrossRef]
  9. Bai, L.; Jiang, L.; Wang, H.; Sun, Q. Spatiotemporal characterization of land subsidence and uplift (2009–2010) over Wuhan in central China revealed by TerraSAR-X InSAR analysis. Remote Sens. 2016. [Google Scholar] [CrossRef]
  10. Liu, P.; Li, Q.; Li, Z.; Hoey, T.; Liu, G.; Wang, C.; Hu, Z.; Zhou, Z.; Andrew, S. Anatomy of subsidence in Tianjin from time series InSAR. Remote Sens. 2016. [Google Scholar] [CrossRef]
  11. Perski, Z. Applicability of ERS-1 and ERS-2 InSAR for land subsidence monitoring in the Silesian coal mining region, Poland. Int. Arch. Photogramm. Remote Sens. 1998, 32, 555–558. [Google Scholar]
  12. Fan, H.D.; Gao, X.X.; Yang, J.K.; Deng, K.Z.; Yu, Y. Monitoring mining subsidence using a combination of phase-stacking and offset-tracking methods. Remote Sens. 2015, 7, 9166–9183. [Google Scholar] [CrossRef]
  13. Achache, J.; Fruneau, B.; Delacourt, C. Applicability of SAR interferometry for operational monitoring of landslides. In Proceedings of the Second ERS Applications Workshop, London, UK, 6–8 December 1995.
  14. Francesca, C.; Luke, B.B.; Colm, J.J.; Claire, D. Simulating SAR geometric distortions and predicting Persistent Scatterer densities for ERS-1/2 and ENVISAT C-band SAR and InSAR applications: Nationwide feasibility assessment to monitor the landmass of Great Britain with SAR imagery. Remote Sens. Environ. 2014, 152, 441–466. [Google Scholar]
  15. Wegmuller, U.; Strozzi, T.; Wiesmann, A.; Werner, C. Land subsidence mapping with ERS interferometry: Evaluation of maturity and operational readiness. In Proceedings of the 2nd Int. Workshop on ERS SAR Interferometry Fringe’99, Liège, Belgium, 10–12 November 1999.
  16. Perski, Z.; Hanssen, R.; Wojcik, A.; Wojciechowski, T. InSAR analyses of terrain deformation near the Wieliczka Salt Mine, Poland. Eng. Geol. 2009, 106, 58–67. [Google Scholar] [CrossRef]
  17. Ge, L.L.; Chang, H.C.; Qin, L.; Chen, M.; Rizos, C. Differential radar interferometry for mine subsidence monitoring. In Proceedings of the 11th International (FIG) Symposium on Deformation Measurements, Santorini, Greece, 25–28 May 2003.
  18. Raucoules, D.; Colesanti, C.; Carnec, C. Use of SAR interferometry for detecting and assessing ground subsidence. C. R. Geosci. 2007, 339, 289–302. [Google Scholar] [CrossRef]
  19. Ng Hay-Man, A.; Chang, H.C.; Ge, L.L.; Chris, R.; Makoto, O. Assessment of radar interferometry performance for ground subsidence monitoring due to underground mining. Earth Planet. Space 2009, 61, 733–745. [Google Scholar]
  20. Liu, D.L.; Shao, Y.F.; Liu, Z.G.; Björn, R.; Andrew, S.; Wolfgang, N.; Bian, Z.F. Evaluation of InSAR and TomoSAR for Monitoring deformations caused by mining in a mountainous area with high resolution satellite-based SAR. Remote Sens. 2014, 6, 1476–1495. [Google Scholar] [CrossRef]
  21. Wu, L.; Gao, J.; Ge, D.; Liao, M. Experimental study on surface subsidence monitoring with DInSAR in mining area. J. Northeast. Univ. Nat. Sci. 2005, 26, 778–781. [Google Scholar]
  22. Ge, D.; Wang, Y.; Fan, J.; Liu, S.; Guo, X.; Wang, Y. A study of surface deformation monitoring using differential SAR interferometry technique and an analysis of its key problems. Remote Sens. Land Resour. 2007, 74, 15–22. [Google Scholar]
  23. Zhang, J.F.; Guo, Q.; Gong, L. Measuring mining induced subsidence by using InSAR technique—Taking Wuan mining area in Hebei as an example. Geoinform. Sci. 2008, 10, 652–657. [Google Scholar]
  24. Deng, K.Z.; Yao, N.; Lu, Z.; Fan, H. Experimental research on monitoring mining subsidence by DInSAR technique. Met. Min. 2009, 402, 25–27. [Google Scholar]
  25. Gong, Y.; Yao, W.; Tang, F. New way of mining damage dynamic monitoring in mining area of West China. J. Xi’an Univ. Sci. Technol. 2010, 30, 693–696. [Google Scholar]
  26. Yang, C.S.; Zhang, Q.; Zhao, C.Y.; Ji, L.; Zhu, W. Monitoring mine collapse by D-InSAR. Min. Sci. Technol. 2010, 20, 696–700. [Google Scholar] [CrossRef]
  27. Zhu, J.; Xing, X.; Hu, J.; Li, Z. Monitoring of ground surface deformation in mining area with InSAR technique. Chin. J. Nonferr. Met. 2011, 21, 2564–2576. [Google Scholar]
  28. Fan, H.; Deng, K.; Xue, J.; Zhu, C. An experimental research on using time series SAR Images to monitor mining subsidence. Saf. Coal Min. 2011, 42, 15–18. [Google Scholar]
  29. Ma, C.; Meng, X.; Pan, J.; Lu, L. Optimizing DInSAR processing strategies for time series mining subsidence observation data. J. Henan Polytech. Univ. Nat. Sci. 2012, 31, 311–316. [Google Scholar]
  30. Usai, S. A least squares database approach for SAR Interferometric data. IEEE Trans Geosci Remote Sens. 2003, 41, 753–760. [Google Scholar] [CrossRef]
  31. Berardino, P.; Fornaro, G.; Lanari, R.; Sansosti, E. A new algorithm for surface deformation monitoring based on Small Baseline Differential SAR Interferograms. IEEE Trans Geosci Remote Sens. 2002, 40, 2375–2383. [Google Scholar] [CrossRef]
  32. Sergey, S.; Nicolas, D.; Benoît, S. Ground deformation associated with post-mining activity at the French–German border revealed by novel InSAR time series method. Int. J. Appl. Earth Obs. Geoinf. 2013, 23, 142–154. [Google Scholar]
  33. Bateson, L.; Cigna, F.; Boon, D.; Sowter, A. The application of the Intermittent SBAS (ISBAS) InSAR method to the South Wales Coalfield, UK. Int. J. Appl. Earth Obs. Geoinf. 2015, 34, 249–257. [Google Scholar] [CrossRef]
  34. Yin, H.; Zhu, J.; Li, Z.; Ding, X.; Wang, C. Ground subsidence monitoring in mining area using DInSAR SBAS algorithm. Acta Geodaetica et Cartographica Sinica 2011, 40, 37–42. [Google Scholar]
  35. Li, G.; Xue, J. Monitoring the surface subsidence of mining areas based on SBAS method. Geomat. Spat. Infor. Technol. 2013, 36, 191–196. [Google Scholar]
  36. Zhou, L.F.; Zhang, D.R.; Wang, J.; Huang, Z.Q.; Pan, D.L. Mapping Land subsidence related to underground coal fires in the Wuda Coalfield (Northern China) using a small stack of ALOS PALSAR differential interferograms. Remote Sens. 2013, 5, 1152–1176. [Google Scholar] [CrossRef]
  37. Zhao, C.Y.; Lu, Z.; Zhang, Q. Time-series deformation monitoring over mining regions with SAR intensity-based offset measurements. Remote Sens. Lett. 2013, 4, 436–445. [Google Scholar] [CrossRef]
  38. Zhao, C.Y.; Zhang, Q.; Yang, C.S.; Zou, W.B. Integration of MODIS data and Short Baseline Subset (SBAS) technique for land subsidence monitoring in Datong, China. J. Geodyn. 2011, 52, 16–23. [Google Scholar] [CrossRef]
  39. Casu, F.; Manzo, M.; Lanari, R. A quantitative assessment of the SBAS algorithm performance for surface deformation retrieval from DInSAR data. Remote Sens. Environ. 2006, 102, 195–210. [Google Scholar] [CrossRef]
  40. Lanari, R.; Casu, F.; Manzo, M.; Zeni, G.; Berardino, P.; Manuta, M.; Pepe, A. An overview of the small baseline subset algorithm: A DInSAR technique for surface deformation analysis. Pure Appl. Geophys. 2007, 164, 637–661. [Google Scholar] [CrossRef]
  41. Zhou, X.; Wu, J.; Xin, D. Integrated innovation to design world No. 1 coal mine—Bu’ertai Mine. Coal Eng. 2011, 3, 4–7. (In Chinese) [Google Scholar]
  42. Atanu, B.; Manoj, K.A.; Mukat, L.S.; Malte, V.; Raginder, B. Surface displacement estimation using space-borne SAR interferometry in a small portion along Himalayan Frontal Fault. Opt. Lasers Eng. 2014, 53, 164–178. [Google Scholar]
  43. Przyłucka, M.; Herrera, G.; Graniczny, M.; Colombo, D.; Béjar-Pizarro, M. Combination of conventional and advanced DInSAR to monitor very fast mining subsidence with TerraSAR-X data: Bytom City (Poland). Remote Sens. 2015, 7, 5300–5328. [Google Scholar] [CrossRef]
  44. He, G.; Yang, L.; Ling, G.; Jia, F.; Hong, D. Mining Subsidence, 1st ed.; China University of Mining and Technology Press: Xuzhou, China, 1991; pp. 31–52. (In Chinese) [Google Scholar]
  45. Ng Hay-Man, A.; Ge, L.L.; Yan, Y.G.; Li, X.J.; Chang, H.C.; Zhang, K.; Chris, R. Mapping accumulated mine subsidence using small stack of SAR differential interferograms in the Southern coalfield of New South Wales, Australia. Eng. Geol. 2010, 115, 1–15. [Google Scholar]
  46. Wasowski, J.; Bovenga, F. Investigating landslides and unstable slopes with satellite multi temporal interferometry: Current issues and future perspectives. Eng. Geol. 2014, 174, 103–138. [Google Scholar] [CrossRef]
Figure 1. Geographical location of Shendong Coalfield. Background data: Satellite imagery acquired by Landsat 7 on 10 April 2013.
Remotesensing 08 00951 g001
Figure 2. The photographs of subsidence damage types in Shendong Coalfield (2009–2015).
Remotesensing 08 00951 g002
Figure 3. Mining layout plan of 22201-1/2 long wall.
Remotesensing 08 00951 g003
Figure 4. Distribution of the spatiotemporal baseline. (a) Spatiotemporal baseline distribution of consecutive DInSAR; (b) Spatiotemporal baseline distribution of cumulative DInSAR.
Remotesensing 08 00951 g004
Figure 5. The results of the consecutive DInSAR pattern (January 2012–June 2013).
Remotesensing 08 00951 g005aRemotesensing 08 00951 g005b
Figure 6. The results of the cumulative DInSAR pattern (January 2012–June 2013).
Remotesensing 08 00951 g006aRemotesensing 08 00951 g006b
Figure 7. Spatiotemporal baseline distribution of the connection diagram and unwrapping results: (a) Spatiotemporal baseline distribution of the connection diagram; (b) 3D unwrapping sub-pairs.
Remotesensing 08 00951 g007
Figure 8. (aq) Interferograms of SBAS-InSAR.
Remotesensing 08 00951 g008aRemotesensing 08 00951 g008bRemotesensing 08 00951 g008c
Figure 9. Example I: verification and validation of Interferometric Measurement.
Remotesensing 08 00951 g009
Figure 10. Example II: verification and validation of Interferometric Measurement.
Remotesensing 08 00951 g010
Figure 11. Example III: verification and validation of Interferometric Measurement.
Remotesensing 08 00951 g011aRemotesensing 08 00951 g011b
Figure 12. Interpretation results of the consecutive interferometry (January 2012–June2013).
Remotesensing 08 00951 g012
Figure 13. Interpretation results of the cumulative interferometry (January 2012–June2013).
Remotesensing 08 00951 g013
Figure 14. (AH) Subsidence areas obtained from the InSAR time-series analysis (Western region to the Wulanmulun River).
Remotesensing 08 00951 g014
Figure 15. (al) Time-series analysis based on multi-temporal DInSAR.
Remotesensing 08 00951 g015aRemotesensing 08 00951 g015b
Figure 16. Comparative analysis between multi-temporal DInSAR and SBAS-InSAR. (a) Time-series subsidence areas of the consecutive DInSAR; (b) Time-series subsidence curves of DInSAR; (c) Time-series subsidence areas of SBAS-InSAR; (d) Time-series subsidence curves of SBAS-InSAR.
Remotesensing 08 00951 g016
Table 1. Imaging parameters and geometry of RADARSAT-2 MF6 data used in this work.
No.OrbitFrameAcquisition Date (yyyymmdd)Cumulative PatternConsecutive Pattern
Time Baseline (Days)Perp. 1 Baseline (m)Time Baseline (Days)Perp. 1 Baseline (m)
1539875134092012012000--
2539875134102012021324406.380924406.3809
3539875134112012030848483.75672458.5609
4539875134122012040172566.68432491.5228
5539875134132012042596431.923624−140.4887
65398751341420120519120169.205024−271.0147
75398751341520120612144399.032424226.9379
85398751341620120706168518.792424116.9807
95398751341720120730192480.647024−35.4784
105398751341820120823216216.559624−261.8938
115398751341920121010264242.02724825.1972
125398751342020121127312461.353748216.3279
135398751342120121221336470.98122414.7253
14457894397622013020738494.9292 48−376.3826
154579143976520130303408226.1092 24131.7180
165739653900420130327432463.3215 24229.4834
175739653900520130420456489.2963 2426.8207
185739653900620130607504593.3395 48107.6413
1 An abbreviation of the perpendicular component of the spatial baseline.

