
Impacts of Re-Vegetation on Surface Soil Moisture over the Chinese Loess Plateau Based on Remote Sensing Datasets

 ,
,
Abstract
:
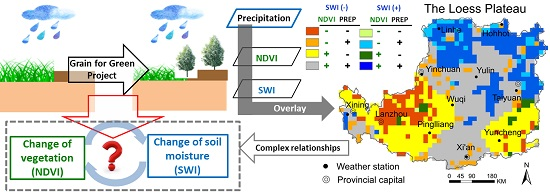
1. Introduction
2. Materials and Methods
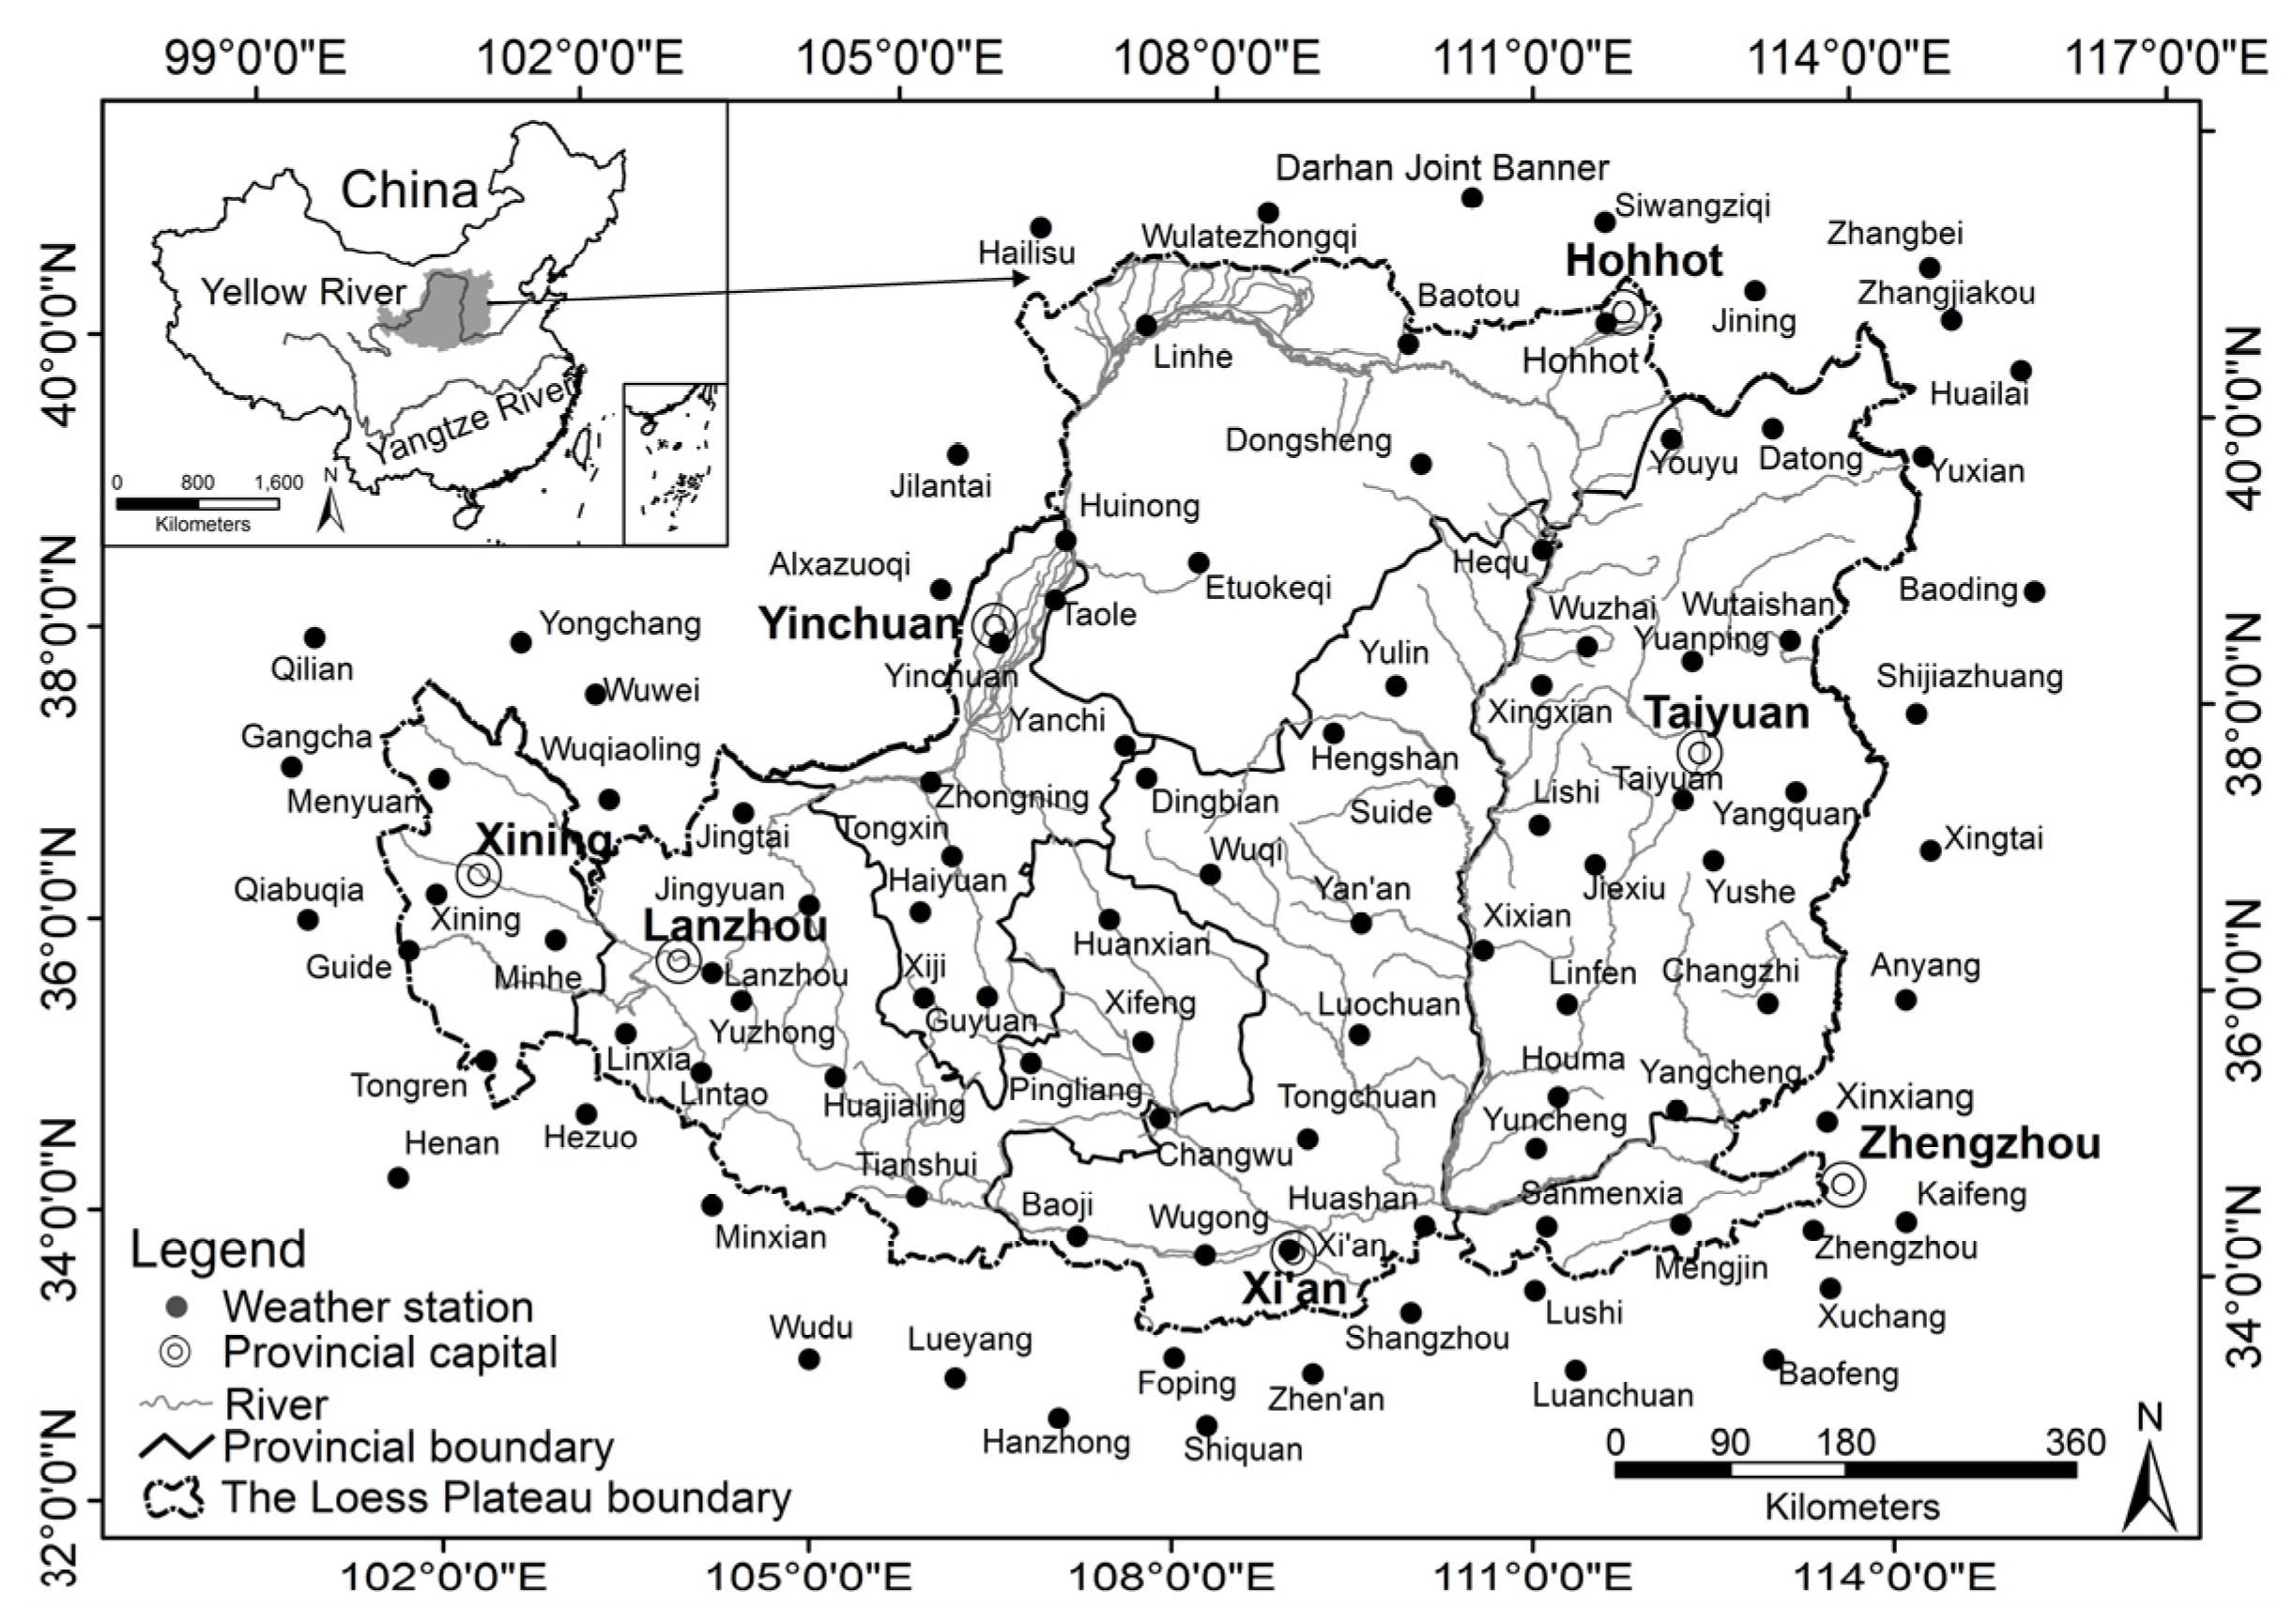
2.1. Study Site
2.2. Data Collection
2.2.1. SWI Data
2.2.2. NDVI Data
2.2.3. Precipitation Data
2.3. Methods
2.3.1. Scale Harmonization
2.3.2. Spatial and Temporal Characteristics of Seasonal and Annual Precipitation, NDVI, and SWI
2.3.3. Cross-Checking of Changes in Mean Annual SWI, NDVI, and Precipitation
3. Results
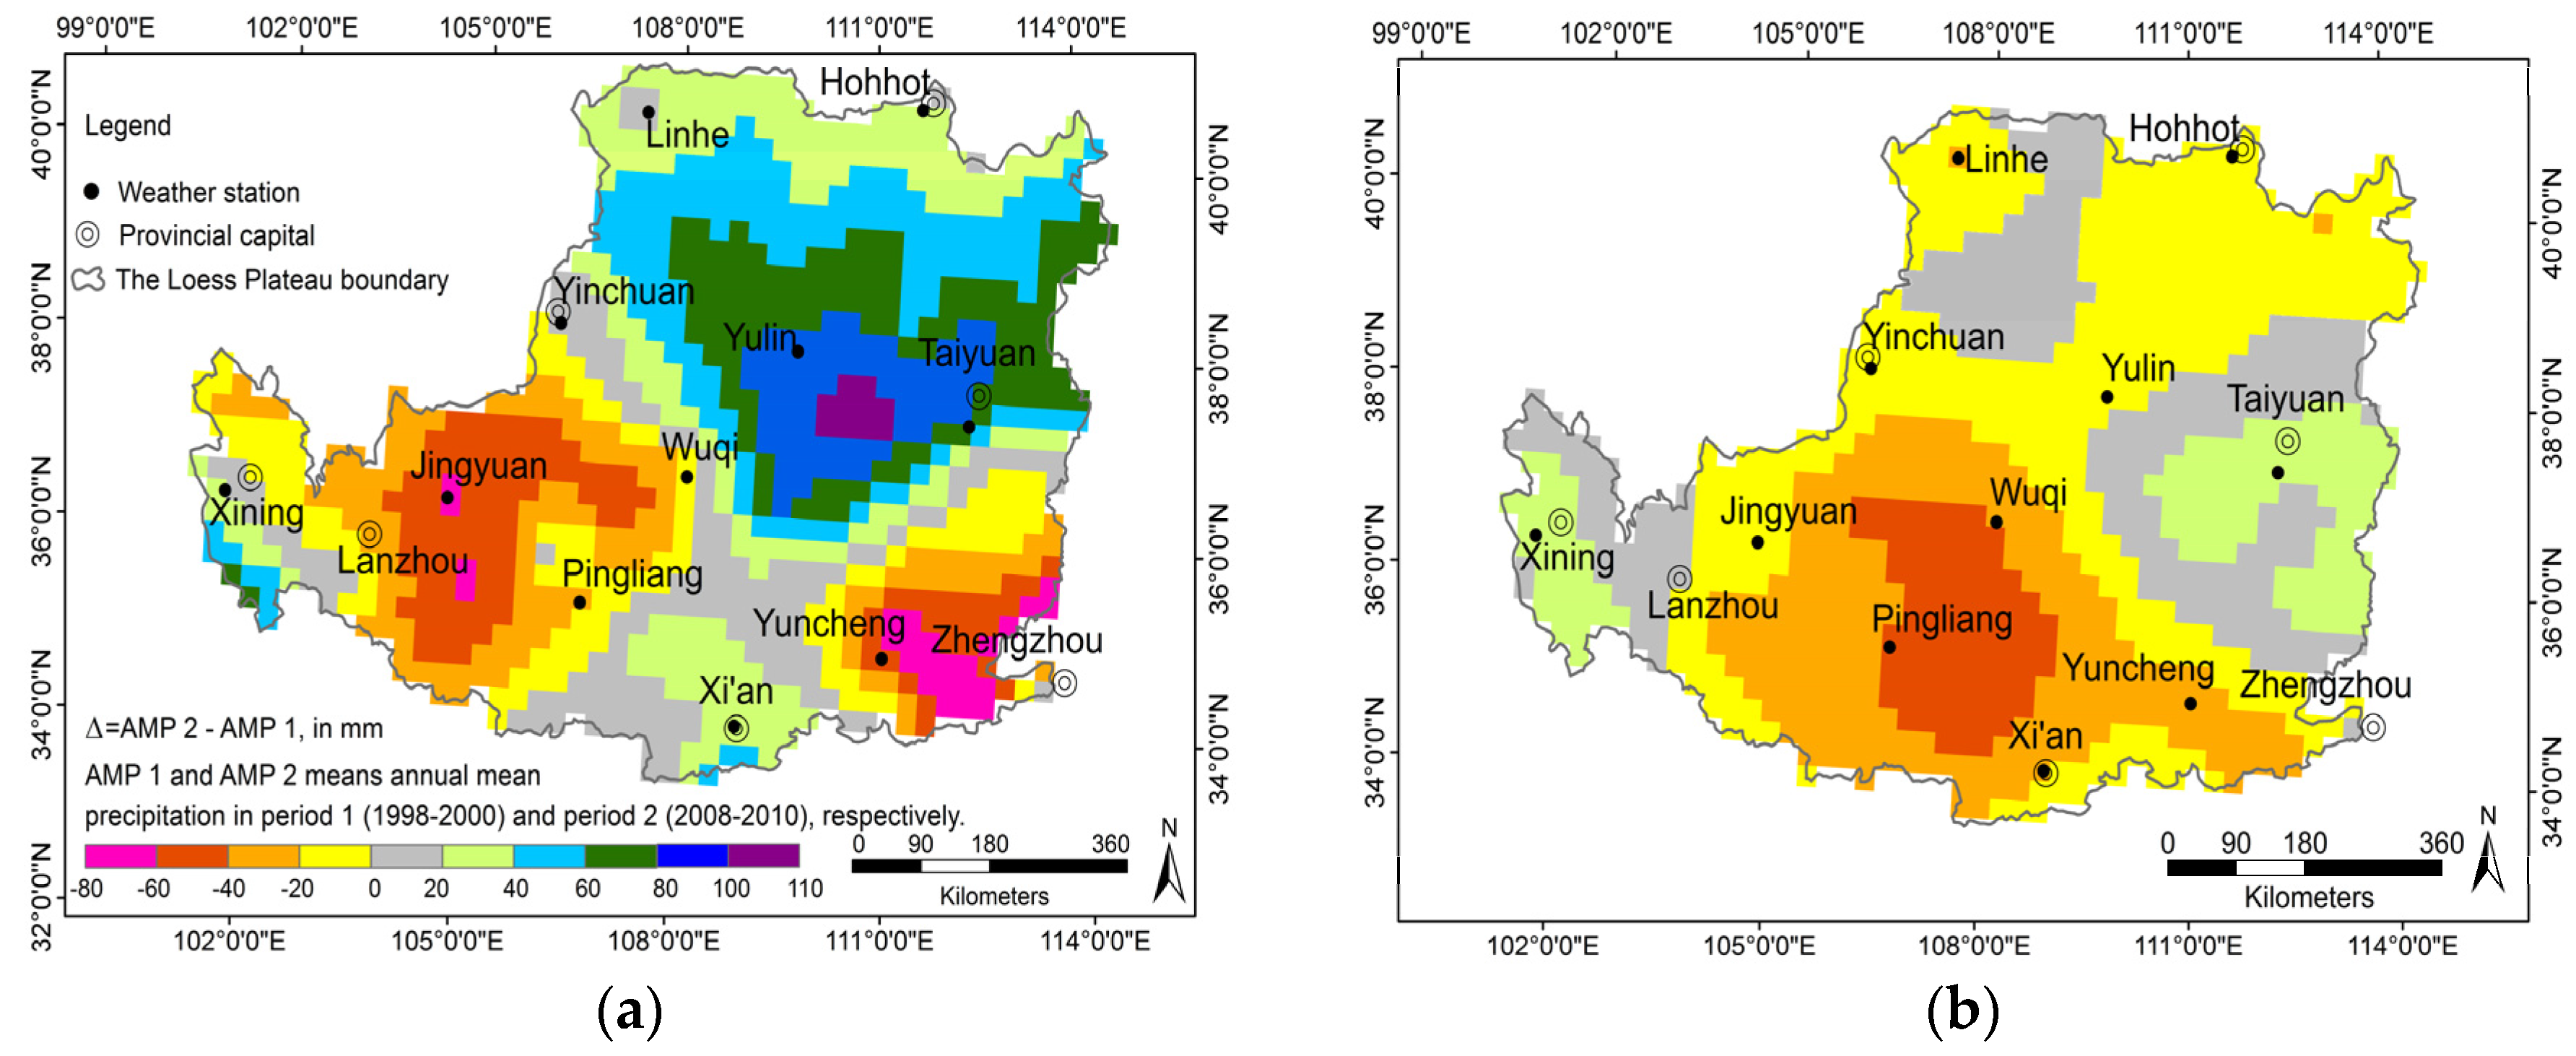
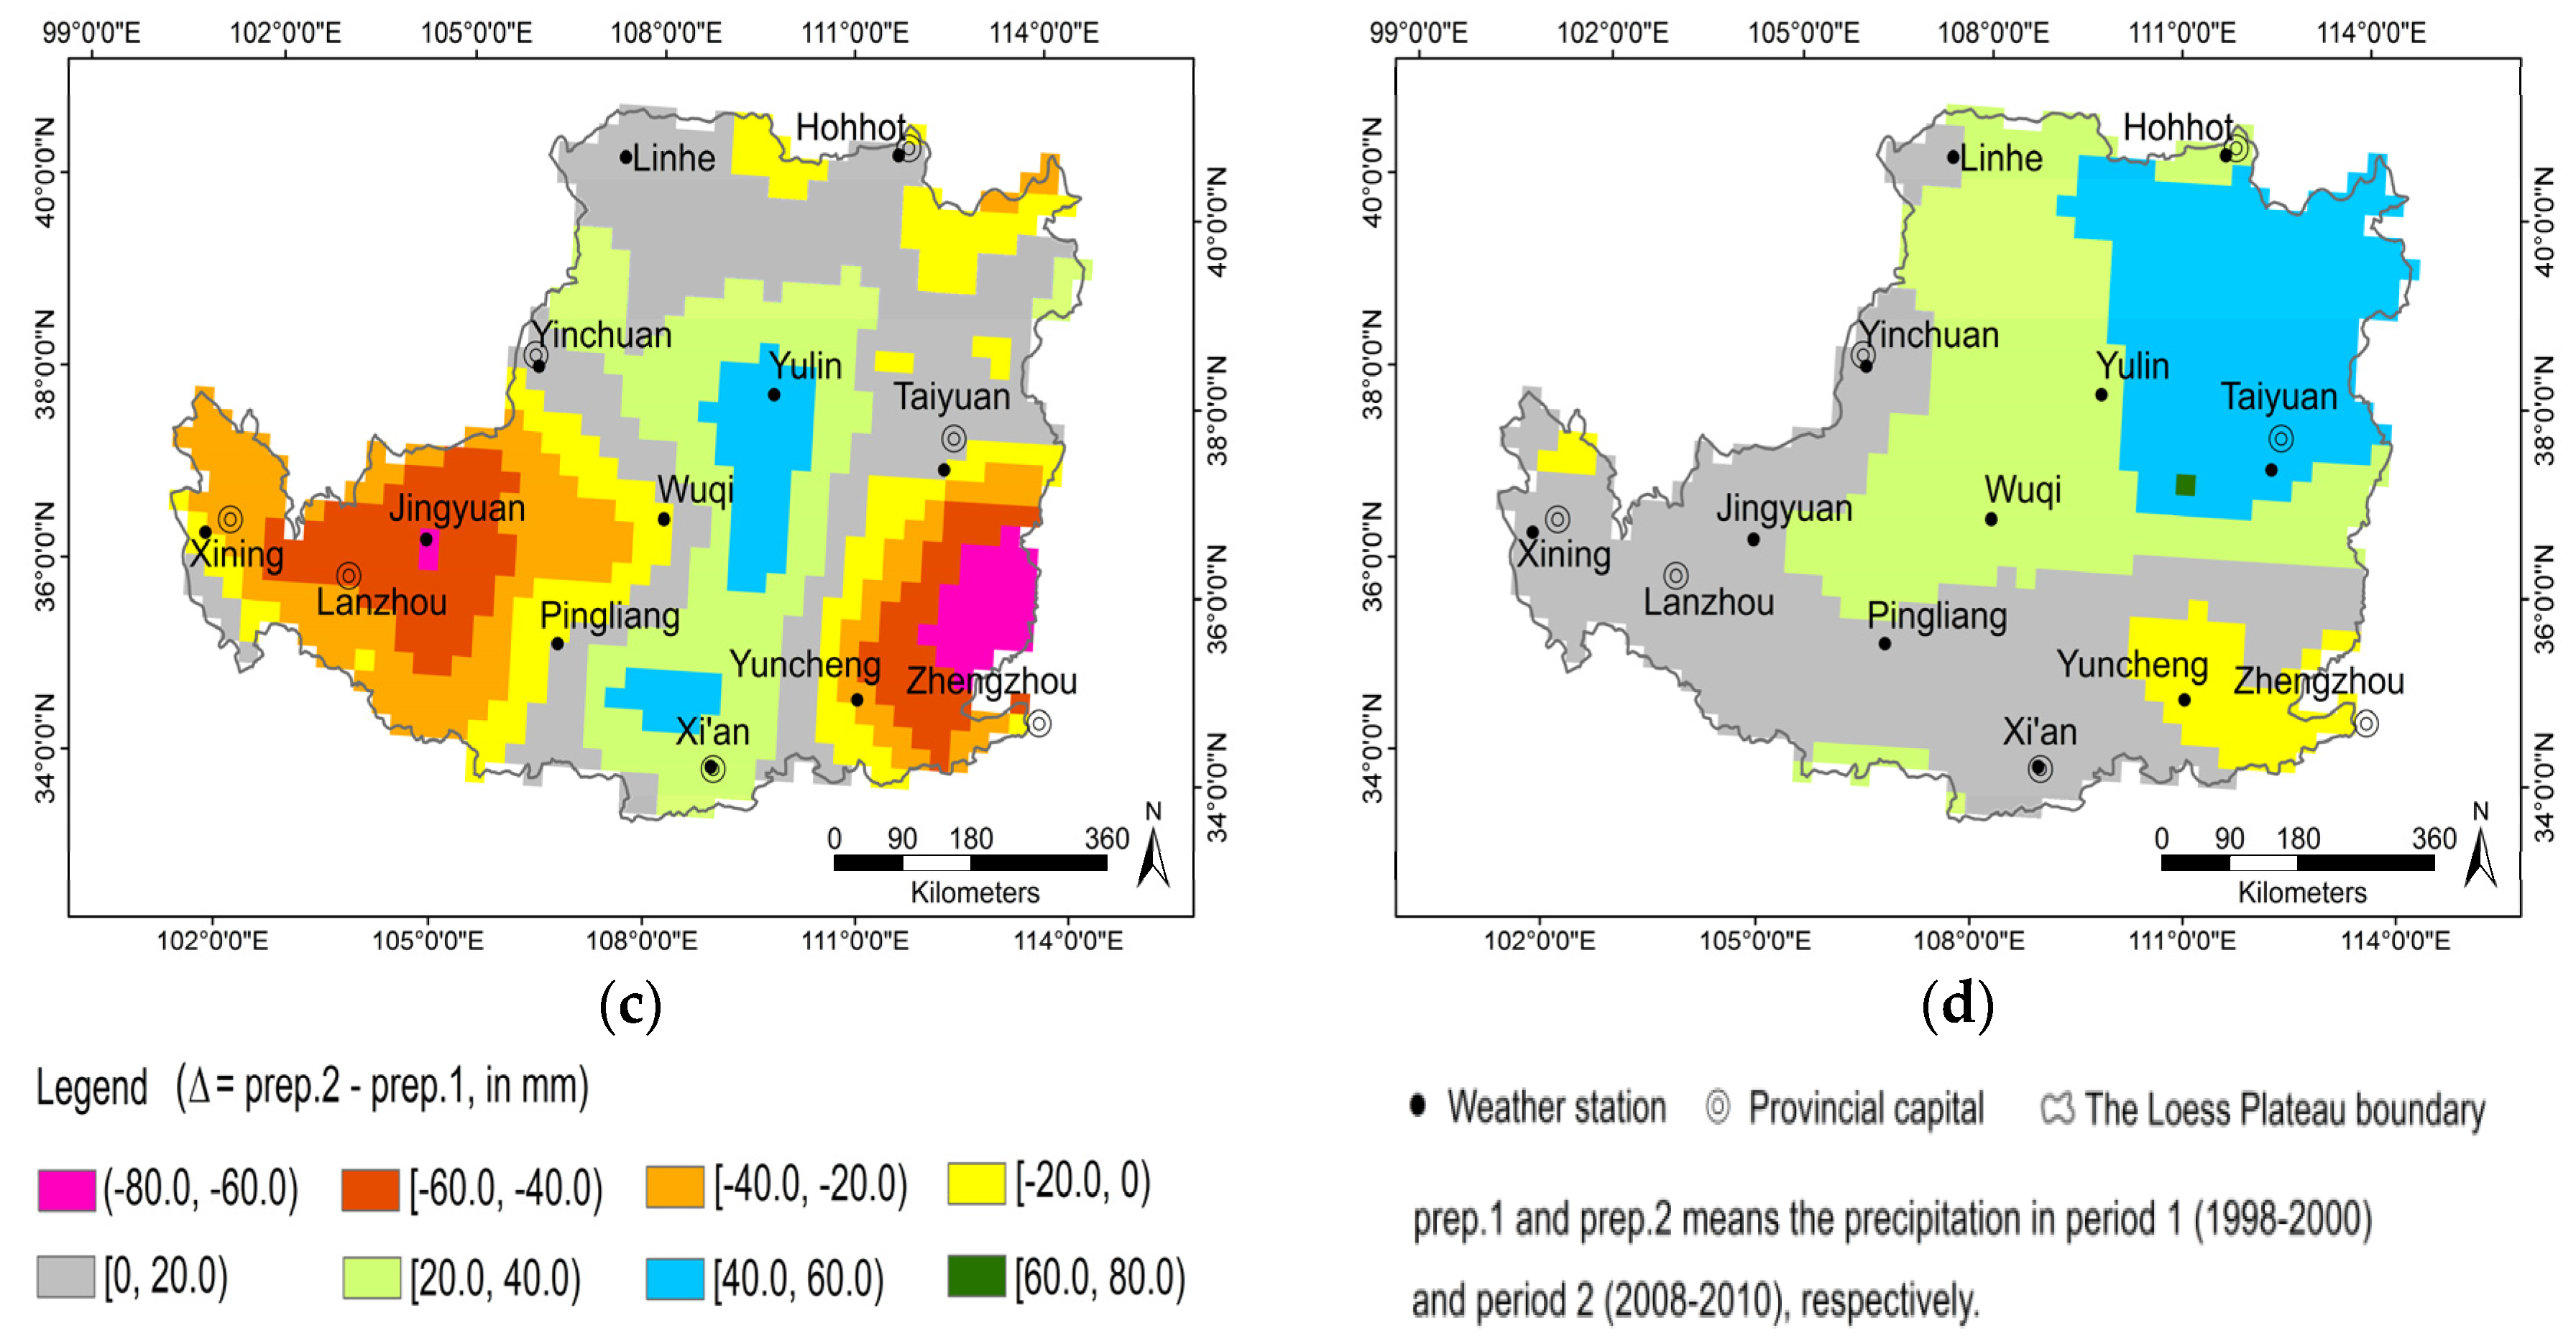
3.1. Precipitation Change
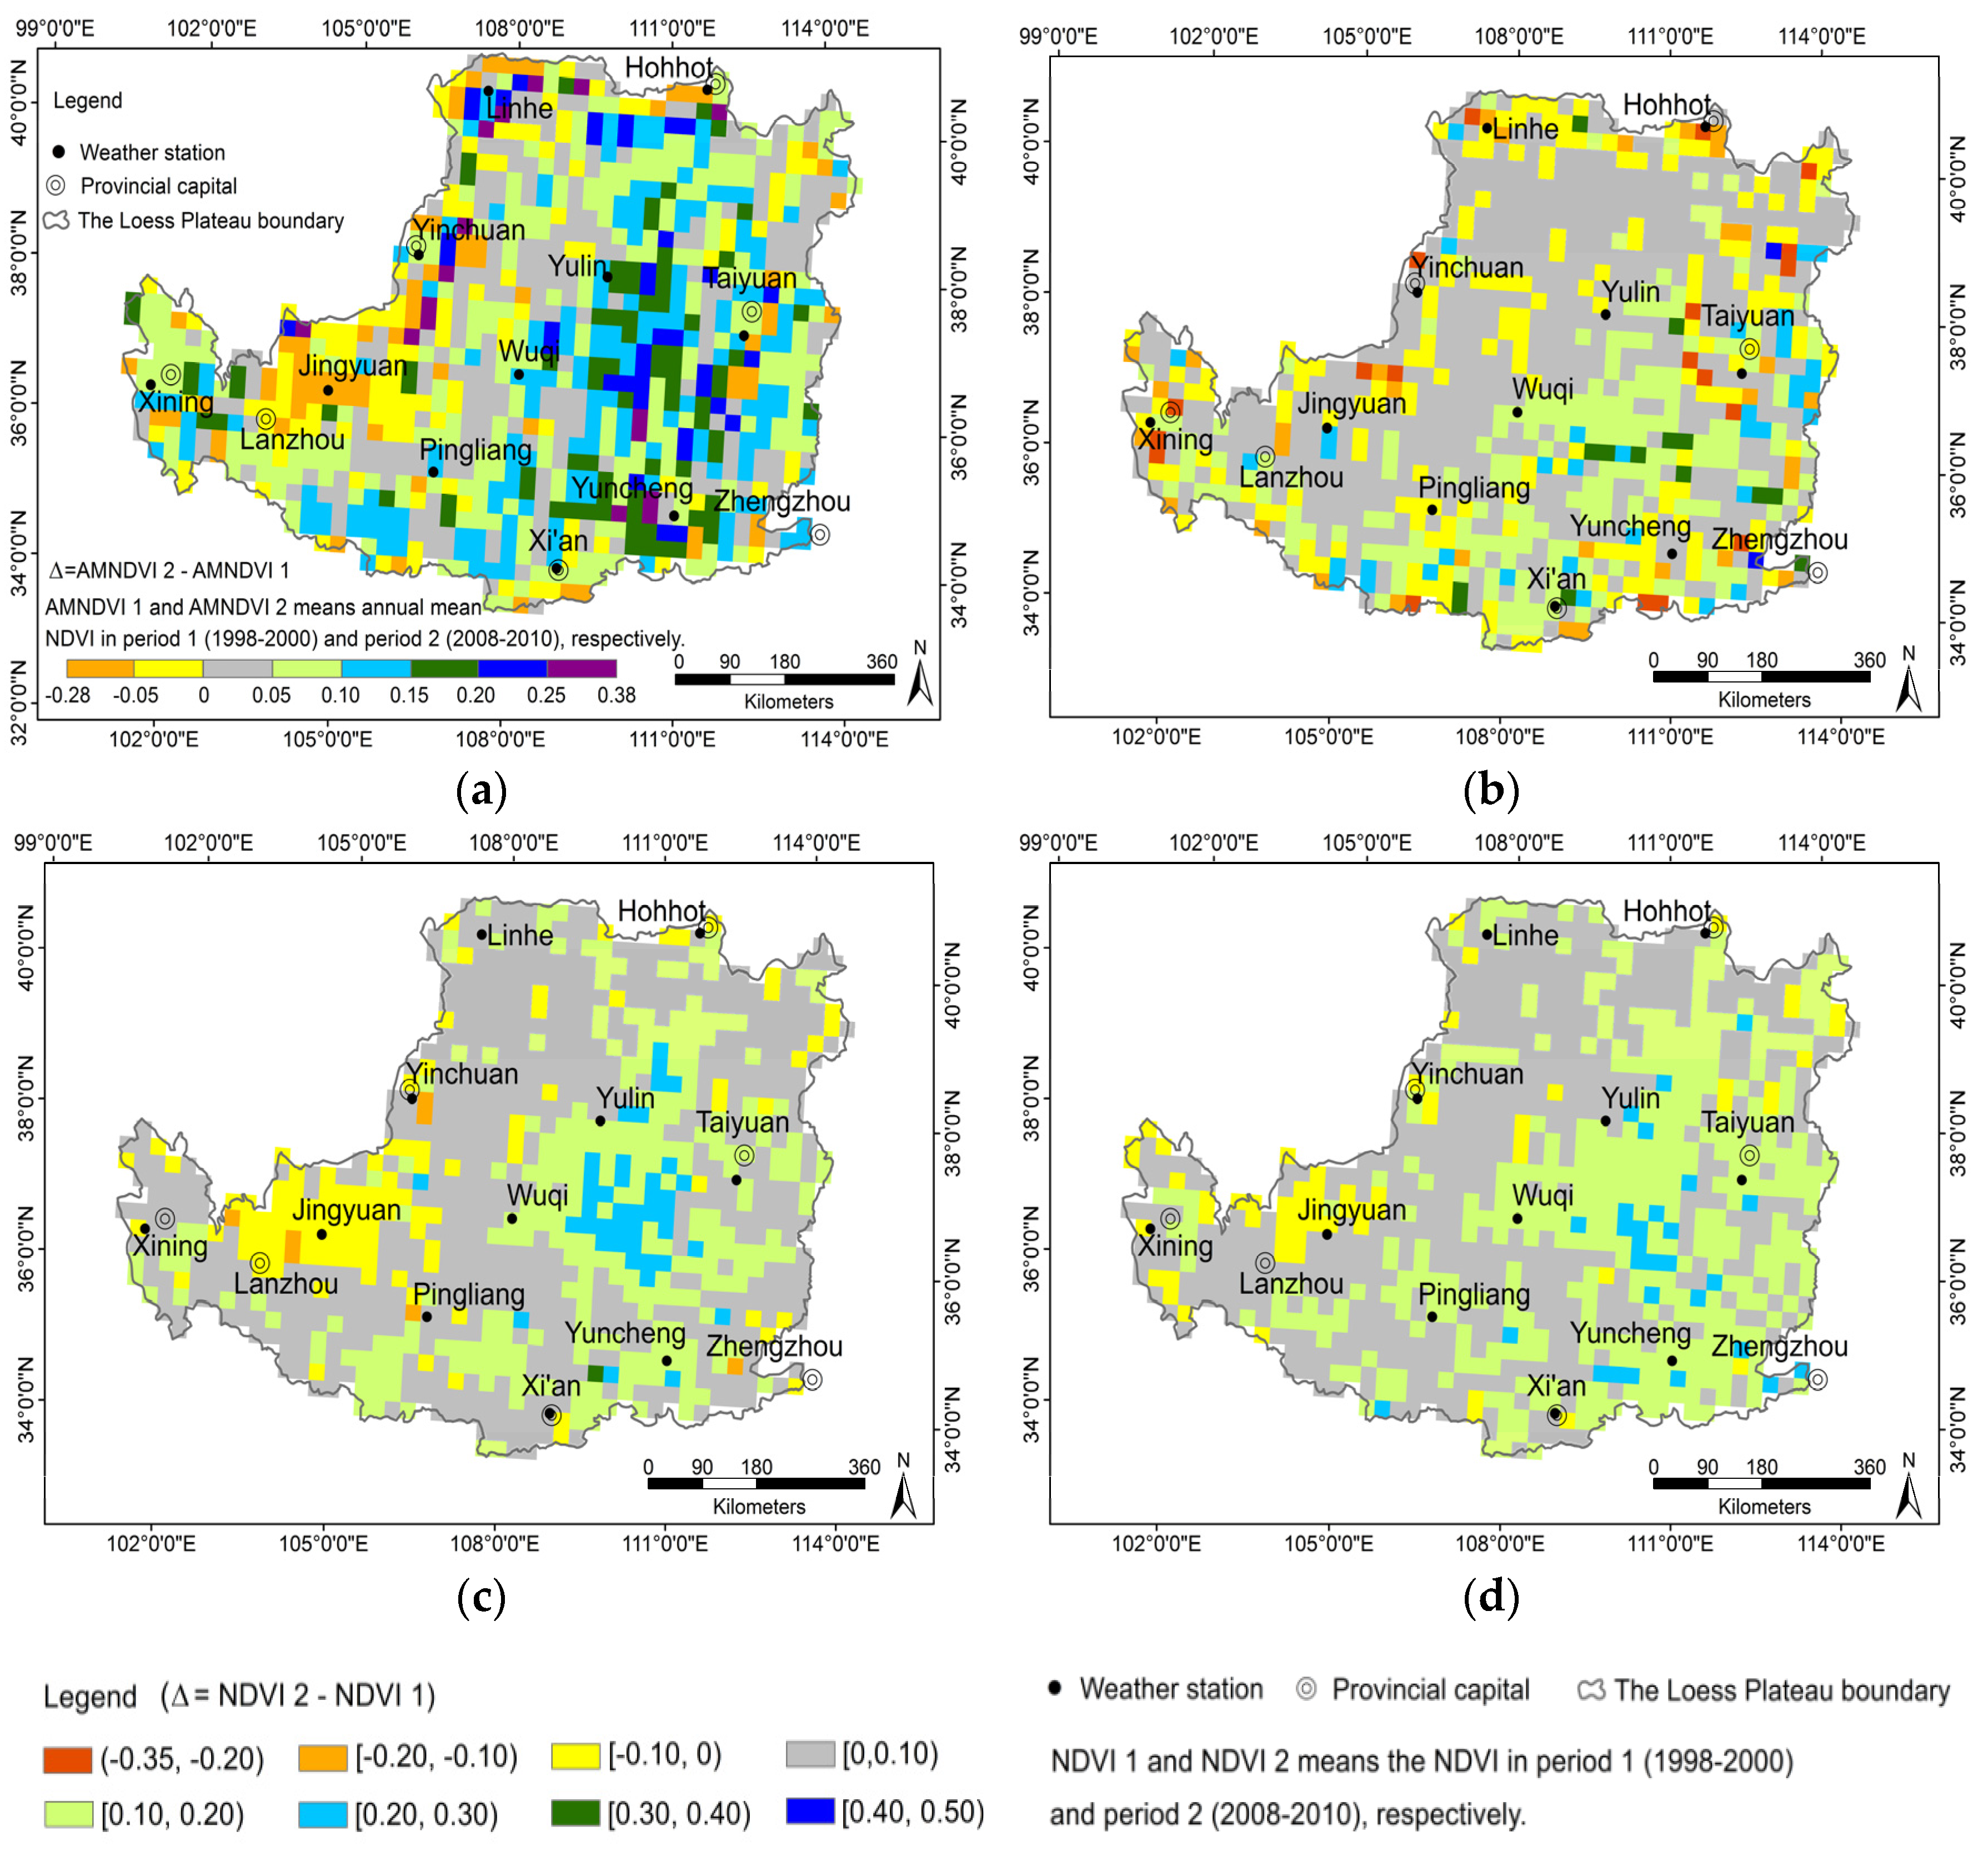
3.2. NDVI Change
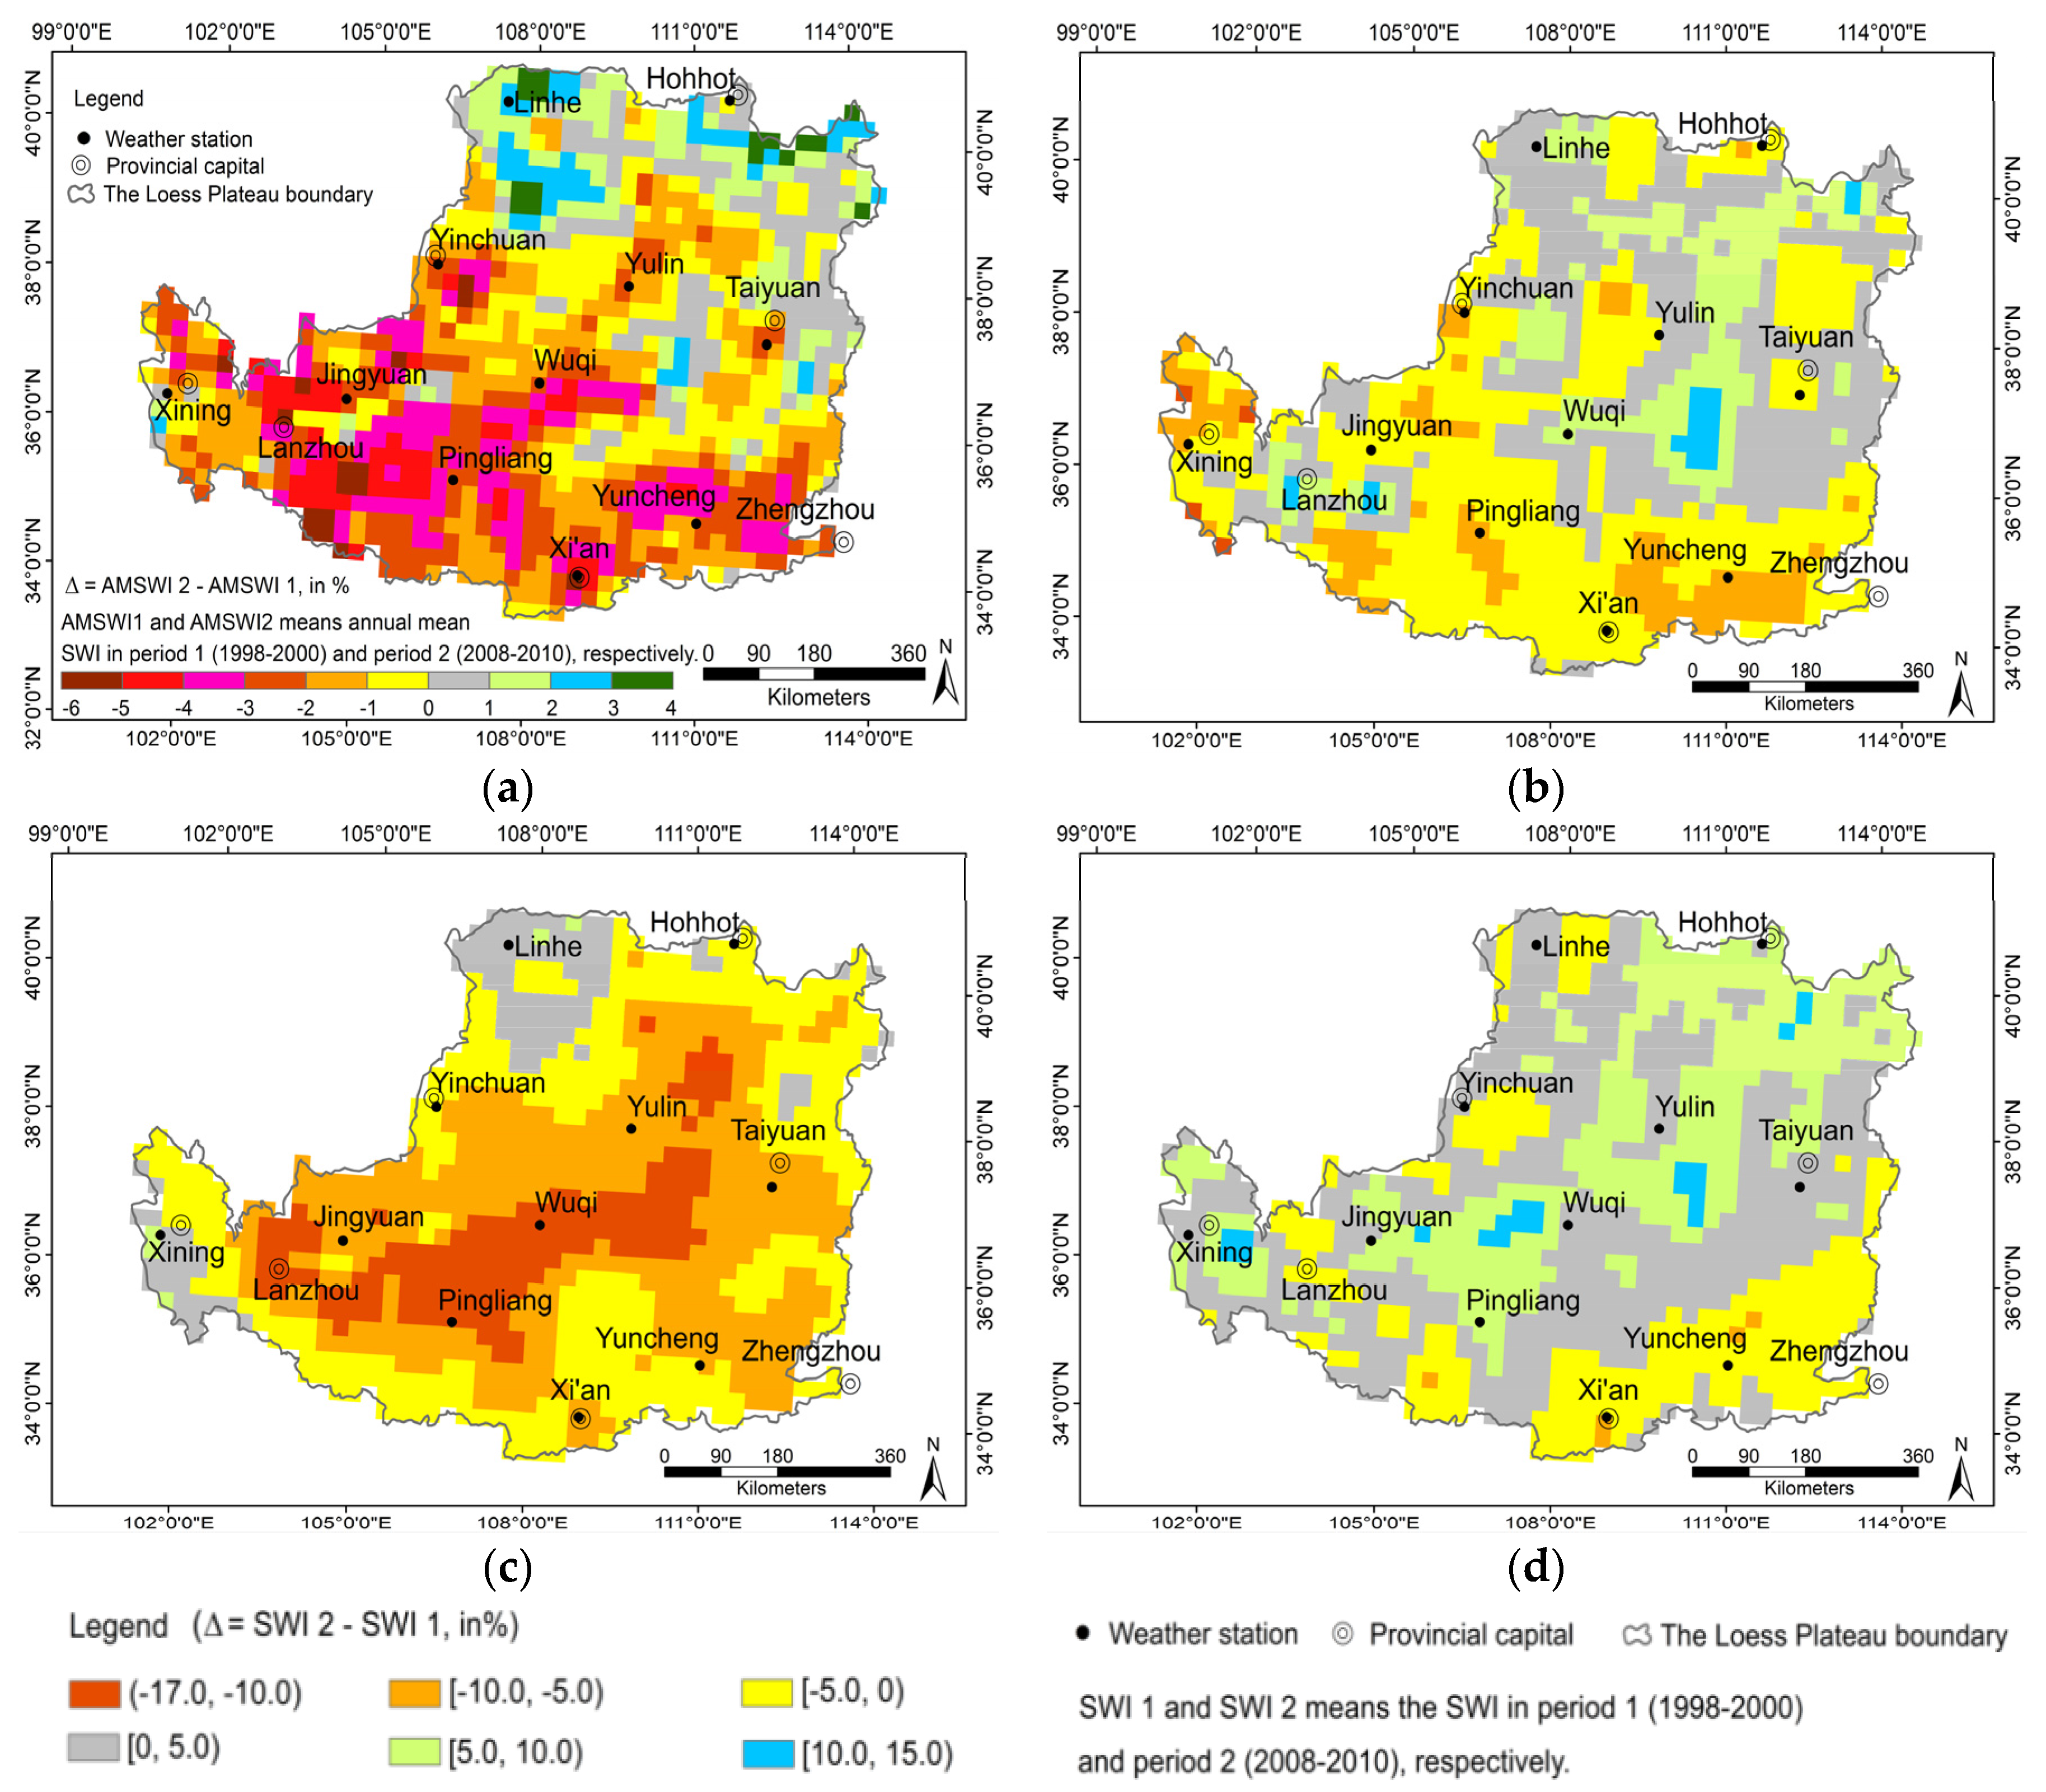
3.3. SWI Change
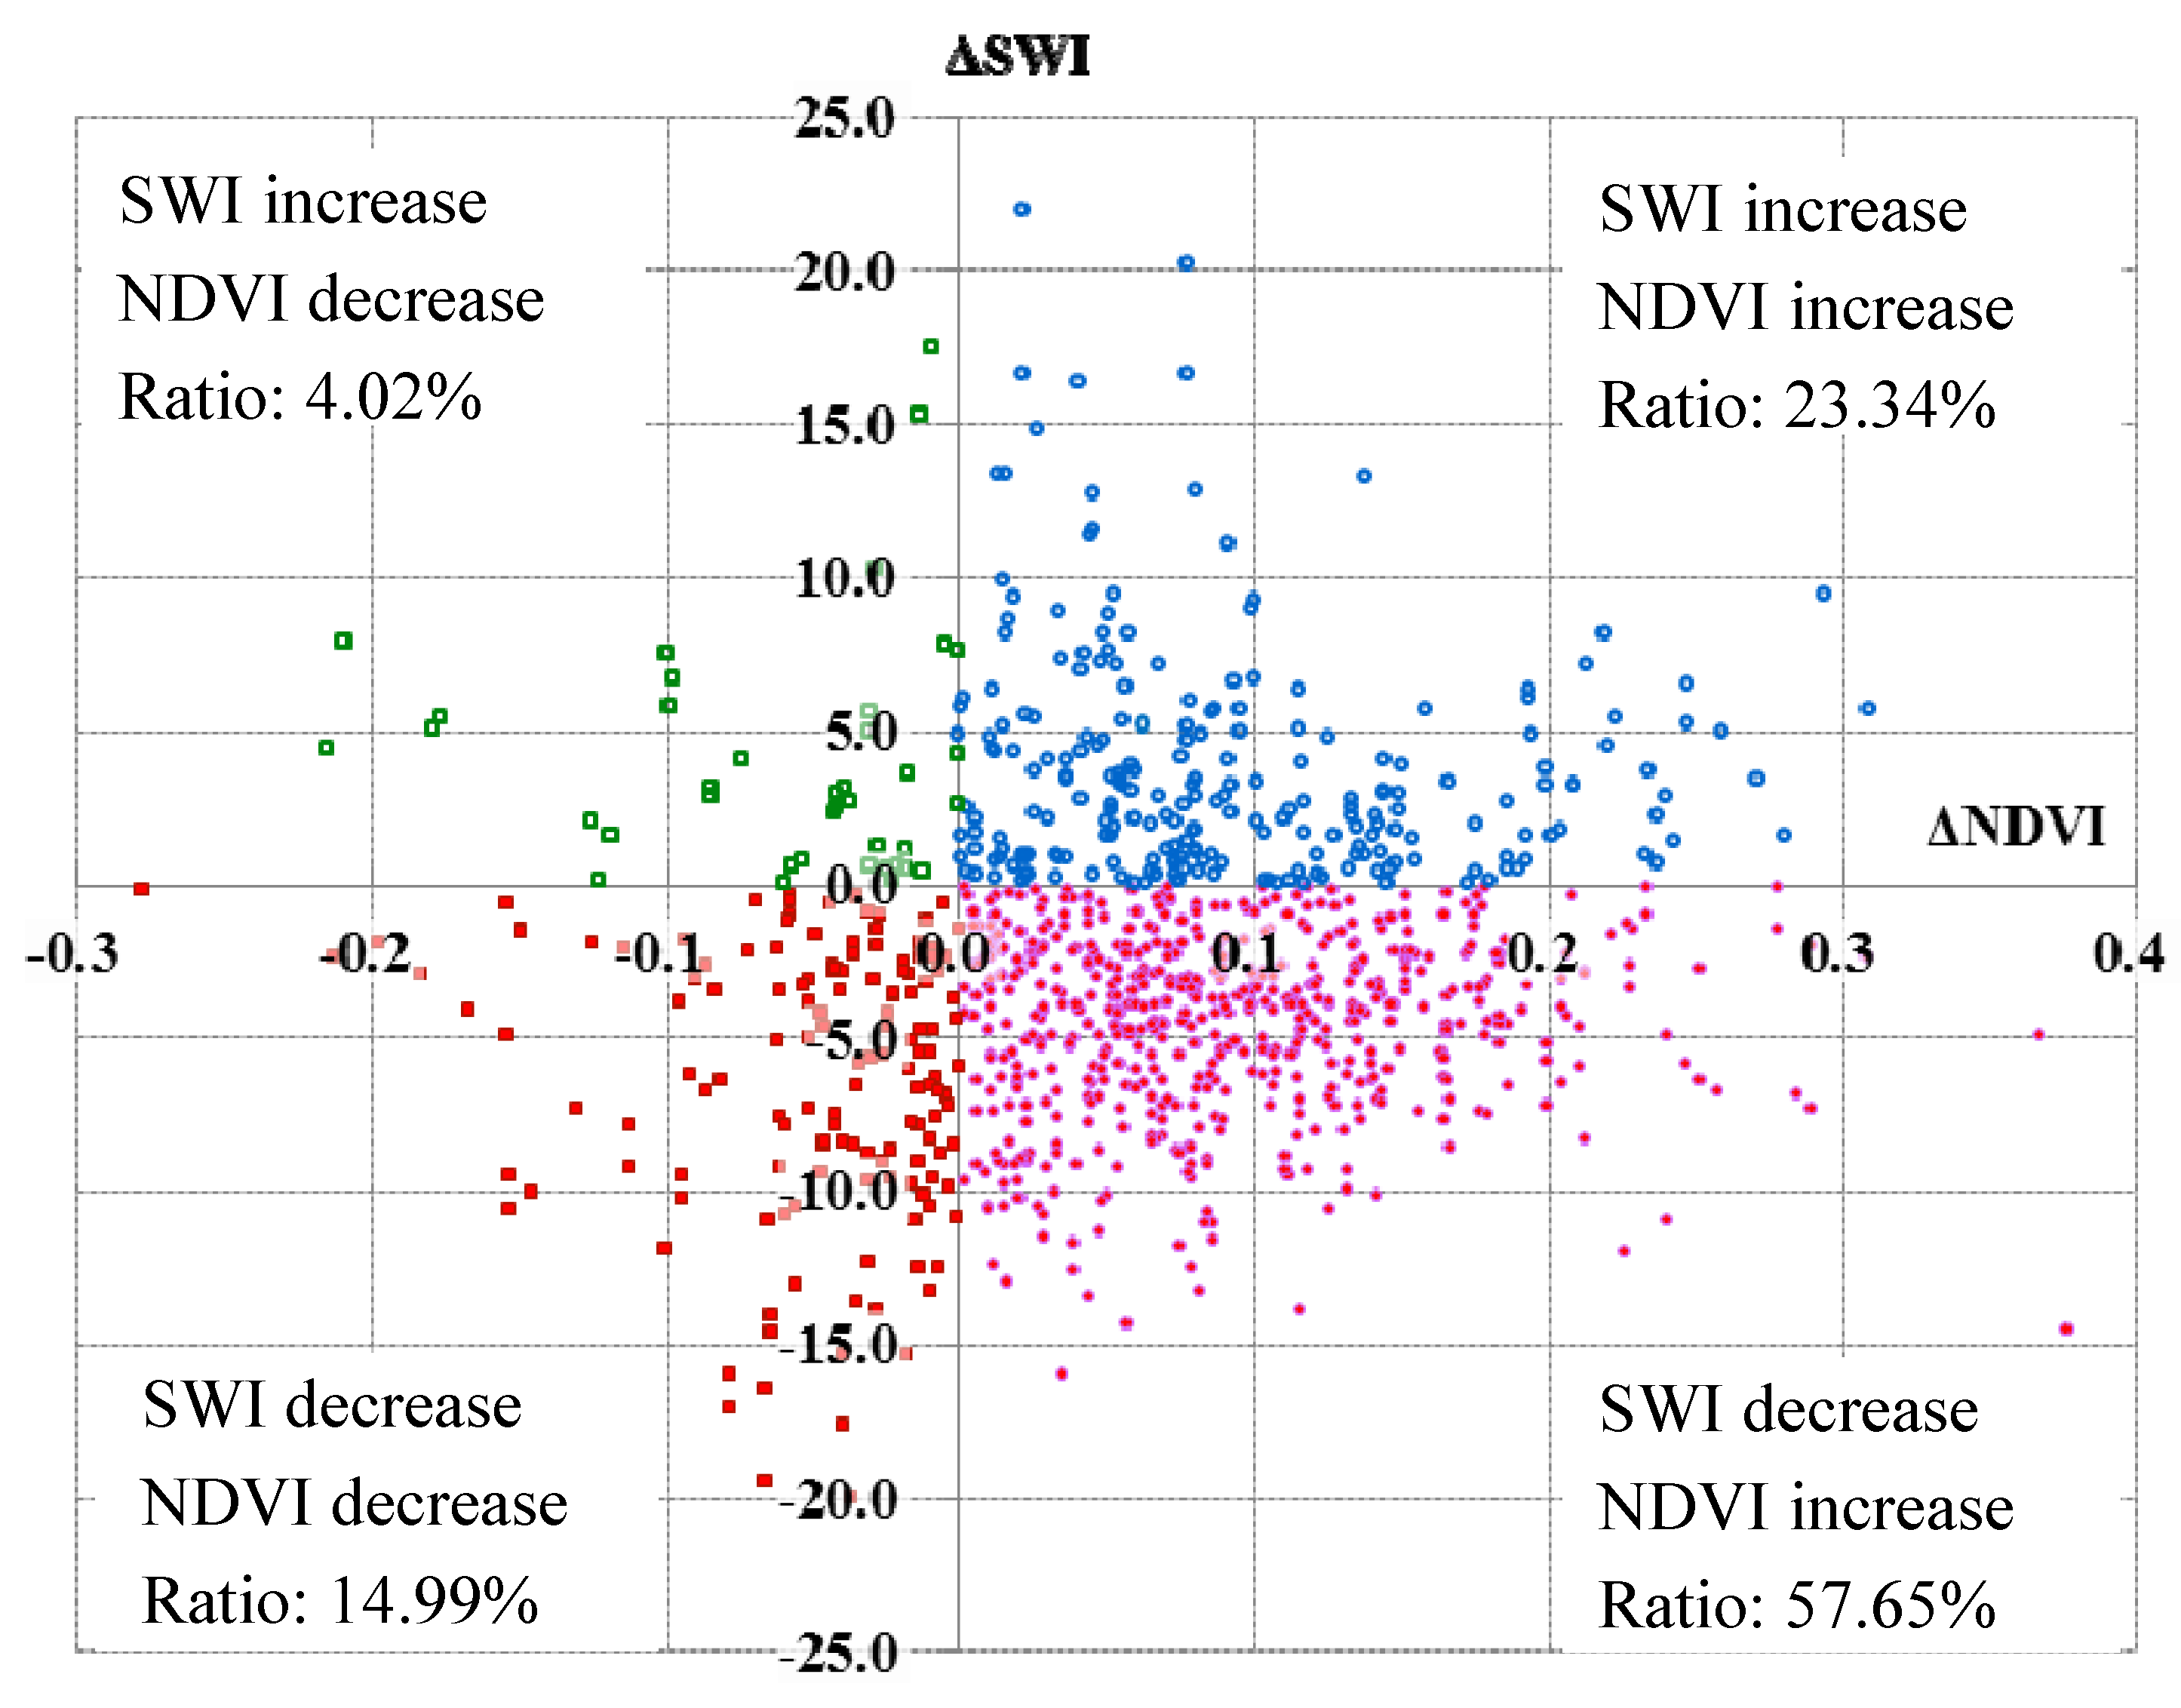
3.4. The Relationship between Changes of NDVI and SWI
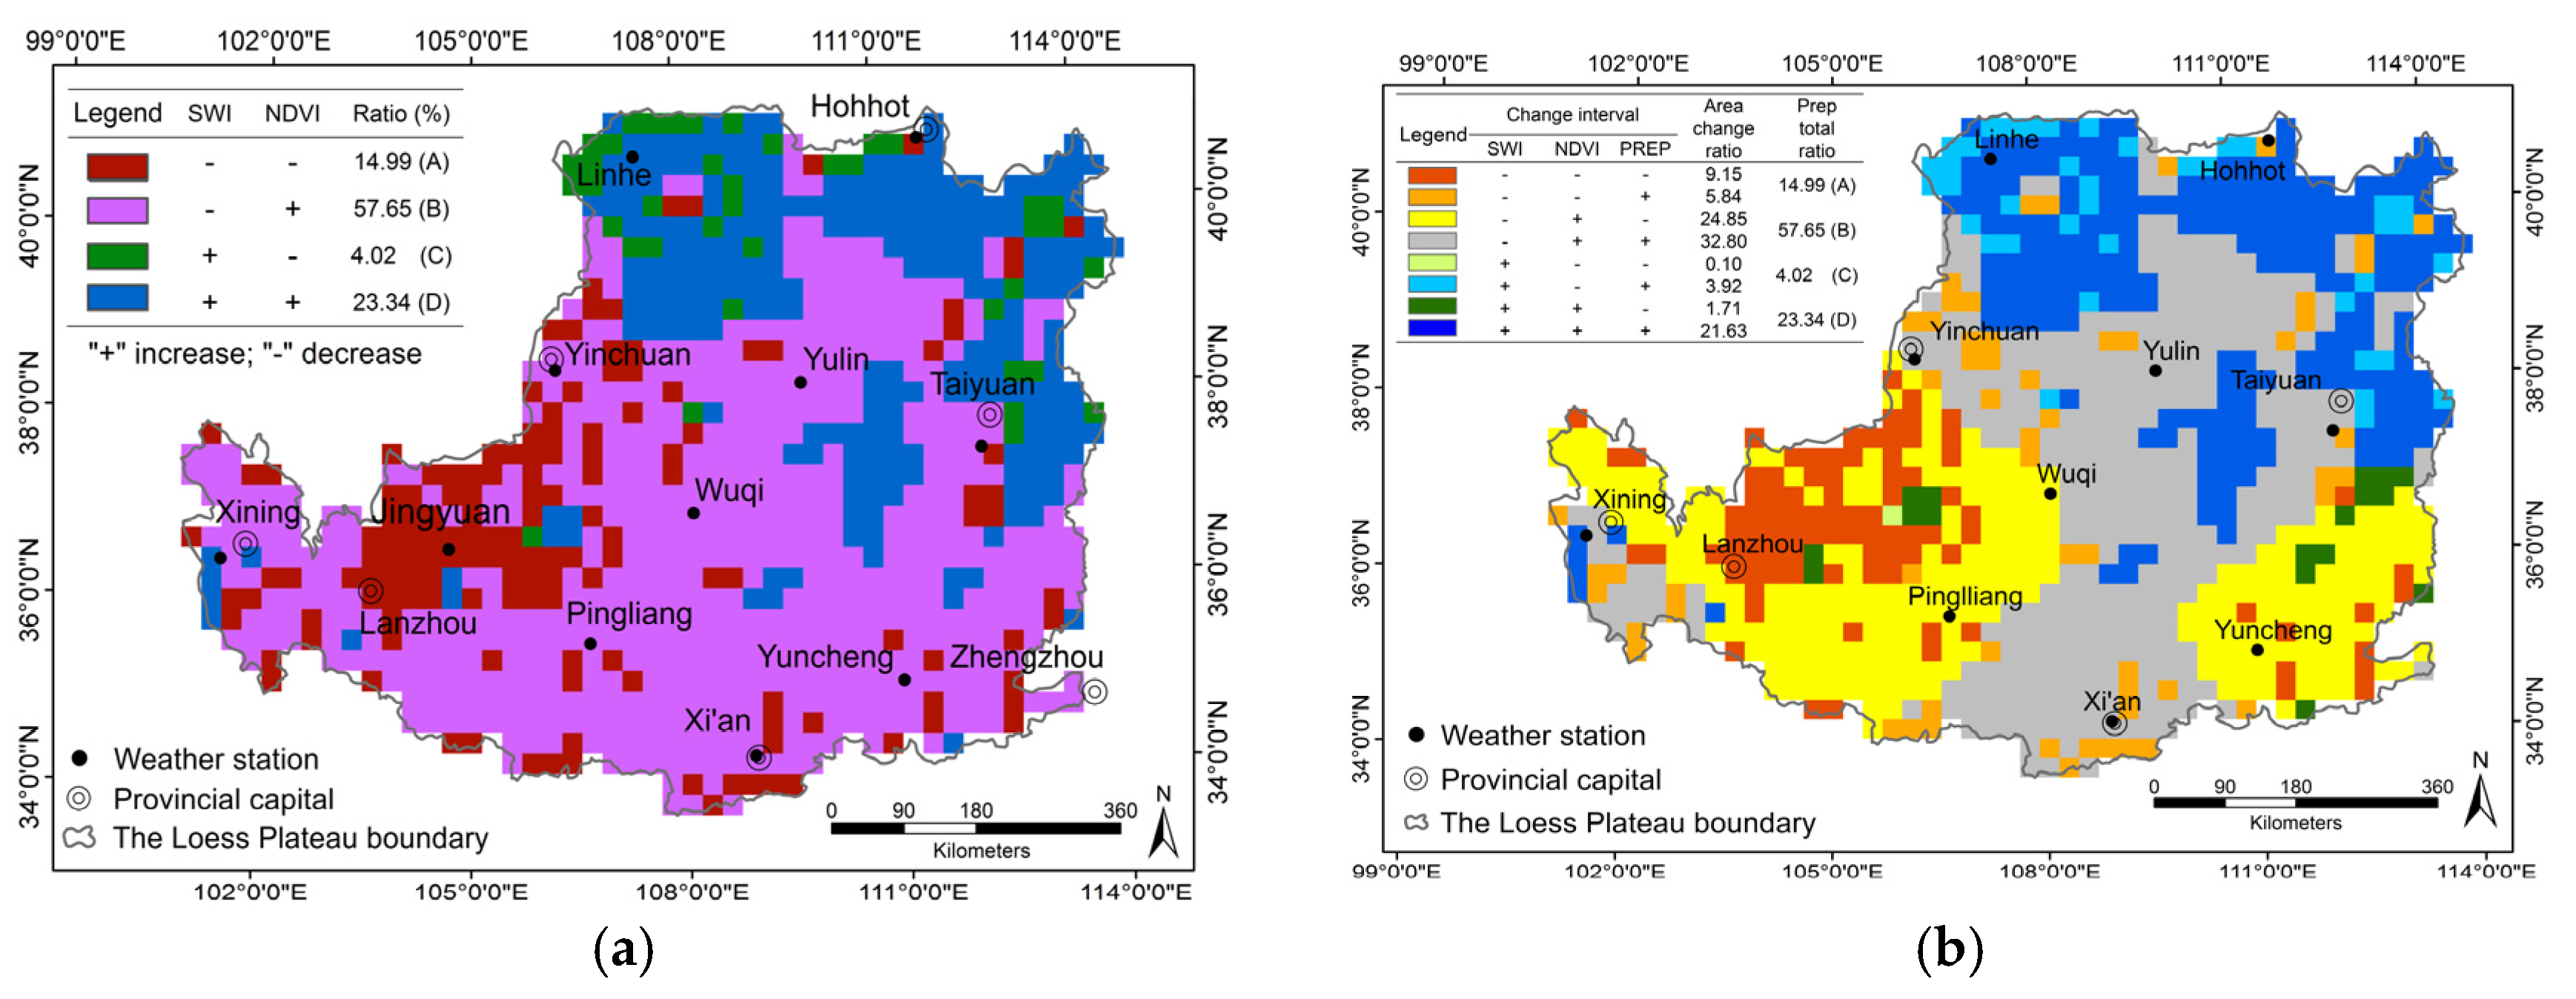
3.5. The Relationship among SWI, NDVI, and Precipitation
4. Discussion
4.1. Increased NDVI and Decreased SWI
4.2. Increased NDVI and SWI
4.3. Decreased NDVI and SWI
4.4. Decreased NDVI and Increased SWI
5. Conclusions
Acknowledgments
Author Contributions
Conflicts of Interest
References
- Li, P. Experimental Studies on the Functional Mechanics of Soil and Water Conservation of Grassland Vegetation in Loess Area. Ph.D. Thesis, Northwest A & F University, Yangling, China, 1 June 2003. [Google Scholar]
- Evans, M.; Warburton, J. Geomorphology of Upland Peat: Erosion, form and Landscape Change; Blackwell Publishing: Chichester, West Sussex, UK, 2007. [Google Scholar]
- Wang, B.; Yang, Q.; Liu, Z.; Meng, Q. Changes of soil erosion intensity due to conversion of farmland to forest and grassland in Yanhe River Basin. Sci. Soil Water Conserv. 2007, 5, 27–33. (In Chinese) [Google Scholar]
- Wang, J.; Jiang, Z.; Xia, Z. Grain-for-green policy and its achievements (Chapter 10). In Restoration and Development of the Degraded Loess Plateau, China; Springer: Berlin, Germany, 2014. [Google Scholar]
- Mu, L.; Liang, Y.; Han, R. Assessment of the soil organic carbon sink in a project for the conversion of farmland to forestland: A case study in Zichang County, Shaanxi, China. PLOS ONE 2014, 9, e94770. [Google Scholar] [CrossRef] [PubMed]
- Yang, G.; Ding, G.; Sun, B.; Zhao, T.; He, K.; He, D. Study on the effects of the project of returning cropland to forest on re-vegetation in loess hilly region-Take Wuqi county in Shaanxi as an example. Res. Soil Water Conserv. 2005, 6, 76–78. (In Chinese) [Google Scholar]
- Wang, L.; Wei, S.; Wu, F. Soil water environment and vegetation growth in the hilly and gully region of the Loess Plateau: A case study of Yangou Catchment. Acta Ecol. Sin. 2009, 29, 1543–1553. (In Chinese) [Google Scholar]
- Wang, Y. Spatial Distribution and Influence Factors of Dried Soil Layers across the Loess Plateau. Ph.D. Thesis, University of Chinese Academy of Sciences, Yangling, China, 1 November 2010. [Google Scholar]
- Zhang, J.; Li, H.; Xu, J. Soil moisture dynamics of water and soil conservation forest on the Loess Plateau. Acta Ecol. Sin. 2011, 31, 71–81. (In Chinese) [Google Scholar]
- Urso, G.; Minacapilli, M. A semi-empirical approach for surfacesoi1 water content estimation from radar data without a-priori information on surface roughness. J. Hydrol. 2006, 321, 297–310. [Google Scholar] [CrossRef]
- Luo, Y.; Xu, J.; Yue, W. Research on vegetation indices based on the remote sensing images. Ecol. Sci. 2005, 24, 75–79. (In Chinese) [Google Scholar]
- Zribi, M.; Pardé, M.; de Rosnay, P.; Baup, F.; Boulain, N.; Descroix, L.; Pellarin, T.; Mougin, E.; Ottlé, C.; Decharme, B. ERS scatterometer surface soil moisture analysis of two sites in the south and north of the Sahel region of West Africa. J. Hydrol. 2009, 375, 253–261. [Google Scholar] [CrossRef] [Green Version]
- Zhou, P.; Ding, J.; Wang, F.; Guljamal, U.; Zhang, Z. Retrieval methods of soil water content in vegetation covering areas based on multi-source remote sensing data. J. Remote Sens. 2010, 14, 959–973. [Google Scholar]
- Guo, Y; Shen, J; Zhao, C. Soil moisture monitoring in agricultural lands via active-passive microwave remote sensing. Chin. J. Eco-Agric. 2011, 19, 1162–1167. (In Chinese) [Google Scholar] [CrossRef]
- Wagner, W.; Lemoine, G.; Rott, H. A method for estimating soil moisture from ERS scatterometer and soil data. Remote Sens. Environ. 1999, 70, 191–207. [Google Scholar] [CrossRef]
- Brocca, L.; Tarpanelli, A.; Moramarco, T.; Melone, F.; Ratto, S.; Cauduro, M.; Ferraris, S.; Berni, N.; Ponziani, F.; Wagner, W.; et al. Soil moisture estimation in alpine catchments through modeling and satellite observations. Vadose Zone J. 2013, 12, 191–207. [Google Scholar] [CrossRef]
- Zhu, X. Soil and Agriculture in Loess Plateau; Agriculture Press: Beijing, China, 1989. (In Chinese) [Google Scholar]
- Peel, M.C.; Finlayson, B.L.; McMahon, T.A. Updated world map of the Köppen–Geiger climate classification. Hydrol. Earth Syst. Sci. 2007, 11, 1633–1644. [Google Scholar] [CrossRef]
- Yang, W.; Yu, C. Regional Control and Evaluation in the Loess Plateau; Science Press: Beijing, China, 1992. (In Chinese) [Google Scholar]
- Scipal, K.; Scheffler, C.; Wagner, W. Soil moisture runoff relation at the catchment scale as observed with coarse resolution microwave remote sensing. Hydrol. Earth Syst. Sci. Discuss. 2005, 2, 417–448. [Google Scholar] [CrossRef]
- Parajka, J.; Naeimi, V.; Blöschl, G.; Komma, J. Matching ERS scatterometer based soil moisture patterns with simulations of a conceptual dual layer hydrologic model over Austria. Hydrol. Earth Syst. Sci. 2009, 13, 259–271. [Google Scholar] [CrossRef]
- Scipal, K. Global Soil Moisture Retrieval from ERS Scatterometer Data. Ph.D. Thesis, Vienna University of Technology, Wien, Austria, 21 May 2002. [Google Scholar]
- Liu, Y.; Parinussa, R.; Dorigo, W.; de Jeu, R.; Wagner, W.; van Dijk, A.; McCabe1, M.; Evans, J. Developing an improved soil moisture dataset by blending passive and active microwave satellite-based retrievals. Hydrol. Earth Syst. Sci. 2011, 15, 425–436. [Google Scholar] [CrossRef] [Green Version]
- Wagner, W.; Lemoine, G.; Borgeaud, M.; Rott, H. A study of vegetation cover effects on ERS scatterometer data. IEEE Trans. Geosci. Remote Sens. 1999, 37, 938–948. [Google Scholar] [CrossRef]
- Fontaine, B.; Louvet, S.; Roucou, P. Fluctuations in annual cycles and inter-seasonal memory in West Africa: Precipitation, soil moisture and heat fluxes. Theor. Appl. Climatol. 2007, 88, 57–70. [Google Scholar] [CrossRef]
- Naeimi, V. Model Improvements and Error Characterization for Global ERS and METOP Scatterometer Soil Moisture Data. Ph.D. Thesis, Vienna University of Technology, Wien, Austria, 5 February 2009. [Google Scholar]
- Wagner, W.; Scipal, K.; Pathe, C.; Gerten, D.; Lucht, W.; Rudolf, B. Evaluation of the agreement between the first global remotely sensed soil moisture data with model and precipitation data. J. Geophys. Res. Atoms. 2003, 108. [Google Scholar] [CrossRef]
- Zhao, D.; Kuenzer, C.; Fu, C.; Wagner, W. Evaluation of the ERS scatterometer-derived soil water index to monitor water availability and precipitation distribution at three different scales in China. J. Hydrometeorol. 2008, 9, 549–562. [Google Scholar] [CrossRef]
- Jiang, C.; Wang, F.; Mu, X.; Li, R. Evaluation of the soil water index and surface soil moisture on the Loess Plateau. J. Irrig. Drain. 2012, 31, 31–36. [Google Scholar]
- Jiao, Q.; Wang, F.; Li, R.; Zhang, W. Application of inversion of European Remote Sensing satellites data to investigation of near-surface soil moisture in Loess Plateau. Acta Pedol. Sin. 2014, 51, 1388–1397. [Google Scholar]
- Cold and Arid Regions Sciences Data Center. Available online: http://westdc.westgis.ac.cn/data/fecdec71-77d1-43c2-b472-8b1c729874cb (accessed on 10 May 2011).
- Vision on Technology (Vito). Available online: http://www.vito-eodata.be/PDF/portal/Application.html#Home (accessed on 30 March 2013).
- China Meteorological Data Sharing Service System. Available online: http://cdc.nmic.cn/home.do (accessed on 13 May 2011).
- Oliver, M.A.; Webster, R. Kriging: A method of interpolation for geographical information systems. Int. J. Geogr. Inf. Syst. 1990, 4, 313–332. [Google Scholar] [CrossRef]
- Holben, B. Characteristics of maximum-value composite images from temporal AVHRR data. Int. J. Remote Sens. 1986, 7, 1417–1434. [Google Scholar] [CrossRef]
- Liu, Q.; Yang, Z.; Cui, B. Spatial and temporal variability of annual precipitation during 1961–2006 in Yellow River Basin, China. J. Hydrol. 2008, 361, 330–338. [Google Scholar] [CrossRef]
- Wang, L.; Shao, M.; Wang, Q.; Jia, Z.; Li, J. Review of research on soil desiccation in the Loess Plateau. Trans. Chin. Soc. Agric. Eng. 2004, 20, 27–31. (In Chinese) [Google Scholar]
- Yang, R.; Fu, B.; Liu, G.; Ma, K. Research on the relationship between water and eco-environment construction in Loess Hilly and Gully Region. Environ. Sci. 2004, 25, 37–42. (In Chinese) [Google Scholar]
- Yang, W. Soil water resources and afforestation in Loess Plateau. J. Nat. Resour. 2001, 16, 433–438. (In Chinese) [Google Scholar]
- Li, P. Study on Effects of Vegetation Restoration on Soil Properties and Qualities in Heidaigou Mine Dump. Master Thesis, Northwest A&F University, Yangling, China, 1 May 2014. [Google Scholar]
- Sun, W.; Song, X.; Mu, X.; Gao, P.; Wang, F.; Zhao, G. Spatiotemporal vegetation cover variations associated with climate change and ecological restoration in the Loess Plateau. Agric. For. Meteorol. 2015, 209–210, 87–99. [Google Scholar] [CrossRef]


| Season | Period | Precipitation (mm) | STD | Coefficient Variation (%) | ||
|---|---|---|---|---|---|---|
| Minimum | Maximum | Mean | ||||
| Spring | 1 | 25.96 | 189.15 | 86.63 | 36.36 | 41.97 |
| 2 | 22.95 | 177.89 | 77.88 | 29.53 | 37.92 | |
| Summer | 1 | 66.87 | 420.32 | 219.92 | 70.51 | 32.06 |
| 2 | 76.65 | 414.59 | 217.18 | 69.25 | 31.89 | |
| Autumn | 1 | 18.89 | 191.69 | 81.32 | 31.20 | 38.37 |
| 2 | 37.85 | 213.73 | 105.91 | 28.49 | 26.90 | |
| Season | Period | NDVI | STD | Coefficient Variation (%) | ||
|---|---|---|---|---|---|---|
| Minimum | Maximum | Mean | ||||
| Spring | 1 | 0.06 | 0.78 | 0.29 | 0.17 | 58.62 |
| 2 | 0.06 | 0.83 | 0.34 | 0.19 | 55.00 | |
| Summer | 1 | 0.08 | 0.82 | 0.45 | 0.18 | 40.22 |
| 2 | 0.09 | 0.89 | 0.52 | 0.20 | 37.69 | |
| Autumn | 1 | 0.08 | 0.82 | 0.38 | 0.17 | 43.42 |
| 2 | 0.09 | 0.84 | 0.47 | 0.18 | 38.51 | |
| Season | Period | SWI (%) | STD | Coefficient Variation (%) | ||
|---|---|---|---|---|---|---|
| Minimum | Maximum | Mean | ||||
| Spring | 1 | 5.52 | 73.36 | 30.28 | 12.57 | 41.51 |
| 2 | 5.84 | 63.31 | 30.48 | 11.38 | 37.34 | |
| Summer | 1 | 13.07 | 79.67 | 48.44 | 12.56 | 25.93 |
| 2 | 10.75 | 82.18 | 42.98 | 13.34 | 31.04 | |
| Autumn | 1 | 13.60 | 80.61 | 49.76 | 13.11 | 26.35 |
| 2 | 13.66 | 81.83 | 52.72 | 12.38 | 23.48 | |
| -- | Change Direction | Area Change Ratio (%) | Prep Total Ratio (%) | SWI Change Ratio (%) | ||
|---|---|---|---|---|---|---|
| SWI | NDVI | PREP | ||||
| 1 | − | − | − | 9.15 | 14.99 A | −7.94 |
| 2 | − | − | + | 5.84 | −3.62 | |
| 3 | − | + | − | 24.85 | 57.65 B | −5.86 |
| 4 | − | + | + | 32.80 | −3.43 | |
| 5 | + | − | − | 0.10 | 4.02 C | 0.13 |
| 6 | + | − | + | 3.92 | 4.02 | |
| 7 | + | + | − | 1.71 | 23.34 D | 1.98 |
| 8 | + | + | + | 21.63 | 3.89 | |
© 2016 by the authors; licensee MDPI, Basel, Switzerland. This article is an open access article distributed under the terms and conditions of the Creative Commons by Attribution (CC-BY) license (http://creativecommons.org/licenses/by/4.0/).
Share and Cite
Jiao, Q.; Li, R.; Wang, F.; Mu, X.; Li, P.; An, C. Impacts of Re-Vegetation on Surface Soil Moisture over the Chinese Loess Plateau Based on Remote Sensing Datasets. Remote Sens. 2016, 8, 156. https://0-doi-org.brum.beds.ac.uk/10.3390/rs8020156
Jiao Q, Li R, Wang F, Mu X, Li P, An C. Impacts of Re-Vegetation on Surface Soil Moisture over the Chinese Loess Plateau Based on Remote Sensing Datasets. Remote Sensing. 2016; 8(2):156. https://0-doi-org.brum.beds.ac.uk/10.3390/rs8020156
Chicago/Turabian StyleJiao, Qiao, Rui Li, Fei Wang, Xingmin Mu, Pengfei Li, and Chunchun An. 2016. "Impacts of Re-Vegetation on Surface Soil Moisture over the Chinese Loess Plateau Based on Remote Sensing Datasets" Remote Sensing 8, no. 2: 156. https://0-doi-org.brum.beds.ac.uk/10.3390/rs8020156