Article

Investigation and Mitigation of the Crosstalk Effect in Terra MODIS Band 30

1
NOAA National Environmental Satellite, Data, and Information Service, Center for Satellite Applications and Research, E/RA3, 5830 University Research Ct., College Park, MD 20740, USA
2
Global Science and Technology, 7855 Walker Drive, Suite 200, Greenbelt, MD 20770, USA
3
Science Systems and Application Inc., 10210 Greenbelt Rd., Suite 600, Lanham, MD 20706, USA
4
Department of Geography and Geoinformation Sciences, George Mason University, 4400 University Drive, Fairfax, VA 22030, USA
*
Author to whom correspondence should be addressed.
Submission received: 1 February 2016 / Revised: 8 March 2016 / Accepted: 11 March 2016 / Published: 16 March 2016

Abstract

:
It has been previously reported that thermal emissive bands (TEB) 27–29 in the Terra (T-) MODerate resolution Imaging Spectroradiometer (MODIS) have been significantly affected by electronic crosstalk. Successful linear theory of the electronic crosstalk effect was formulated, and it successfully characterized the effect via the use of lunar observations as viable inputs. In this paper, we report the successful characterization and mitigation of the electronic crosstalk for T-MODIS band 30 using the same characterization methodology. Though the phenomena of the electronic crosstalk have been well documented in previous works, the novel for band 30 is the need to also apply electronic crosstalk correction to the non-linear term in the calibration coefficient. The lack of this necessity in early works thus demonstrates the distinct difference of band 30, and, yet, in the same instances, the overall correctness of the characterization formulation. For proper result, the crosstalk correction is applied to the band 30 calibration coefficients including the non-linear term, and also to the earth view radiance. We demonstrate that the crosstalk correction achieves a long-term radiometric correction of approximately 1.5 K for desert targets and 1.0 K for ocean scenes. Significant striping removal in the Baja Peninsula earth view imagery is also demonstrated due to the successful amelioration of detector differences caused by the crosstalk effect. Similarly significant improvement in detector difference is shown for the selected ocean and desert targets over the entire mission history. In particular, band 30 detector 8, which has been flagged as “out of family” is restored by the removal of the crosstalk contamination. With the correction achieved, the science applications based on band 30 can be significantly improved. The linear formulation, the characterization methodology, and the crosstalk effect correction coefficients derived using lunar observations are once again demonstrated to work remarkably well.

Graphical Abstract

1. Introduction

Terra (T-) MODerate resolution Imaging Spectroradiometer (MODIS) is a legacy Earth remote sensing instrument that has completed over 15 years of effective on orbit flight, capturing various geophysical changes of Earth in a broad range of spectral wavelengths. The MODIS instrument is a cross track scanning radiometer orbiting the Earth on a sun synchronous polar orbit with an altitude of approximately 705 km [1]. The spectral range varies from the visible blue wavelengths from about 0.4 µm to the far infrared wavelengths of 14.1 µm. Furthermore, the range of data collection is spread over 36 segregated spectral channels also known as spectral bands. In terms of spatial resolution, the data are captured in 250 m, 500 m, and 1 km bands, respectively. Of the 36 bands, 16 bands from 3.1 µm onwards envelope the thermal emissive bands (TEBs), collecting information in a 1 km ground spatial resolution. In order to achieve the traceability to ground based references, MODIS instrument is bestowed with robust on-board calibrators (see Figure 1a). In this paper, we focus on T-MODIS band 30. The calibration is based on a V-grooved blackbody (BB) as shown in Figure 1b, whose temperature measurements were traceable to the National Institute of Standards and Technology (NIST) temperature scales [2]. Further, the MODIS BB is monitored using 12 thermistors, whose locations are roughly shown as well in Figure 1b.
T-MODIS band 30 is one of the four photovoltaic (PV) long wave infrared (LWIR) bands that are contaminated by electronic crosstalk [3]. These four bands are physically located in the LWIR focal plane maintained at a cold temperature of approximately 83 K. Figure 2 shows the physical layout diagram of the various detectors in the LWIR focal plane. In particular, the bands highlighted in yellow are the affected bands. In our previous works [3,4,5,6,7,8,9,10,11], we have investigated and reported the electronic crosstalk phenomena in the T-MODIS PV LWIR bands 27–29 and the mitigation of the same in the Level-1B (L1B) product. The electronic crosstalk was characterized using the regular lunar observations, which are an integral part of the MODIS calibration activity. The phenomena were well understood due to the sharp boundary transition from the dark background and the lunar surface. The contribution of the electronic crosstalk was realized by capturing the extraneous signals at the boundary of the dark background-to-bright moon transitions. Since the physical distance between the sending and receiving bands is known and highlighted by the three dimensional renditions of the lunar surface in terms of the scans and frame distance, the electronic crosstalk was modeled as a linear sum of products for each of the sending bands. This characterization allowed the electronic crosstalk magnitude to be captured effectively, and subsequently used in correcting algorithm.
In the case of band 30, the electronic crosstalk behavior is significantly different from the other affected bands 27–29. Firstly, the crosstalk magnitude is the highest in comparison to the other bands. The problem is quite complex for band 30 because, in addition to the influence on the linear calibration term, the non-linear calibration term is also affected. Together, the effect has caused approximately 1.0–1.5 K long-term drifts along with significant detector-to-detector mismatches. With crosstalk correction coefficients obtained by the lunar observations, it will be demonstrated in this paper that the radiometric fidelity is maintained through the crosstalk correction over the life mission and over varying dynamic ranges.
With the highlighted objective as given above, the rest of the paper is organized as follows. The next section briefly reviews the electronic crosstalk correction algorithm and the crosstalk coefficients as a function of the sending bands (in this case, 27–29). Furthermore, the application of these coefficients in the correction scheme will be explained. The third section will discuss in great detail the impact of the crosstalk correction on the BB calibration. The fourth section will cover the application of the crosstalk correction in the L1B Earth View (EV) imagery on certain typical scenes. Also the impact of the crosstalk correction in terms of long-term radiometric drifts will be addressed. Finally, the paper is closed with a summary of the work.

2. Correction Algorithms and Coefficients

This section is divided into two major subtopics. The first subsection covers the electronic crosstalk phenomena and correction algorithm in general. This is followed up with a discussion on the crosstalk coefficients from the sending bands to the affected band 30.

2.1. Crosstalk Algorithm

Electronic crosstalk is a phenomena describing as the induction of electronic signals from neighboring detectors on the same focal plane array (FPA). In the case of MODIS, the electronic detectors are stacked in an array like formation as shown in Figure 2. There could be crosstalk effect among all neighboring detectors. The crosstalk effect depends on the signal levels of sending bands and is different for different detectors of the receiving band. This means the signals interfering amongst themselves manifest itself as a striping artifact or a ghosting type of pattern depending on the signal levels of the crosstalking bands and the time integration of the recieving signal. The crosstalk effect may also induce a long-term radiometric drift in the receiving band if the crosstalk effect becomes more severe with time. These have been the type of impacts that have been noticed and reported in the previous works [3,4,5,6,7,8,9,10,11].
As mentioned earlier, the moon target serves as a viable source to characterize the electronic crosstalk in MODIS [4]. This is illustrated using examples shown in Figure 3. Figure 3 shows a three dimensional surface of the moon signal for band 30 detector 1 obtained for two time periods (2000 and 2014). The x-axis is frames of the moon acquistion as seen in the space view (SV) port, while the y-axis gives the observations in along scan direction. The z-axis shows primarily the moon signal which is seen by the tall cylinderical structure. For illustration purposes of the crosstalk signal, the z-axis is intentionally truncated to 200 digital number (dn). In the earlier section, it was mentioned that the physical distance of the various bands in the LWIR FPA is known in units of frames; the same information can be used to identify the source of the crostalk sending bands, the amplitude of the same is indicated by the neighboring hills and valley structures as seen in Figure 3. It is quite evident from Figure 3a,b that, for band 30 detector 1, the crosstalk impact is positive early in life and is then negative later in the mission. In addition, the sending bands on careful inspection are identified to be bands 27–29. With these insights, the next paragraph will bring out the formulation of the electronic crosstalk algorithm.
The electronic crosstalk correction algorithm was described in one of our previous works [4] and has been successfully applied to remove the crosstalk effect in Terra bands 27–29 [4,5,8,11]. In this analysis, the same crosstalk correction algorithm is applied to Terra band 30. In the algorithm, the crosstalk effect for each sending band is modeled as a linear function of the band-averaged instrument response with the effective crosstalk coefficient computed as a band-averaged estimate [4,8]. The total crosstalk effect is a sum of the linear functions for all sending bands. In terms of equation, they are given as:
d n B r D r ( F ) = d B r D r m s r ( F ) B s C ( B r , D r , B s ) d n B s D s m s r ( F + Δ F r s ) D s
where dn is the background subtracted digital response, B and D refer to band and detector, r and s correspond to the receiving and sending bands, msr indicates that the dn is the measured response without crosstalk correction, C(Br,Dr,Bs) is the sending band averaged crosstalk coefficient for the crosstalk from band Bs to band Br detector Dr, F is the frame number along the scan, and ΔFrs is frame shift between bands Bs and Br. The crosstalk coefficients can be determined using Equation (1), by setting the left hand side of the equation to zero for the edges of the lunar images. The details about computing the crosstalk coefficients from the lunar observations are clearly described in [4]. With the derived crosstalk coefficients using Equation (1), the application of the dn correction to both the BB and EV responses will be shown later. This means the crosstalk correction is to be applied to BB calibration to correct the crosstalk effect in calibration coefficients and in the L1B code, which is used in retrieving the EV radiances.

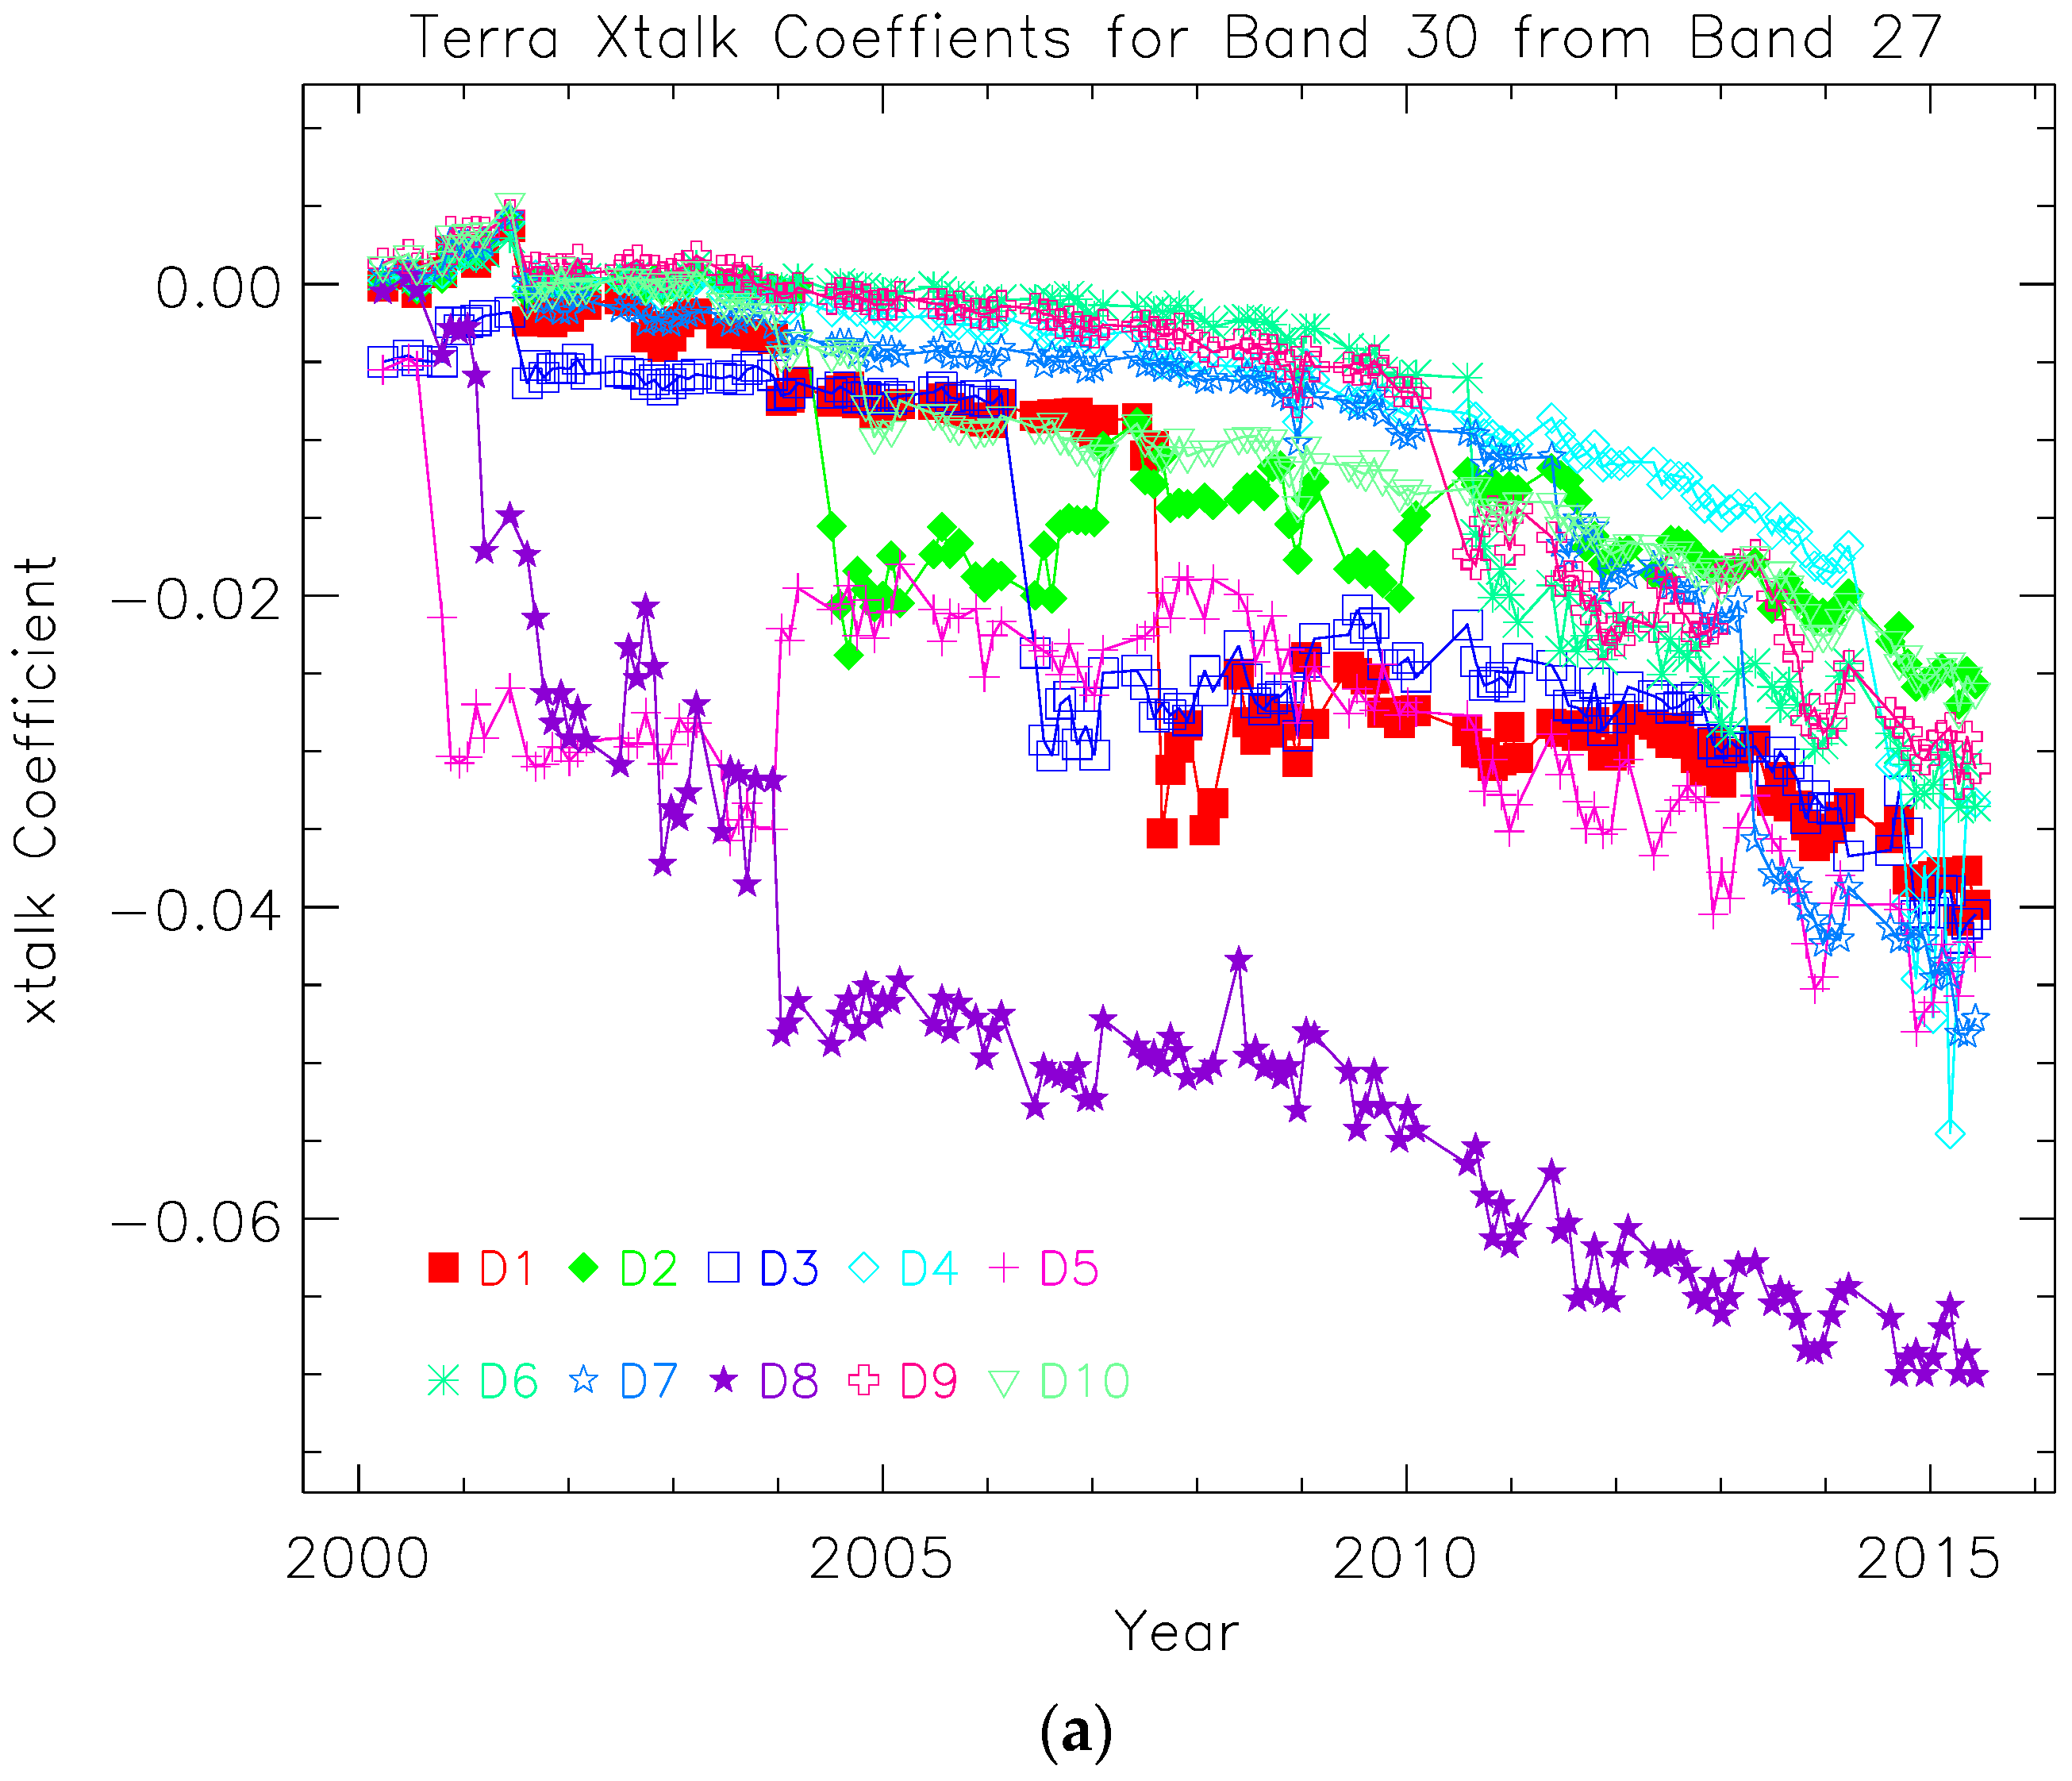
2.2. Crosstalk Coefficients

The fundamental basis for deriving crosstalk coefficients was described in some detail in the previous subsection. In the ensuing pargarphs of this section, a detailed description of the behavior of the crosstalk coefficients is provided.
Figure 4a–c gives the lifetime trending of the crosstalk coefficients for each of the sending bands. Based on the trends, significant observations can be made. In early life, the crosstalk magnitude from each of the sending bands 27–29 appears to be slightly positive for most detectors as exemplified by detector 1. However, over time, along with varying instrument configuration changes [12], and deterioration of the electronic circuits, the crosstalk magnitude have changed directions, showing sudden jumps for different detectors at different time periods. The sudden jumps are also associated with the changes in noise behavior, characterized using the noise equivalent difference temperature (NEdT), for each of these detectors. In some ways, it is consistent with the crosstalk behavior as reported for bands 27–29. Detectors 1, 3, 5, and 8 exhibit the sudden transitions around 2007, 2006, late 2000, and early 2001, respectively. This implies that some unknown changes in the circuits happened at these times and that these changes have impacts on the detectors of all four PV bands since they share the same circuits. However, the impacts may not be the same for all detectors of the four bands and they may not induce sudden jumps due to crosstalk effect in every affected detector. In fact, for the rest of the detectors, the crosstalk coefficients have a slow downward trend, starting out positive and then becoming negative later in the mission. In terms of magnitude, the crosstalk coefficient is the largest for detector 8 from all the three sending bands. The largest magnitude change being a value of approximately −0.15 for sending band 29, while the values are approximately −0.07 and −0.10 for sending bands 27 and 28, respectively. On average (excluding the afore mentioned detectors), the crosstalk coefficient changes are approximately −0.035, −0.05, and −0.06 from the three sending bands 27–29, respectively. Finally, in order to remove uncertainty/drastic jumps in the trends, an annual running average is used while obtaining the long-term characterization.

3. Crosstalk Correction in BB Calibration

The MODIS TEB calibration is well documented in [12]; in the present context, only a brief summary is provided. The TEB calibration is based on a quadratic algorithm that converts the digital response of a TEB detector to its at sensor aperture radiance. In order to perform the conversion, the digital response is first corrected for background, which is represented in digital counts known as dn. The second step is to compute the calibration linear coefficient b1 using the calibrator radiance (LCAL) as observed from the nominally controlled BB temperature. In terms of equation, the BB calibration equation can be given as:
L C A L = a 0 + b 1 d n B B + a 2 d n B B 2
For both MODIS instruments, a BB Warm-Up Cool-Down (WUCD) process on a quarterly basis is implemented to derive the coefficients of the quadratic model, especially the offset term a0 and quadratic term a2. In MODIS Collection 5 (C5) or earlier collections, Equation (2) is fitted to the WUCD measurements without constraint. In MODIS Collection 6 (C6), the term a0 is constrained to be zero and only the linear and quadratic terms are fitted to the measured data. However, in the actual look-up-tables (LUTs), a0 is kept zero for mirror side 1, while the offset for mirror side 2 takes the mirror side difference of the offsets, obtained with fitting without constraint of the two mirror sides as its value in order to avoid the mirror side striping at low temperature range. For T-MODIS C6, the calibration coefficients a0 and a2 for bands 20–25, and 27–36 were derived from BB cool-down (CD) event (315 K–270 K). The rationale behind this is that the above-mentioned fitting strategy tends to be corrected for cold scene biases, compared to the ones used in the C5 [12,13]. Thus, for the rest of the discussions in this section, the CD datasets will be analyzed.

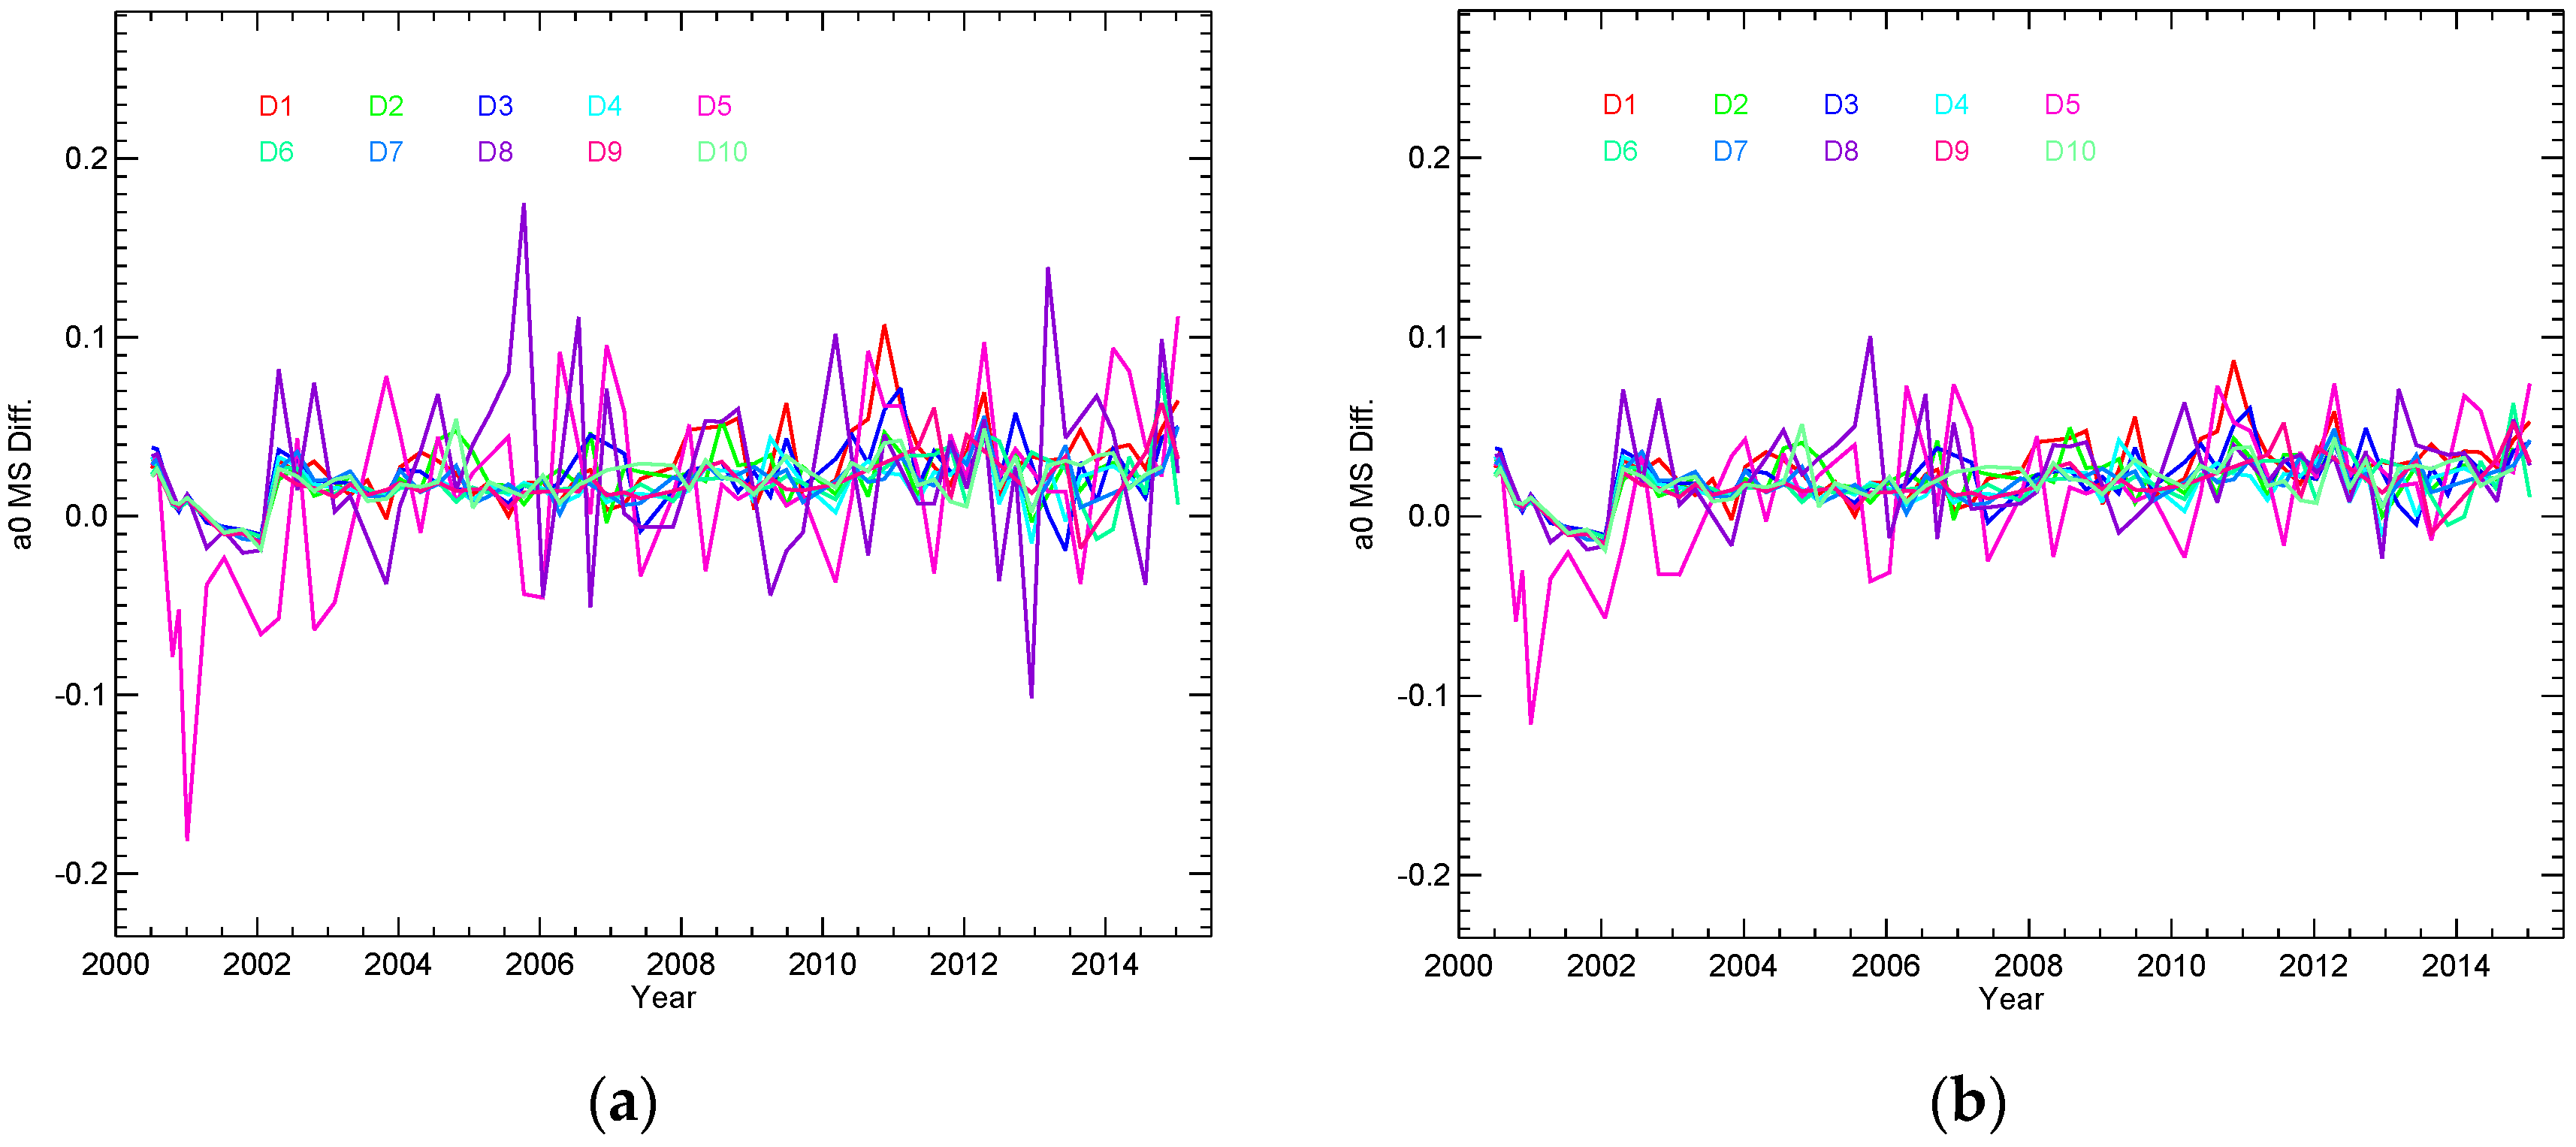
3.1. Impact on Non-Linear Coefficients

The results for the impact on the non-linear coefficients for band 30 are presented in this paragraph. Figure 5a,b summarize the impacts due to the calibration term a0 before and after the crosstalk correction. Since the a0 is forced to be zero for mirror side 1, the mirror side differences in a0 are shown to quantify the improvements of the crosstalk correction. From the trends shown, two detectors 8 and 9 behave in a noisy fashion. In fact, detector 8 has been classified to be an out of family detector in the quality assurance flag in the L1B product. However, these artifacts are removed after the crosstalk correction is applied. For rest of the detectors, the crosstalk correction on the a0 term seems to be minimal. Most importantly, the a2 trends show a definite crosstalk contamination effect on the detector 8 response. Referring to Figure 6a,b, it is evident that this detector had the largest change starting 2001 and has significantly increased to be at least four times larger in magnitude. A large change is observed for detector 8 later in the mission where the a2 term spikes to as high as 4 × 10⁻⁶, which is at least a magnitude larger than those shown after the correction. After the correction, the a2 trend for detector 8 and other detectors seem to be well equalized and stable over the lifetime. They are also significantly reduced with factors varying from 2 to 10.

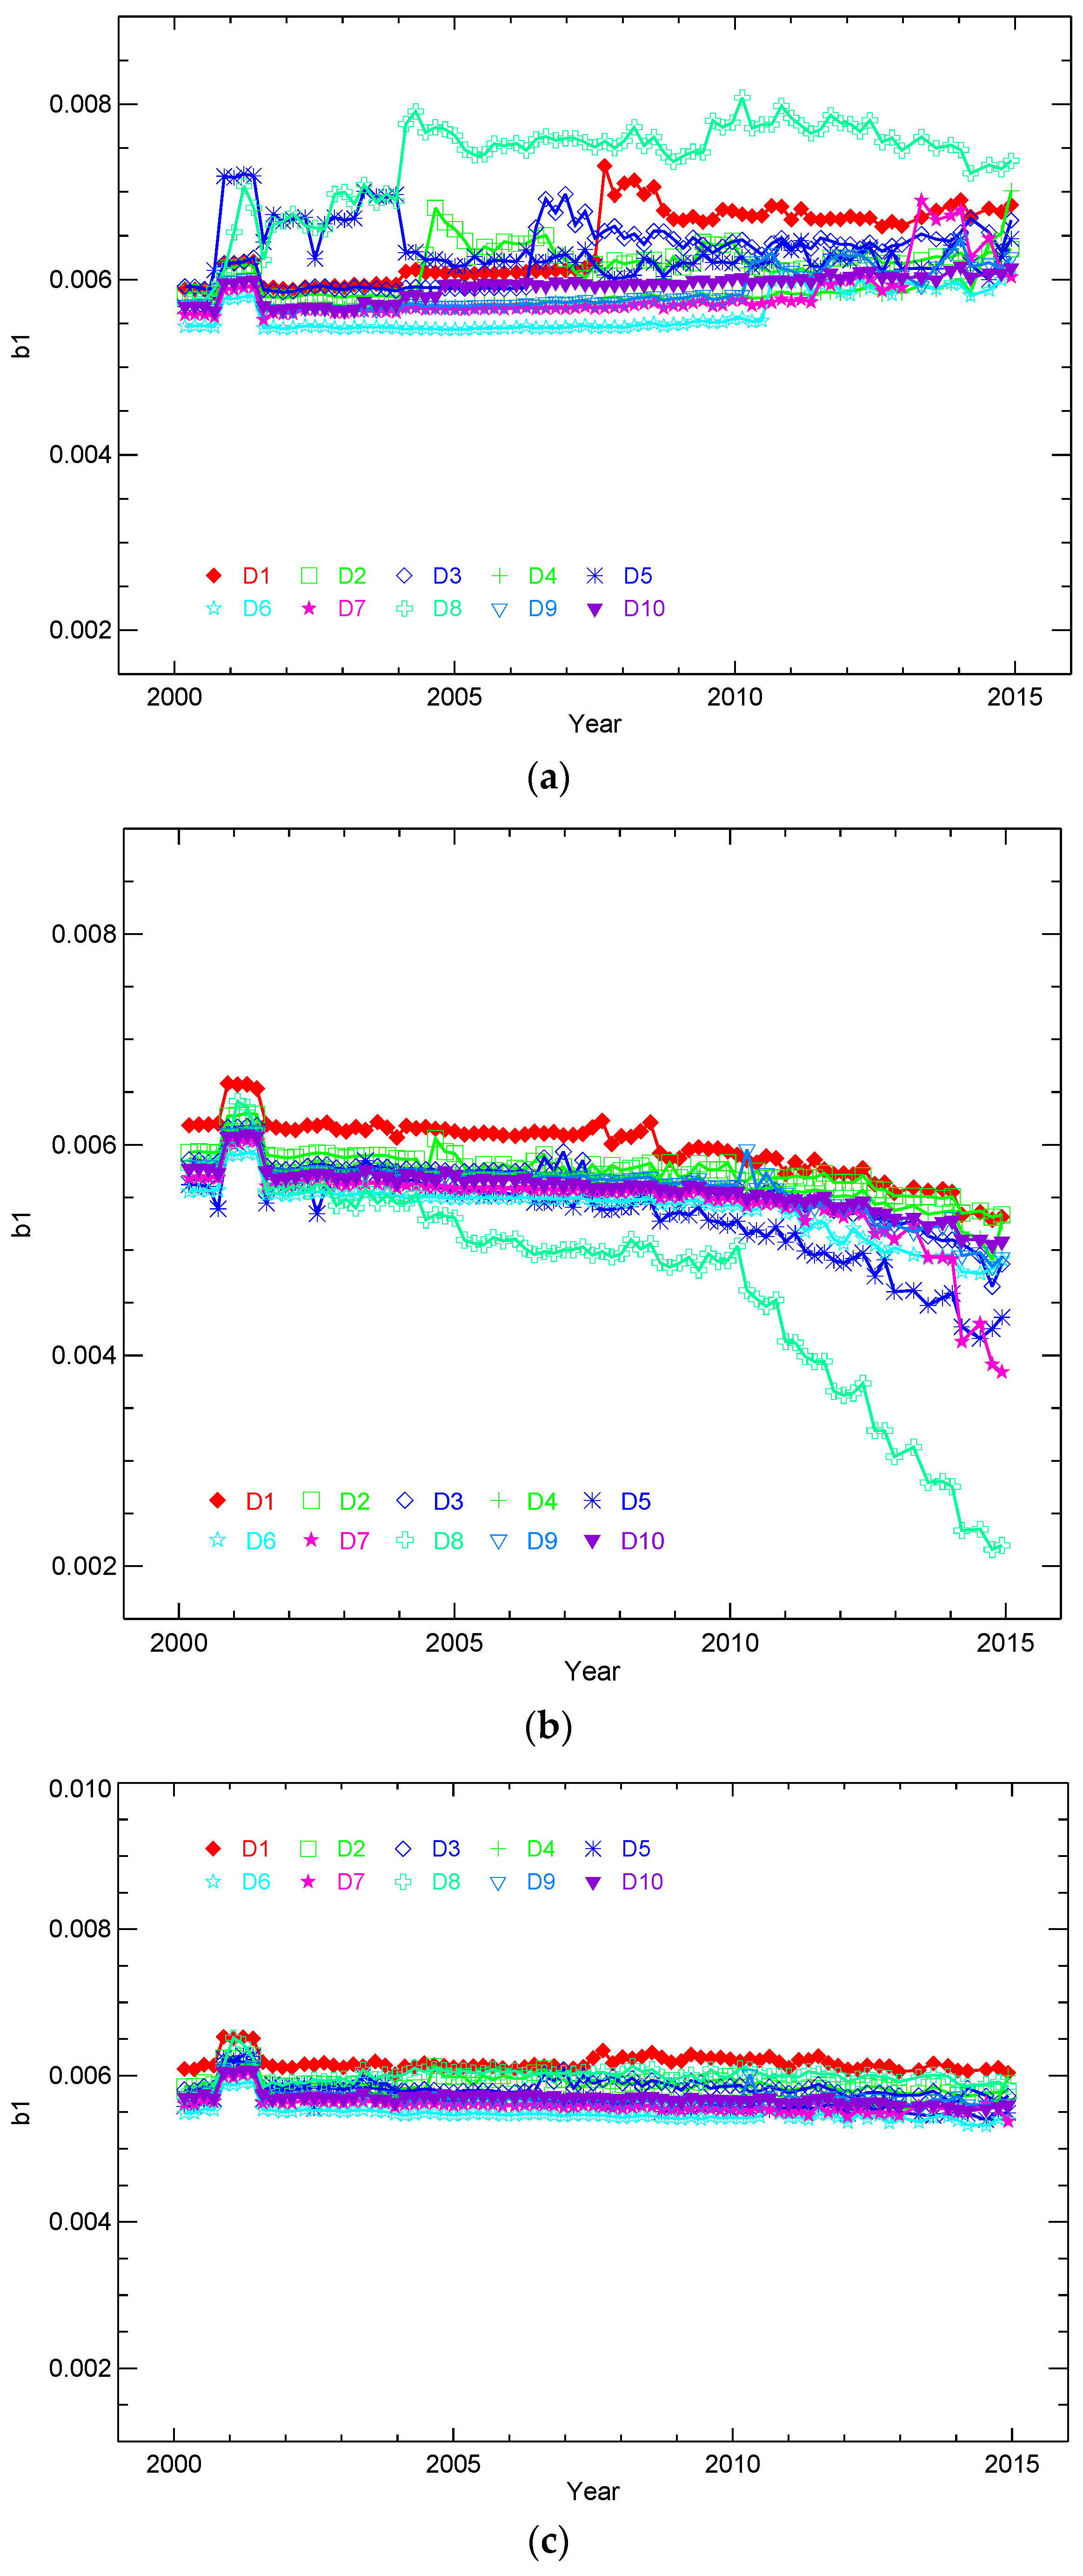
3.2. Impact on Linear Term

As mentioned earlier, the linear term b1 absorbs most of the calibration change and serves as a major player in the impact of the crosstalk correction. In this section, we illustrate the impact on the long-term b1 trends. Figure 7a shows the b1 trends for all detectors of band 30 before the crosstalk correction is applied. The chart shows the b1 trends to vary about 2% or slightly more over the lifetime. In addition, the sudden jumps for each of the detectors in particular detectors 1, 3, 5, and 8 are noted. This is also in coherence with the long-term trends of the crosstalk coefficients as shown in Section 2.2. Figure 7b gives the same b1 trend after the crosstalk correction is applied but only to the b1 term in Equation (2), leaving the a0 and a2 terms uncorrected. This is quite different in comparison to the other crosstalk corrected bands 27–29 where the correction on the b1 term was significant in removing the crosstalk contamination. This is evident from the trends shown in Figure 7b. The crosstalk correction has indeed caused the b1 trends to get overcorrected, in particular, the aforementioned detectors. In addition, the b1 shows a drastic downward trend since 2010, which indicates that the crosstalk severity is quite large since 2010. In order to ensure the radiometric correction is complete, the crosstalk correction was applied in the derivation of a0 and a2 from the regularly scheduled BB WUCD observations. After this was achieved, the corrected a0 and a2 were also incorporated in Equation (2). The b1 estimate after the correction on minor calibration terms is shown in Figure 7c. Compared to Figure 7a,b, the sudden jumps in b1 for the problematic detectors are significantly removed and the long-term changes are essentially flat. This indicates that the detector-to-detector differences are significantly reduced, and responses seem to be greatly equalized. In terms of the impact, the corrected calibration terms a0, a2 and b1 for all the detectors will greatly reduce the striping noise in the EV imagery, as well as significantly improve the long-term radiometric performance. These will be discussed in the next section.

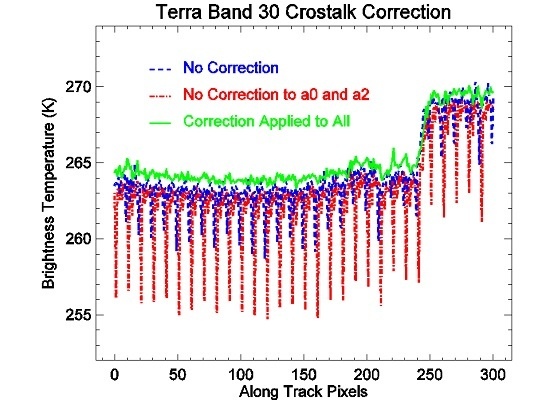
4. Crosstalk Correction in L1B EV Products
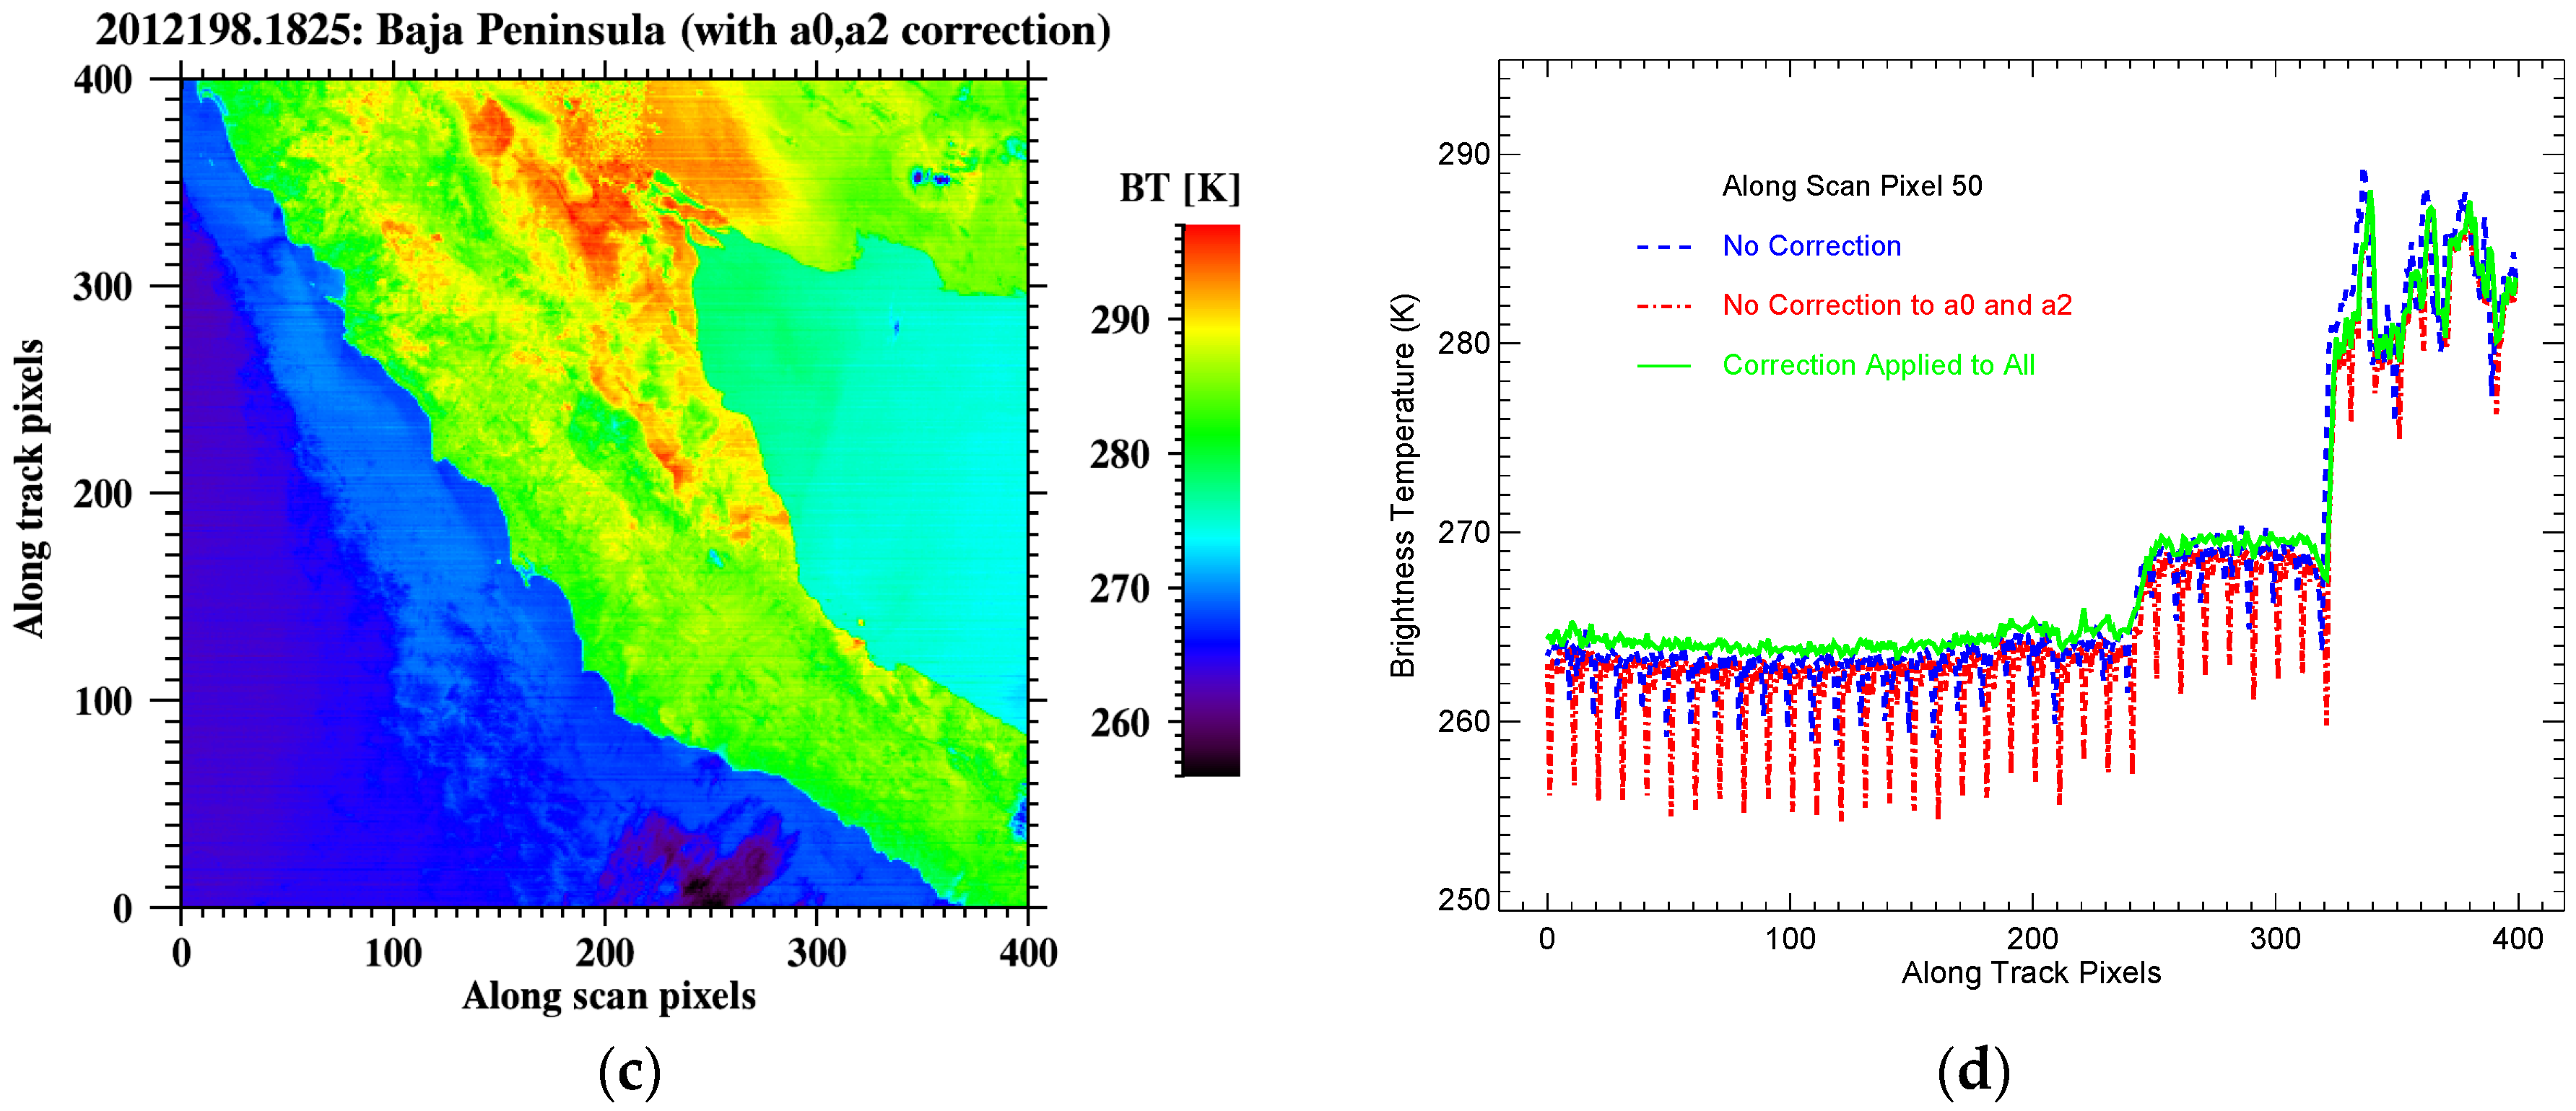
In this section, we present the crosstalk impact on both the EV imagery and the effects on long-term radiometric drifts. In order to quantify the improvements, we select two well-characterized test sites—Libya and the Pacific Ocean. These sites have proven to be useful radiometric test sites of the crosstalk effect from earlier works [5,8].

4.1. EV Imagery

As explained in Section 3, it was noted that the detector-to-detector mismatches in all the calibration terms were significantly reduced after the crosstalk correction. This implies that the strong striping artifact would be removed if the crosstalk coefficients were correct. This subsection is intended as a qualitative and quantitative assessment using the EV imagery. As used in previous crosstalk works, the Baja Peninsula region serves as a great target to study the crosstalk impacts. The unique feature being that Baja Peninsula gives a sharp boundary change from ocean-to-land and from land-to-ocean. Such a contour allows the mitigation of the crosstalk artifacts to be well-analyzed. Figure 8a shows the Baja region from 2012 in terms of retrieved brightness temperature (BT) of band 30 before crosstalk correction is applied. The BT values for this band range from approximately 255 K (ocean surface) to approximately 300 K (land surface). It is quite evident that the detector mismatches in response have manifested into striping noise. Moving to Figure 8b, the crosstalk corrected image is shown for results only based on the crosstalk correction to the linear term b1, while the a0 and a2 terms are left uncorrected. In this scenario, as was observed in Figure 7b, an overcorrection in the detector responses is seen, particularly for detector 8. In the shown image (Figure 8b), the detector-to-detector mismatches seem to be enhanced, thereby causing the striping noise to be of higher intensity. Finally, Figure 8c shows the same Baja Image after the correction is applied to all calibration terms as well as EV radiance. The correction not only removes the striping noise but also significantly increases the visual quality of the completely corrected image. This is quantified using a vertical profile over certain scans from the image and is shown for the three earlier mentioned images by Figure 8d. The plot shows a one line vertical profile at scan index 50 for all three scenes. Based on the charts, the vertical profile before correction (given in blue) shows the detector-to-detector mismatches to be approximately varying from 2.5 K to 3 K. With the crosstalk correction applied to the dominant b1 term only, leaving the a0 and a2 terms uncorrected, the vertical profile (given in red) suggests a dramatic increase in the detector-to-detector mismatches, are increased to about 7.5 K to 8 K. With the corrections applied to all the calibration terms and EV radiance, the striping noise as shown by the green line is reduced to within ±0.5 K. Thus, the qualitative and quantitative study using Baja EV imagery indicates that the crosstalk correction algorithm described by Equation (1) is very good and accurate.

4.2. EV Radiometry

The Pacific Ocean site is an EV target at typical temperature levels for most TEBs, which includes band 30. Figure 9 shows the lifetime band 30 BT trend of the Pacific Ocean site for all detectors. There is an observable seasonal variation from about 271 K to 281 K over 15 years. The trending also reveals an explicit upward drift with a magnitude of about 1.0 K. Figure 10 shows the crosstalk correction in term of temperature for all detectors of the band. The plot reveals that the crosstalk correction is strongly detector dependent and increases with time, which is consistent with the performance of the crosstalk coefficients shown in Figure 4. It is also seasonally dependent. It is understandable since the signal strengths of the sending bands vary with seasons. For all detectors, the crosstalk correction is within 3.7 K over the mission time. On average, the crosstalk correction removes the long-term drift by about –1.0 K and is shown by the dark solid line. Large crosstalk correction is received for detector 8, which is the exception as noted earlier. The band averaged BT before and after crosstalk correction is presented in Figure 11 with dotted and solid lines, respectively. Based on the trends, the crosstalk correction removes the long-term upward trend by about 1 K and essentially makes the trending flat. This is expected in a typical ocean site such as the Pacific Ocean. Figure 12 presents the detector-to-detector differences before and after the crosstalk correction is applied. Based on Figure 12a,b, the detector-to-detector differences are significantly reduced to be within ±0.5 K for all detectors. This effectively reduces the striping artifacts in the crosstalk corrected imagery for band 30.
The Libya 1 desert site is a geographically and spectrally different in comparison to the Pacific Ocean site. In general, a desert site has drastic seasonal changes in terms of temperatures over a stable site such as the Pacific Ocean. Figure 13 shows the long-term trending of BT responses for band 30 over the Libya 1 desert. The measured temperatures vary seasonally between 261 K and 292 K over the mission time of T-MODIS. After close scrutiny, the BT trends show a slight upward drifting by about 1.6 K noted in the recent years from 2005. Similar to Figure 10, Figure 14 gives the amount of crosstalk correction in terms of temperature for all the detectors. As seen earlier, the noisy detectors 1, 3, 5, and 8 show large downward deviation, the largest being detector 8, which shows a long-term change of approximately –3.0 K. On average, the long-term crosstalk correction is approximately –1.6 K. Figure 15 shows the band averaged before and after crosstalk-corrected BT trends. The dotted line gives the trends before correction, while the solid lines represents the crosstalk corrected long-term temperatures. The correction amount is approximately –1.6 K with a maximum value of –2 K. The correction, in turn, removes the upward drift, which was noticed before correction. The detector-to-detector mismatches in terms of BT are shown in Figure 16. From Figure 16a, it is deduced that the detector-to-detector differences are varying roughly between –1 K and +2.5 K. With the crosstalk correction applied, these detector-to-detector differences are significantly reduced, more or less within ±0.5 K, as was the case with the Pacific Ocean site.
The analysis from both Pacific Ocean and Libya 1 confirms the long-term radiometric drift due to electronic crosstalk. Through the crosstalk correction algorithm that was shown in Section 2, the test sites were corrected for the contamination. Both sites confirmed the radiometric correction amounts by approximately 1–1.6 K. This further indicates that the crosstalk is systematic in nature for the dynamic of 261 K to 292 K. With the crosstalk correction, the retrieved top of atmosphere (TOA) BT for T-MODIS band 30 are indeed flat and within expectations of the long-term changes as observed on a decadal time scale.
The long-term drifts in Earth view BT may not be induced by the crosstalk effect. It could be induced by other environmental changes as well. Nevertheless, the crosstalk effect definitely induces long-term drifts in Terra band 30 as shown in this analysis as well as in Terra bands 27–29 as has been demonstrated in our previous works [5,8,11]. It is also difficult to justify that the ocean temperature changes 1 K in a decade. In fact, the long-term drifts in Terra band 27 are much larger, which are more than 5 K. In reference [5], we have shown that the long-term drift was induced by the crosstalk effect and that the crosstalk correction removed the drift via an inter-sensor comparison between Terra band 27 Earth view brightness temperature and that of the Infrared Atmospheric Sounding Interferometer (IASI).

5. Conclusions

The work reports the investigation and mitigation of the electronic crosstalk in the T-MODIS LWIR band 30. Similar to the previous works for bands 27–29, the crosstalk effect and algorithm have been established using the regularly scheduled lunar observations. The crosstalk coefficient magnitude reported shows that the crosstalk magnitude is indeed the largest for band 30 in comparison to the other affected LWIR bands. It is further observed that the crosstalk has severely affected detector 8, which is classified as an “out of family” detector in the L1B quality assurance. With the robust characterization of the electronic crosstalk coefficients, the correction of the same is applied on two fronts. Firstly, the correction is applied not only on the major calibration term b1 but also the minor terms a0 and a2. The strong impact of the minor calibration terms is a new result not present in previously reported crosstalk work. Once the correction is applied on all the calibration terms, the effective b1 coefficient is significantly improved, making the sudden jumps in certain detectors such as 1, 3, 5 and 8 be significantly removed, also removing the long-term drifts for all detectors. The detector-to-detector b1 are well equalized, indicating a strong reduction of the striping noise. This is confirmed and demonstrated using the Baja Peninsula test site. In particular, the response of detector 8 is restored as a normal functioning detector. There is a recommendation that when the crosstalk correction is applied in future MODIS collection, the quality assurance of this detector be un-flagged from “out of family” and be considered as “in family”. Further, the analysis is extended to two well-characterized test sites. Both the Pacific Ocean and Libya 1 desert sites showed a removal of the long-term radiometric drift by about 2 K. This restored the trends to be essentially flat or changing in a slow fashion, as is expected in most geophysical variable measurements. The work presented significantly closes a complete story on the electronic crosstalk in T-MODIS, and the results present will definitely help serve similar crosstalk type issues in other remote sensing instruments.

Acknowledgments

The views, opinions, and findings contained in this paper are those of the authors and should not be construed as an official NOAA or U.S. Government position, policy, or decision.

Author Contributions

Junqiang Sun is the chief investigator of this topic and is responsible for the formulation and application of the crosstalk analysis using the Moon. Sriharsha Madhavan is a co-investigator of this topic and has been working with Sun throughout the development of this topic. Menghua Wang has provided vital support for this work.

Conflicts of Interest

The authors declare no conflict of interest.

References

  1. Xiong, X.; Chiang, K.; Esposito, J.; Guenther, B.; Barnes, W. MODIS On-Orbit Calibration and Characterization. Metrologia 2003, 40, 89–92. [Google Scholar] [CrossRef]
  2. Xiong, X.; Butler, J.; Wu, A.; Chiang, V.; Efremova, B.; Madhavan, S.; Mcintire, J.; Oudrari, H. Comparison of MODIS and VIIRS onboard blackbody performance. Proc. SPIE 2012, 8533. [Google Scholar] [CrossRef]
  3. Sun, J.; Madhavan, S.; Wenny, B.; Xiong, X. Terra MODIS band 27 electronic crosstalk: Cause, impact, and mitigation. Proc. SPIE 2011, 8176. [Google Scholar] [CrossRef]
  4. Sun, J.; Xiong, X.; Madhavan, S.; Wenny, B.N. Terra MODIS Band 27 Electronic Crosstalk Effect and Its Removal. IEEE Trans. Geosci. Remote Sens. 2014, 52, 1551–1561. [Google Scholar]
  5. Sun, J.; Xiong, X.; Li, Y.; Madhavan, S.; Wu, A.; Wenny, B.N. Evaluation of Radiometric Improvements with Electronic Crosstalk Correction for Terra MODIS Band 27. IEEE Trans. Geosci. Remote Sens. 2014, 52, 6497–6507. [Google Scholar]
  6. Madhavan, S.; Sun, J.; Xiong, X.; Wenny, B.N.; Wu, A. Statistical Analysis of the Electronic Crosstalk Correction in Terra MODIS Band 27. Proc. SPIE 2014, 9218. [Google Scholar] [CrossRef]
  7. Sun, J.; Madhavan, S.; Xiong, X.; Wang, M. Electronic crosstalk correction for terra long wave infrared photovoltaic bands. Proc. SPIE 2014, 9264. [Google Scholar] [CrossRef]
  8. Sun, J.; Madhavan, S.; Xiong, X.; Wang, M. Investigation of the Electronic Crosstalk in Terra MODIS Band 28. IEEE Trans. Geosci. Remote Sens. 2015, 53, 5722–5733. [Google Scholar]
  9. Sun, J.; Madhavan, S.; Xiong, X.; Wang, M. Electronic crosstalk in Terra MODIS thermal emissive bands. Proc. SPIE 2015, 9607. [Google Scholar] [CrossRef]
  10. Madhavan, S.; Xiong, X.; Sun, J.; Chiang, K.; Wu, A. Electronic crosstalk characterization of Terra MODIS long wave infrared channels. Proc. SPIE 2015, 9607. [Google Scholar] [CrossRef]
  11. Sun, J.; Madhavan, S.; Xiong, X.; Wang, M. Long-term trend induced by Electronic Crosstalk in Terra MODIS Band 29. J. Geophys. Res. Atmos. 2015, 120, 9944–9954. [Google Scholar] [CrossRef]
  12. Xiong, X.; Wu, A.; Wenny, B.N.; Madhavan, S.; Wang, Z.; Li, Y.; Chen, N.; Barnes, W.; Salomonson, V. Terra and Aqua MODIS Thermal Emissive Bands on-orbit Calibration and Performance. IEEE Trans. Geosci. Remote Sens. 2015, 53, 5709–5721. [Google Scholar] [CrossRef]
  13. Wenny, B.N.; Xiong, X.; Madhavan, S. Evaluation of Terra and Aqua MODIS thermal emissive band calibration consistency. Proc. SPIE 2012, 8533. [Google Scholar] [CrossRef]
Figure 1. (a) instrument setup with on-board calibrators; (b) v-grooved BlackBody controlled using various thermistors.
Remotesensing 08 00249 g001
Figure 2. MODIS LWIR focal plane.
Remotesensing 08 00249 g002
Figure 3. Lunar response of Terra band 30 detector 1: (a) 15 December 2000; (b) 11 December 2014.
Remotesensing 08 00249 g003
Figure 4. Terra MODIS band 30 crosstalk coefficients: (a) sending band 27; (b) sending band 28; (c) sending band 29.
Remotesensing 08 00249 g004aRemotesensing 08 00249 g004b
Figure 5. Mirror side difference of the calibration offset term obtained from the fitting without the constraint that a0 is kept 0 for band 30: (a) before the crosstalk correction; (b) after the crosstalk correction.
Remotesensing 08 00249 g005
Figure 6. The a2 calibration terms for band 30: (a) before the crosstalk correction; (b) after the crosstalk correction.
Remotesensing 08 00249 g006
Figure 7. Terra band 30 b1 for individual detectors: (a) no correction for both WUCD and routine BB calibration; (b) the correction only applied to routine BB calibration; and (c) the correction applied to both WUCD and routine BB calibration.
Remotesensing 08 00249 g007
Figure 8. Crosstalk induced striping and the striping removal in BT of Terra MODIS band 30 at Baja peninsula in 2012: (a) C6 BT before crosstalk correction; (b) C6 BT with crosstalk correction but no crosstalk correction applied in a0 and a2; (c) C6 BT with crosstalk correction applied to a0, a2, b1, and EV; and (d) profiles along track direction for all three cases.
Remotesensing 08 00249 g008aRemotesensing 08 00249 g008b
Figure 9. Terra MODIS band 30 C6 brightness temperature at Pacific Ocean.
Remotesensing 08 00249 g009
Figure 10. Crosstalk correction for Terra MODIS band 30 at Pacific Ocean.
Remotesensing 08 00249 g010
Figure 11. Terra MODIS band 30 band-averaged brightness temperature at Pacific Ocean before and after crosstalk correction.
Remotesensing 08 00249 g011
Figure 12. Terra MODIS band 30 detector difference at Pacific Ocean: (a) before crosstalk correction; (b) after crosstalk correction.
Remotesensing 08 00249 g012
Figure 13. Terra MODIS band 30 C6 brightness temperature at Libya 1.
Remotesensing 08 00249 g013
Figure 14. Crosstalk correction for Terra MODIS band 30 at Libya 1.
Remotesensing 08 00249 g014
Figure 15. Terra MODIS band 30 band-averaged brightness temperature at Libya 1 before and after crosstalk correction.
Remotesensing 08 00249 g015
Figure 16. Terra MODIS band 30 detector difference at Libya 1: (a) before crosstalk correction; (b) after crosstalk correction.
Remotesensing 08 00249 g016

