Article

Spectral Dependent Degradation of the Solar Diffuser on Suomi-NPP VIIRS Due to Surface Roughness-Induced Rayleigh Scattering

1
Department of Astronomy, University of Maryland, College Park, MD 20742, USA
2
NOAA (National Oceanic and Atmospheric Administration)/NESDIS (National Environmental Satellite, Data, and Information Service)/STAR (Center for Satellite Applications and Research), NCWCP, E/RA2, 5830 University Research Ct., College Park, MD 20740, USA
3
Department of Physics, University of Maryland, College Park, MD 20742, USA
*
Author to whom correspondence should be addressed.
Submission received: 20 November 2015 / Revised: 8 February 2016 / Accepted: 11 March 2016 / Published: 17 March 2016
(This article belongs to the Collection Visible Infrared Imaging Radiometers and Applications)

Abstract

:
The Visible Infrared Imaging Radiometer Suite (VIIRS) onboard Suomi National Polar Orbiting Partnership (SNPP) uses a solar diffuser (SD) as its radiometric calibrator for the reflective solar band calibration. The SD is made of Spectralon™ (one type of fluoropolymer) and was chosen because of its controlled reflectance in the Visible/Near-Infrared/Shortwave-Infrared region and its near-Lambertian reflectance property. On-orbit changes in VIIRS SD reflectance as monitored by the Solar Diffuser Stability Monitor showed faster degradation of SD reflectance for 0.4 to 0.6 µm channels than the longer wavelength channels. Analysis of VIIRS SD reflectance data show that the spectral dependent degradation of SD reflectance in short wavelength can be explained with a SD Surface Roughness (length scale << wavelength) based Rayleigh Scattering (SRRS) model due to exposure to solar UV radiation and energetic particles. The characteristic length parameter of the SD surface roughness is derived from the long term reflectance data of the VIIRS SD and it changes at approximately the tens of nanometers level over the operational period of VIIRS. This estimated roughness length scale is consistent with the experimental result from radiation exposure of a fluoropolymer sample and validates the applicability of the Rayleigh scattering-based model. The model is also applicable to explaining the spectral dependent degradation of the SDs on other satellites. This novel approach allows us to better understand the physical processes of the SD degradation, and is complementary to previous mathematics based models.

Graphical Abstract

1. Introduction

The Suomi-NPP satellite was successfully launched on 28 October 2011. VIIRS (Visible Infrared Imager Radiometer Suite) is one of five instruments onboard the Suomi-NPP (SNPP) satellite and acquired its first measurements in November 2011 [1,2,3]. The VIIRS is a scanning radiometer and has 22 spectral bands covering the spectrum between 0.412 µm and 11.5 µm, including 14 reflective solar bands (RSB), seven thermal emissive bands (TEB), and one day–night band (DNB). It primarily focuses on clouds, Earth surface variables, surface temperature and imagery, and provides moderate-resolution, radiometrically accurate images of the globe once per day for the RSBs and twice daily for the TEBs and DNB. It has wide-swath (3000 km) with spatial resolutions of 375 and 750 m at nadir for the imaging bands (I-bands) and moderate resolution bands (M-bands), respectively.
For the VIIRS RSBs, the radiometric calibration uncertainty in spectral reflectance for a scene at typical radiance is expected to be less than 2%. Calibration methods such as using the onboard solar diffuser (SD), inter-comparisons with instruments on other satellites, vicarious calibration at desert and ocean sites and lunar calibration [2,3,4,5,6,7,8,9,10,11,12] have been routinely performed to trend and validate the on-orbit radiometric performance of VIIRS RSBs. As a result of continuous calibration efforts, both radiometric and signal-to-noise ratio performances of the VIIRS RSBs continue to meet its requirements.
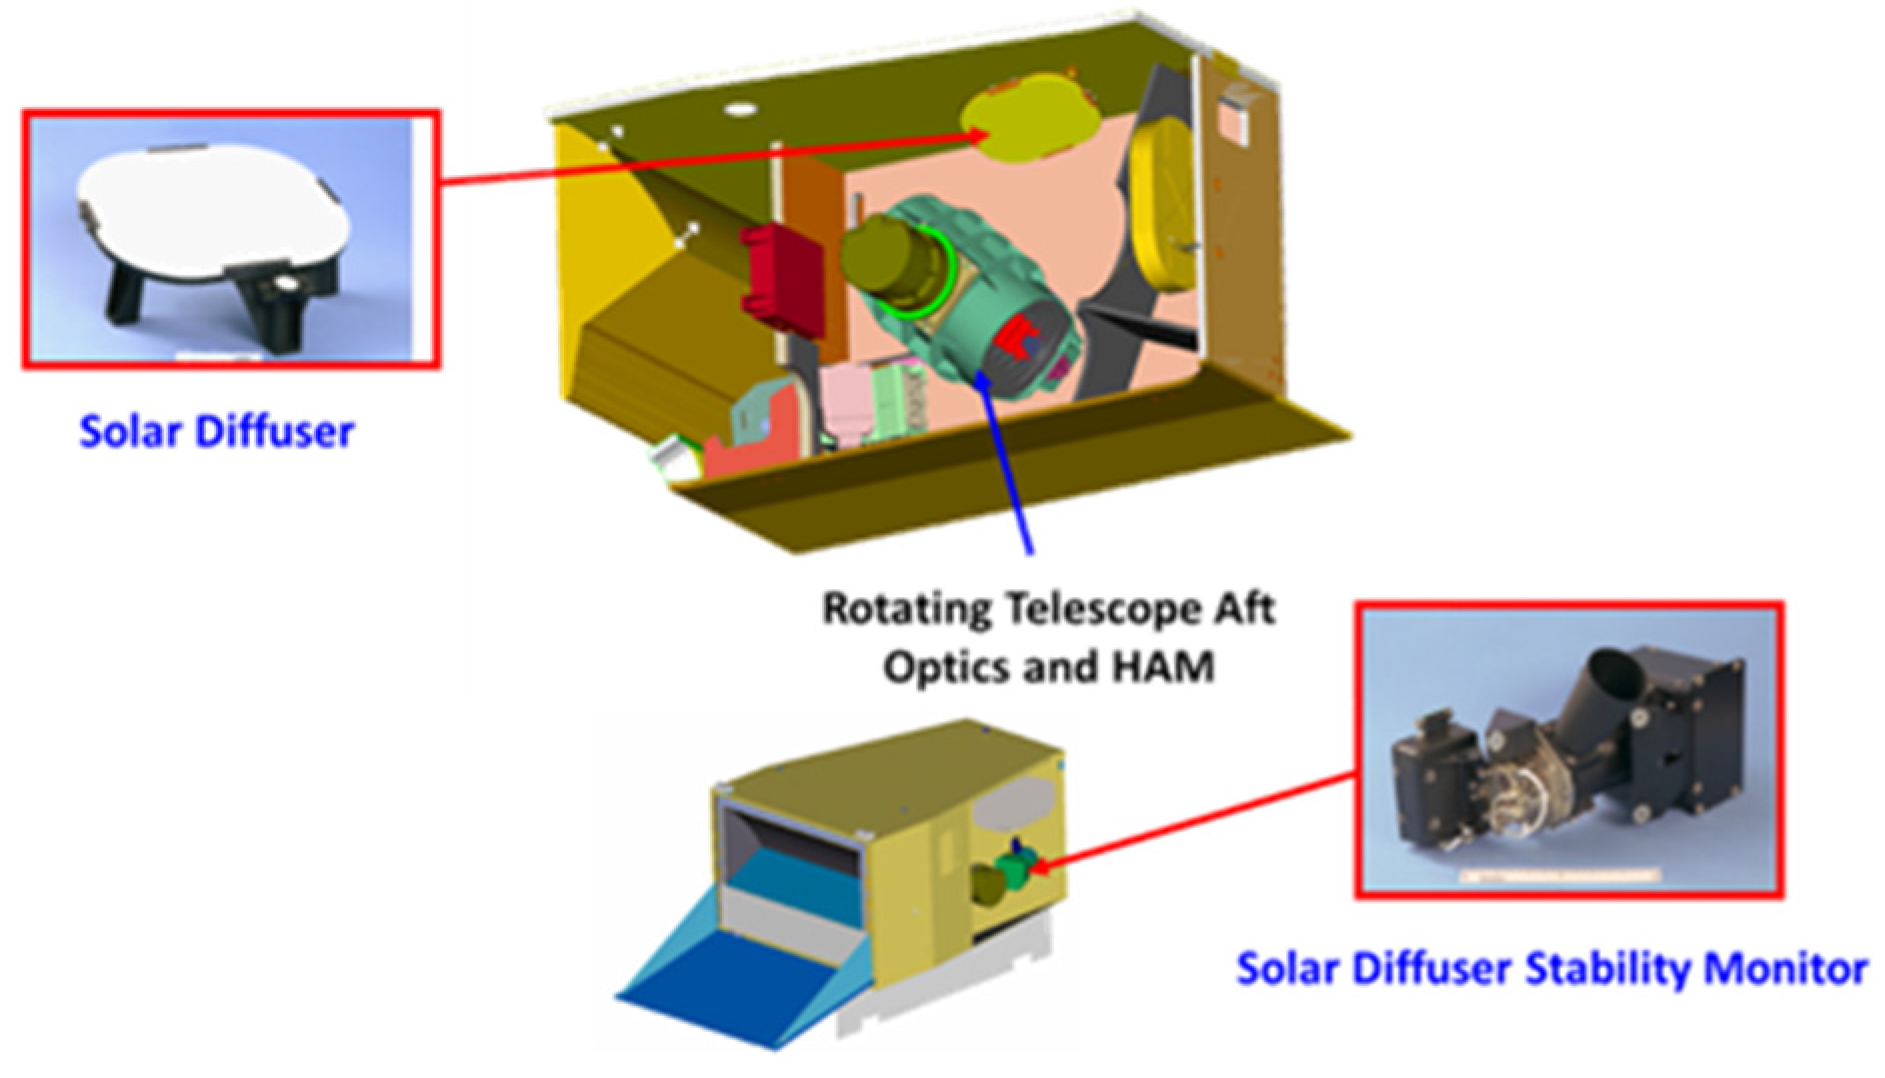
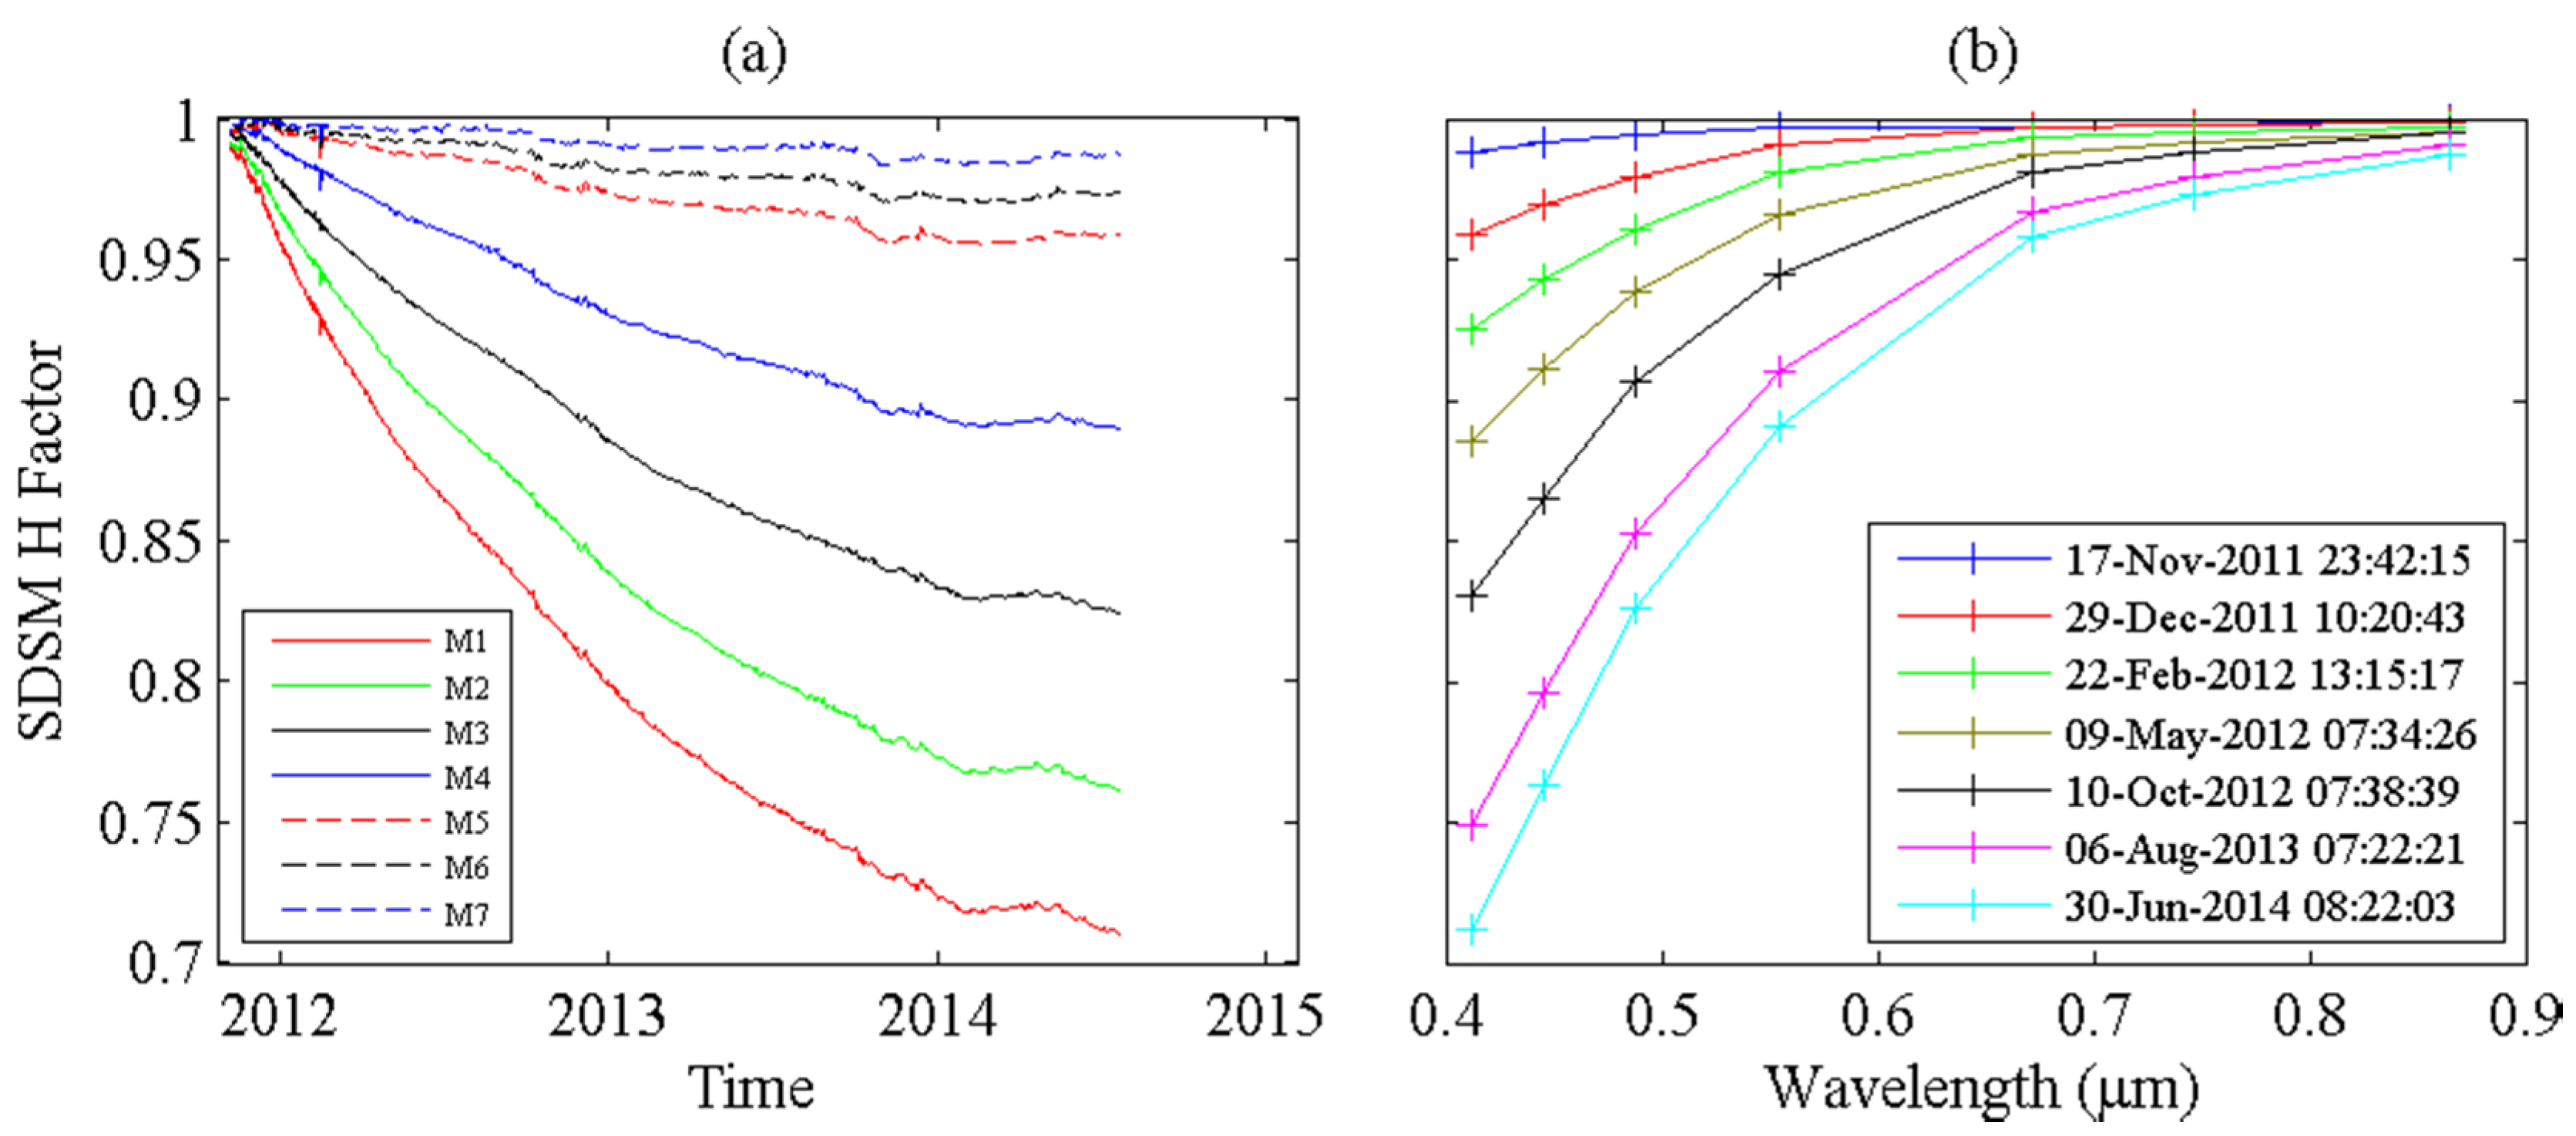
In operations, the VIIRS uses onboard SD and space view data to perform radiometric calibration of RSBs for Sensor Data Record (SDR) generation. The space view data are used to determine the background offset and the reflected solar light data from the SD is used to determine the gain for RSBs. The solar diffuser is made of Spectralon™ material and degrades in reflectance (especially at the blue end of the spectrum) due to exposure to space radiation such as solar UV light and energetic particles in space [13,14,15,16,17,18,19,20]. To mitigate this effect, VIIRS uses a Solar Diffuser Stability Monitor (SDSM) in the 0.4–0.94 µm wavelength to monitor changes of the SD reflectance over time and provides a correction factor (H factor) to the calibration coefficients of VIIRS RSBs [9,10,11,12]. The H factor monitored by the VIIRS SDSM revealed that reflectance of the 0.4 to 0.6 µm channels of VIIRS SD degraded faster than the SD reflectance of longer wavelength RSB channels. Over ~2.5 years, the degradation of SD reflectance of VIIRS M1 (412 nm) channel reached ~29%. Similar degradation of the SD reflectance, but with a much slower rate, also occurred to Moderate Resolution Imaging Spectroradiometer (MODIS) on Aqua and Terra. For comparison, the degradation of the VIIRS SD reflectance over 1.5 years is comparable to 11 years’ degradation of SD on Aqua MODIS [21,22]. It is assumed that the difference is mainly due to the limited exposure of the Aqua MODIS SD to sunlight with the use of a shutter door when not calibrating. However, other possibilities such as accelerated SD reflectance degradation due to contamination with Pennzane are also being investigated [20].
Radiometric calibration of RSB using onboard SD is quite common for modern-day satellite instruments such as MODIS on AQUA and TERRA [21,22], Thermal And Near-infrared Sensor for carbon Observation-Fourier Transform Spectrometer (TANSO-FTS) onboard GoSat [23], Operational Land Imager on LandSat-8 [24] and VIIRS on SNPP [2,3]. Instruments from other upcoming missions such as the Advanced Baseline Imager (ABI) on GOES-R, TANSO-FTS on GoSat2 and VIIRS on JPSS series will also use onboard SD for radiometric calibration. The degradation of SD reflectance in space occurs inevitably when it is used for RSB calibration and exposed to space radiation. Efforts in instrument design have been devoted to track and/or reduce the SD degradation. For instruments such as MODIS and VIIRS, SDSM has been used in tracking the SD degradation and for TANSO on GoSat, double-sided SD with different solar exposure frequency has been used.
There have also been continuous efforts in laboratory experiments [13,14,15,16,17,18,19,20] to characterize the reflectance degradation of SD material by exposing samples to radiations such as UV and energetic particles. While these experiments connect the spectral reflectance degradation of the SD material with radiation exposure, there has been an insufficient understanding of the relationship between the observed spectral dependent degradation and the changes in material surface properties previously.
In this paper, we introduce a SD Surface Roughness based Rayleigh Scattering (SRRS) physical model to explain the spectral dependent degradation of SD material under space radiation. Characteristic parameters of surface roughness can be derived from the long term spectral dependent degradation of VIIRS SD reflectance and used to monitor the surface roughness change over its operation period. In Section 2, we introduce the onboard calibration of VIIRS RSBs using SD and SDSM. Section 3 presents the model of spectral dependent degradation due to surface roughness and specifies the modeling parameters for characterizing surface roughness. In Section 4, the model is applied to spectral reflectance data of VIIRS SD, and an explanation of the spectral dependent degradation of VIIRS SD in terms of surface roughness change is also given. In Appendix, general effects of space radiation such as UV light and energetic particles on the SD material are presented. Experimental evidence of spectral dependent degradation of SD material and surface roughness changes are reviewed.

2. Onboard Calibration of VIIRS RSBs with SD and SDSM

2.1. VIIRS SD for Onboard Calibration of RSBs

VIIRS is a conventional differencing radiometer that uses a space view to determine zero radiance and observations of reflected solar light from SD (Figure 1) to determine gain for RSBs. When the Suomi-NPP satellite moves from the night side toward day side of the Earth near the South Pole, the Sun illuminates SD panel and sun-view port of the SDSM through attenuation screens. The attenuation screen consists of many small holes packed closely together and has about 11% transmission. It is mounted in the SD view port to limit the solar radiance reflected off the SD and to make it comparable to typical Earth scenes. Since the geometric locations of light source, i.e., azimuth and elevation of the Sun, keep changing for each scan, both the transmission screen and the SD need to be characterized as a function of solar incidence angles. The bidirectional reflectance distribution function (BRDF) measurements were performed during the pre-launch testing and updated with the on-orbit yaw maneuver measurements.
Figure 2a shows the signals of the reflected solar light from the SD detected by the detectors of the I1 channel (0.64 µm wavelength) of VIIRS together with the spacecraft solar zenith angle variation over multiple-orbits around the Earth. The I1 view of the SD shows spikes of solar illumination when the satellite passes from the dark side to the sunlit side of the Earth in the high latitudes of the southern hemisphere. These spikes indicate the time interval when the SD is illuminated by the sunlight passing through the SD screen. Figure 2b shows the zoom-in of the I1 view of SD during one orbit. The main spike in the I1 view of SD lasts ~10 min. There are remnant radiation side lobes with amplitudes of about 1/10 of the main spike appearing in the I1 view of SD as the satellite transits to the dayside. The side lobes in the I1 view of SD is likely due to the reflected sun light from Earth which enters through the VIIRS nadir door, contaminating the SD and observed by I1. Due to the exposure of the SD to sunlight over time, it degrades and this degradation is tracked using the SDSM to calculate the H-factors.

2.2. Degradation of VIIRS SD as Monitored by the SDSM

The VIIRS SDSM monitors the SD reflectance degradation using a three-position fold mirror to perform a three-scan cycle, which sequentially views a dark scene, screened sunlight, and illumination from the SD. The direct sunlight to the SDSM is attenuated through a pinhole-filter to keep the radiance within the dynamic range of the SDSM’s detector/amplifier combination. The SDSM is basically a ratioing radiometer and monitors the SD degradation rate by the ratio between signals from screened sunlight and reflected light from the SD. Proper correction of the attenuation filter for the Sun view as function of incident angles is applied at the time of observation. In operations, during each SDSM calibration event, the SDSM acquires data using eight individual detectors over an approximately one minute period, which is ~33 VIIRS scans. These measurements are accumulated, trended and projected as spectral H factors in order to provide an update on SD reflectance change for the corresponding VIIRS RSBs. The VIIRS H factors were updated daily before 14 May 2014 and later the operation frequency was switched to three times a week. Table 1 lists the center wavelengths of VIIRS RSB that use the H factors as monitored by the SDSM to trend SD degradation.
Figure 3a shows the SD degradation trend, i.e., evolution of H factor for M1–M7 band of VIIRS. The SD reflectance degradation is faster at shorter visible wavelengths. Over ~2.5 years, the degradation of SD reflectance of VIIRS M1 (412 nm) channel reached ~29%, while the degradation for M7 (865 nm) channel is 1.3%. Figure 3b also shows that the degradation of SD reflectance is spectrally dependent, i.e., maintaining a smooth spectral shape during the degradation, which will be further investigated in this paper.
The larger SD degradation at shorter wavelengths is very similar to what has been observed on Terra and Aqua MODIS, which were launched in December 1999 and May 2002, respectively. Different from VIIRS, the MODIS design includes a SD door [21,22]. The SD door is commanded to an open position only during each scheduled SD/SDSM calibration event in order to prevent unnecessary solar exposure on to the SD panel and the SD door is closed after the calibration event. For MODIS on Terra, a SD door operation anomaly occurred on 6 May 2003 during a scheduled SD/SDSM calibration event. The SD door on MODIS Terra was permanently set at the “open” position since 2 July 2003 and the SD was under solar exposure every orbit afterwards. For Aqua MODIS, there has been no schedule change, and the SD/SDSM system was operated according to the scheduled frequencies. VIIRS does not have a SD door and the SD calibration is obtained every-orbit.
After more than 12 years of on-orbit operation, reflectance degradation of Aqua MODIS SD varies from 0.6% at 0.94 μm to 19.0% at 0.41 μm [22]. Due to more frequent solar exposure, the Terra MODIS SD has experienced a much larger degradation, varying from 2.3% at 0.94 μm to 48.0% at 0.41 μm. However, the VIIRS SD degradation is faster than MODIS on Aqua. Degradation of VIIRS SD over 2.5 years has exceeded 11 years’ degradation of Aqua MODIS SD. The difference in the magnitude of spectral dependent degradation among VIIRS and MODIS on Aqua and Terra is mainly due to the difference in the solar exposure time of SD.

3. Model on Spectrally-Dependent Scattering over Rough Surfaces

In this section, we provide a physics-based SRRS theoretical model to interpret the spectral dependent degradation of solar diffuser as shown in Figure 3, and in particular, the wavelength dependence that is shown in Figure 3b. The portion of light being scattered from the SD is dominantly determined by two factors: the wavelength of the light and the surface structure of the SD. The SD is made of SpectralonTM (Fluorocarbon-based polymer) and designed to have the property of Lambertian reflectance (see Appendix A.1.). The spectral properties of SD reflectance inevitably degraded due to UV exposure and particle radiations in space [13,14,15,16,17,18,19,20], which are summarized in Appendixes A.2. and A.3. Laboratory experiment also showed that there are surface roughness change on the order of tens of nanometers for Fluoropolymer samples after combined UV and particle exposures [25] (see Appendix A.4.). While these experiments provide direct evidence of increased polymer surface roughness after UV and particle irradiations, there were no measurements or models on the spectral reflectance changes of the SD samples to connect surface roughness change to spectral reflectance change. In the following, we present a physics-based SRRS model to link the spectral dependent degradation of SD material, e.g., Spectralon panel on VIIRS, with the surface roughness change due to space radiation exposure.
Due to dielectric property changes of the local irregularities formed within the surface, the light irradiated on a rough surface can be scattered. Spectral scattering due to surface roughness has been extensively studied in theory and by experiments [26,27,28,29,30,31,32,33]. Scattering of light depends on the wavelength of the light being scattered and the scale length of surface roughness. In this section, we discuss the model of how surface roughness of length scale << wavelength changes the spectral reflectance of a SD material. Before being illuminated by space radiation, the diffuse reflectance R 0 ( λ ) of porous SD material for the wavelength range between 0.4 µm and 1.0 µm is almost flat and can be as high as 99% in the case of Spectralon. Under illumination of UV radiation and/or particle radiation, fine scale surface roughness increases as observed in the experiment by [25]. The length scale of these surface roughness is of tens nanometer and is much smaller than wavelength of interest. Therefore, the light-scattering from the surface roughness is of Rayleigh-type. Rayleigh scattering from a sphere of diameter d and refractive index n from a beam of light of wavelength λ ( d < < λ ) and intensity I 0 is given by
I = I 0 1 + cos 2 θ 2 R 2 ( 2 π λ ) 4 ( n 2 1 n 2 + 2 ) 2 ( d 2 ) 6
where R is the distance to the particle, θ is the scattering angle, and I is the intensity of scattered light. Two important aspects of Rayleigh scattering are worth noting.
(a)
For d < < λ , the angular pattern of scattering is symmetric between the forward and backward direction.
(b)
The dependence of scattering on wavelength follows λ 4 , so light of shorter wavelength suffers more scattering.
Therefore, the Rayleigh-type scattering from the fine scale surface roughness on a SD material causes more scattering at shorter wavelengths than at longer wavelength and the symmetric scattering pattern can cause short wavelength light to be scattered back to the material, trapped or transmitted through. This is the origin of the degradation of reflectance in the short wavelength range for SD material after exposure to space radiation. It should be noted that although previous studies have used H = 1 α / λ η equations to mathematically model the SD degradation [34], our study is the first to establish the physical model based on SD Surface Roughness induced Rayleigh scattering on the SD surface and related degradation. To quantify the effect of Rayleigh-type scattering on the spectral dependent degradation of SD material due to surface roughness change, we first introduce parameters to characterize the surface roughness in Section 3.1, and the model for surface roughness-induced degradation is presented in Section 3.2.

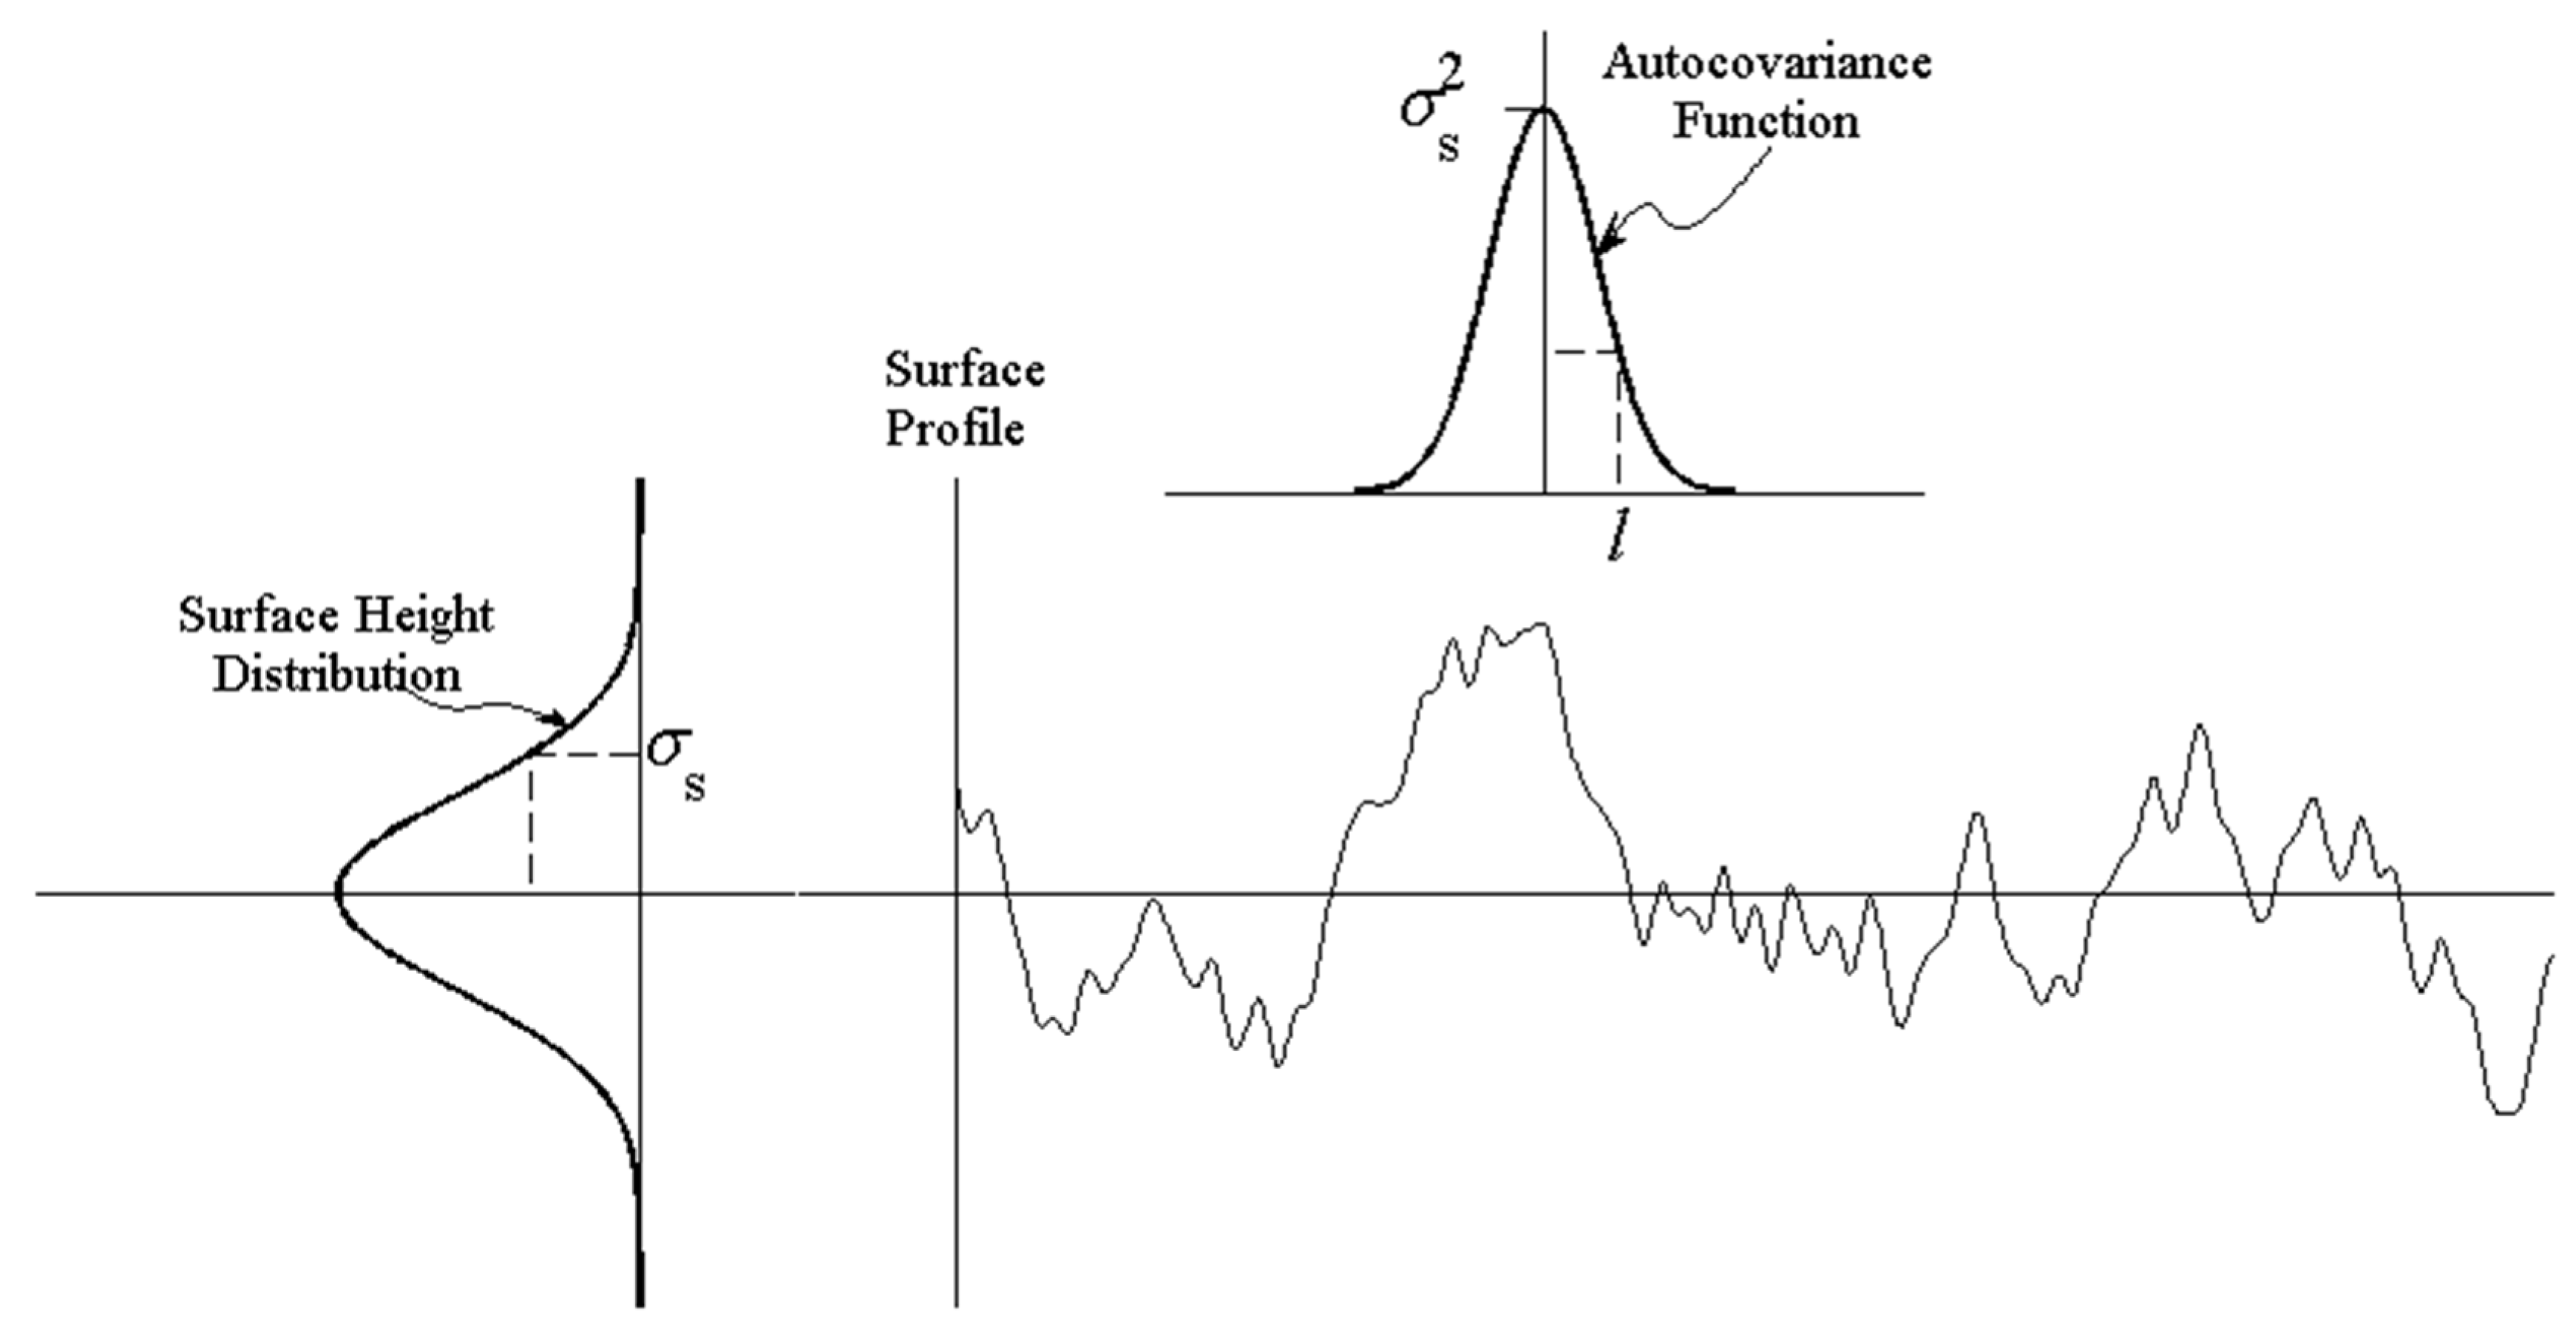
3.1. Statistical Parameters Characterizing Surface Roughness

To introduce parameters characterizing surface roughness, we set h = h ( x , y ) as the height of the surface at the coordinate point ( x , y ) and conveniently choose the coordinate system such that it has a zero mean. Two relevant statistical surface characteristics are the surface height distribution S H D ( h ) and the surface auto-covariance function A C F ( x , y ) , defined, respectively, as
S H D ( H ) d H = Area ( { ( x , y ) | H < h ( x , y ) < H + d H } )
and
A C F ( x , y ) = < h ( x 0 , y 0 ) h ( x 0 + x , y 0 + y ) >
where < > is the ensemble average over all regions of coordinates ( x 0 , y 0 ) . An illustration of the surface roughness characteristic parameters is shown in Figure 4, where the root-mean-square (RMS) surface roughness σ s is the standard deviation of S H D ( h ) , and the auto-correlation length l is the half-width of the A C F ( x , y ) at 1 / e peak value.
For many cases of interest, the surface heights are normally distributed, i.e., S H D ( h ) is Gaussian. However, in most instances, A C F ( x , y ) is material and process dependent. To simplify the problem, both of them are assumed Gaussian in this paper.

3.2. SRRS Model of Reflectance Change Due to Surface Roughness

The local fine surface roughness on a SD material causes the scattering of light, and accordingly the reflectance to be modified as R m ( λ ) = R 0 ( λ ) [ 1 S T ( λ ) ] [30], where the reduction factor S T ( λ ) represents the fraction of scattered light that is trapped in the material or transmitted through. Here we assume that the original SD is Lambertian and the diffusely scattered light is uniformly distributed in all directions. This allows us to focus on studying the physical origin of the spectral dependent degradation of SD reflectance.
The total integrated scattering from surface roughness, i.e., T I S ( λ ) , has been studied in [26,27,29,32]. For surface roughness with length scale l > > λ , in [26], it is derived that the fraction of diffusively scattered light could be expressed as
T I S ( λ ) = 1 exp [ ( 4 π cos θ i σ s λ ) 2 ]
where θ i is the angle of incidence. In [29], it is further suggested that scattering should be significantly dependent on the roughness correlation length l if it is much smaller than the wavelength ( l < < λ ) and quantitatively derived
T I S ( λ ) = 64 3 π 4 σ s 2 l 2 λ 4
for normal incident light. The relationship T I S ( λ ) λ 4 for l < < λ is due to Rayleigh scattering, which is dominantly elastic scattering. For oblique incident light with an angle of incidence θ i , the scattering can be expressed as [31,33]
T I S ( λ ) = 64 3 π 4 σ s 2 l 2 cos 2 θ i λ 4
In this case, the modification of TIS due to oblique light incidence is applied to the root-mean-square surface roughness σ s as a factor of σ s cos θ i [31]. In the case of scattering from surface roughness on SD material, Equation (6) is applicable and the fraction of scattered light that is trapped in the material or transmitted through can be estimated as
S T ( λ ) = α × T I S ( λ ) = α 64 3 π 4 σ s 2 l 2 cos 2 θ i λ 4
where α is fraction of light that is not reflected. The resulting modified reflectance due to light scattering from surface roughness can be expressed as
R m ( λ ) = R 0 ( λ ) [ 1 S T ( λ ) ] = R 0 ( λ ) ( 1 α 64 3 π 4 σ s 2 l 2 cos 2 θ i λ 4 )

4. Analysis of Spectral Dependent Degradation of VIIRS SD with SRRS Model

We can apply the model of surface roughness-induced spectral dependent degradation presented in Section 4 to estimate the length scale of surface roughness grown on SD using the spectral reflectance data of VIIRS SD and check the validity of the model. In the case of SD material, initial reflectance R 0 ( λ ) before illumination by space radiation can be approximated as being independent of wavelength over the wavelength of interest, i.e., R 0 ( λ ) 1 , and the dependence of R m ( λ ) on wavelength can be attributed to the factor [ 1 ( 64 / 3 ) α π 4 σ s 2 l 2 cos 2 θ i λ 4 ] in Equation (8). Therefore, by fitting the spectral reflectance R SD ( λ ) of VIIRS SD, i.e., H factor, using Equation (8), we can estimate the SD surface roughness length parameter σ s l .
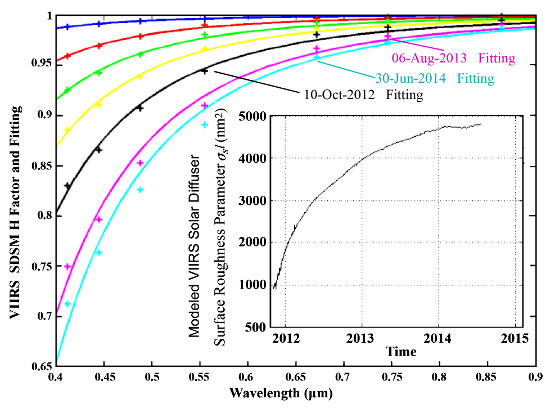
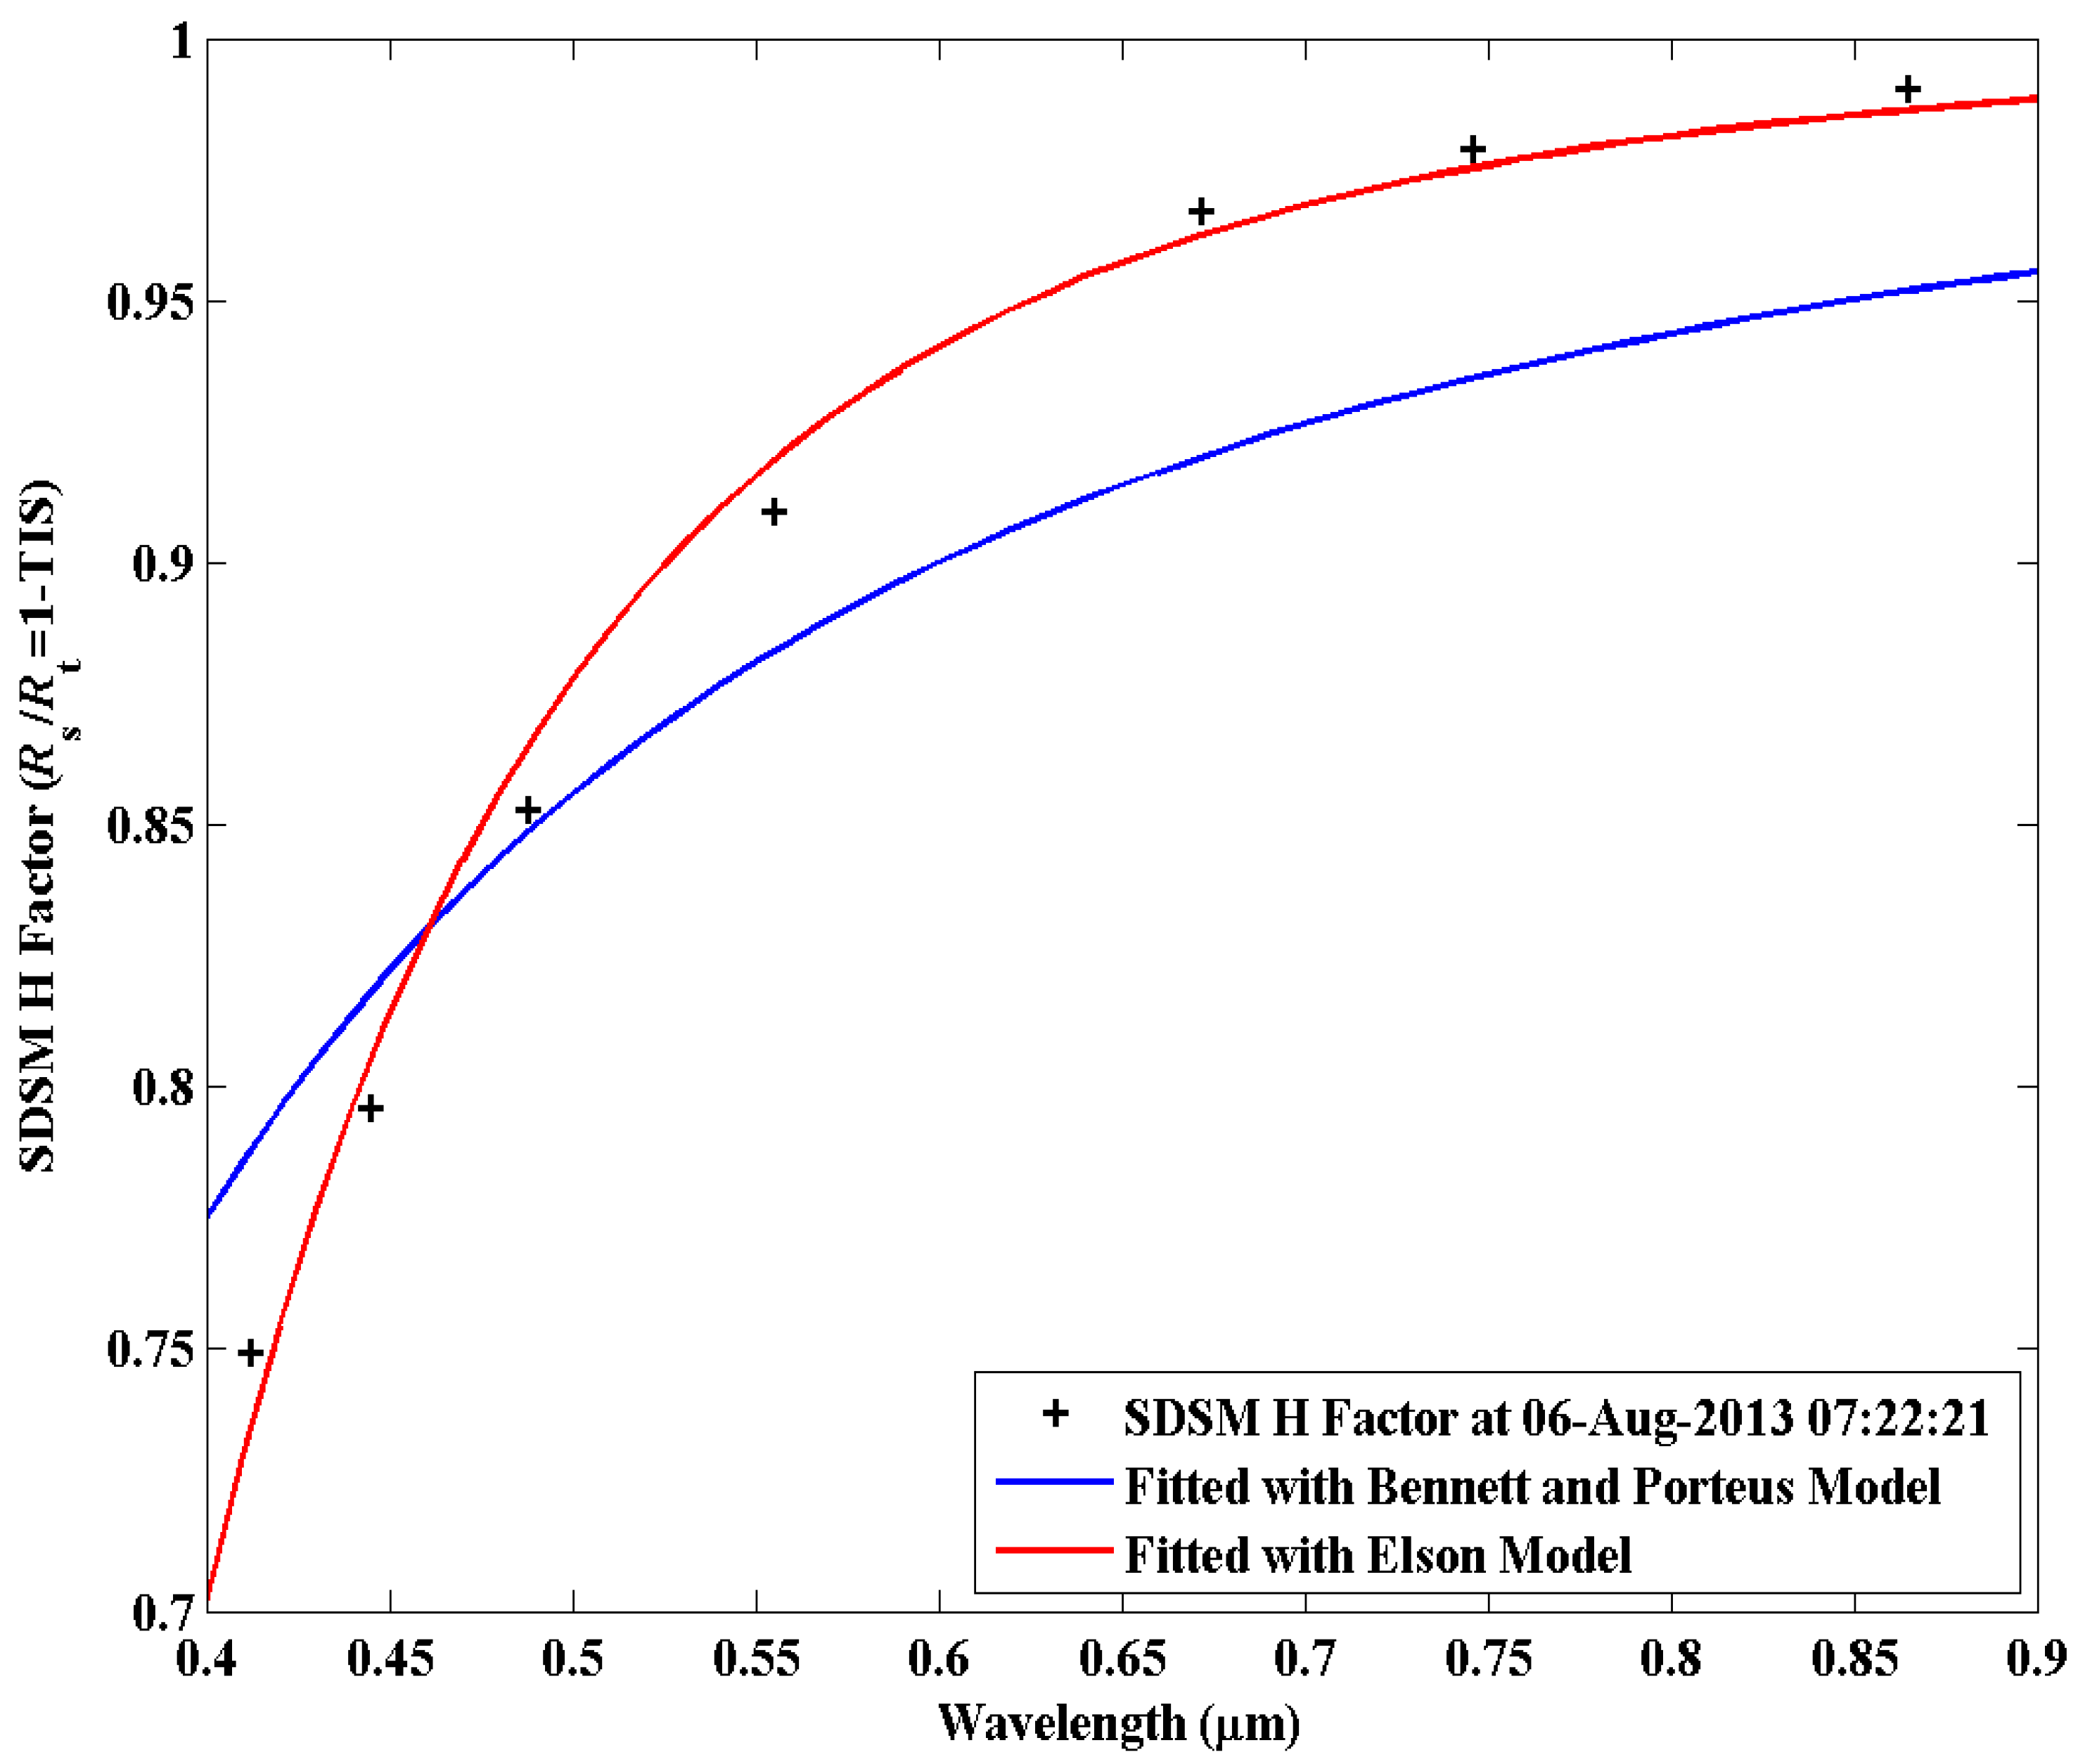
Figure 5 shows the fitting of the VIIRS SD spectral reflectance data on 6 August 2013 with the SRRS model (Equation (8)). In the fitting, we use α = 0.5 to account for that the scattering is symmetric between forward and backward direction in the regime of Rayleigh scattering and focus on the dependence on wavelength. The solar light incident angle to SD is approximately taken as θ i = 52.4 degree. For comparison, the model based on Equation (4) [26,27] for surface roughness length l > > λ is also plotted. It can be seen that the Rayleigh scattering-based reflectance correction model (Equation (8)) matches the VIIRS SD data very well while the model based on [26] does not match the spectral trend in the SD reflectance data. On the other hand, surface roughness length parameter σ s l can be estimated using Equation (8) which gives σ s l = 66.5 nm for this case. Both facts confirm that the SD surface roughness length is much less than the wavelength and Rayleigh scattering is the dominant mechanism responsible for the observed SD spectral dependent degradation. In [34], it is first empirically determined that the degradation factor is proportional to 1 / λ 4.07 , which is consistent with our SRRS theoretical model.
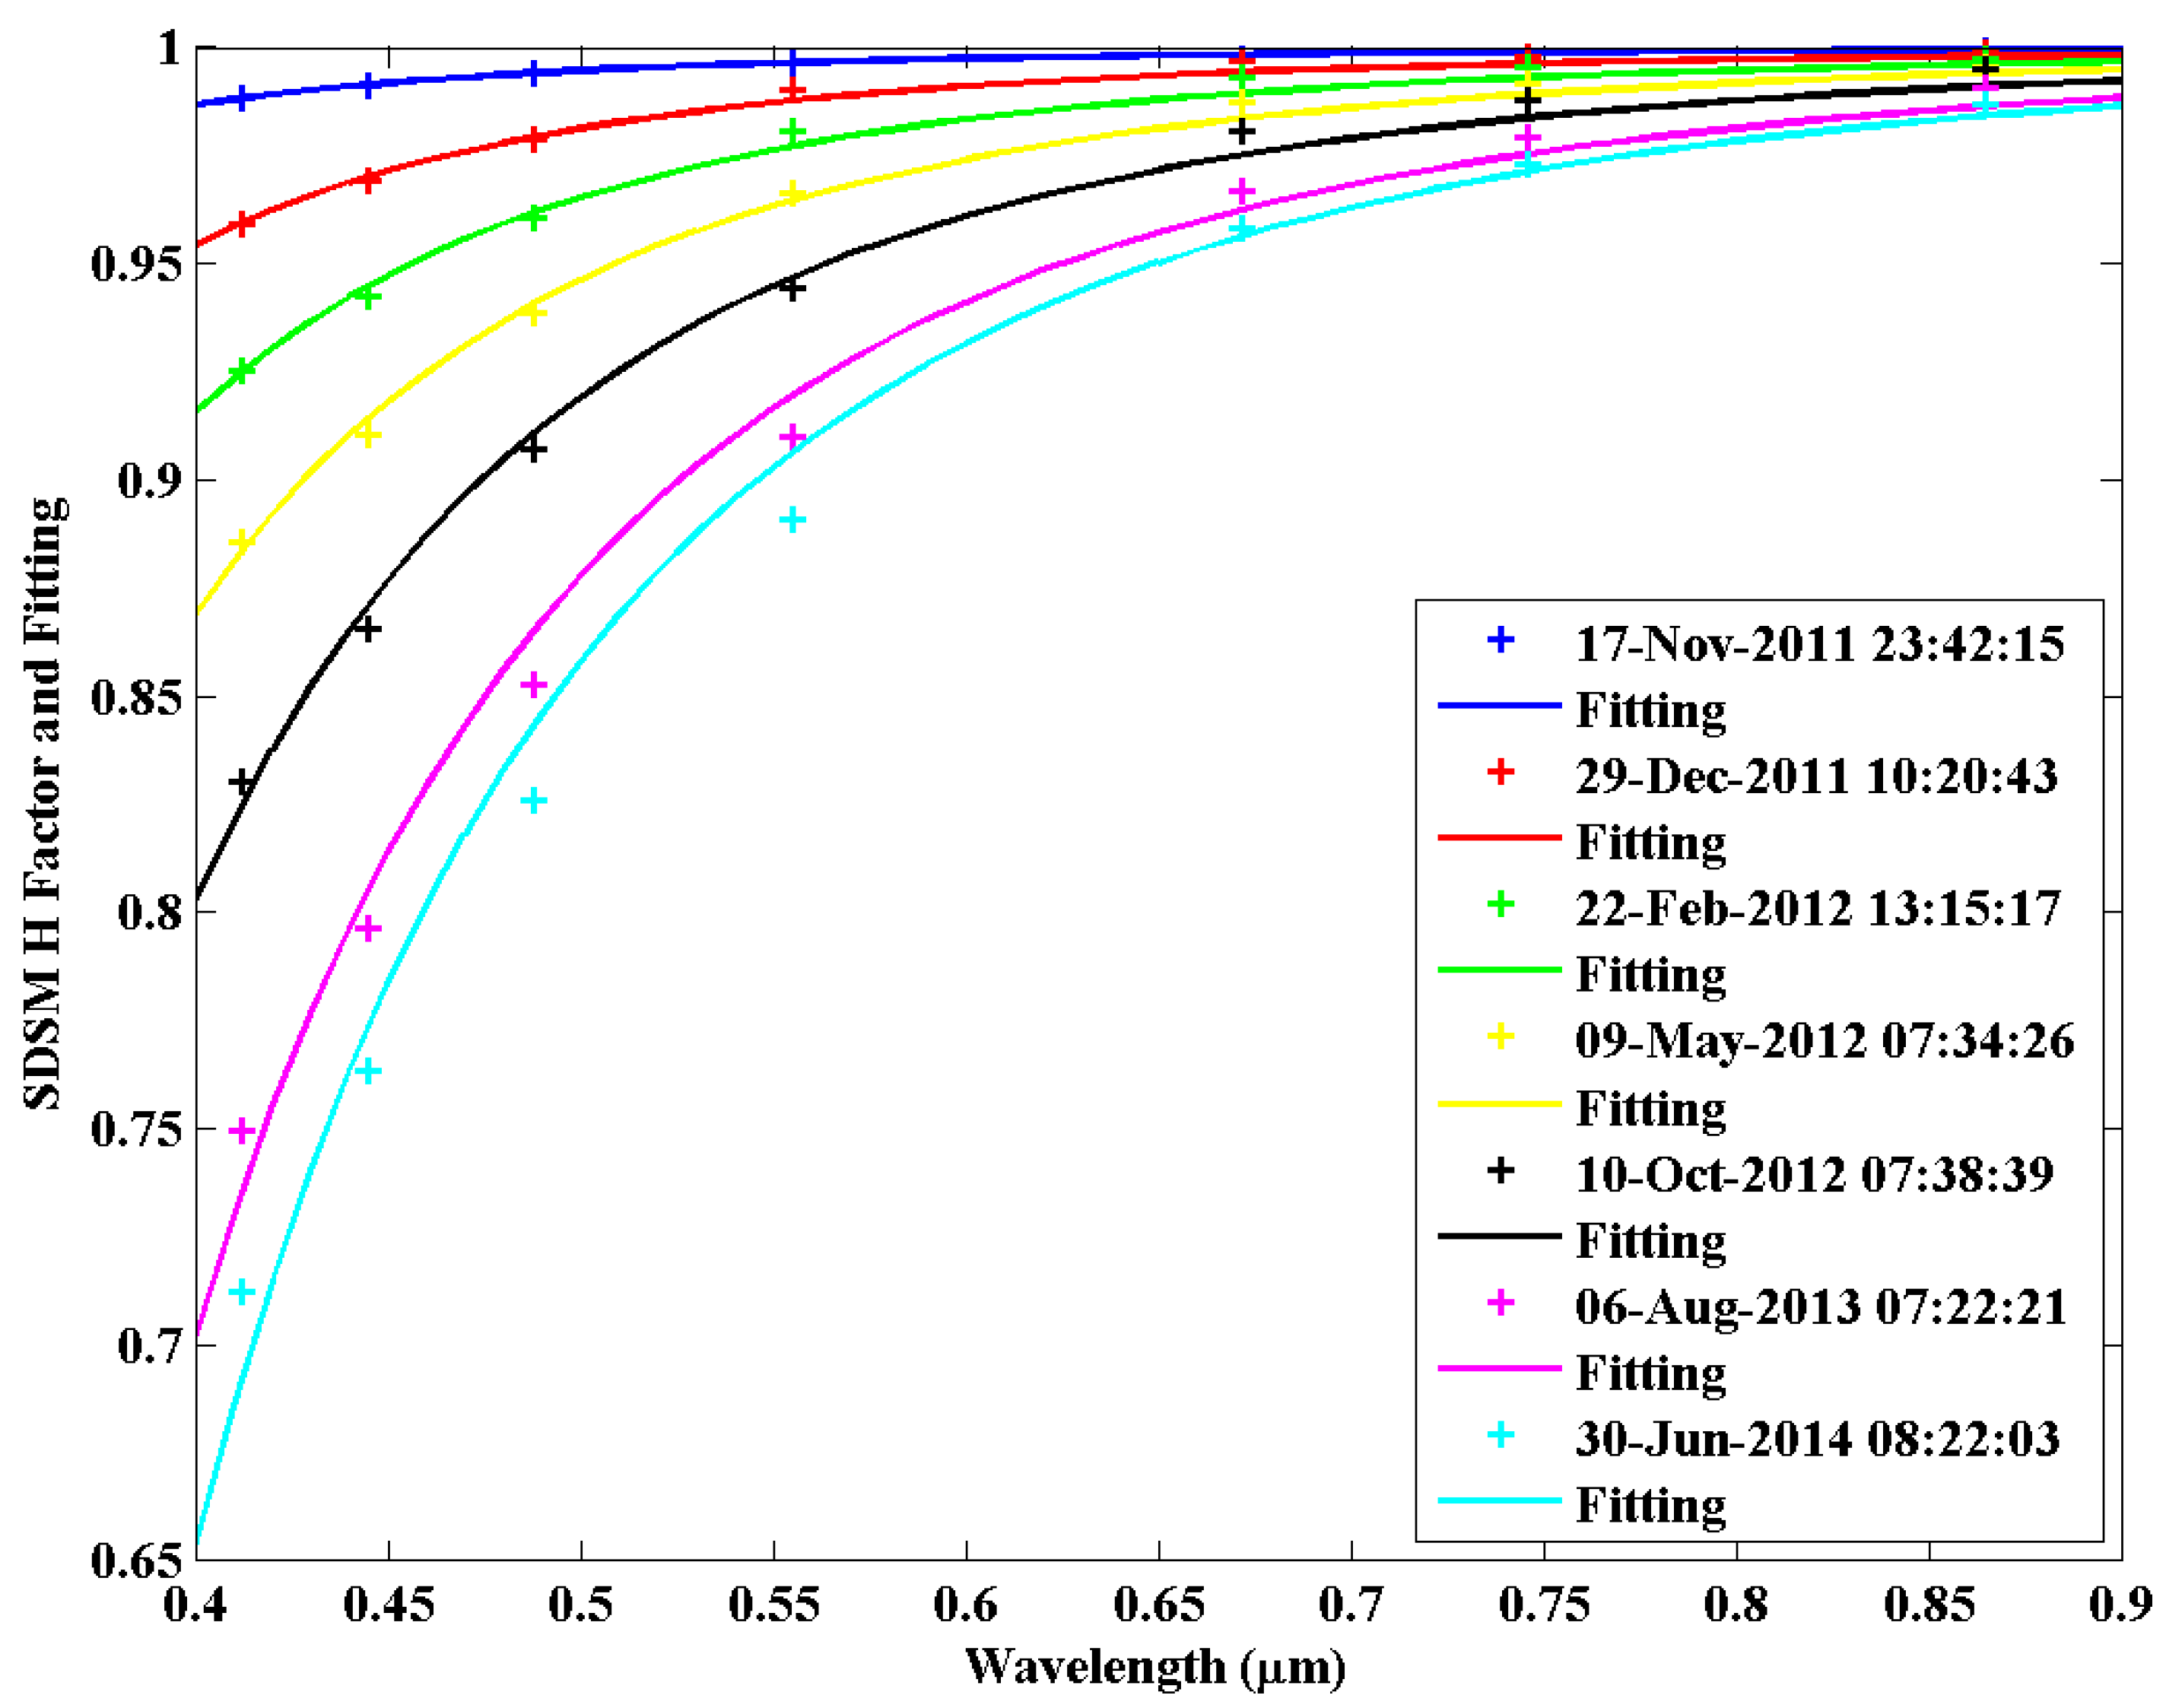
Figure 6 shows a fitting of the SD spectral reflectance with the SRRS reflectance correction model (Equation (8)) for several cases during the 2.5 years operation of VIIRS. In general, the matching between the modeled and observed spectral reflectance of the SD for these cases is quite good as the SD operation time accumulates and the degradation becomes more severe.
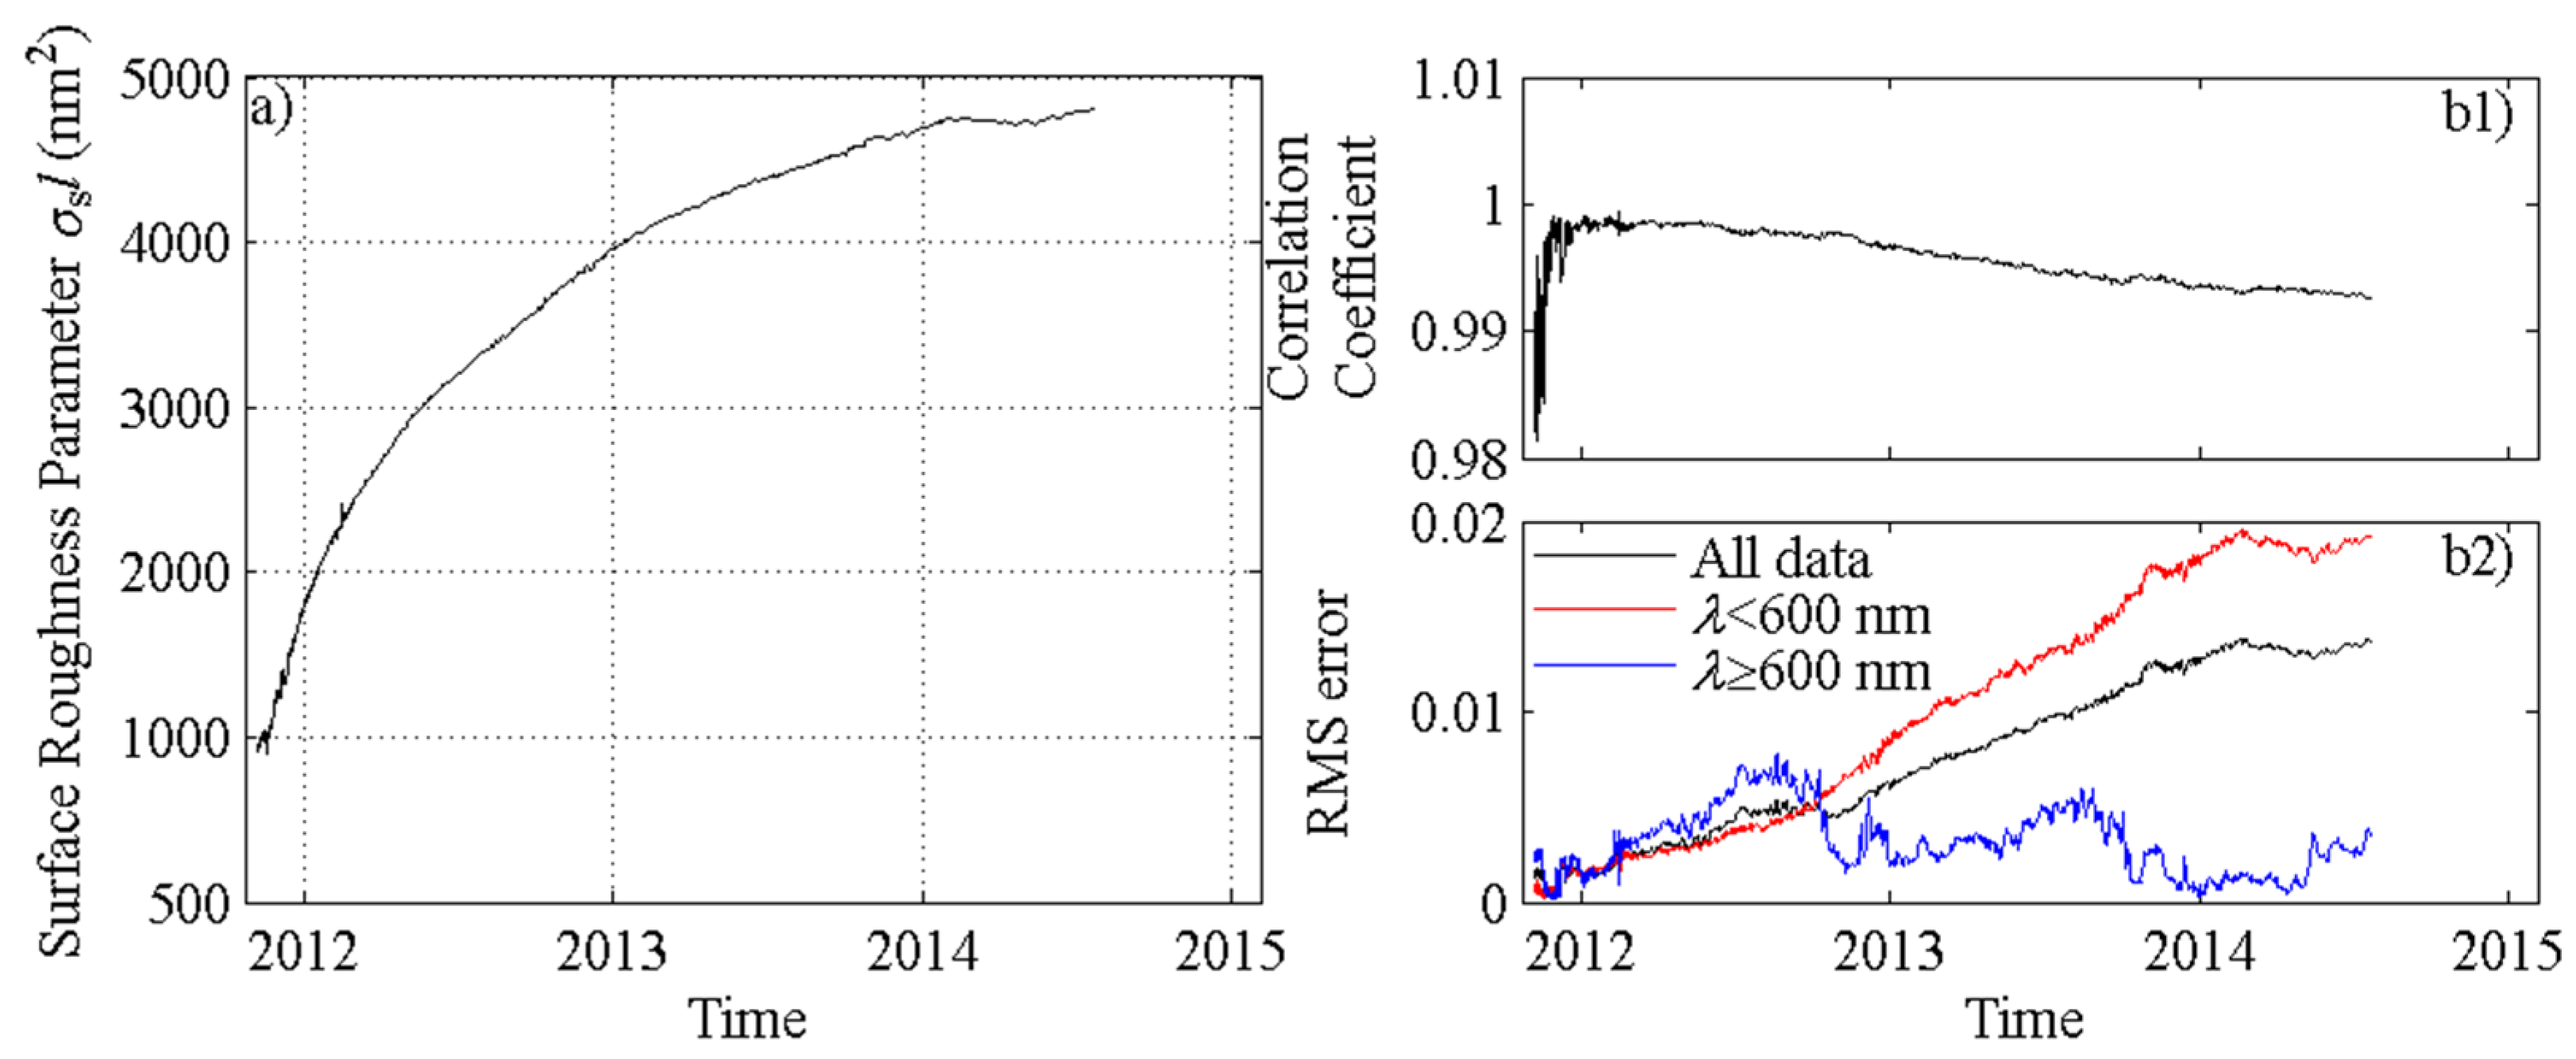
Figure 7 shows the evolution of SD surface roughness length parameter σ s l derived from fitting of the ~2.5 year time series of VIIRS SD spectral reflectance data using Equation (8). The SD surface roughness appears to be growing with a slowing down growth rate as the radiation exposure of SD persists during each orbit. In year 2012, the σ s l increases fastest at an average rate of 2147 nm2/year. In 2013, σ s l increases at 736 nm2/year and in 2014, σ s l appears flat for early half year. Over 2.5 years, σ s l changed ~2.3 times from 30.7 nm to 69.1 nm. Given the average exposure time of the SD of ~5 min with ~14 orbits per day, the corresponding VIIRS SD exposure time of solar light for such a roughness increase is ~1000 h. Since there is a SD screen, which attenuates the solar light on VIIRS, an estimation of exact UV and VUV exposure time requires knowledge of the transmittance in UV wavelength range. We also note that the radiation exposure experiment for Teflon fluorinated ethylene propylene (FEP, similar Fluorocarbon-based polymer as Spectralon™) samples by [25] showed that surface roughness length scale of Teflon FEP changed from 8 nm to 35 nm after combined VUV and oxygen ion exposure. Our estimation of the surface roughness length parameter for VIIRS SD is consistent with the experimental results, i.e., both are in tens nanometer scale and are much less than the wavelength. This further validates the application of SRRS model to explain the spectral dependent degradation of SD reflectance.
Figure 7 also shows the evolution of the correlation coefficient and fitting residual error between the SRRS reflectance model and observed SD spectral reflectance data to quantify the matching between the model and data. In general, the model matches the observed SD data well with cross correlation coefficient >0.99 except for the period before 2012 which maintains correlation coefficient >0.98. The RMS error between model and observation is <0.014 (black line in Figure 7b2) for the whole spectral range combined and there is a trend of increase in the RMS error as the SD operation time accumulates. To further analyze the wavelength dependence of the RMS error, we calculated the RMS errors with wavelengths above and below 600 nm, respectively. The RMS error for long wavelengths (black line in Figure 7b2) grows faster to reach a maximum of 0.0077 in August 2012 and then decreases to stay within a region with small value (<0.005). On the other hand, the error with short wavelength (red line in Figure 7b2) grows continuously and gradually approaches a value of about 0.020.
The above analysis of the VIIRS SD reflectance data shows that the modeled and observed reflectance matches well and the estimated surface roughness length parameter is much less than wavelength and is consistent with the length scale obtained from lab measurements [25]. Therefore, the spectral dependent degradation of SD reflectance in short wavelength can be explained with the SRRS model ( λ 4 ). The growth of SD surface roughness is due to the exposure of fluoropolymer-based SD material to space radiations such as solar UV light and energetic particles.

5. Discussion

Recently, there have been several studies [34,35,36,37] to improve the modeling accuracy of the VIIRS SD reflectance degradation and the radiometric calibration accuracy of VIIRS RSB sensor. For example, Lei and Xiong presented a method in [34] to determine the SNPP VIIRS SD BRDF degradation factor over wavelengths longer than 1 μm. They used a phenomenological power law model with fitting function 1 H = α / λ η to simulate the spectral dependent degradation of SD monitored by SDSM. This formulation is similar to ours presented in this study. However, our model fixed the exponent as 4 since the dominant origin of SD spectral degradation is due to surface roughness-induced Rayleigh scattering in our SRRS model. With two fitting parameters, it is determined in [34] that the best fitting exponent η = 4.07 for SDSM data over four wavelengths: 675, 746, 874 and 929 nm. This fitting exponent is consistent with our SRRS ( 1 / λ 4 )-model.
In [34], it is also shown that with two fitting parameters, the average (over the entire mission) of the absolute values of the differences between modeled and measured degradation factors can be as low as 0.00037 over the four wavelengths from 675 nm to 929 nm. Our model shows deviation of SDSM data from the model for short wavelength (Figure 6) when only one fitting parameter, i.e., σ s l , is used to fit for all of the M bands. The deviation can be due to the impacts of SDSM detector relative spectral responses [35]. The SDSM detector response degradation is wavelength-dependent with larger changes at longer (NIR) wavelengths. This type of degradation is most likely due to displacement damage to the SDSM detector system by the high-energy protons in the space operation environment. Since the SDSM is essentially a ratioing radiometer, its degradation has minimal impact on the determination of the SD reflectance degradation [35]. While using high order fitting parameters improves the modeling accuracy, our work focused on revealing the dominant physical origin of the SD BRDF degradation, which suggests that the degradation process is dominated by surface roughness-induced Rayleigh scattering.
In [34], the power-law model is extended to the wavelength region of the SWIR bands from 1.238 to 2.257 μm (bands M8 to M11 of VIIRS) to determine the corresponding degradation factors. These bands are not monitored by SDSM and it is predicted in [34] that on day 1300 the degradation can vary from ~0.04% to ~0.4% for wavelengths from 1.238 to 2.257 microns. The physics-based model presented in this paper can be used to explain the phenomenological power law model presented in [34]. The SRRS model provides physical foundation for extrapolating SD reflectance degradation to longer wavelength with the power law model such as in [34].
In [36,37], Lei and Xiong analyzed the impact of the angular dependence of the VIIRS SD BRDF degradation factor on the radiometric calibration of the RSBs. It was found that the H factors of the SD are angle-dependent. They examined the H factors with different solar vertical angle ϕ V . It was shown that during orbit 5447 and 10,838, for short wavelengths (λ < 500 nm), the H factor could increase by about 2% when ϕ V increases from 25° to 42°. It was also found that the factor of SD transmittance multiplied by the BRDF depends on the solar horizontal angle ϕ H by a relative difference of no more than 0.14%, which has a negligible impact on the SD BRDF degradation. Since the SDSM and the VIIRS telescope SD views have different angles, angular dependence of BRDF impacts the determination of the SD screen transmittance viewed by both the SDSM detectors and the VIIRS telescope. Therefore, taking the dependence of SD BRDF degradation on solar vertical angles ϕ V into account can improve the accuracy in operational radiometric calibration of VIIRS RSBs.
Since the focus of this paper is to explore the physical mechanism, and explain the spectral dependent degradation of the SD in terms of the SRRS model and estimate the surface roughness length scale, we only took into account of the nominal solar light incident angle on the SD and did not consider the angular dependence of the SD degradation. For the operational calibration of VIIRS RSB, a more comprehensive model that incorporates angular dependence of SD BRDF degradation with more fitting parameters should be used, such as presented in [36,37].

6. Summary

A physics-based surface roughness Rayleigh scattering (SRRS) model (Equation (8)) is presented in this paper to explain the spectral reflectance degradation of VIIRS SD in terms of Rayleigh scattering from surface roughness caused by space radiation. Space radiations such as UV light and energetic particles can modify the SD material through breaking C-C and C-F bonds, scissioning or cross linking, ionizing the polymer, which causes the growth of surface roughness. It is found that the model matches well with the spectrally structured degradation of VIIRS SD reflectance data collected over 2.5 years, which indicates that the SD reflectance decrease in shorter wavelength is due to enhanced scattering ( λ 4 ) from surface roughness. The surface roughness length parameter is trended using SD reflectance data over 2.5 years. The derived SD surface roughness length parameter is of tens of nanometer scale (much less than wavelength) and consistent with the length scale found from previous radiation exposure experiments of fluoropolymer samples [25]. This further verifies that the SRRS model is self-consistent and could explain the spectral-dependent degradation of SD material due to surface roughness change under space radiation.
SD plays an important role in onboard radiometric calibration of RSB sensor for existing missions such as MODIS, GoSat and SNPP VIIRS as well as for the future mission such as GOES-R ABI, JPSS VIIRS and GoSat2. Understanding and characterizing the SD reflectance degradation can help improve the instrument design and calibration performance and is of particular importance for missions such as ABI onboard GOES-R which uses a SD for calibration, but has no SDSM for tracking its degradation.
The model presented in this paper provides insights in understanding the physics in the spectral dependent degradation of SD after radiation exposure in space and can be used for other missions. Future efforts will be focused on cross-comparing the evolution of surface roughness length parameter using SD spectral reflectance data from different missions and investigating its dependence on the accumulated solar light exposure time. The model presented in this paper also calls for lab experiments to investigate surface roughness change of sample SD material after radiation illumination and explore the connection between surface property change and spectral dependent degradation.

Acknowledgments

We thank Slawomir Blonski for providing Suomi-NPP VIIRS H-factor data, and Jason Choi, Bin Zhang, Bengt Eliasson and Gennady Milikh for helpful discussion. The views, opinions, and findings contained in this paper are those of the authors and should not be construed as official positions, policy, or decisions of the NOAA or the U. S. Government. Commercial companies identified in this paper are only to foster understanding. Such identification does not imply recommendation or endorsement by the NOAA, nor does it imply that they are the best available for the purpose.

Author Contributions

All authors contributed equally to this work.

Conflicts of Interest

The authors declare no conflict of interest.

Appendix: Radiation-Induced Spectral Dependent Degradation of SD Material

A.1. SD Material

The SD on VIIRS is made of Spectralon™ material, which is produced by Labsphere. It is composed of pure polytetrafluoroethylene (PTFE) polymer resin that is compressed into a hard porous white material in a proprietary procedure. The fluoropolymer is a fluorocarbon-based polymer with strong C-F bonds. The diffuse reflectance of Spectralon is generally >99% for 400 nm to 1500 nm wavelength range and >95% for a wider wavelength range from 250 nm to 2.5 µm. The porous network of thermoplastic on the Spectralon surface produces multiple reflections in the first few tenths of a millimeter depth. This makes the surface and immediate subsurface structure of Spectralon exhibit highly Lambertian reflection behavior. The Spectralon is thermally stable up to >350° C. It is chemically inert, environmentally stable and its reflectance has been characterized with NIST traceable calibration. Spectralon’s optical properties make it ideal as a reference surface in remote sensing and spectroscopy. Space-grade Spectralon combines high-reflectance with an extremely Lambertian reflectance profile. Therefore, it has been used as a SD material for terrestrial remote sensing applications on MODIS, SNPP-VIIRS, GoSat, LansSat-8, and will be used on upcoming J1-VIIRS and GOES-R ABI.

A.2. Space Environment Effects on SD Material

Spectralon, as a high density fluorocarbon-based polymer, is subject to space environmental effects such as UV radiation, high-energy protons, electrons, and energetic ions [25]. The total energy of solar UV radiation (100–400 nm) carried by solar light is ~8% of the solar constant (1366 W/m2). The photon energy at the near UV (200–400 nm) range is >3 eV and >5 eV for Vacuum UV (VUV, wavelength <200 nm) range. The intensity of VUV part of solar radiation fluctuates in large amplitude when the solar activity varies from minimum to maximum during a solar cycle. In space, the UV radiation illuminates the VIIRS SD directly after passing through the pinhole SD screen and is energetic enough to break polymer bonds such as C-C, C-F and functional groups or excite bonds with no direct atomic displacements. The modification of long chain polymers such as SD material by UV radiation occurs through scissioning, cross linking without mass loss, and creation of volatile polymer fragments with mass loss. These modifications can result in SD material surface roughness changes.
The radiation belt particles trapped by the Earth’s magnetic field experience combined motion of gyration, bounce and drifting around the Earth, forming stable doughnut-shaped zones of highly energetic charged particles around Earth. The belts contain energetic electrons (up to several MeV) that form the outer belt and a combination of protons (up to several 100 of MeV) and electrons that form the inner belt. Most of the particles that form the belts come from solar wind and proton energies exceeding 50 MeV in the inner belts are the results of the beta decay of neutrons created by cosmic ray collisions with nuclei of the upper atmosphere. Polar-orbiting satellites such as SNPP transit through both the electron and proton radiation belt along each orbit around the earth. In particular, when the satellite goes through the South Atlantic anomaly (SAA) region, the energetic proton and electron fluxes increase. These radiation belt particles can lead to gradual degradation of SD performance through ionizing radiation, phonon excitations and atomic displacement on the polymer.
Atomic oxygen and energetic ions such as O+ of plasma thermal energy (from space or from outgas of instrument material induced by high vacuum in space) can impact polymers through contamination or collisionally-induced scission of fluorocarbon-based polymers, and result in surface erosion, changes in chemical composition, and formation of particulate and molecular contamination of the material surfaces.
In short, these above-mentioned space environment effects will modify the surface properties of a polymer-based SD panel. The consequent degradation of reflectance is investigated in this paper.

A.3. Radiation Exposure Experiments on SD Material

Extensive experiments of particle and UV irradiation on SD material were performed [13,14,15,16,17,18,19,20] to study changes in directional-hemispheric spectral reflectance, the bidirectional spectral reflectance factor and the polarization properties of diffuser material after the radiation exposure. In early experiment of [13], optical-grade Spectralon material underwent proton exposure and UV-irradiation. A 10-cm-diameter proton beam generated by proton-accelerator facilities at Jet Propulsion Laboratory was used to irradiate the Spectralon sample with 1010 particle/cm2 at energy levels of 1 keV, 1 MeV and 10 MeV, respectively. This fluence level is representative of accumulated proton radiation exposure during a five-year Earth orbiting satellite mission. Under proton radiation, the sample reflectance had little degradation at a wavelength of 0.4 µm wavelength and exhibited ~15% decrease in its diffuse reflectance at 0.2 µm wavelength. The Spectralon sample was next irradiated with UV light with an intensity of 1.5 equivalent suns generated from a 5 kilowatt short arc Xenon lamp for 333 h, yielding 500 equivalent hours exposure. The sample diffuse reflectance decreased from 1.0 µm wavelength with a steady decrease to 0.2 µm. The maximum reflectance decrease was 65% for Spectralon. Overall, UV light exposure degrades the Spectralon reflectance more than the proton exposure for wavelength greater than 0.4 µm. Other experiments [14,15,16,17,18,19] also show similar magnitude of reflectance degradation after exposure to UV radiation. Recent experiment in [20] studied changes in the reflectance properties of pressed and sintered PTFE diffusers induced by exposure to VUV irradiation before and after controlled contamination with Pennzane. Their results show that the 8° directional hemispherical reflectance of vacuum-baked sample degraded about 70% after 40 h of VUV exposure. The reflectance of Pannzance-contaminated sample degrades for an additional 6%–8% after the same VUV exposure time.
Although these previous UV exposure experiments consistently show structured reflectance degradation with faster degradation at shorter wavelengths, there has not been any further analysis to relate the spectral dependent degradation of SD material with the changes in sample surface properties, especially surface roughness, as investigated in this paper.

A.4. Experimental Evidence of Surface Roughness Change after VUV Radiation on Fluoropolymer Material

Separate from the Spectralon studies, in [25], experiments were performed to study the surface property changes of fluoropolymers after exposure of VUV radiation and/or energetic oxygen ion. Fluoropolymer samples such as Teflon fluorinated ethylene propylene (FEP), Tefzel, Tedlar and Polyethylene were exposed to low fluences of VUV radiation generated by a 30-W deuterium lamp with a MgF2 window and/or 50 eV oxygen ions generated by a Kaufman source. The total VUV exposure time is 20 equivalent Sun hours (ESH) and the total exposure to oxygen ion is 5 × 10¹⁷ O+/cm2. While Tefzel, Tedlar and Polyethylene are all H-containing polymers and have C-H bond, Teflon FEP consists purely of C-C and C-F bond and is copolymer of hexafluoropropylene and tetrafluoroethylene. Teflon FEP’s composition is very similar to the PTFE-based Spectralon. The main difference is in the processing techniques and Teflon FEP is softer than PTFE, more easily formable, and melts at 260 °C. Therefore, surface property changes of Teflon FEP after radiation exposure can provide implications on surface changes of Spectralon material under similar exposures.
Surface roughness of Teflon FEP was measured using Atomic Force Microscopy in [25]. The results showed that both VUV irradiation and oxygen ions caused significant mass loss for Teflon FEP. Surface roughness length scale of Teflon FEP changed from 8 nm to 14 nm after 20 ESH VUV exposure and to 35 nm after combined VUV and oxygen ion exposure. This indicates that the irradiation of Teflon FEP causes scissoring (breaking of C-C and C-F bonds), cross linking and erosion, and it results in surface roughening.

References

  1. Miller, S.D.; Mills, S.P.; Elvidge, C.D.; Lindsey, D.T.; Lee, T.F.; Hawkins, J.D. Suomi satellite brings to light a unique frontier of nighttime environmental sensing capabilities. Proc. Natl. Acad. Sci. USA 2012, 109, 15706–15711. [Google Scholar] [CrossRef] [PubMed]
  2. Cao, C.; Xiong, J.; Blonski, S.; Liu, Q.; Uprety, S.; Shao, X.; Bai, Y.; Weng, F. Suomi NPP VIIRS sensor data record verification, validation, and long-term performance monitoring. J. Geophys. Res. Atmos. 2013, 118, 11664–11678. [Google Scholar] [CrossRef]
  3. Cao, C.; de Luccia, F.J.; Xiong, X.; Wolfe, R.; Weng, F. Early on-orbit performance of the visible infrared imaging radiometer suite onboard the Suomi National Polar-Orbiting Partnership (S-NPP) Satellite. IEEE Trans. Geosci. Remote Sens. 2014, 52, 1142–1156. [Google Scholar] [CrossRef]
  4. Xiong, X.; Butler, J.; Chiang, K.; Efremova, B.; Fulbright, J.; Lei, N.; McIntire, J.; Oudrari, H.; Sun, J.; Wang, Z.; et al. VIIRS on-orbit calibration methodology and performance. J. Geophys. Res. Atmos. 2014, 119, 2013JD020423. [Google Scholar] [CrossRef]
  5. Rausch, K.; Houchin, S.; Cardema, J.; Moy, G.; Haas, E.; de Luccia, F.J. Automated calibration of the Suomi National Polar-Orbiting Partnership (S-NPP) Visible Infrared Imaging Radiometer Suite (VIIRS) reflective solar bands. J. Geophys. Res. Atmos. 2013, 118. [Google Scholar] [CrossRef]
  6. Uprety, S.; Cao, C.; Xiong, X.; Blonski, S.; Wu, A.; Shao, X. Radiometric intercomparison between Suomi-NPP VIIRS and Aqua MODIS Reflective solar bands using simultaneous nadir overpass in the low latitudes. J. Atmos. Ocean. Technol. 2013, 30, 2720–2736. [Google Scholar] [CrossRef]
  7. Uprety, S.; Cao, C. Suomi NPP VIIRS reflective solar band on-orbit radiometric stability and accuracy assessment using desert and Antarctica Dome C sites. Remote Sens. Environ. 2015, 166, 106–115. [Google Scholar] [CrossRef]
  8. Shao, X.; Choi, T.; Cao, C.; Blonski, S.; Wang, W.; Ban, Y. Trending of Suomi-NPP VIIRS radiometric performance with lunar band ratio. Proc. SPIE 2014, 9264. [Google Scholar] [CrossRef]
  9. Lei, N.; Wang, Z.; Fulbright, J.; Lee, S.; McIntire, J.; Chiang, K.; Xiong, X. Initial on-orbit radiometric calibration of the Suomi NPP VIIRS reflective solar bands. Proc. SPIE 2012, 8510, 851018. [Google Scholar]
  10. Fulbright, J.P.; Lei, N.; Chiang, K.; Xiong, X. Characterization and performance of the Suomi-NPP/VIIRS solar diffuser stability monitor. Proc. SPIE 2012, 8510. [Google Scholar] [CrossRef]
  11. Fulbright, J.P.; Lei, N.; McIntire, J.; Efremova, B.; Chen, X.; Xiong, X. Improving the characterization and performance of the Suomi-NPP VIIRS solar diffuser stability monitor. Proc. SPIE 2013, 8866. [Google Scholar] [CrossRef]
  12. Sun, J.; Wang, M. Visible infrared imaging radiometer suite solar diffuser calibration and its challenges using a solar diffuser stability monitor. Appl. Opt. 2014, 53, 8571–8584. [Google Scholar] [CrossRef] [PubMed]
  13. Guzman, C.T.; Palmer, J.M.; Slater, P.N.; Bruegge, C.J.; Miller, E.A. Requirements of a solar diffuser and measurements of some candidate materials. Proc. SPIE 1991, 1493, 120–131. [Google Scholar]
  14. Bruegge, C.J.; Stiegman, A.E.; Coulter, D.R.; Hale, R.R.; Diner, D.J.; Springsteen, A.W. Reflectance stability analysis of Spectralon diffuse calibration panels. Proc. SPIE 1991, 1493, 132–142. [Google Scholar]
  15. Stiegman, A.E.; Bruegge, C.J.; Springsteen, A.W. Ultraviolet stability and contamination analysis of Spectralon diffuse reflectance material. Opt. Eng. 1993, 32, 799–804. [Google Scholar] [CrossRef]
  16. Bruegge, C.J.; Stiegman, A.E.; Rainen, R.A.; Springsteen, A.W. Use of Spectralon as a diffuse reflectance standard for in-flight calibration of earth-orbiting sensors. Opt. Eng. 1993, 32, 805–814. [Google Scholar] [CrossRef]
  17. Petroy, S.B.; Leland, J.E.; Chommeloux, B.; Bruegge, C.J.; Gourmelon, G. Phase 1: analysis of Spectralon material for use in on-board calibration systems for the medium resolution imaging spectrometer (MERIS). Proc. SPIE 1994, 2210, 616–624. [Google Scholar]
  18. Leland, J.E.; Arecchi, A.V. Phase 2 analysis of Spectralon material for use in on-board calibration systems for the medium-resolution imaging spectrometer (MERIS). Proc. SPIE 1995, 2475, 384–392. [Google Scholar]
  19. Georgiev, G.T.; Butler, J.J. Long-term calibration monitoring of Spectralon diffusers BRDF in the air-ultraviolet. Appl. Opt. 2007, 46, 7892–7899. [Google Scholar] [CrossRef] [PubMed]
  20. Georgiev, G.T.; Butler, J.J.; Thome, K.J.; Ramos-Izquierdo, L.A.; Ding, L.; Graziani, L.J.; Meadows, G.A. Initial studies of the directional reflectance changes in pressed and sintered PTFE diffusers following exposure to contamination and ionizing radiation. Metrologia 2014, 51. [Google Scholar] [CrossRef]
  21. Xiong, X.; Sun, J.; Xie, X.; Barnes, W.L.; Salomonson, V.V. On-orbit calibration and performance of aqua MODIS reflective solar bands. IEEE Trans. Geosci. Remote Sens. 2010, 48, 535–546. [Google Scholar] [CrossRef]
  22. Xiong, X.; Angal, A.; Sun, J.; Choi, T.; Johnson, E. On-orbit performance of MODIS solar diffuser stability monitor. J. Appl. Remote Sens. 2014, 8. [Google Scholar] [CrossRef]
  23. Markham, B.; Barsi, J.; Kvaran, G.; Ong, L.; Kaita, E.; Biggar, S.; Czapla-Myers, J.; Mishra, N.; Helder, D. Landsat-8 operational land imager radiometric calibration and stability. Remote Sens. 2014, 6, 12275–12308. [Google Scholar] [CrossRef]
  24. Yoshida, Y.; Kikuchi, N.; Yokota, T. On-orbit radiometric calibration of SWIR bands of TANSO-FTS onboard GOSAT. Atmos. Meas. Tech. 2012, 5, 2515–2523. [Google Scholar] [CrossRef] [Green Version]
  25. Grossman, E.; Gouzman, I. Space environment effects on polymers in low earth orbit. Nucl. Instrum. Methods Phys. Res. Sect. B Beam Interact. Mater. Atoms 2003, 208, 48–57. [Google Scholar] [CrossRef]
  26. Bennett, H.E.; Porteus, J.O. Relation between surface roughness and specular reflectance at normal incidence. J. Opt. Soc. Am. 1961, 51. [Google Scholar] [CrossRef]
  27. Bennett, H.E. Scattering characteristics of optical materials. Opt. Eng. 1978, 17. [Google Scholar] [CrossRef]
  28. Sparks, M. Explanation of λ-2 optical scattering and λ-2 Strehl on-axis irradiance reduction. J. Opt. Soc. Am. 1983, 73. [Google Scholar] [CrossRef]
  29. Elson, J.M. Theory of light scattering from a rough surface with an inhomogeneous dielectric permittivity. Phys. Rev. B 1984, 30, 5460–5480. [Google Scholar] [CrossRef]
  30. Schröder, S.; Duparré, A.; Coriand, L.; Tünnermann, A.; Penalver, D.H.; Harvey, J.E. Modeling of light scattering in different regimes of surface roughness. Opt. Express 2011, 19, 9820–9835. [Google Scholar] [CrossRef] [PubMed]
  31. Harvey, J.E.; Schröder, S.; Choi, N.; Duparré, A. Total integrated scatter from surfaces with arbitrary roughness, correlation widths, and incident angles. Opt. Eng. 2012, 51. [Google Scholar] [CrossRef]
  32. Wolff, L.B. Diffuse-reflectance model for smooth dielectric surfaces. J. Opt. Soc. Am. A 1994, 11, 2956–2968. [Google Scholar] [CrossRef]
  33. Elson, J.M.; Rahn, J.P.; Bennett, J.M. Relationship of the total integrated scattering from multilayer-coated optics to angle of incidence, polarization, correlation length, and roughness cross-correlation properties. Appl. Opt. 1983, 22, 3207–3219. [Google Scholar] [CrossRef] [PubMed]
  34. Lei, N.; Xiong, X. Determination of the SNPP VIIRS solar diffuser BRDF degradation factor over wavelengths longer than 1 μm. Proc. SPIE 2015, 9607. [Google Scholar] [CrossRef]
  35. Xiong, X.; Fulbright, J.; Angal, A.; Wang, Z.; Geng, X.; Butler, J. Assessment of MODIS and VIIRS solar diffuser on-orbit degradation. Proc. SPIE 2015, 9607. [Google Scholar] [CrossRef]
  36. Lei, N.; Xiong, X. Estimation of the accuracy of the SNPP VIIRS SD BRDF degradation factor determined by the solar diffuser stability monitor. Proc. SPIE 2015, 9607. [Google Scholar] [CrossRef]
  37. Lei, N.; Xiong, X. Impact of the angular dependence of the SNPP VIIRS solar diffuser BRDF degradation factor on the radiometric calibration of the reflective solar bands. Proc. SPIE 2015, 9607. [Google Scholar] [CrossRef]
Figure 1. Solar diffuser (SD) and solar diffuser stability monitor (SDSM) used for onboard calibration for VIIRS RSBs (from JPSS VIIRS SDR ATBD).
Remotesensing 08 00254 g001
Figure 2. (a1) Spacecraft solar zenith angle and (a2) solar light illumination of VIIRS SD as seen by I1 channel detectors (overlaid together) over multiple orbits; and (b) zoom-in view of I1 view of SD.
Remotesensing 08 00254 g002
Figure 3. (a) VIIRS SD degradation over time as revealed by H factor for M1–M7 band; and (b) spectral dependence of VIIRS SD reflectance change over time.
Remotesensing 08 00254 g003
Figure 4. Illustration of statistical parameters used in characterizing surface roughness.
Remotesensing 08 00254 g004
Figure 5. Applying Bennett and Porteus (Equation (4)) and Surface Roughness based Rayleigh Scattering (SRRS) model to fit for spectral dependent degradation of VIIRS SD.
Remotesensing 08 00254 g005
Figure 6. Fitting of VIIRS SD spectral reflectance with the SRRS reflectance correction model (Equation (8)) at several instants during 2.5 years operation of VIIRS.
Remotesensing 08 00254 g006
Figure 7. (a) Trending of VIIRS SD surface roughness characteristic parameter σ s l ; and (b) evolution of correlation coefficient (b1) and Root-Mean-Square (RMS) error (b2) of the spectral fitting using Equation (8). The RMS errors are calculated for short wavelengths (<600 nm), long wavelengths (>600 nm) and whole spectral range combined, respectively.
Remotesensing 08 00254 g007
Table 1. Wavelength of VIIRS RSBs used in monitoring SD degradation.
VIIRS BandM1M2M3M4M5M6M7
Center λ (μm)0.4120.4450.4880.5550.6720.7460.865

