
Assessing the Impact of Climate Variability on Cropland Productivity in the Canadian Prairies Using Time Series MODIS FAPAR

 , ,
, ,
Abstract
:
1. Introduction
2. Materials and Methods
2.1. FAPAR Product
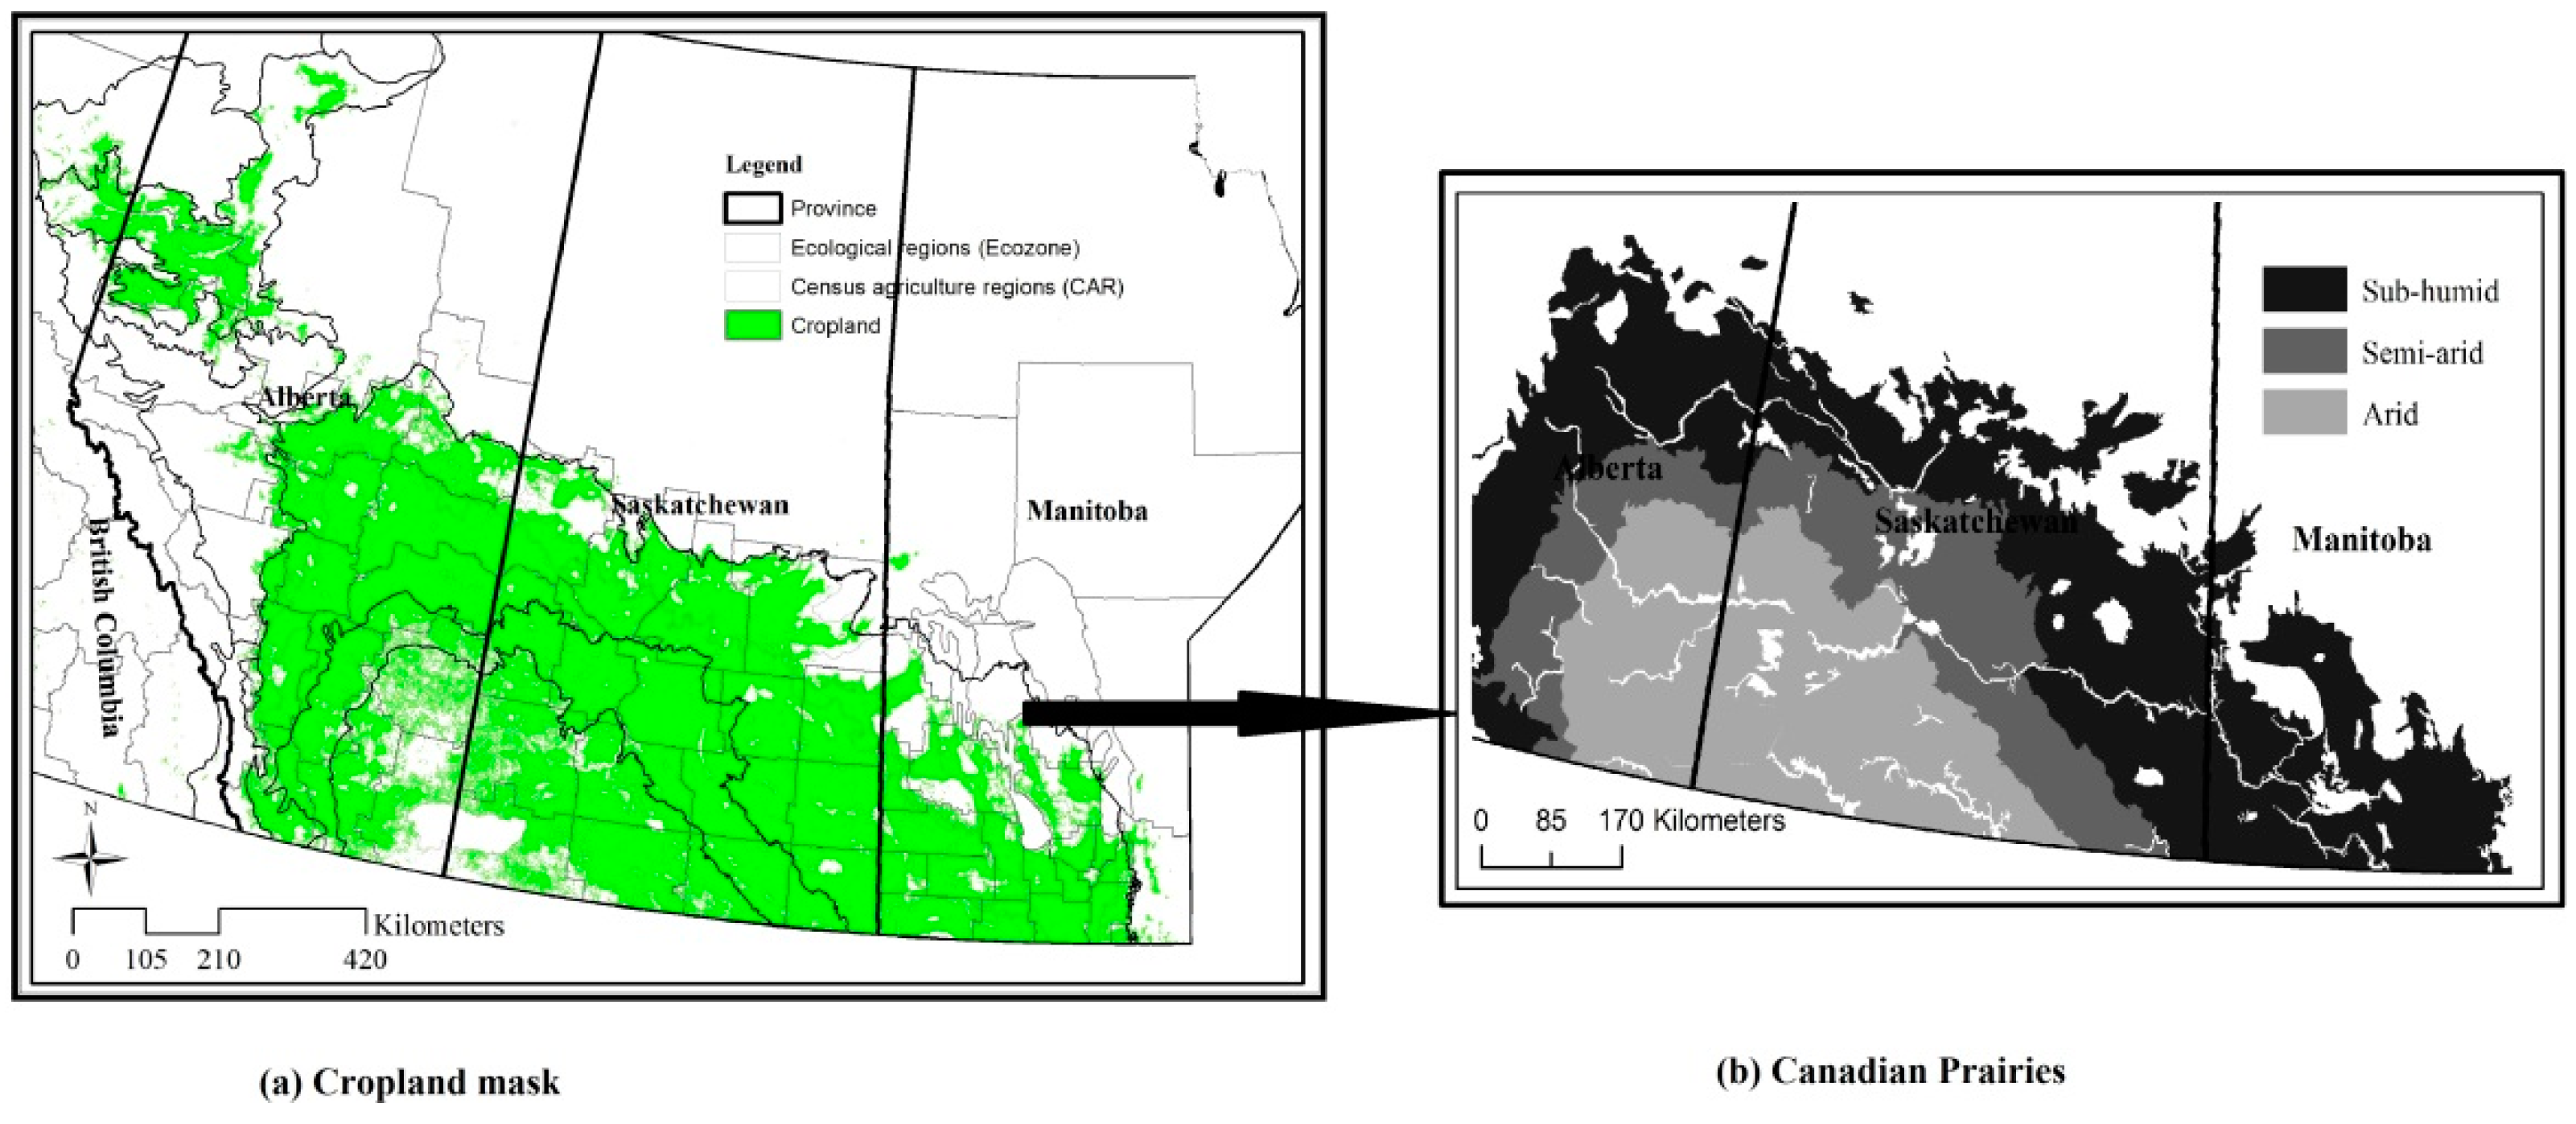
2.2. Cropland Mask
2.3. Climate Data
2.4. Phenological Metrics
2.5. Crop Yield Statistics
2.6. Statistical Analysis
2.6.1. Mann-Kendall Trend Analysis
2.6.2. Partial Correlation Analysis
3. Results
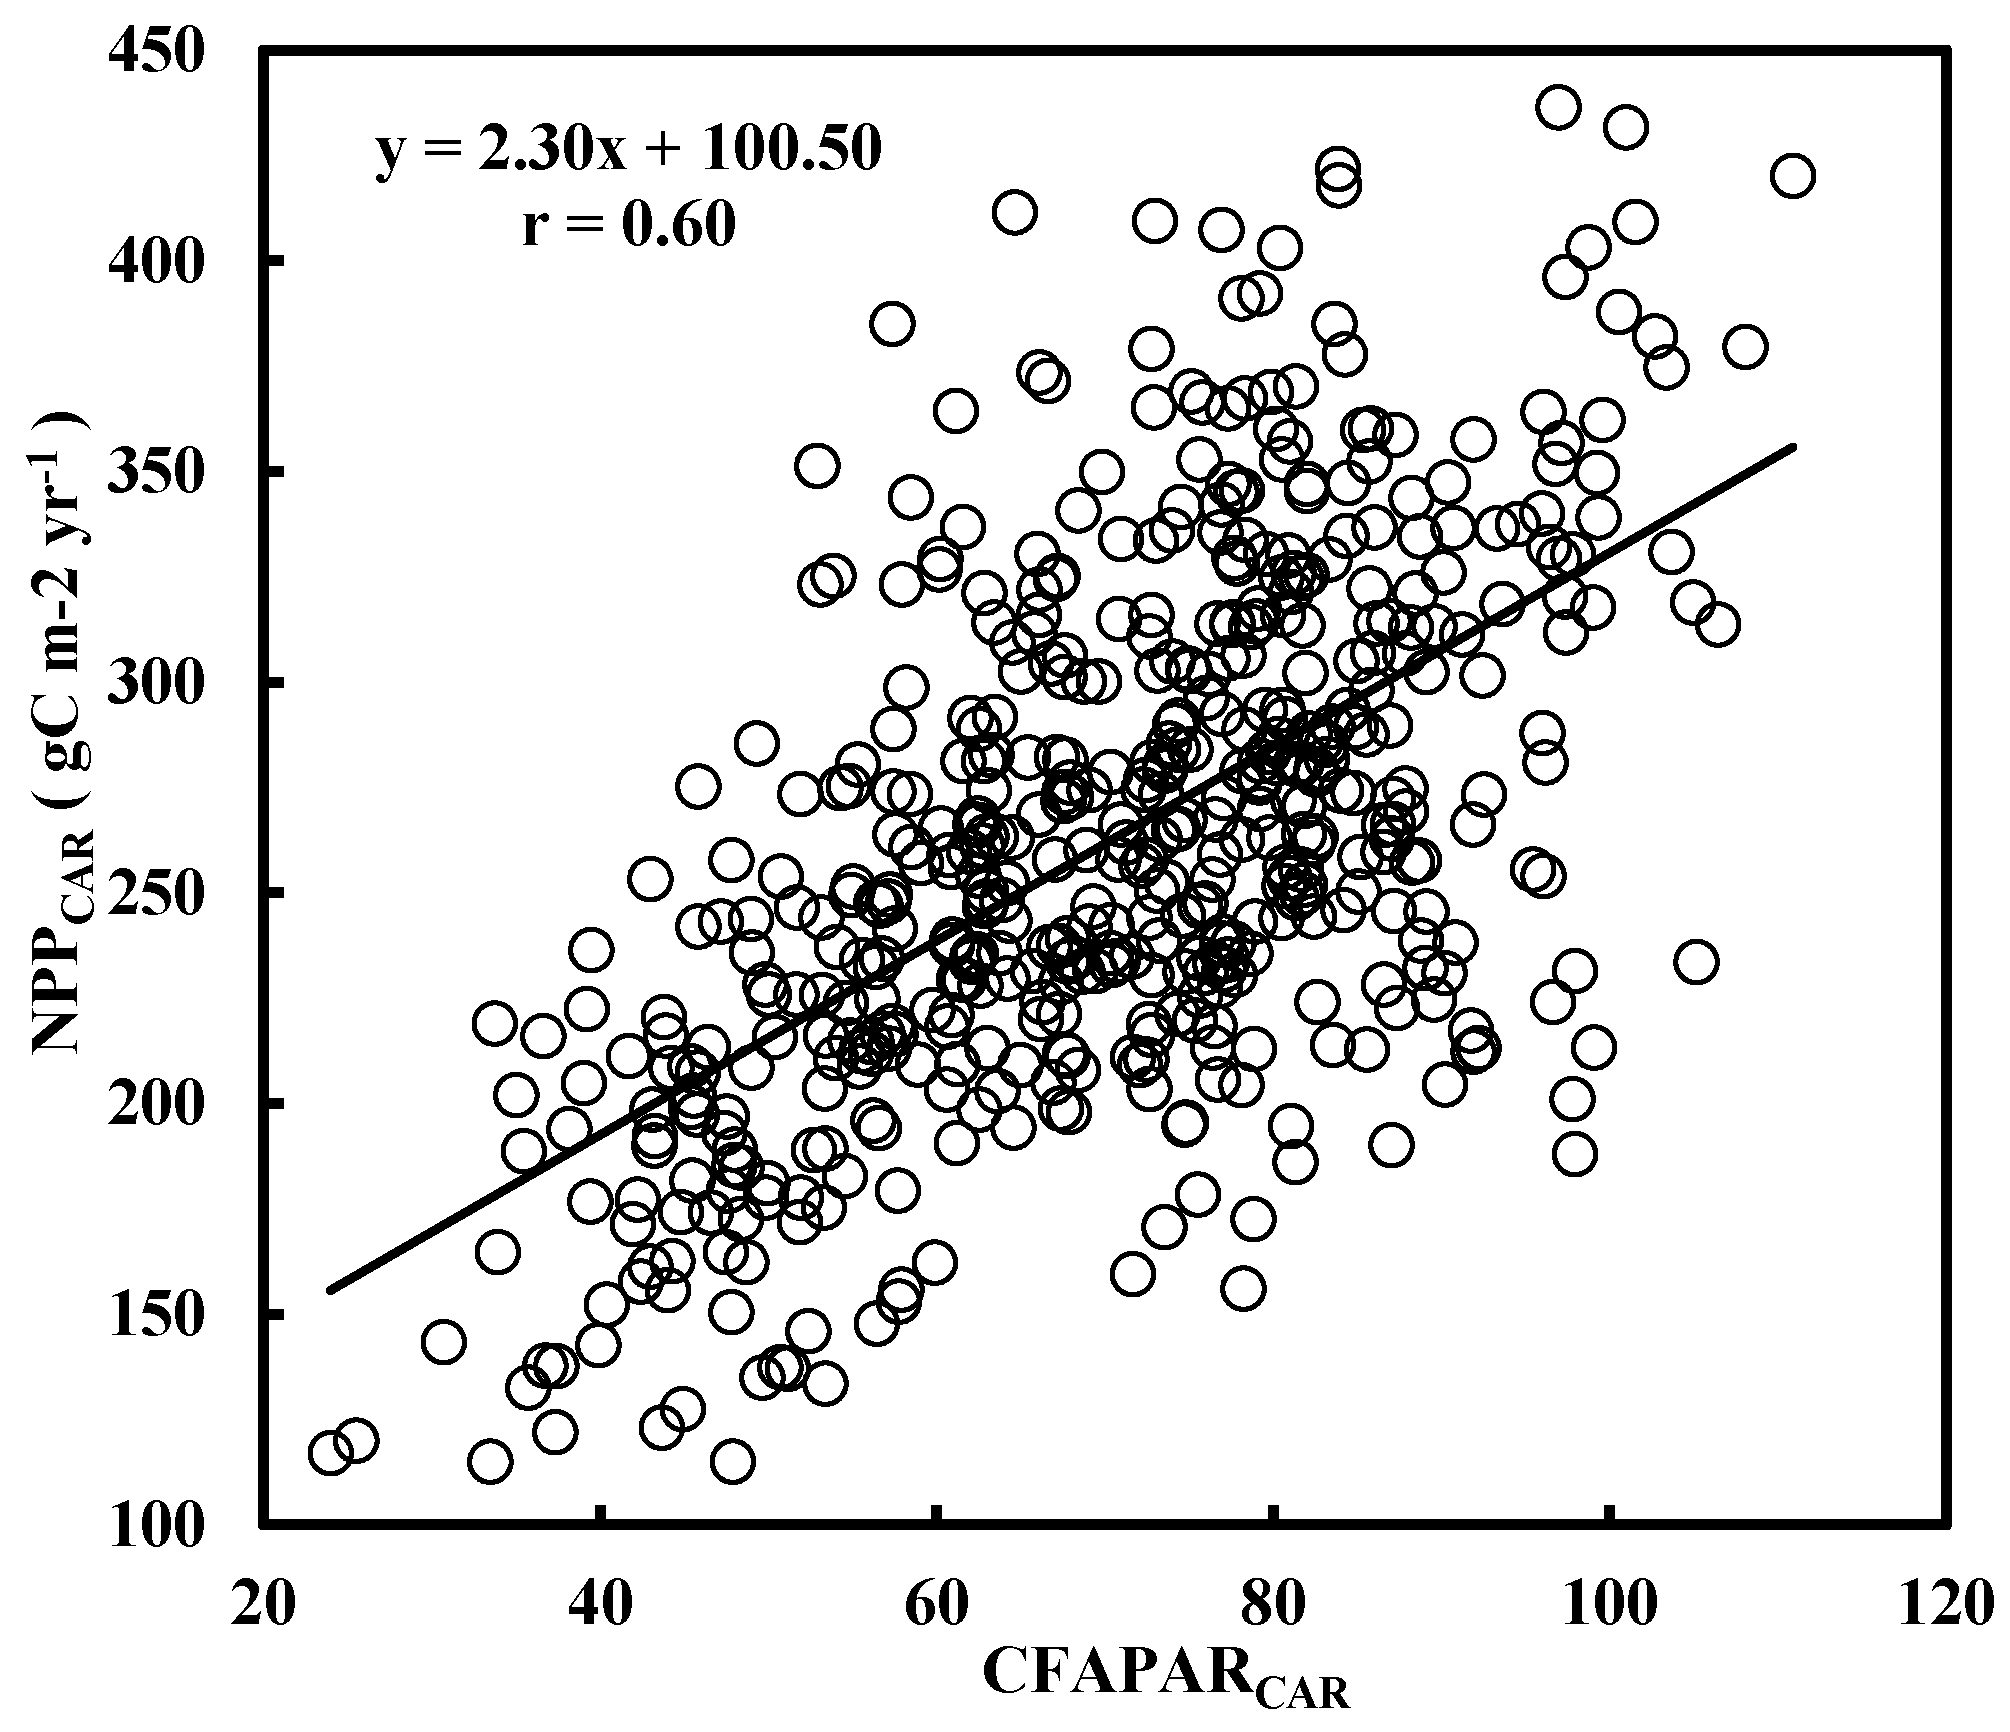
3.1. Assessment of CFAPAR for Cropland Productivity
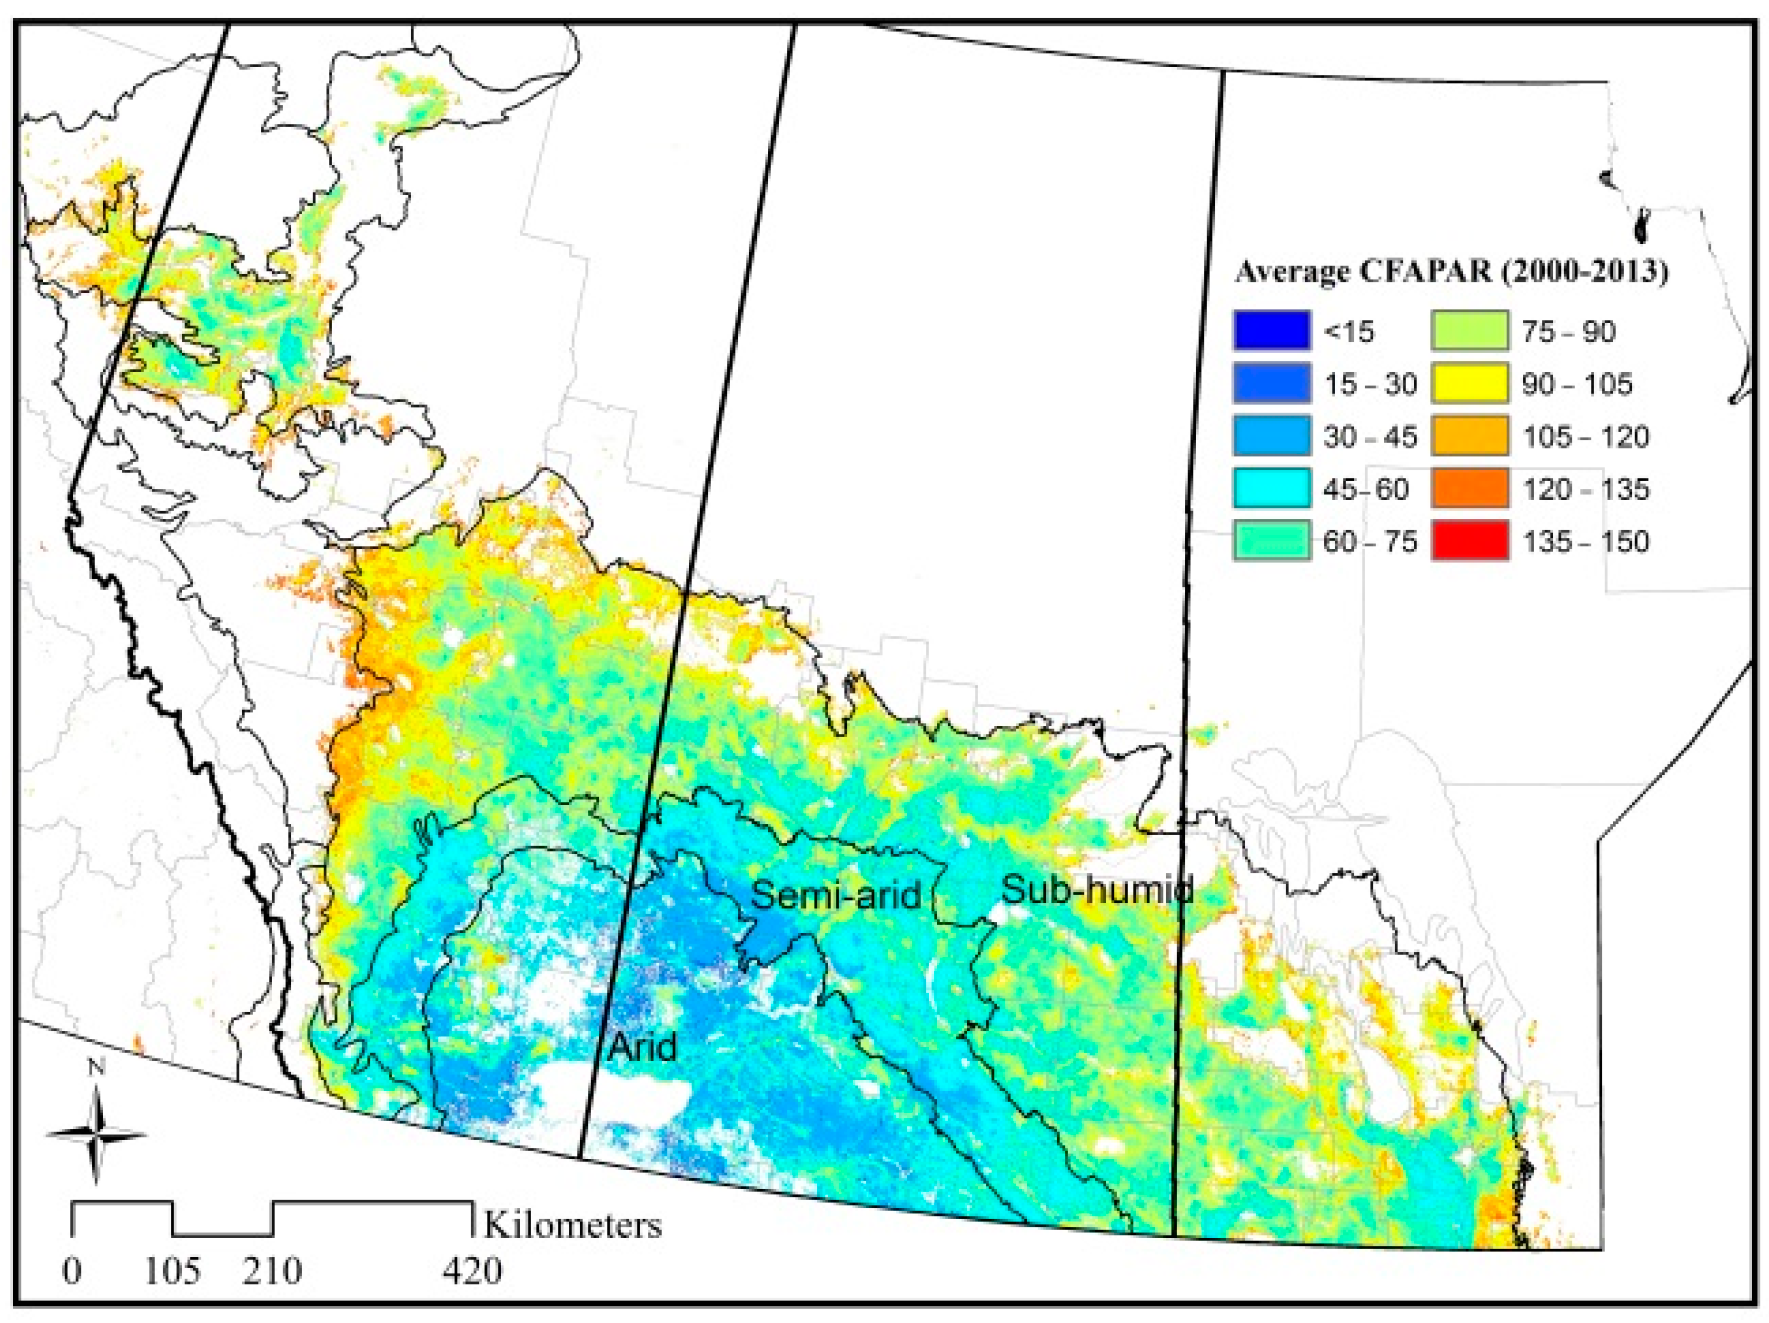
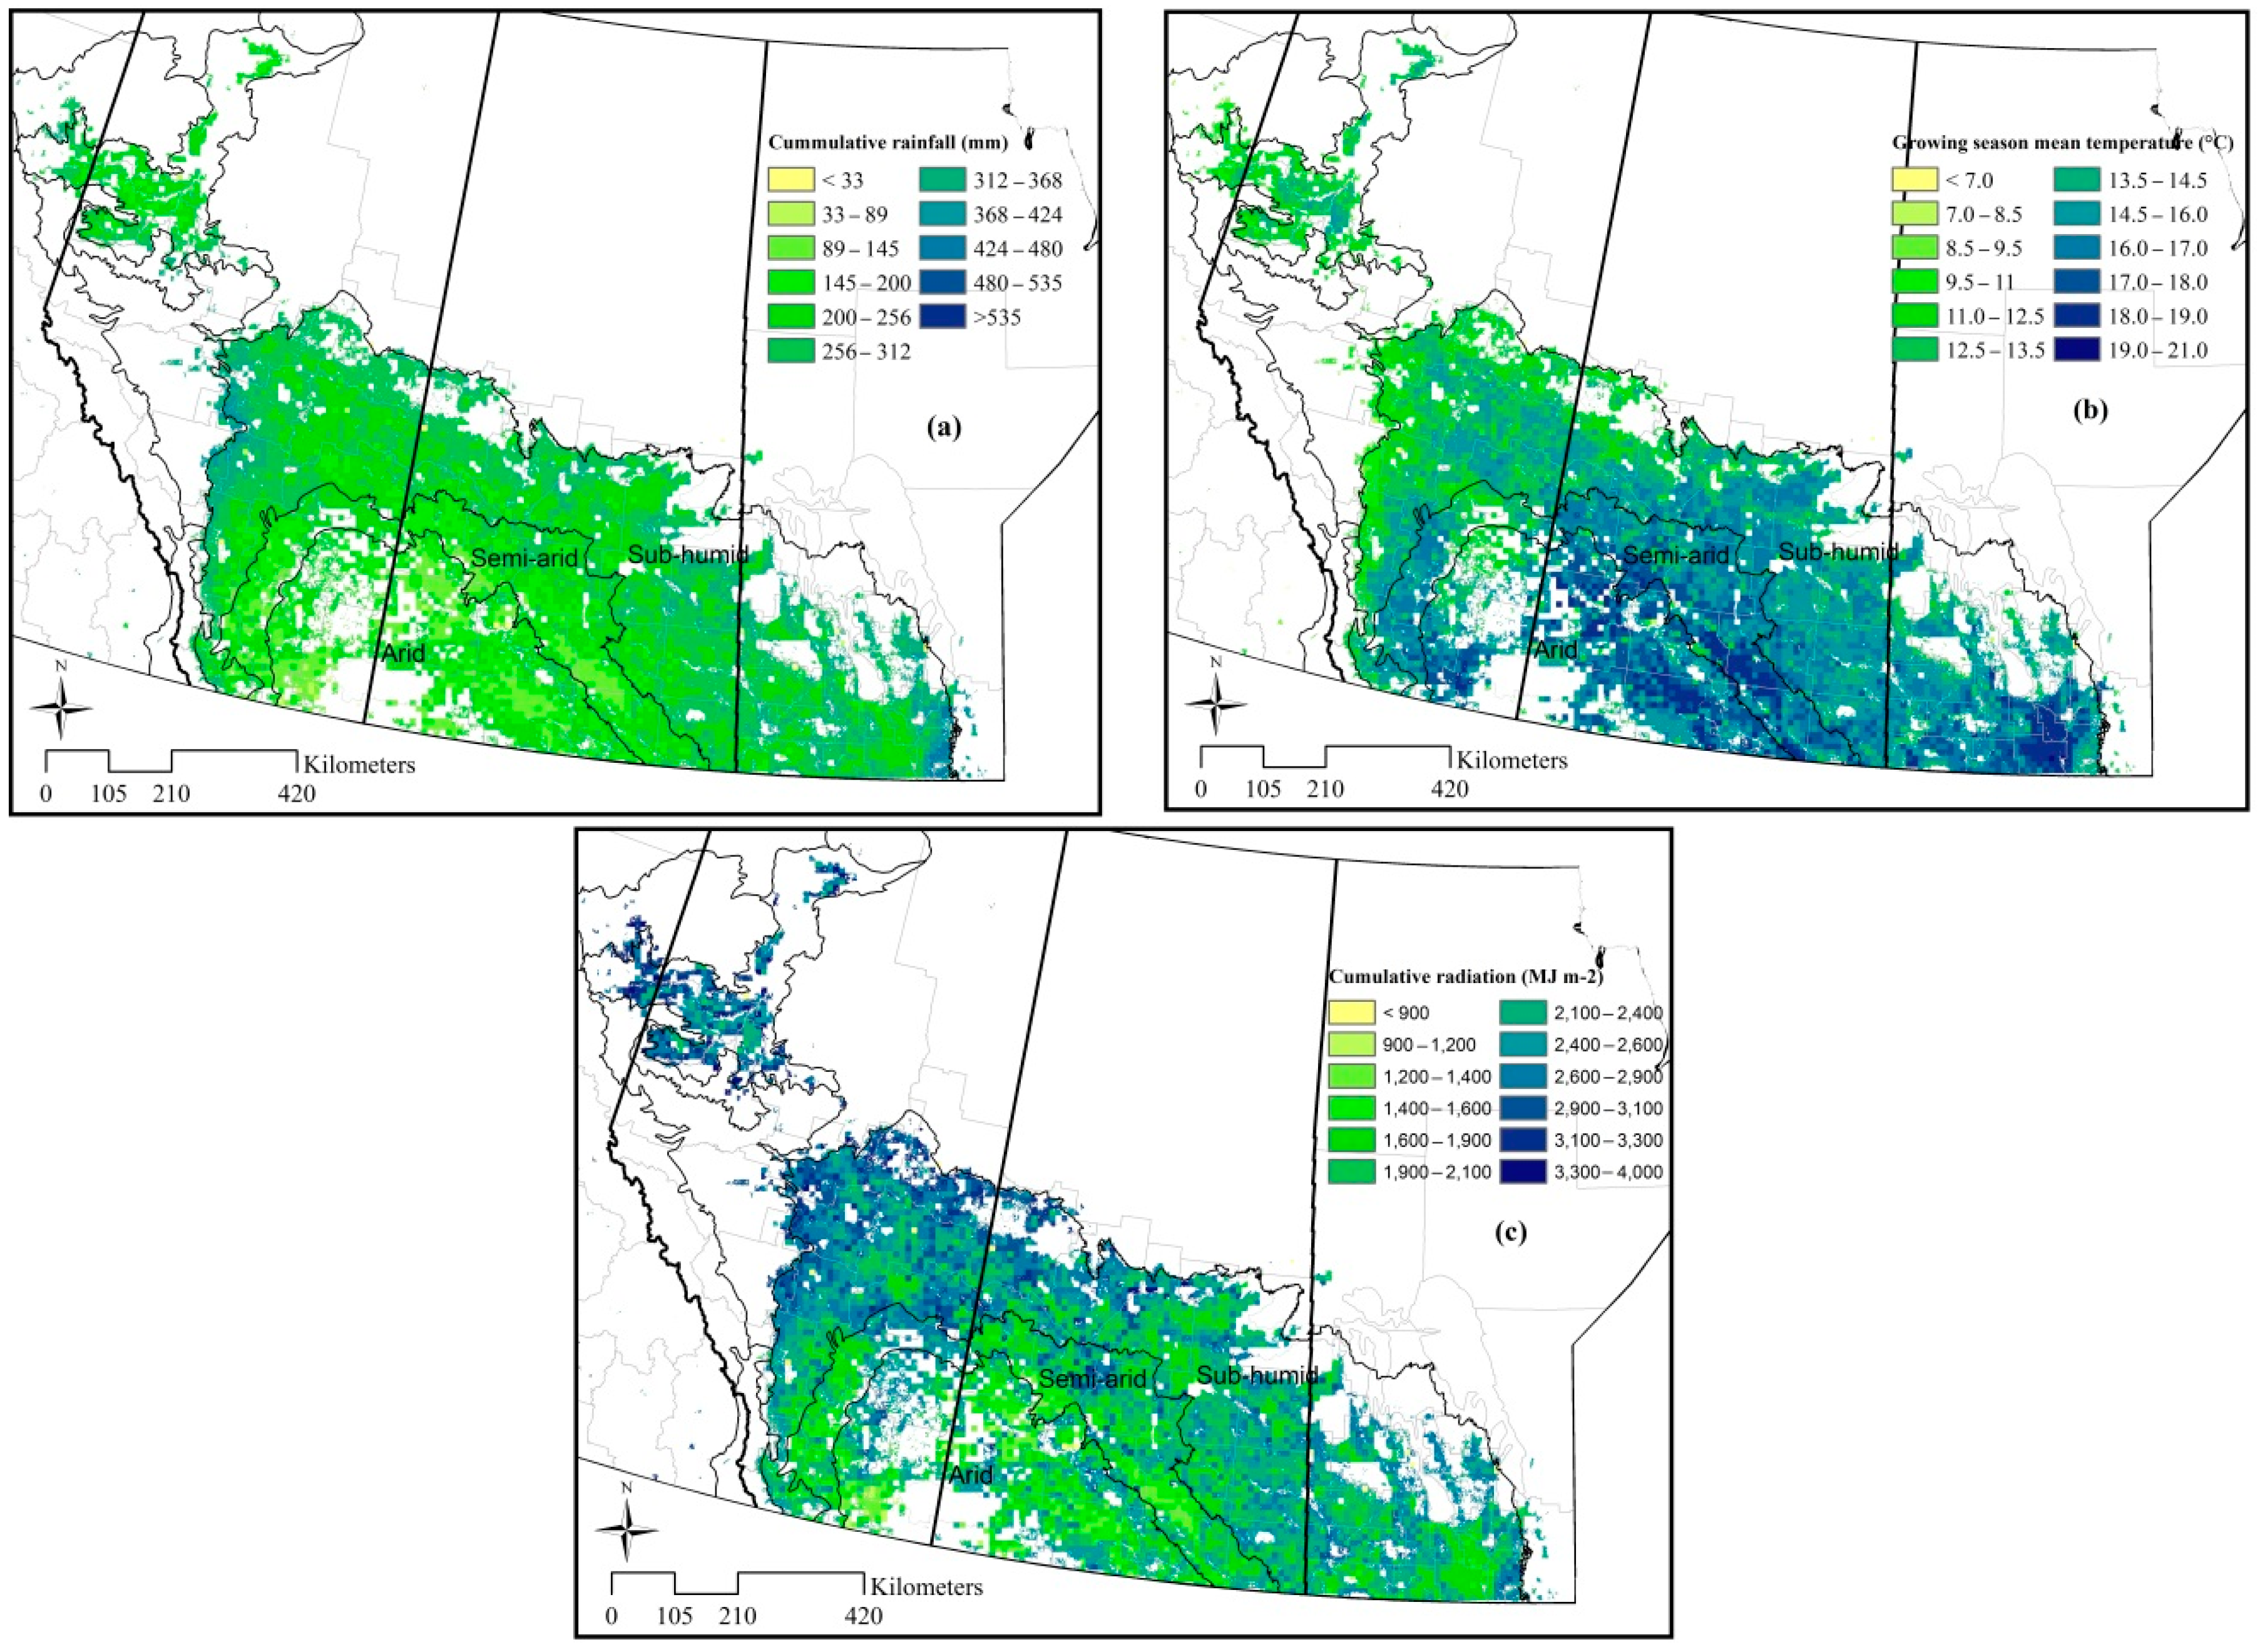
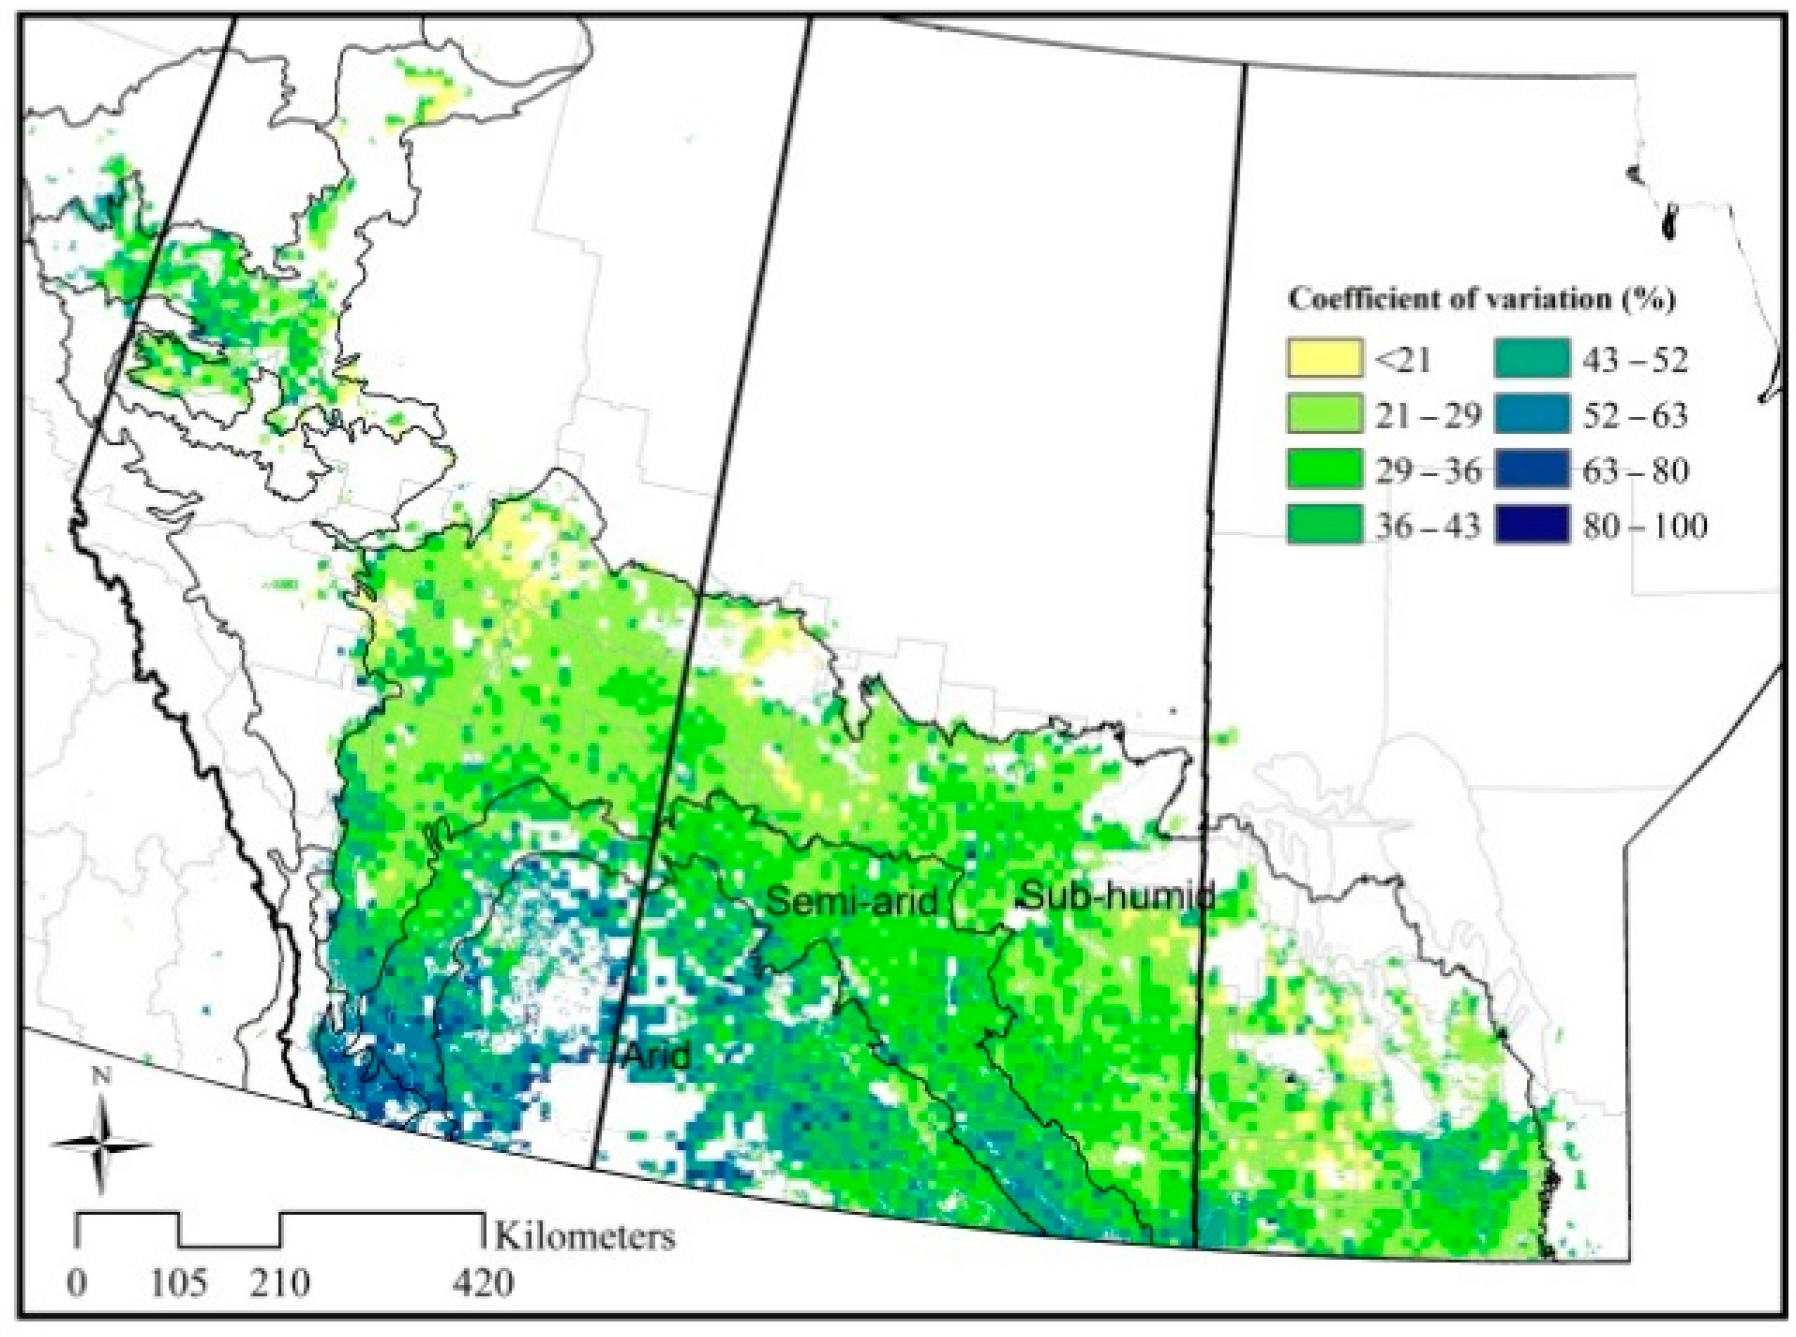
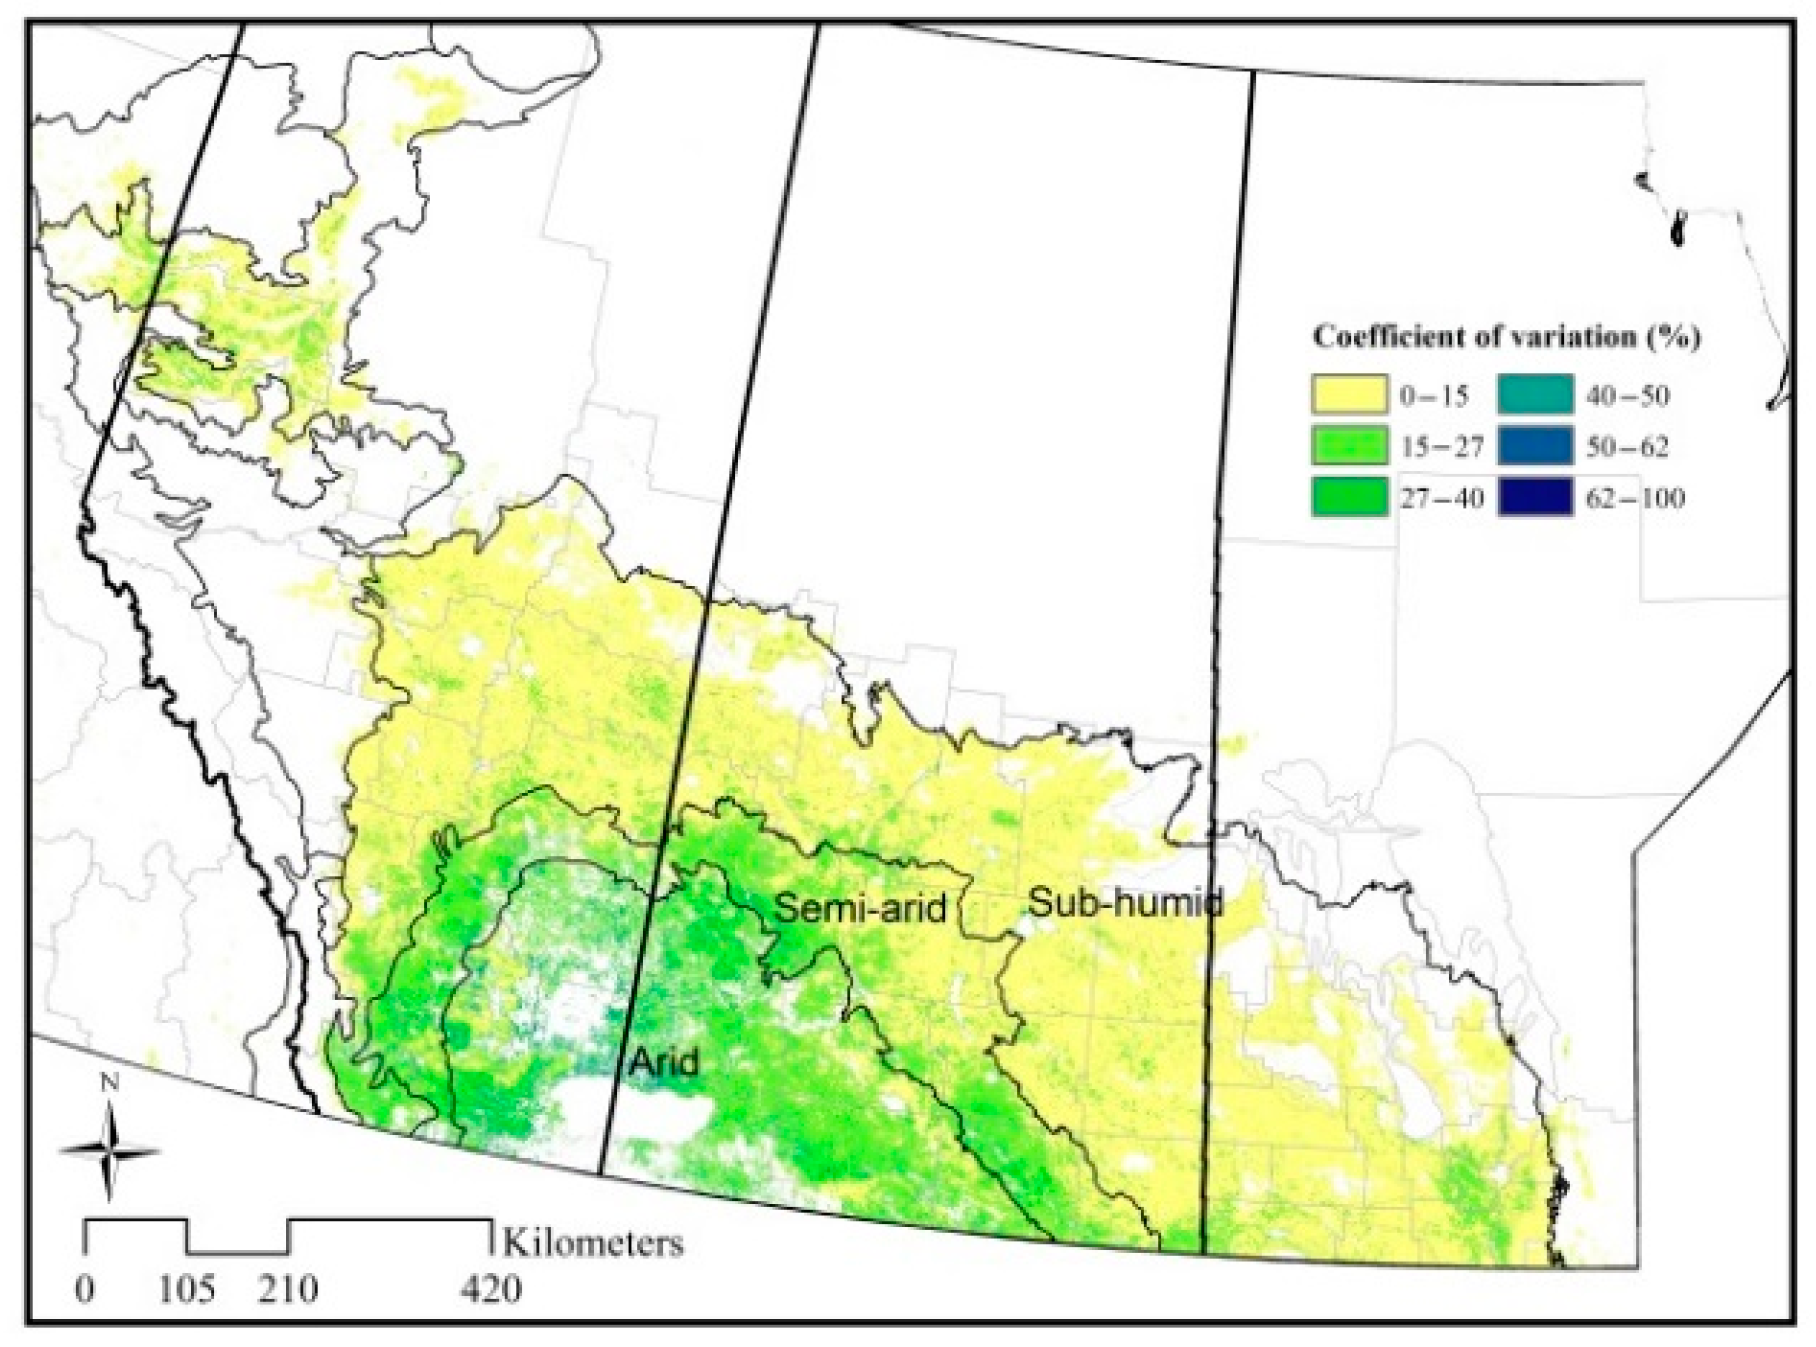
3.2. Spatial Patterns of Cropland Productivity and Climate Indices
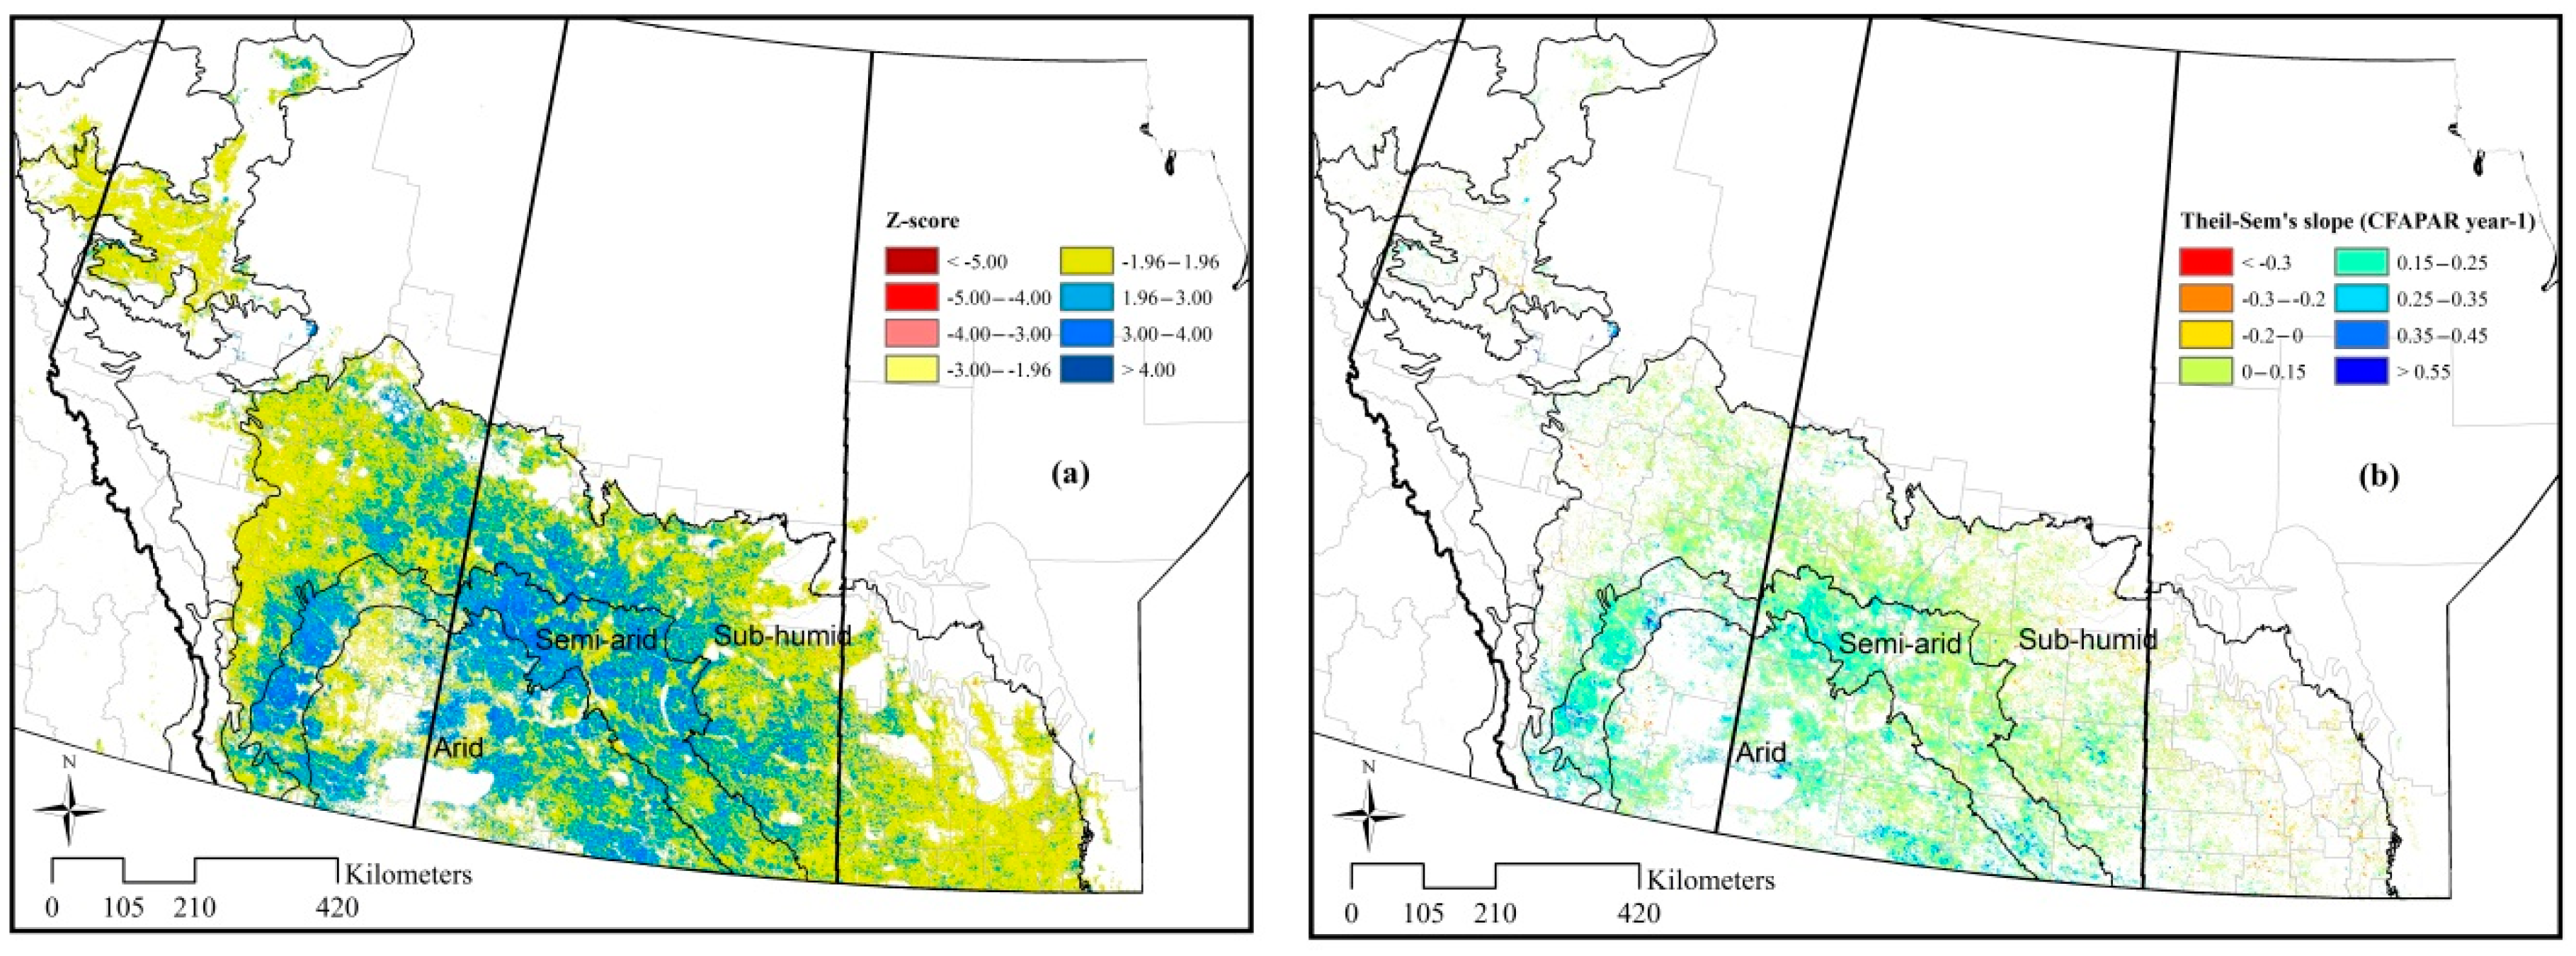
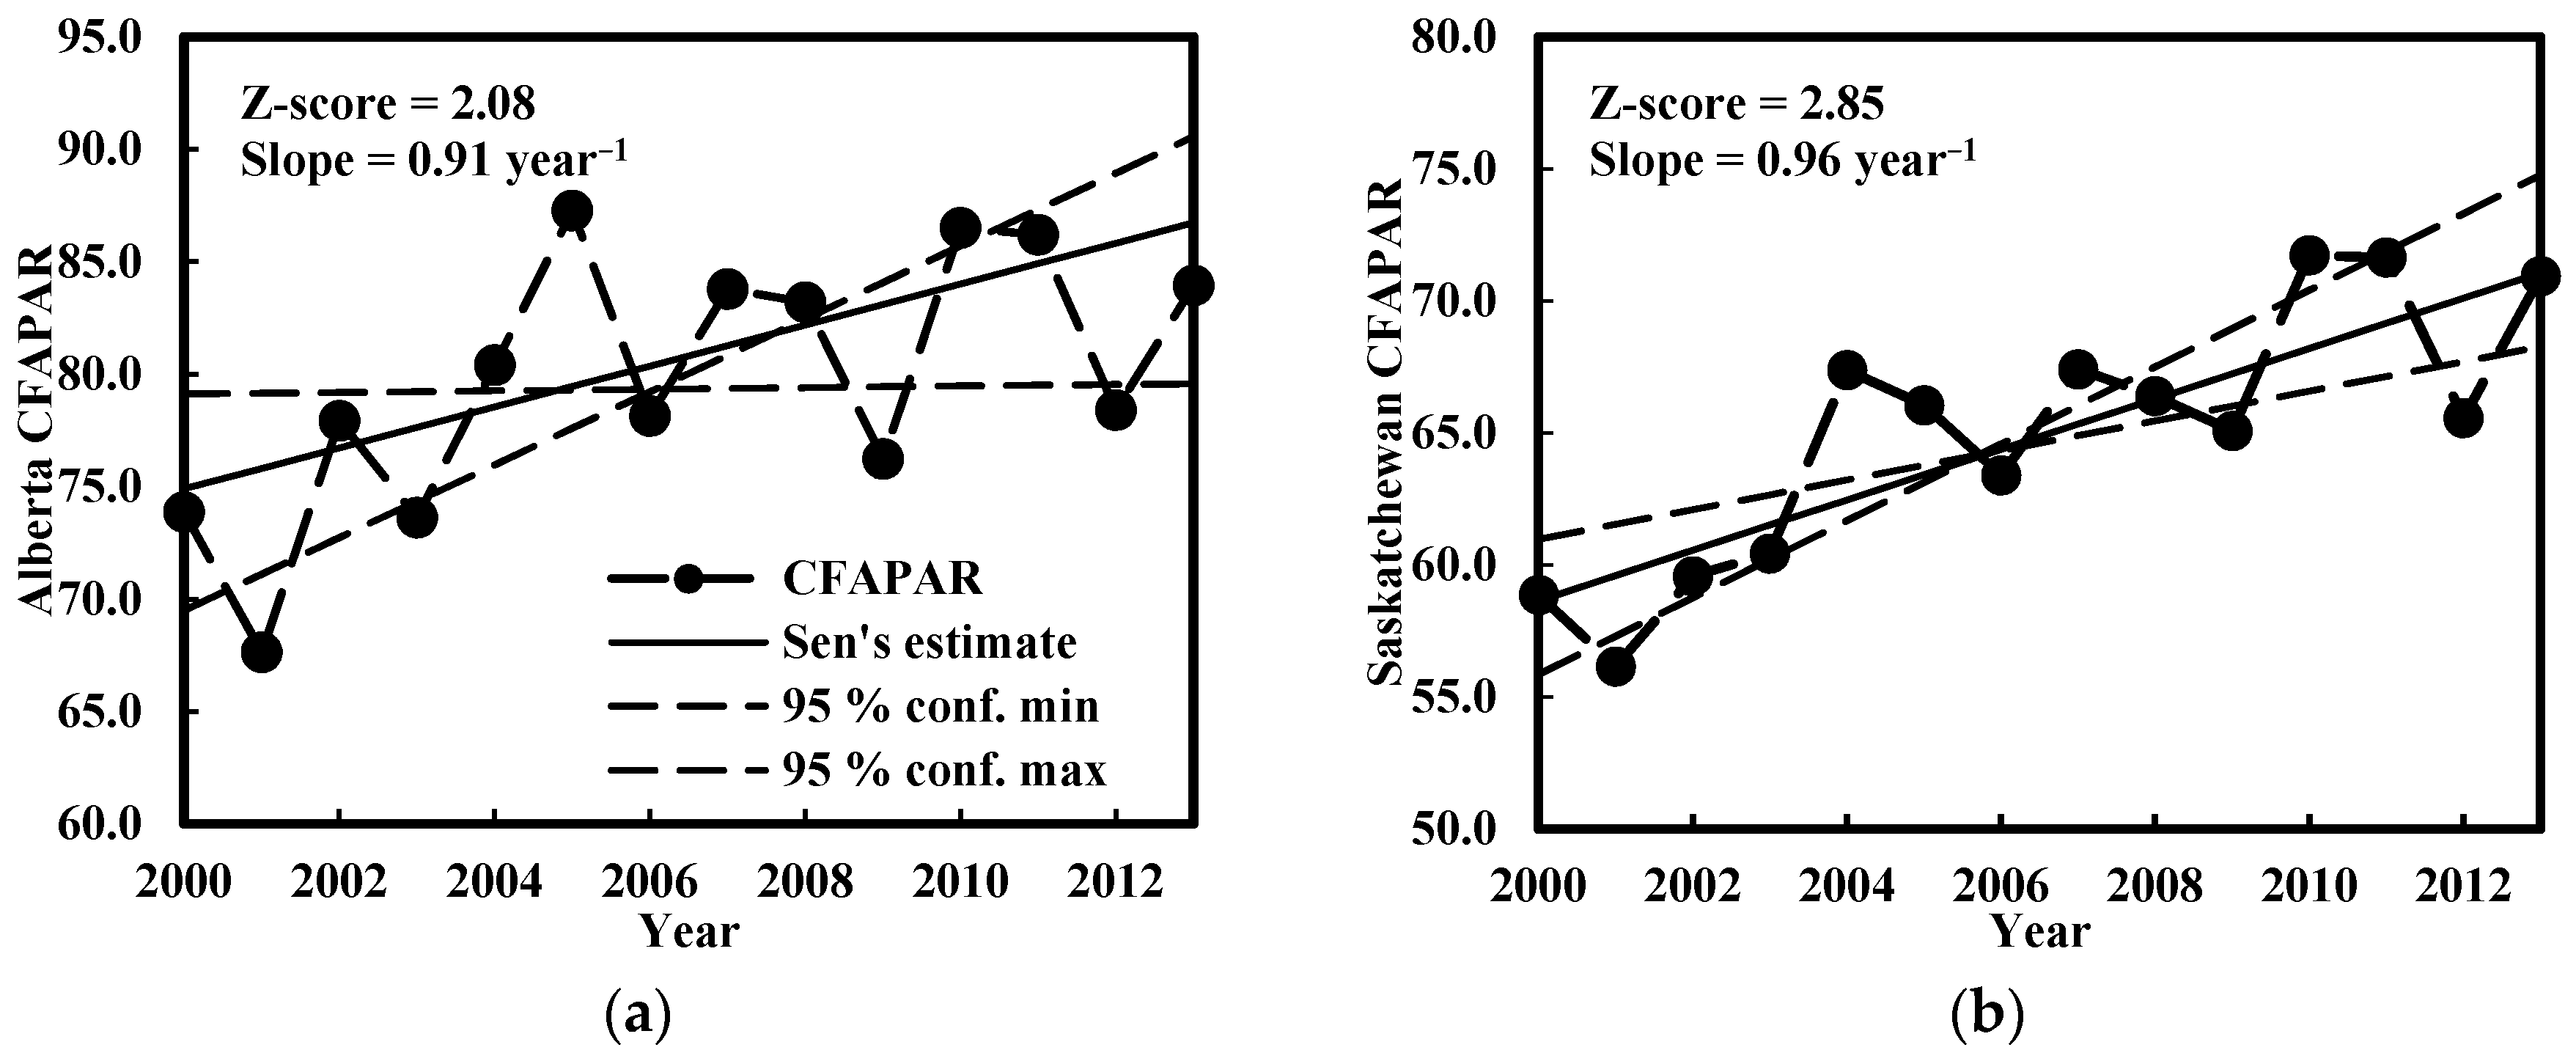
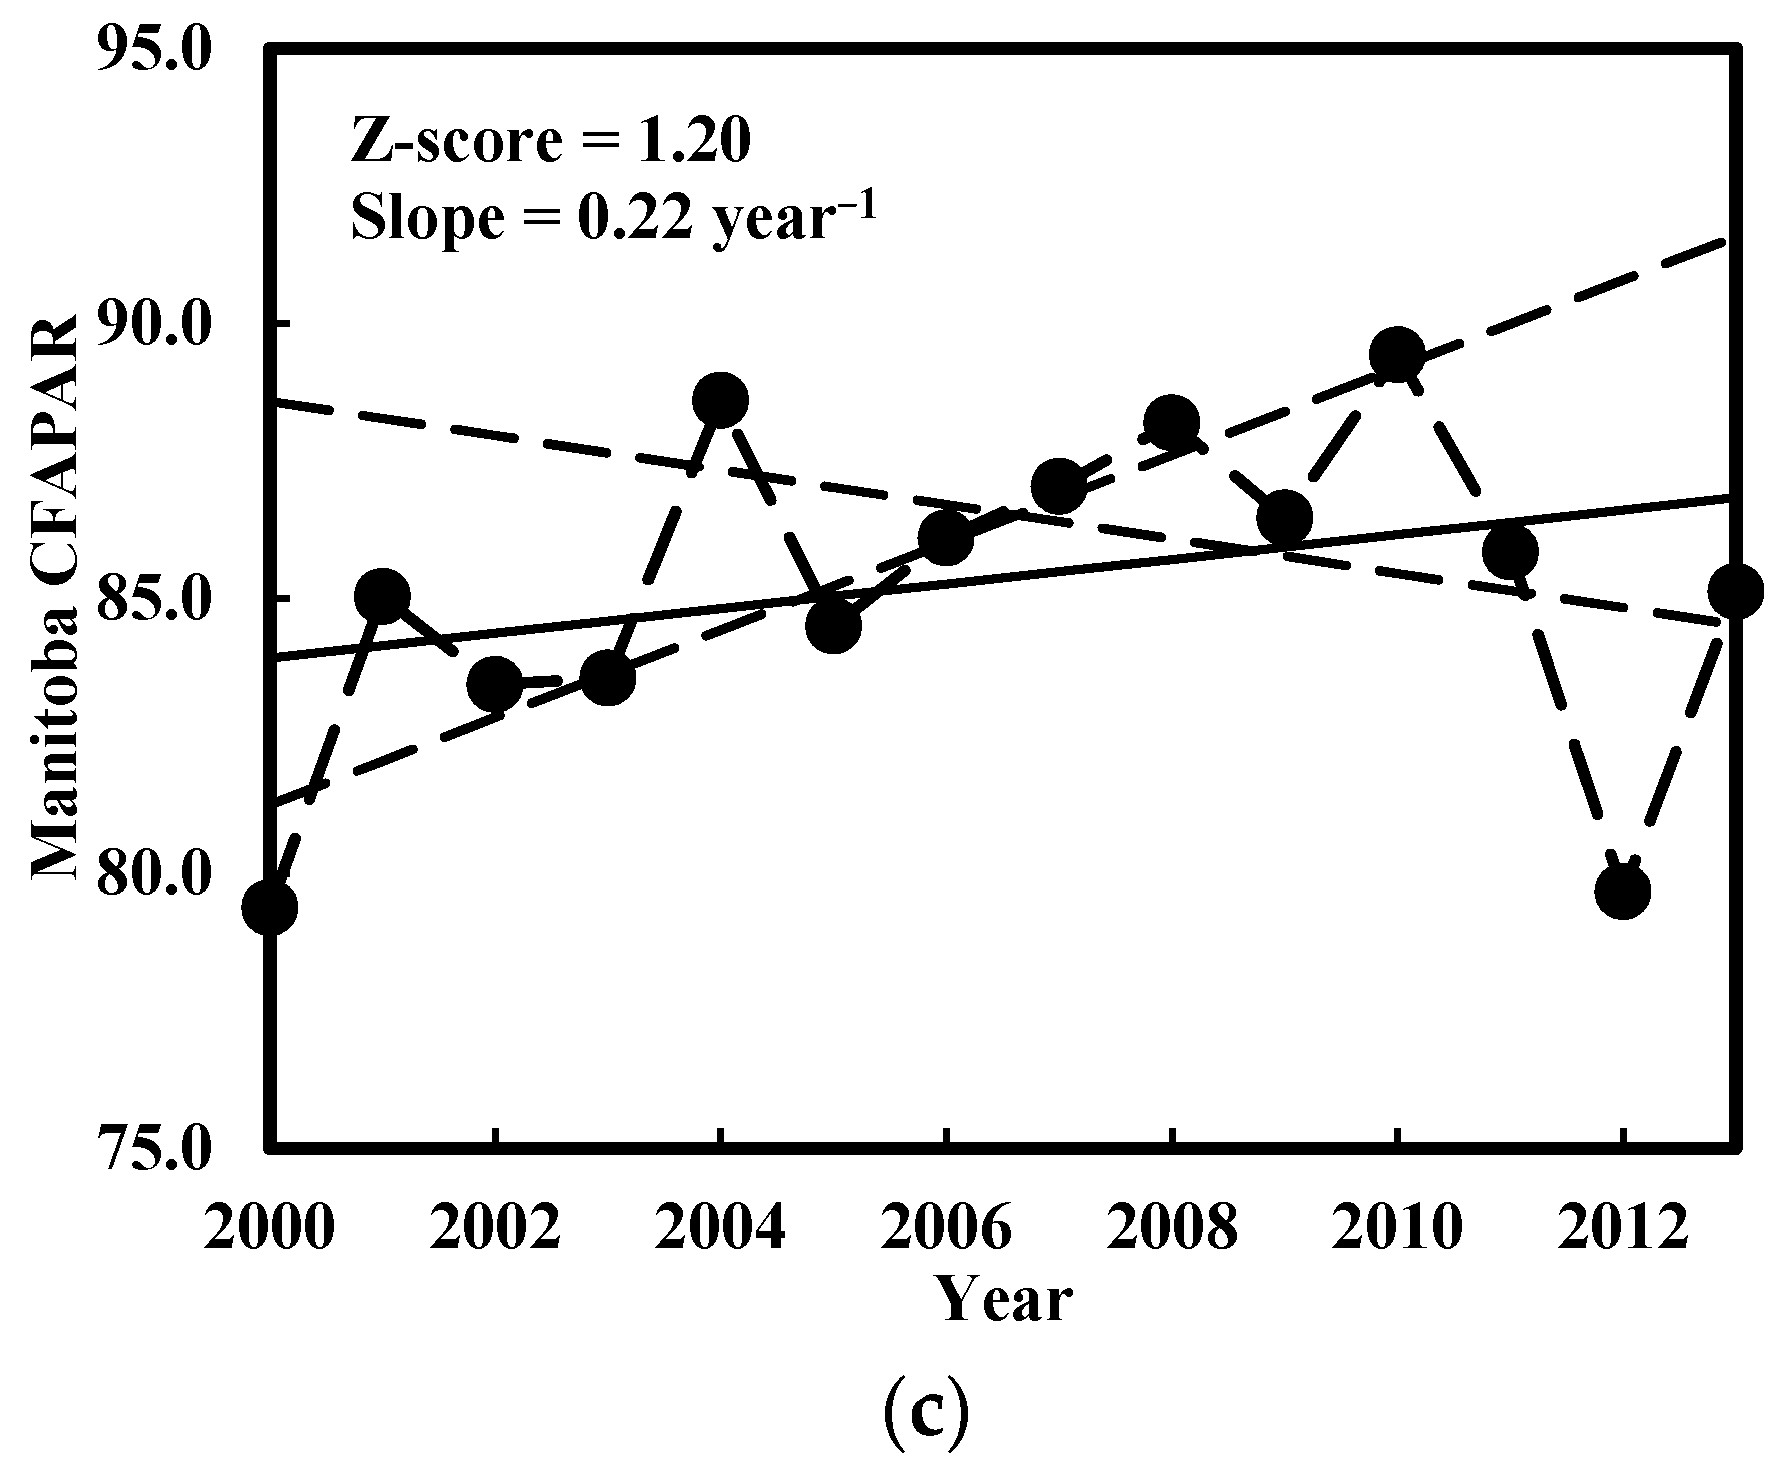
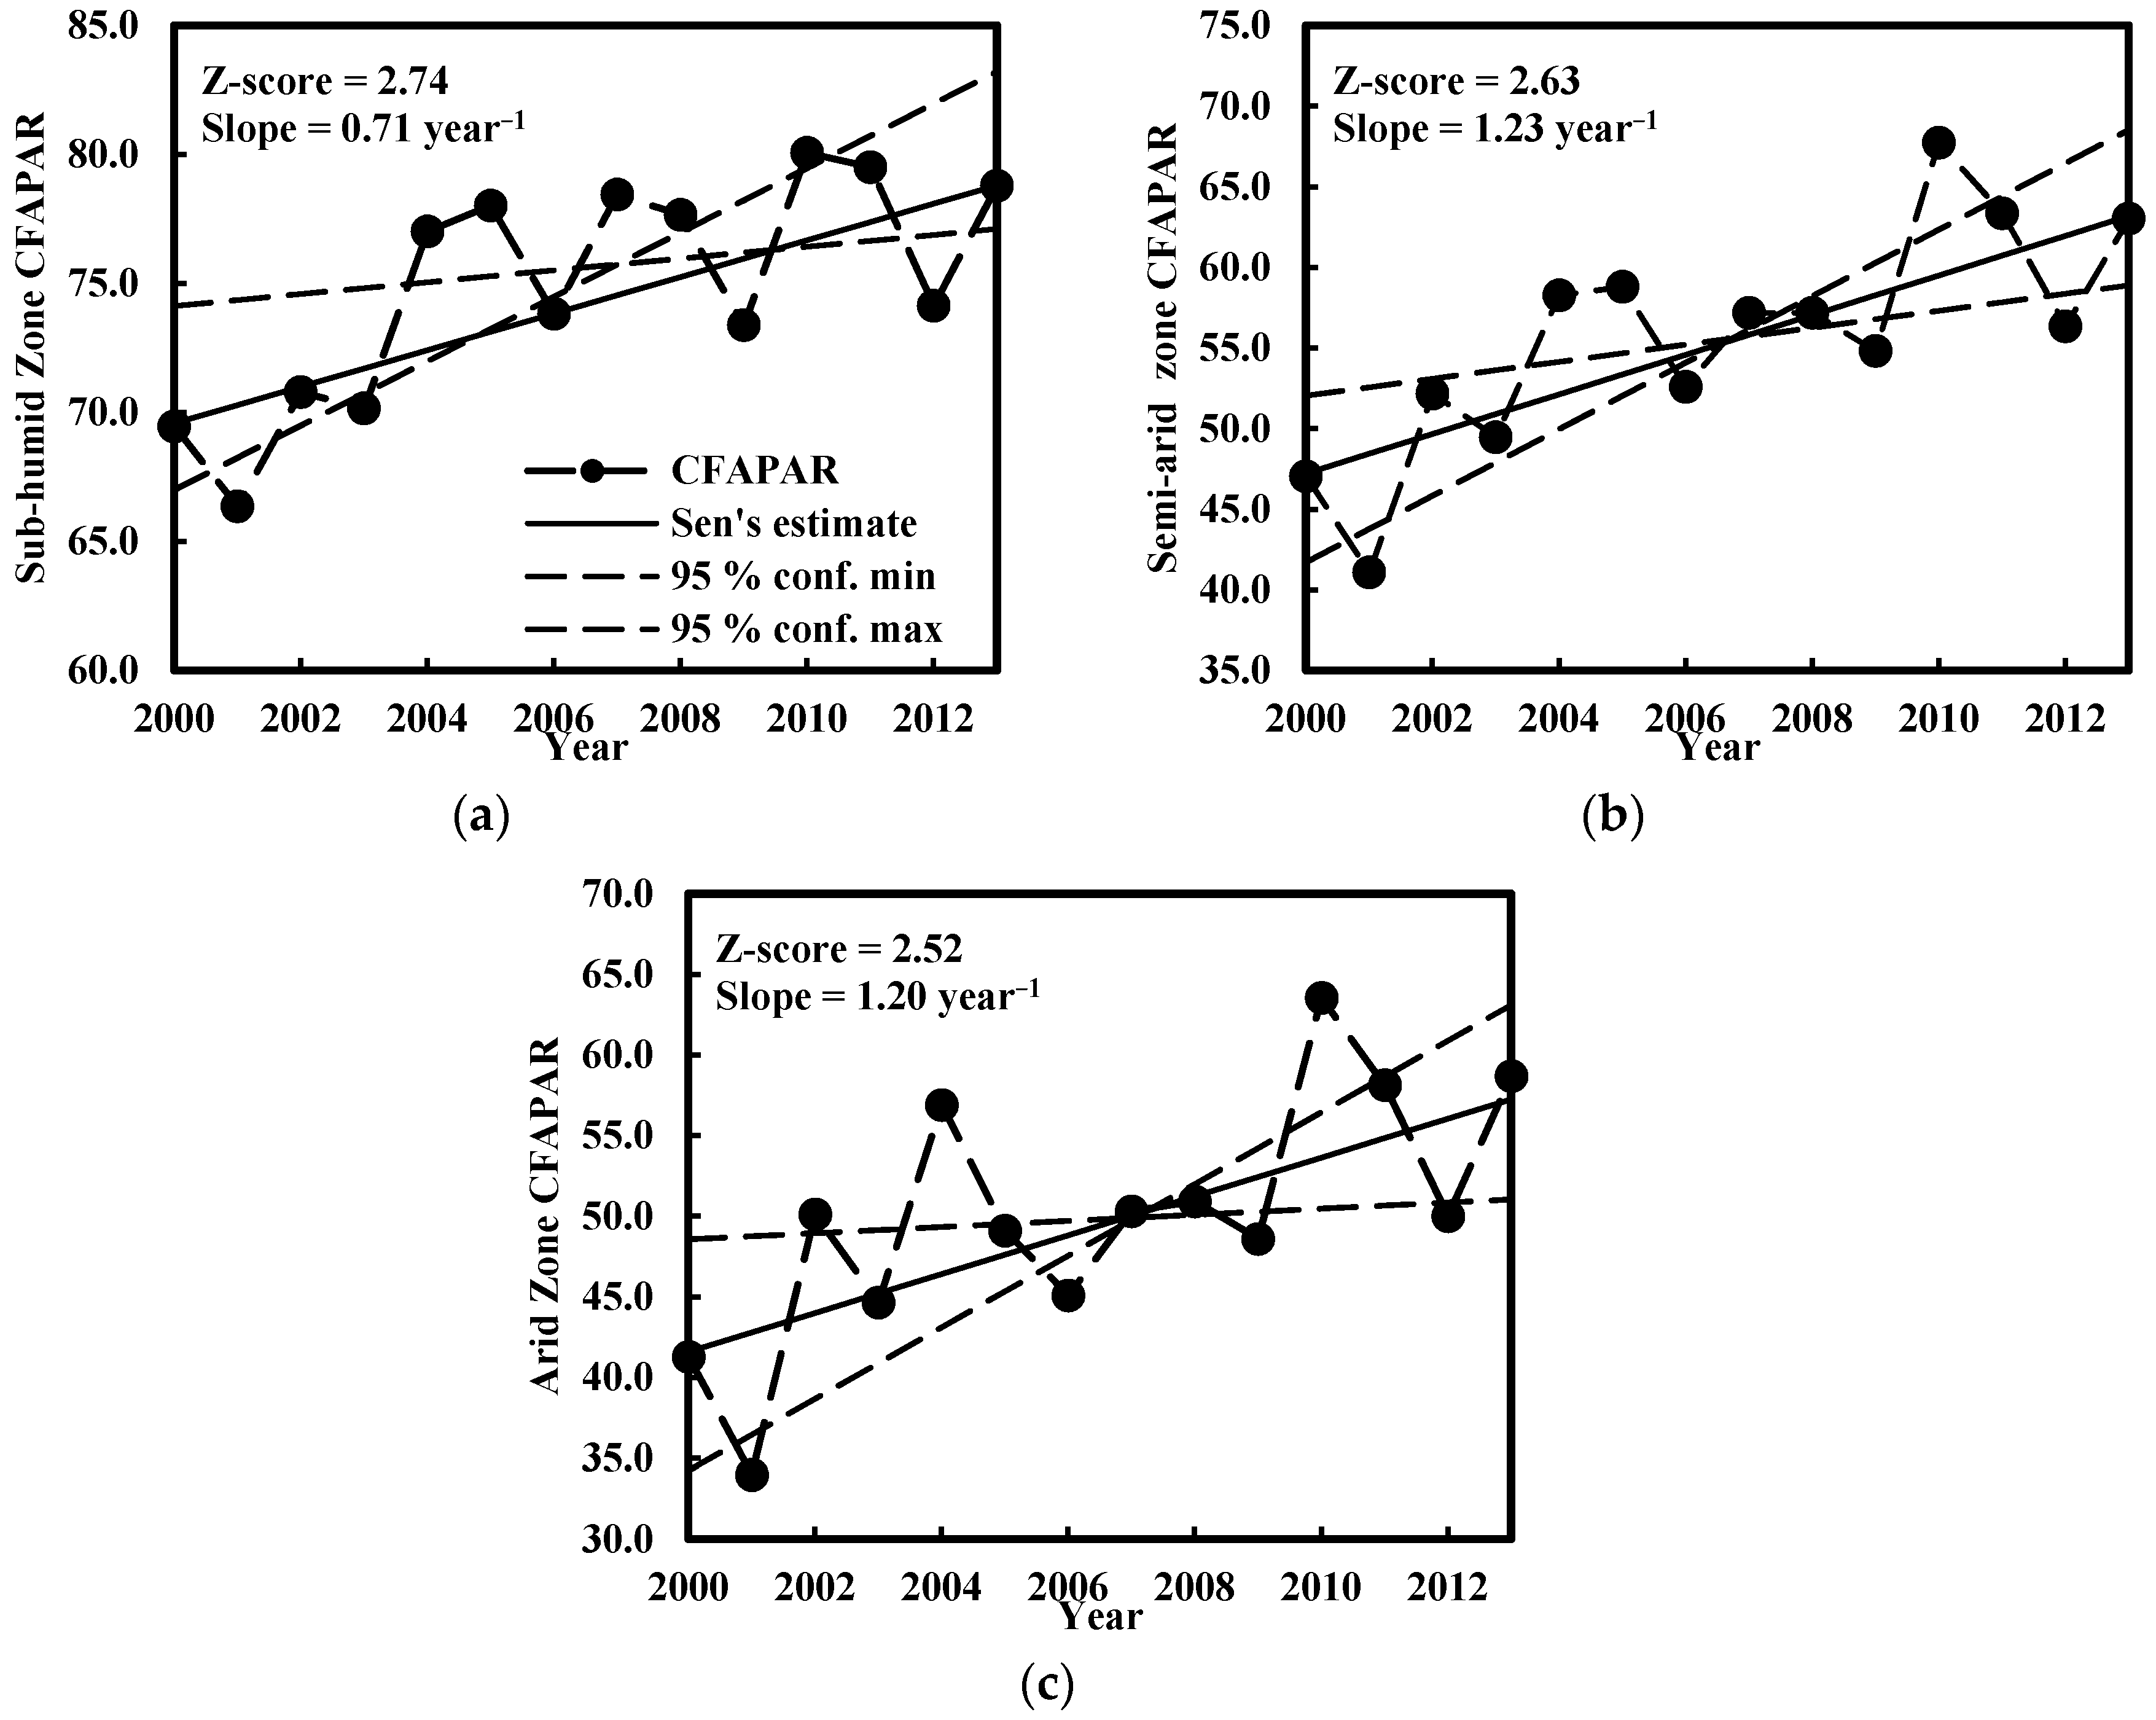
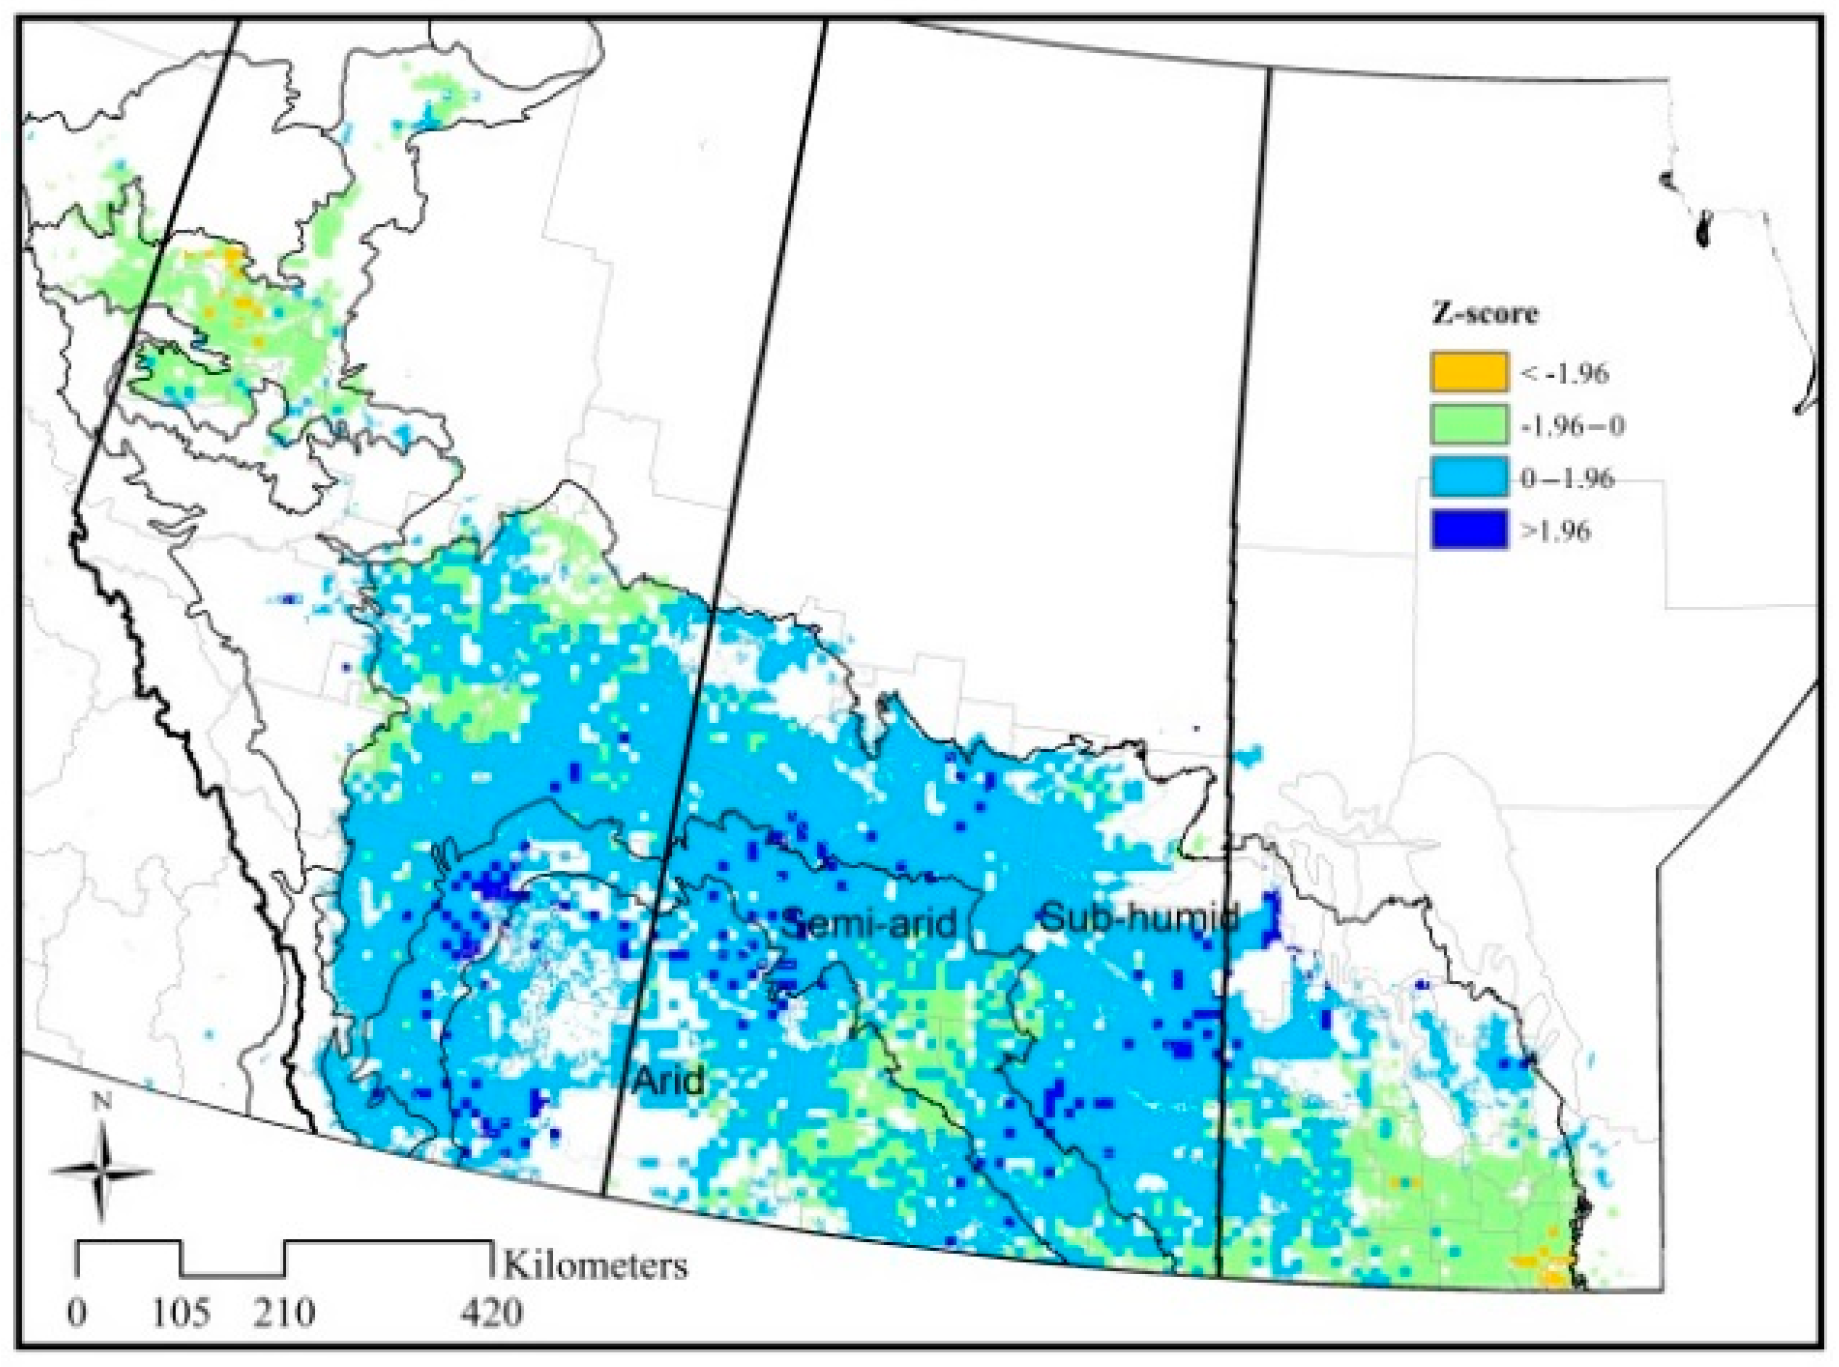
3.3. Trend of Cropland Productivity
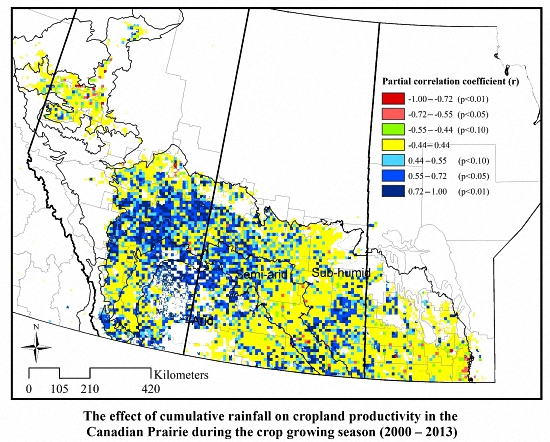
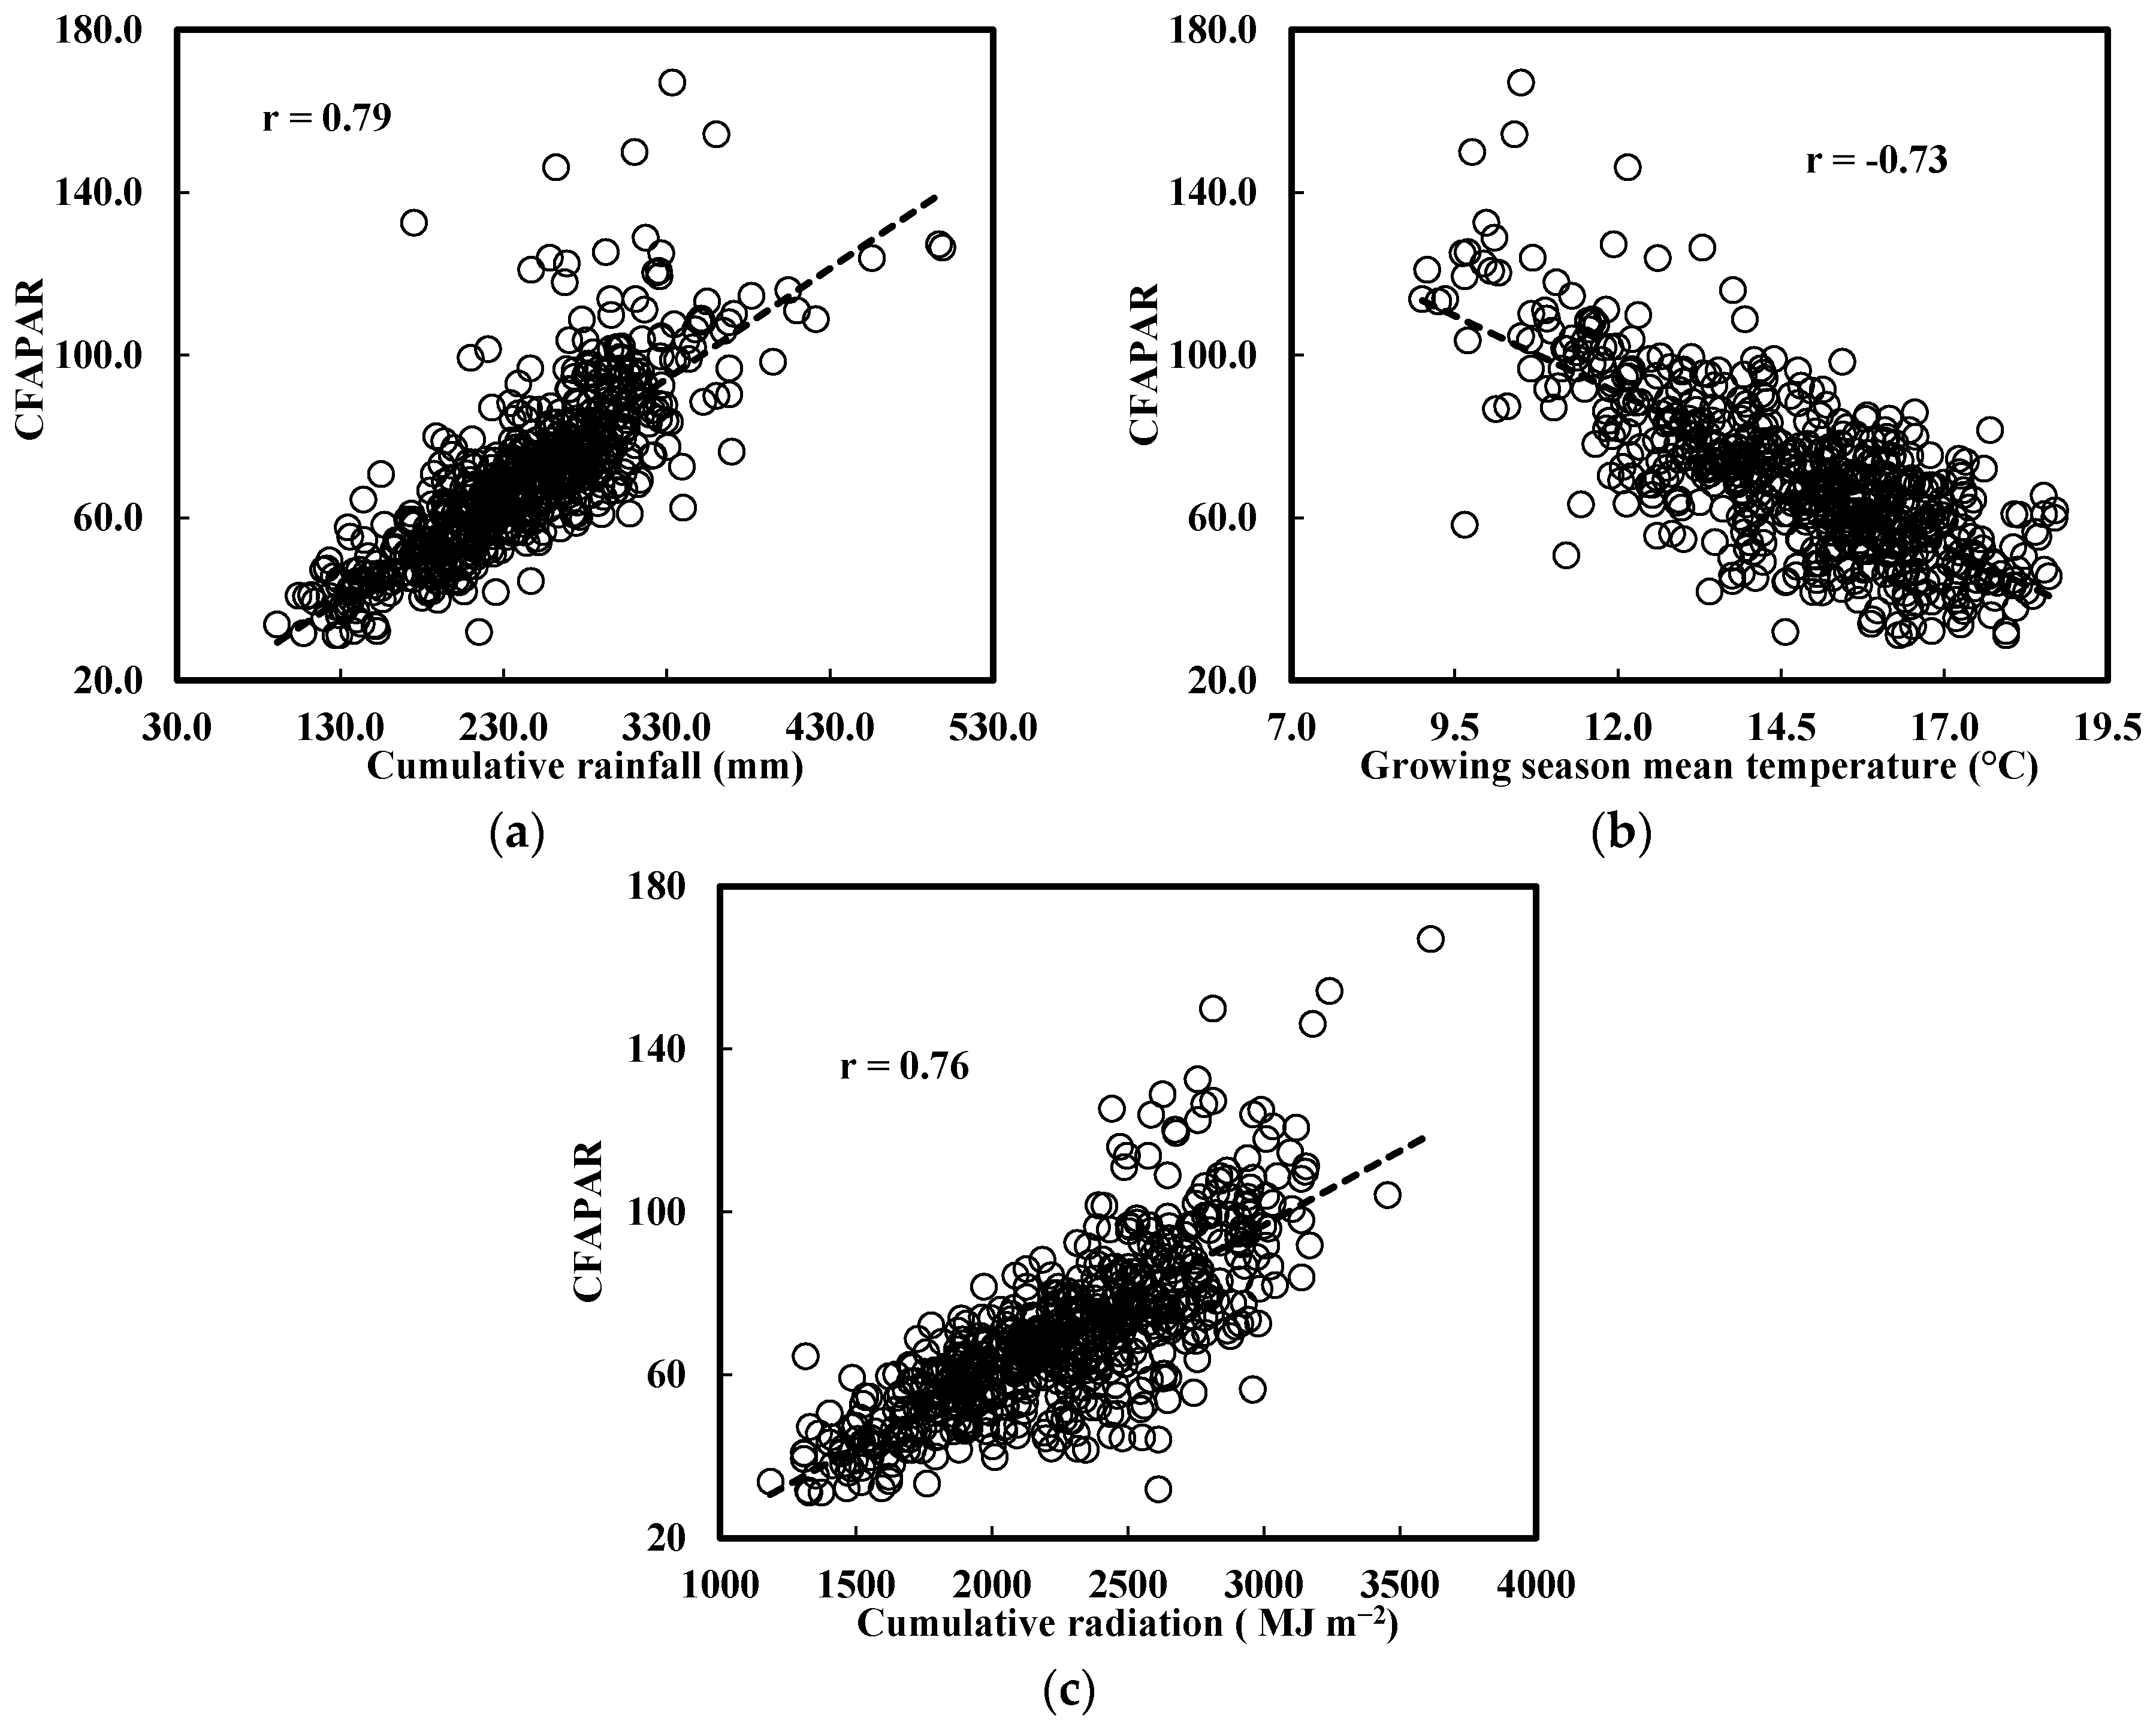
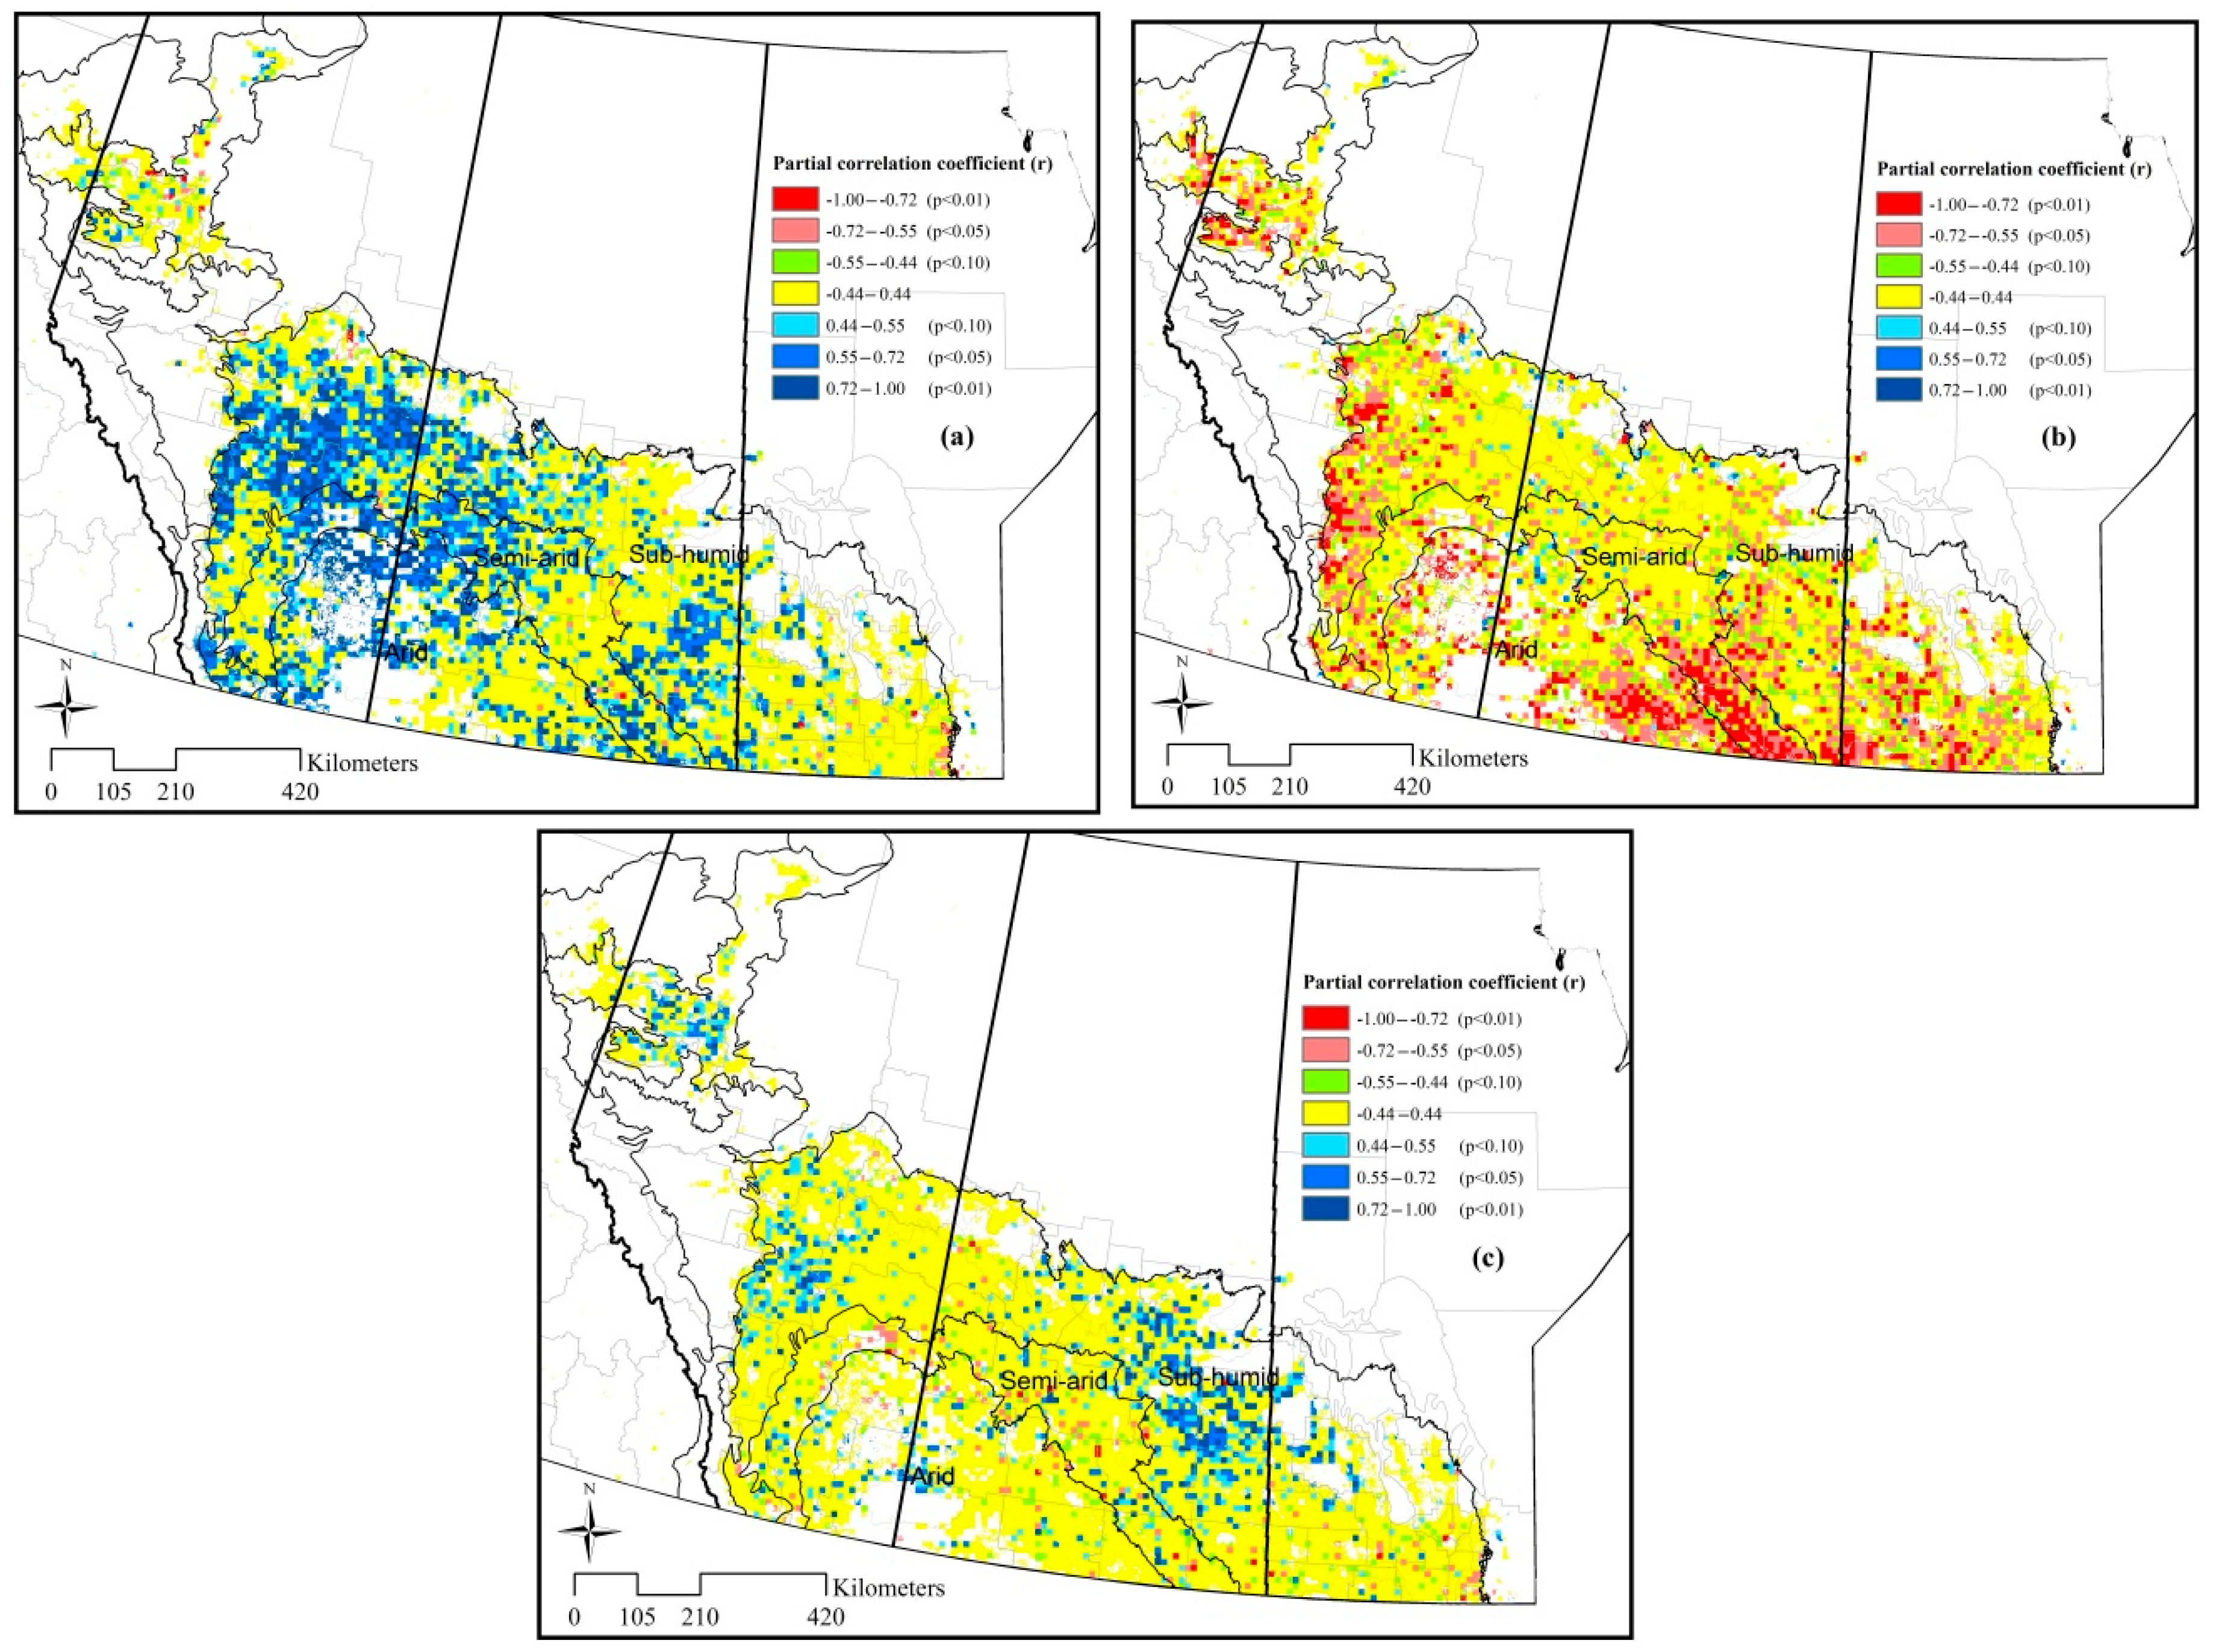
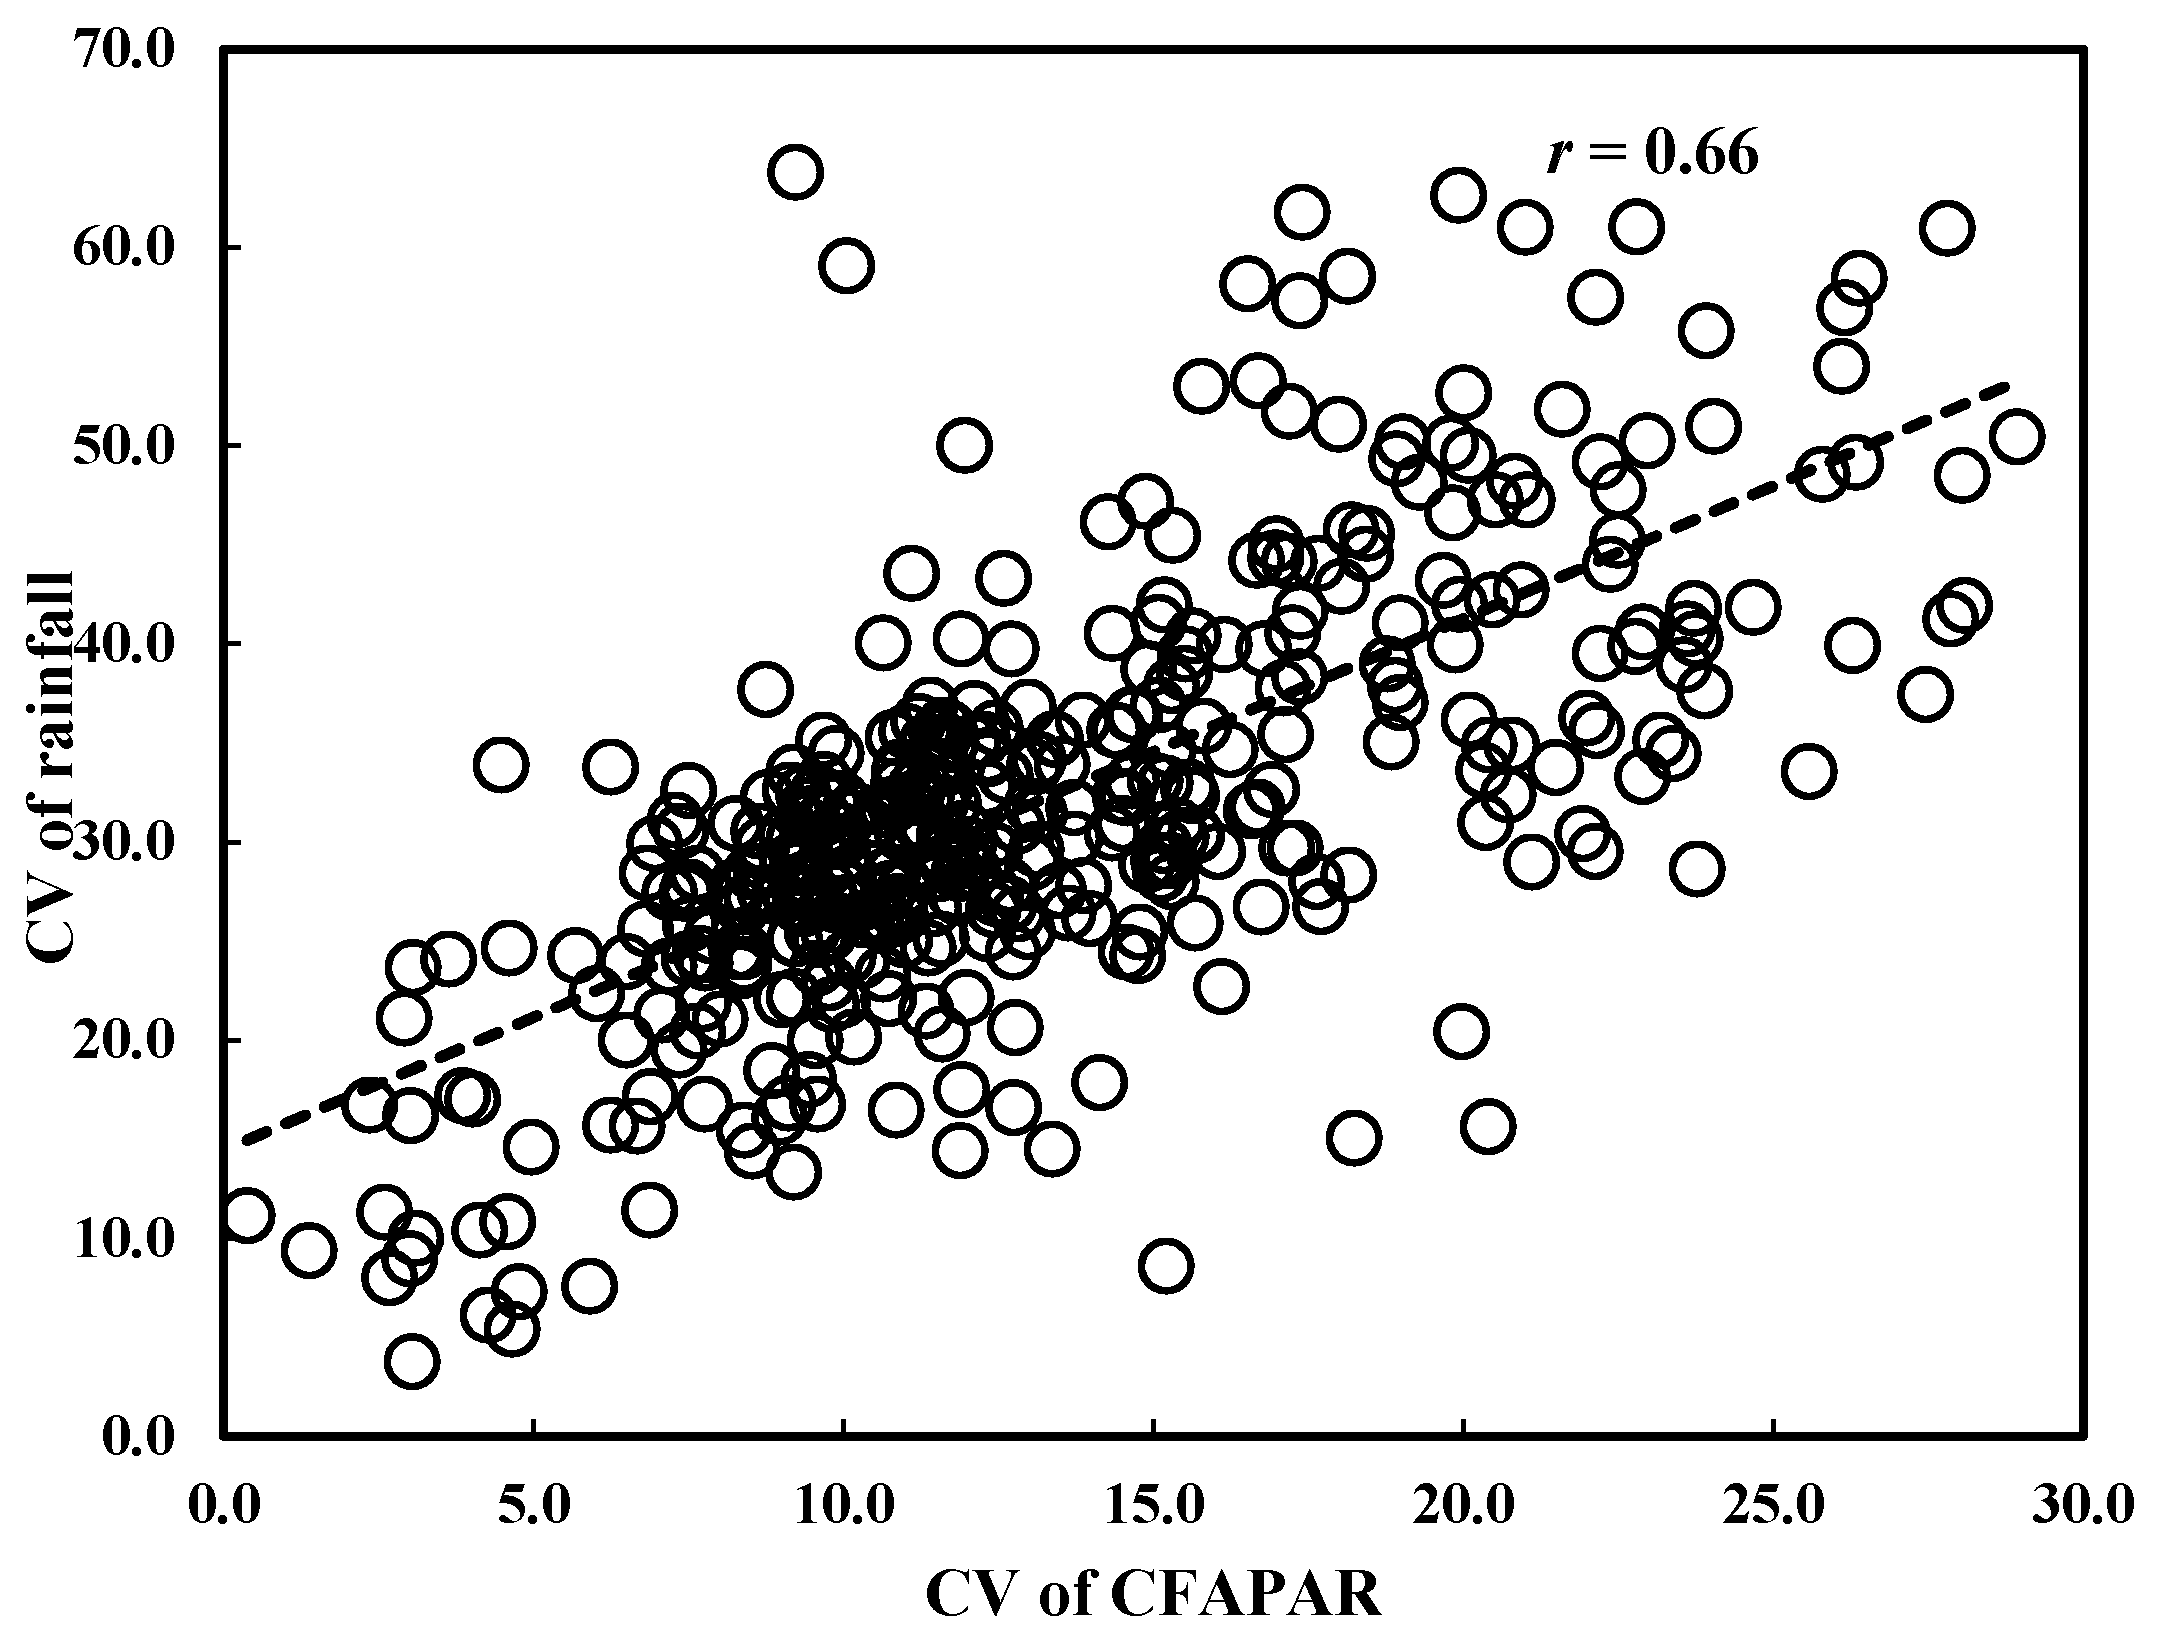
3.4. The Relationships between Cropland Productivity and Climatic Variables
4. Discussion
5. Conclusions
- (1)
- The cumulative FAPAR during the growing season can be presented as a proxy of cropland productivity;
- (2)
- There was, in general, an increasing trend in cropland productivity during the period from 2000 to 2013 over most of the cropland area of the Canadian Prairies.
- (3)
- Temporal and spatial variabilities in cropland productivity are both connected to rainfall variability, with temperature being a negative factor in arid regions. The trend towards increasing cropland productivity was somewhat greater in the more arid regions of the Canadian Prairies.
Acknowledgments
Author Contributions
Conflicts of Interest
References
- Richardson, A.D.; Keenan, T.F.; Migliavacca, M.; Ryu, Y. Climate change, phenology, and phenological control of vegetation feedbacks to the climate system. Agric. For. Meteorol. 2013, 169, 156–173. [Google Scholar] [CrossRef]
- Qian, B.; De Jong, R.; Gameda, S. Multivariate analysis of water-related agroclimatic factors limiting spring wheat yields on the Canadian Prairies. Eur. J. Agron. 2009, 30, 140–150. [Google Scholar] [CrossRef]
- He, Y.; Wei, Y.; DePauw, R.; Qian, B.; Lemke, R.; Singh, A.; Cuthbert, R.; McConkey, B.; Wang, H. Spring wheat yield in the semiarid canadian prairies: Effects of precipitation timing and soil texture over recent 30 years. Field Crops Res. 2013, 149, 329–337. [Google Scholar] [CrossRef]
- Meroni, M.; Rembold, F.; Verstraete, M.; Gommes, R.; Schucknecht, A.; Beye, G. Investigating the relationship between the inter-annual variability of satellite-derived vegetation phenology and a proxy of biomass production in the Sahel. Remote Sens. 2014, 6, 5868–5884. [Google Scholar] [CrossRef] [Green Version]
- Qian, B.; Zhang, X.; Chen, K.; Feng, Y.; O’Brien, T. Observed long-term trends for agroclimatic conditions in canada. J. Appl. Meteorol. Climatol. 2010, 49, 604–618. [Google Scholar] [CrossRef]
- Zhang, X.; Vincent, L.A.; Hogg, W.; Niitsoo, A. Temperature and precipitation trends in Canada during the 20th century. Atmosphere-Ocean 2000, 38, 395–429. [Google Scholar] [CrossRef]
- Stone, D.A.; Weaver, A.J.; Zwiers, F.W. Trends in Canadian precipitation intensity. Atmosphere-Ocean 2000, 38, 321–347. [Google Scholar] [CrossRef]
- Hanesiak, J.; Stewart, R.; Bonsal, B.; Harder, P.; Lawford, R.; Aider, R.; Amiro, B.; Atallah, E.; Barr, A.; Black, T. Characterization and summary of the 1999–2005 Canadian Prairie drought. Atmosphere-Ocean 2011, 49, 421–452. [Google Scholar] [CrossRef]
- Bonsal, B.R.; Wheaton, E.E.; Chipanshi, A.C.; Lin, C.; Sauchyn, D.J.; Wen, L. Drought research in Canada: A review. Atmosphere-Ocean 2011, 49, 303–319. [Google Scholar] [CrossRef]
- Bradshaw, B.; Dolan, H.; Smit, B. Farm-level adaptation to climatic variability and change: Crop diversification in the Canadian Prairies. Clim. Chang. 2004, 67, 119–141. [Google Scholar] [CrossRef]
- Qian, B.; Gameda, S.; Zhang, X.; De Jong, R. Changing growing season observed in Canada. Clim. Chang. 2012, 112, 339–353. [Google Scholar] [CrossRef]
- Chipanshi, A.; Zhang, Y.; Kouadio, L.; Newlands, N.; Davidson, A.; Hill, H.; Warren, R.; Qian, B.; Daneshfar, B.; Bedard, F.; et al. Evaluation of the integrated Canadian crop yield forecaster (ICCYF) model for in-season prediction of crop yield across the Canadian agricultural landscape. Agric. For. Meteorol. 2015, 206, 137–150. [Google Scholar] [CrossRef]
- Mkhabela, M.S.; Bullock, P.; Raj, S.; Wang, S.; Yang, Y. Crop yield forecasting on the Canadian prairies using MODIS NDVI data. Agric. For. Meteorol. 2011, 151, 385–393. [Google Scholar] [CrossRef]
- Hsieh, W.W.; Tang, B.; Garnett, E.R. Teleconnections between pacific sea surface temperatures and Canadian Prairie wheat yield. Agric. For. Meteorol. 1999, 96, 209–217. [Google Scholar] [CrossRef]
- Champagne, C.; Berg, A.A.; McNairn, H.; Drewitt, G.; Huffman, T. Evaluation of soil moisture extremes for agricultural productivity in the Canadian Prairies. Agric. For. Meteorol. 2012, 165, 1–11. [Google Scholar] [CrossRef]
- Qian, B.; De Jong, R.; Huffman, T.; Wang, H.; Yang, J. Projecting yield changes of spring wheat under future climate scenarios on the Canadian prairies. Theor. Appl. Climatol. 2015, 1–19. [Google Scholar] [CrossRef]
- Hutchinson, M.F.; McKenney, D.W.; Lawrence, K.; Pedlar, J.H.; Hopkinson, R.F.; Milewska, E.; Papadopol, P. Development and testing of Canada-wide interpolated spatial models of daily minimum–maximum temperature and precipitation for 1961–2003. J. Appl. Meteorol. Climatol. 2009, 48, 725–741. [Google Scholar] [CrossRef]
- Quiring, S.M.; Papakryiakou, T.N. An evaluation of agricultural drought indices for the Canadian Prairies. Agric. For. Meteorol. 2003, 118, 49–62. [Google Scholar] [CrossRef]
- Mkhabela, M.; Bullock, P.; Gervais, M.; Finlay, G.; Sapirstein, H. Assessing indicators of agricultural drought impacts on spring wheat yield and quality on the Canadian Prairies. Agric. For. Meteorol. 2010, 150, 399–410. [Google Scholar] [CrossRef]
- Qian, B.; De Jong, R.; Gameda, S.; Huffman, T.; Neilsen, D.; Desjardins, R.; Wang, H.; McConkey, B. Impact of climate change scenarios on Canadian agroclimatic indices. Can. J. Soil Sci. 2013, 93, 243–259. [Google Scholar] [CrossRef]
- He, Y.; Wang, H.; Qian, B.; McConkey, B.; DePauw, R. How early can the seeding dates of spring wheat be under current and future climate in Saskatchewan, Canada? PLoS ONE 2012, 7, e45153. [Google Scholar] [CrossRef] [PubMed]
- Milesi, C.; Samanta, A.; Hashimoto, H.; Kumar, K.K.; Ganguly, S.; Thenkabail, P.S.; Srivastava, A.N.; Nemani, R.R.; Myneni, R.B. Decadal variations in NDVI and food production in India. Remote Sens. 2010, 2, 758–776. [Google Scholar] [CrossRef]
- Rembold, F.; Atzberger, C.; Savin, I.; Rojas, O. Using low resolution satellite imagery for yield prediction and yield anomaly detection. Remote Sens. 2013, 5, 1704–1733. [Google Scholar] [CrossRef] [Green Version]
- van der Meer, F.D.; van der Werff, H.M.A.; van Ruitenbeek, F.J.A. Potential of ESA’S Sentinel-2 for geological applications. Remote Sens. Environ. 2014, 148, 124–133. [Google Scholar] [CrossRef]
- Roy, D.P.; Wulder, M.; Loveland, T.; Woodcock, C.; Allen, R.; Anderson, M.; Helder, D.; Irons, J.; Johnson, D.; Kennedy, R. Landsat-8: Science and product vision for terrestrial global change research. Remote Sens. Environ. 2014, 145, 154–172. [Google Scholar] [CrossRef]
- Tottrup, C.; Rasmussen, M.S. Mapping long-term changes in savannah crop productivity in senegal through trend analysis of time series of remote sensing data. Agric. Ecosyst. Environ. 2004, 103, 545–560. [Google Scholar] [CrossRef]
- Kouadio, L.; Newlands, N.; Davidson, A.; Zhang, Y.; Chipanshi, A. Assessing the performance of MODIS NDVI and EVI for seasonal crop yield forecasting at the ecodistrict scale. Remote Sens. 2014, 6, 10193. [Google Scholar]
- Johnson, M.D.; Hsieh, W.W.; Cannon, A.J.; Davidson, A.; Bédard, F. Crop yield forecasting on the Canadian Prairies by remotely sensed vegetation indices and machine learning methods. Agric. For. Meteorol. 2016, 218–219, 74–84. [Google Scholar] [CrossRef]
- Dong, T.; Liu, J.; Qian, B.; Zhao, T.; Jing, Q.; Geng, X.; Wang, J.; Huffman, T.; Shang, J. Estimating winter wheat biomass by assimilating leaf area index derived from fusion of Landsat-8 and MODIS data. Int. J. Appl. Earth Obs. Geoinf. 2016, 49, 63–74. [Google Scholar] [CrossRef]
- Dong, T.; Meng, J.; Shang, J.; Liu, J.; Wu, B. Evaluation of chlorophyll-related vegetation indices using simulated Sentinel-2 data for estimation of crop fraction of absorbed photosynthetically active radiation. IEEE J. Sel. Top. Appl. Earth Obs. Remote Sens. 2015, 8, 4049–4059. [Google Scholar] [CrossRef]
- Ganguly, S.; Nemani, R.R.; Baret, F.; Bi, J.; Weiss, M.; Zhang, G.; Milesi, C.; Hashimoto, H.; Samanta, A.; Verger, A. Green leaf area and fraction of photosynthetically active radiation absorbed by vegetation. In Biophysical Applications of Satellite Remote Sensing; Springer: Berlin/Heidelberg, Germany, 2014; pp. 43–61. [Google Scholar]
- Duveiller, G.; López-Lozano, R.; Baruth, B. Enhanced processing of 1-km spatial resolution FAPAR time series for sugarcane yield forecasting and monitoring. Remote Sens. 2013, 5, 1091–1116. [Google Scholar] [CrossRef] [Green Version]
- Dong, T.; Meng, J.; Shang, J.; Liu, J.; Wu, B.; Huffman, T. Modified vegetation indices for estimating crop fraction of absorbed photosynthetically active radiation. Int. J. Remote Sens. 2015, 36, 3097–3113. [Google Scholar] [CrossRef]
- Dong, T.; Wu, B.; Meng, J.; Du, X.; Shang, J. Sensitivity analysis of retrieving fraction of absorbed photosynthetically active radiation (FPAR) using remote sensing data. Acta Ecol. Sin. 2016, 36, 1–7. [Google Scholar] [CrossRef]
- Sakamoto, T.; Gitelson, A.A.; Wardlow, B.D.; Verma, S.B.; Suyker, A.E. Estimating daily gross primary production of maize based only on MODIS WDRVI and shortwave radiation data. Remote Sens. Environ. 2011, 115, 3091–3101. [Google Scholar] [CrossRef]
- Peng, Y.; Gitelson, A.A.; Sakamoto, T. Remote estimation of gross primary productivity in crops using MODIS 250m data. Remote Sens. Environ. 2013, 128, 186–196. [Google Scholar] [CrossRef]
- Li, Z.; Liu, S.; Tan, Z.; Bliss, N.B.; Young, C.J.; West, T.O.; Ogle, S.M. Comparing cropland net primary production estimates from inventory, a satellite-based model, and a process-based model in the midwest of the united states. Ecol. Model. 2014, 277, 1–12. [Google Scholar] [CrossRef]
- López-Lozano, R.; Duveiller, G.; Seguini, L.; Meroni, M.; García-Condado, S.; Hooker, J.; Leo, O.; Baruth, B. Towards regional grain yield forecasting with 1 km-resolution EO biophysical products: Strengths and limitations at pan-European level. Agric. For. Meteorol. 2015, 206, 12–32. [Google Scholar] [CrossRef]
- D’Odorico, P.; Gonsamo, A.; Pinty, B.; Gobron, N.; Coops, N.; Mendez, E.; Schaepman, M.E. Intercomparison of fraction of absorbed photosynthetically active radiation products derived from satellite data over Europe. Remote Sens. Environ. 2014, 142, 141–154. [Google Scholar] [CrossRef]
- Myneni, R.; Hoffman, S.; Knyazikhin, Y.; Privette, J.; Glassy, J.; Tian, Y.; Wang, Y.; Song, X.; Zhang, Y.; Smith, G. Global products of vegetation leaf area and fraction absorbed PAR from year one of MODIS data. Remote Sens. Environ. 2002, 83, 214–231. [Google Scholar] [CrossRef]
- Fritsch, S.; Machwitz, M.; Ehammer, A.; Conrad, C.; Dech, S. Validation of the collection 5 MODIS fpar product in a heterogeneous agricultural landscape in arid Uzbekistan using multitemporal RapidEye imagery. Int. J. Remote Sens. 2012, 33, 6818–6837. [Google Scholar] [CrossRef]
- Claverie, M.; Vermote, E.F.; Weiss, M.; Baret, F.; Hagolle, O.; Demarez, V. Validation of coarse spatial resolution LAI and FAPAR time series over cropland in southwest france. Remote Sens. Environ. 2013, 139, 216–230. [Google Scholar] [CrossRef]
- Friedl, M.A.; Sulla-Menashe, D.; Tan, B.; Schneider, A.; Ramankutty, N.; Sibley, A.; Huang, X. MODIS collection 5 global land cover: Algorithm refinements and characterization of new datasets. Remote Sens. Environ. 2010, 114, 168–182. [Google Scholar] [CrossRef]
- Lafond, G.P.; Brandt, S.A.; Clayton, G.W.; Irvine, R.B.; May, W.E. Rainfed farming systems on the Canadian Prairies. In Rainfed Farming Systems; Springer: Dordrecht, The Netherlands, 2011; pp. 467–510. [Google Scholar]
- Qian, B.; De Jong, R.; Warren, R.; Chipanshi, A.; Hill, H. Statistical spring wheat yield forecasting for the Canadian Prairie provinces. Agric. For. Meteorol. 2009, 149, 1022–1031. [Google Scholar] [CrossRef]
- Group, S.C.W. Canadian System of Soil Classification, 3rd ed.; NRC Research Press: Ottawa, ON, Canada, 1998; p. 188. [Google Scholar]
- Rienecker, M. File Specification for Geos-Das Gridded Output Version 5.3; Global Modeling and Assimilation Office: Greenbelt, MD, USA, 2004. [Google Scholar]
- Ruane, A.C.; Goldberg, R.; Chryssanthacopoulos, J. Climate forcing datasets for agricultural modeling: Merged products for gap-filling and historical climate series estimation. Agric. For. Meteorol. 2015, 200, 233–248. [Google Scholar] [CrossRef]
- Tan, B.; Morisette, J.T.; Wolfe, R.E.; Gao, F.; Ederer, G.A.; Nightingale, J.; Pedelty, J.A. An enhanced timesat algorithm for estimating vegetation phenology metrics from MODIS data. IEEE J. Sel. Top. Appl. Earth Obs. Remote Sens. 2011, 4, 361–371. [Google Scholar] [CrossRef]
- Prince, S.D.; Haskett, J.; Steininger, M.; Strand, H.; Wright, R. Net primary production of us midwest croplands from agricultural harvest yield data. Ecol. Appl. 2001, 11, 1194–1205. [Google Scholar] [CrossRef]
- Neeti, N.; Eastman, J.R. A contextual mann-kendall approach for the assessment of trend significance in image time series. Trans. GIS 2011, 15, 599–611. [Google Scholar] [CrossRef]
- de Jong, R.; de Bruin, S.; de Wit, A.; Schaepman, M.E.; Dent, D.L. Analysis of monotonic greening and browning trends from global NDVI time-series. Remote Sens. Environ. 2011, 115, 692–702. [Google Scholar] [CrossRef] [Green Version]
- Li, Z.; Huffman, T.; McConkey, B.; Townley-Smith, L. Monitoring and modeling spatial and temporal patterns of grassland dynamics using time-series MODIS NDVI with climate and stocking data. Remote Sens. Environ. 2013, 138, 232–244. [Google Scholar] [CrossRef]
- Martínez, B.; Gilabert, M.A. Vegetation dynamics from NDVI time series analysis using the wavelet transform. Remote Sens. Environ. 2009, 113, 1823–1842. [Google Scholar] [CrossRef]
- Dubovyk, O.; Landmann, T.; Erasmus, B.F.N.; Tewes, A.; Schellberg, J. Monitoring vegetation dynamics with medium resolution MODIS-EVI time series at sub-regional scale in southern Africa. Int. J. Appl. Earth Obs. Geoinf. 2015, 38, 175–183. [Google Scholar] [CrossRef]
- Salmi, T. Detecting Trends of Annual Values of Atmospheric Pollutants by the Mann-Kendall Test and Sen's Slope Estimates-the Excel Template Application Makesens; Ilmatieteen Laitos: Helsinki, Finland, 2002. [Google Scholar]
- Hemelrijk, C. A matrix partial correlation test used in investigations of reciprocity and other social interaction patterns at group level. J. Theor. Biol. 1990, 143, 405–420. [Google Scholar] [CrossRef]
- Fensholt, R.; Sandholt, I.; Rasmussen, M.S.; Stisen, S.; Diouf, A. Evaluation of satellite based primary production modelling in the semi-arid Sahel. Remote Sens. Environ. 2006, 105, 173–188. [Google Scholar] [CrossRef]
- Kowalik, W.; Dabrowska-Zielinska, K.; Meroni, M.; Raczka, T.U.; de Wit, A. Yield estimation using SPOT-vegetation products: A case study of wheat in European countries. Int. J. Appl. Earth Obs. Geoinf. 2014, 32, 228–239. [Google Scholar] [CrossRef]
- Zhang, Q.; Cheng, Y.-B.; Lyapustin, A.I.; Wang, Y.; Gao, F.; Suyker, A.; Verma, S.; Middleton, E.M. Estimation of crop gross primary production (GPP): Faparchl versus MOD15A2 FPAR. Remote Sens. Environ. 2014, 153, 1–6. [Google Scholar] [CrossRef]
- Vintrou, E.; Bégué, A.; Baron, C.; Saad, A.; Lo Seen, D.; Traoré, S. A comparative study on satellite- and model-based crop phenology in West Africa. Remote Sens. 2014, 6, 1367–1389. [Google Scholar] [CrossRef] [Green Version]
- Kutcher, H.R.; Warland, J.S.; Brandt, S.A. Temperature and precipitation effects on canola yields in Saskatchewan, Canada. Agric. For. Meteorol. 2010, 150, 161–165. [Google Scholar] [CrossRef]


| CFAPAR | Rainfall | Temperature | Radiation | |
|---|---|---|---|---|
| CFAPAR | −1.00 | 0.60 | −0.46 | 0.00 |
| Rainfall | −1.00 | 0.39 | 0.49 | |
| Temperature | −1.00 | −0.64 | ||
| Radiation | −1.00 |
© 2016 by the Her Majesty the Queen in Right of Canada as represented by the Minister of Agriculture and Agri-Food Canada; licensee MDPI, Basel, Switzerland. This article is an open access article distributed under the terms and conditions of the Creative Commons by Attribution (CC-BY) license (http://creativecommons.org/licenses/by/4.0/).
Share and Cite
Dong, T.; Liu, J.; Shang, J.; Qian, B.; Huffman, T.; Zhang, Y.; Champagne, C.; Daneshfar, B. Assessing the Impact of Climate Variability on Cropland Productivity in the Canadian Prairies Using Time Series MODIS FAPAR. Remote Sens. 2016, 8, 281. https://0-doi-org.brum.beds.ac.uk/10.3390/rs8040281
Dong T, Liu J, Shang J, Qian B, Huffman T, Zhang Y, Champagne C, Daneshfar B. Assessing the Impact of Climate Variability on Cropland Productivity in the Canadian Prairies Using Time Series MODIS FAPAR. Remote Sensing. 2016; 8(4):281. https://0-doi-org.brum.beds.ac.uk/10.3390/rs8040281
Chicago/Turabian StyleDong, Taifeng, Jiangui Liu, Jiali Shang, Budong Qian, Ted Huffman, Yinsuo Zhang, Catherine Champagne, and Bahram Daneshfar. 2016. "Assessing the Impact of Climate Variability on Cropland Productivity in the Canadian Prairies Using Time Series MODIS FAPAR" Remote Sensing 8, no. 4: 281. https://0-doi-org.brum.beds.ac.uk/10.3390/rs8040281