Article

Complex Deformation Monitoring over the Linfen–Yuncheng Basin (China) with Time Series InSAR Technology

1
College of Geology Engineering and Geomatics, Chang’an University, Xi’an 710054, China
2
State Key Laboratory of Geohazard Prevention and Geoenvironment Protection, Chengdu 610059, China
3
Second Crust Monitoring and Application Center, CEA, Xi’an 710054, China
*
Author to whom correspondence should be addressed.
Submission received: 16 January 2016 / Revised: 7 March 2016 / Accepted: 21 March 2016 / Published: 28 March 2016
(This article belongs to the Special Issue Earth Observations for Geohazards)

Abstract

:
The Linfen–Yuncheng basin is an area prone to geological disasters, such as surface subsidence, ground fissuring, fault activity, and earthquakes. For the purpose of disaster prevention and mitigation, Interferometric Synthetic Aperture Radar (InSAR) was used to map ground deformation in this area. After the ground deformation characteristics over the Linfen–Yuncheng basin were obtained, the cross-correlations among regional ground subsidence, fault activity, and underground water level were analyzed in detail. Additionally, an area of abnormal deformation was found and examined. Through time series deformation monitoring and mechanism inversion, we found that the abnormal deformation was related mainly to excessive groundwater exploitation.

Graphical Abstract

1. Introduction

The Shanxi fault belt basin is a Cenozoic fault basin that has strong earthquake activity. The Linfen–Yuncheng basin is located in the south-central region of the Shanxi fault belt basin, where the crustal structure is especially complex and seismic activity is very strong [1,2] (Figure 1). In total, 10 earthquakes with Ms ≥ 5.0 have been recorded since a.d. 1177 (Ms stands for surface wave magnitude): one event with Ms ≥ 8.0, one event with 7.0 ≤ Ms < 8.0, two events with 6.0 ≤ Ms < 7.0, and six events with 5.0 ≤ Ms < 6.0 [3]. According to modern seismic network records, moderate–small earthquakes have been more frequent in this area in the recent past [3,4] (Figure 1). At the same time, ground subsidence, ground fissuring, fault activity, and abnormal deformation have been observed and have received substantial attention from the local government [5,6]. For the purpose of disaster prevention and mitigation, there is an urgent need to characterize the ground deformation characteristics within the basin.
Conventional ground-based geodetic techniques, such as GPS and leveling, have difficulties in detecting more detailed and comprehensive ground deformation due to their low spatial resolution. Although terrestrial laser scanning can present very high spatial resolutions, it hard to be carried out ground deformation monitoring in a wide range. Interferometric Synthetic Aperture Radar (InSAR) has demonstrated potential for high-density spatial mapping of ground displacement associated with earthquake, volcanic, and other geologic processes [7,8,9,10,11]. However, the application of conventional InSAR is limited by several inherent factors, such as spatial-temporal decorrelation, DEM inaccuracy, phase unwrapping error and atmospheric delay. [12]. Nevertheless, all of these issues can be addressed with the InSAR time series technique of the Small BAseline Subset (SBAS) [13,14,15,16,17], which combines interferograms by using a threshold for the temporal and spatial baseline criterions. The SBAS InSAR technique can also eliminate or mitigate the possibility of phase unwrapping errors and atmospheric delay errors through temporal high-pass and spatial low-pass filtering of interferogram. Finally, the time series deformation information of the coherent points can be obtained.
Thus, in this study, we examined basin ground deformation using Envisat ASAR images. The Stanford Method for Persistent Scatterers (StaMPS) SBAS InSAR technique was used to obtain the time series surface deformation [17,18]. The ground deformation characteristics over the Linfen–Yuncheng basin were obtained, and the cross-correlation among the regional ground subsidence, fault activity, and underground water level were analyzed in detail. At the same time, an abnormal deformation was identified and analyzed.
The StaMPS InSAR technique is presented in Section 2 of this paper. The data collection and processing procedures are described in Section 3. The results of the study and some discussion are provided in Section 4, and the abnormal deformation is discussed in Section 5.

2. StaMPS Method

StaMPS is one of the most mature InSAR time-series analysis software packages. StaMPS uses a statistical relationship between amplitude stability and phase stability that makes consideration of amplitude useful for reducing the initial number of pixels for phase analysis. The amplitude dispersion index, defined by [19], can be written as
D A = σ A μ A
where σ A is the standard deviation of the amplitude values and μ A is the mean of a series of amplitude values. The amplitude dispersion index threshold value that is used is commonly higher, typically on the order of 0.4, than the value of 0.12 recommended by [19]. As a result, a large number of pixels are selected as Persistent Scatterers (PS) initial candidates (PSCs). The PSCs are tested for phase stability with an indicator γ x , which is defined based on the temporal coherence and can be used to evaluate whether the pixel is a PS:
γ x = 1 N | i = 1 N exp { j ( ϕ int , x , i ϕ ¯ int , x , i ) Δ ϕ ^ h , x , i } |
where N is the number of interferograms and ϕ ¯ int , x , i is an estimate of the wrapped phase ϕ int , x , i of the x th pixel in the i th flattened and topographically corrected interferogram Δ ϕ ^ h , x , i is an estimate of the DEM error. After every iteration, the root-mean-square change in coherence γ x , determined as in Equation (2), is calculated. When the change is less than a specified threshold, the solution has converged and the algorithm stops iterating. Then, the selected pixels are considered as PS pixels, considering their amplitude dispersion, as well as γ x (see [18] for details).
Once the PSs have been selected, their phase are corrected for spatially uncorrelated look angle (SULA) error by subtracting the estimated values, that is the DEM error [20]. As long as the density of PS is such that the absolute phase difference between neighboring PSs, after correction for estimated SULA error, is generally less than π, the corrected phase values can be unwrapped. Optionally, after unwrapping, a high-pass filter can be applied to the unwrapped data in time followed by a low-pass filter in space in order to remove the remaining spatially correlated errors (atmosphere and orbit errors). Finally, subtracting this signal leaves essentially deformation and spatially uncorrelated errors that can be modeled as noise.
The method is able to characterize the temporal model of deformation, rather than using an assumed model. StaMPS is successful at finding PS pixels in both urban and nonurban areas, which makes it applicable in areas covered by forest and vegetation.

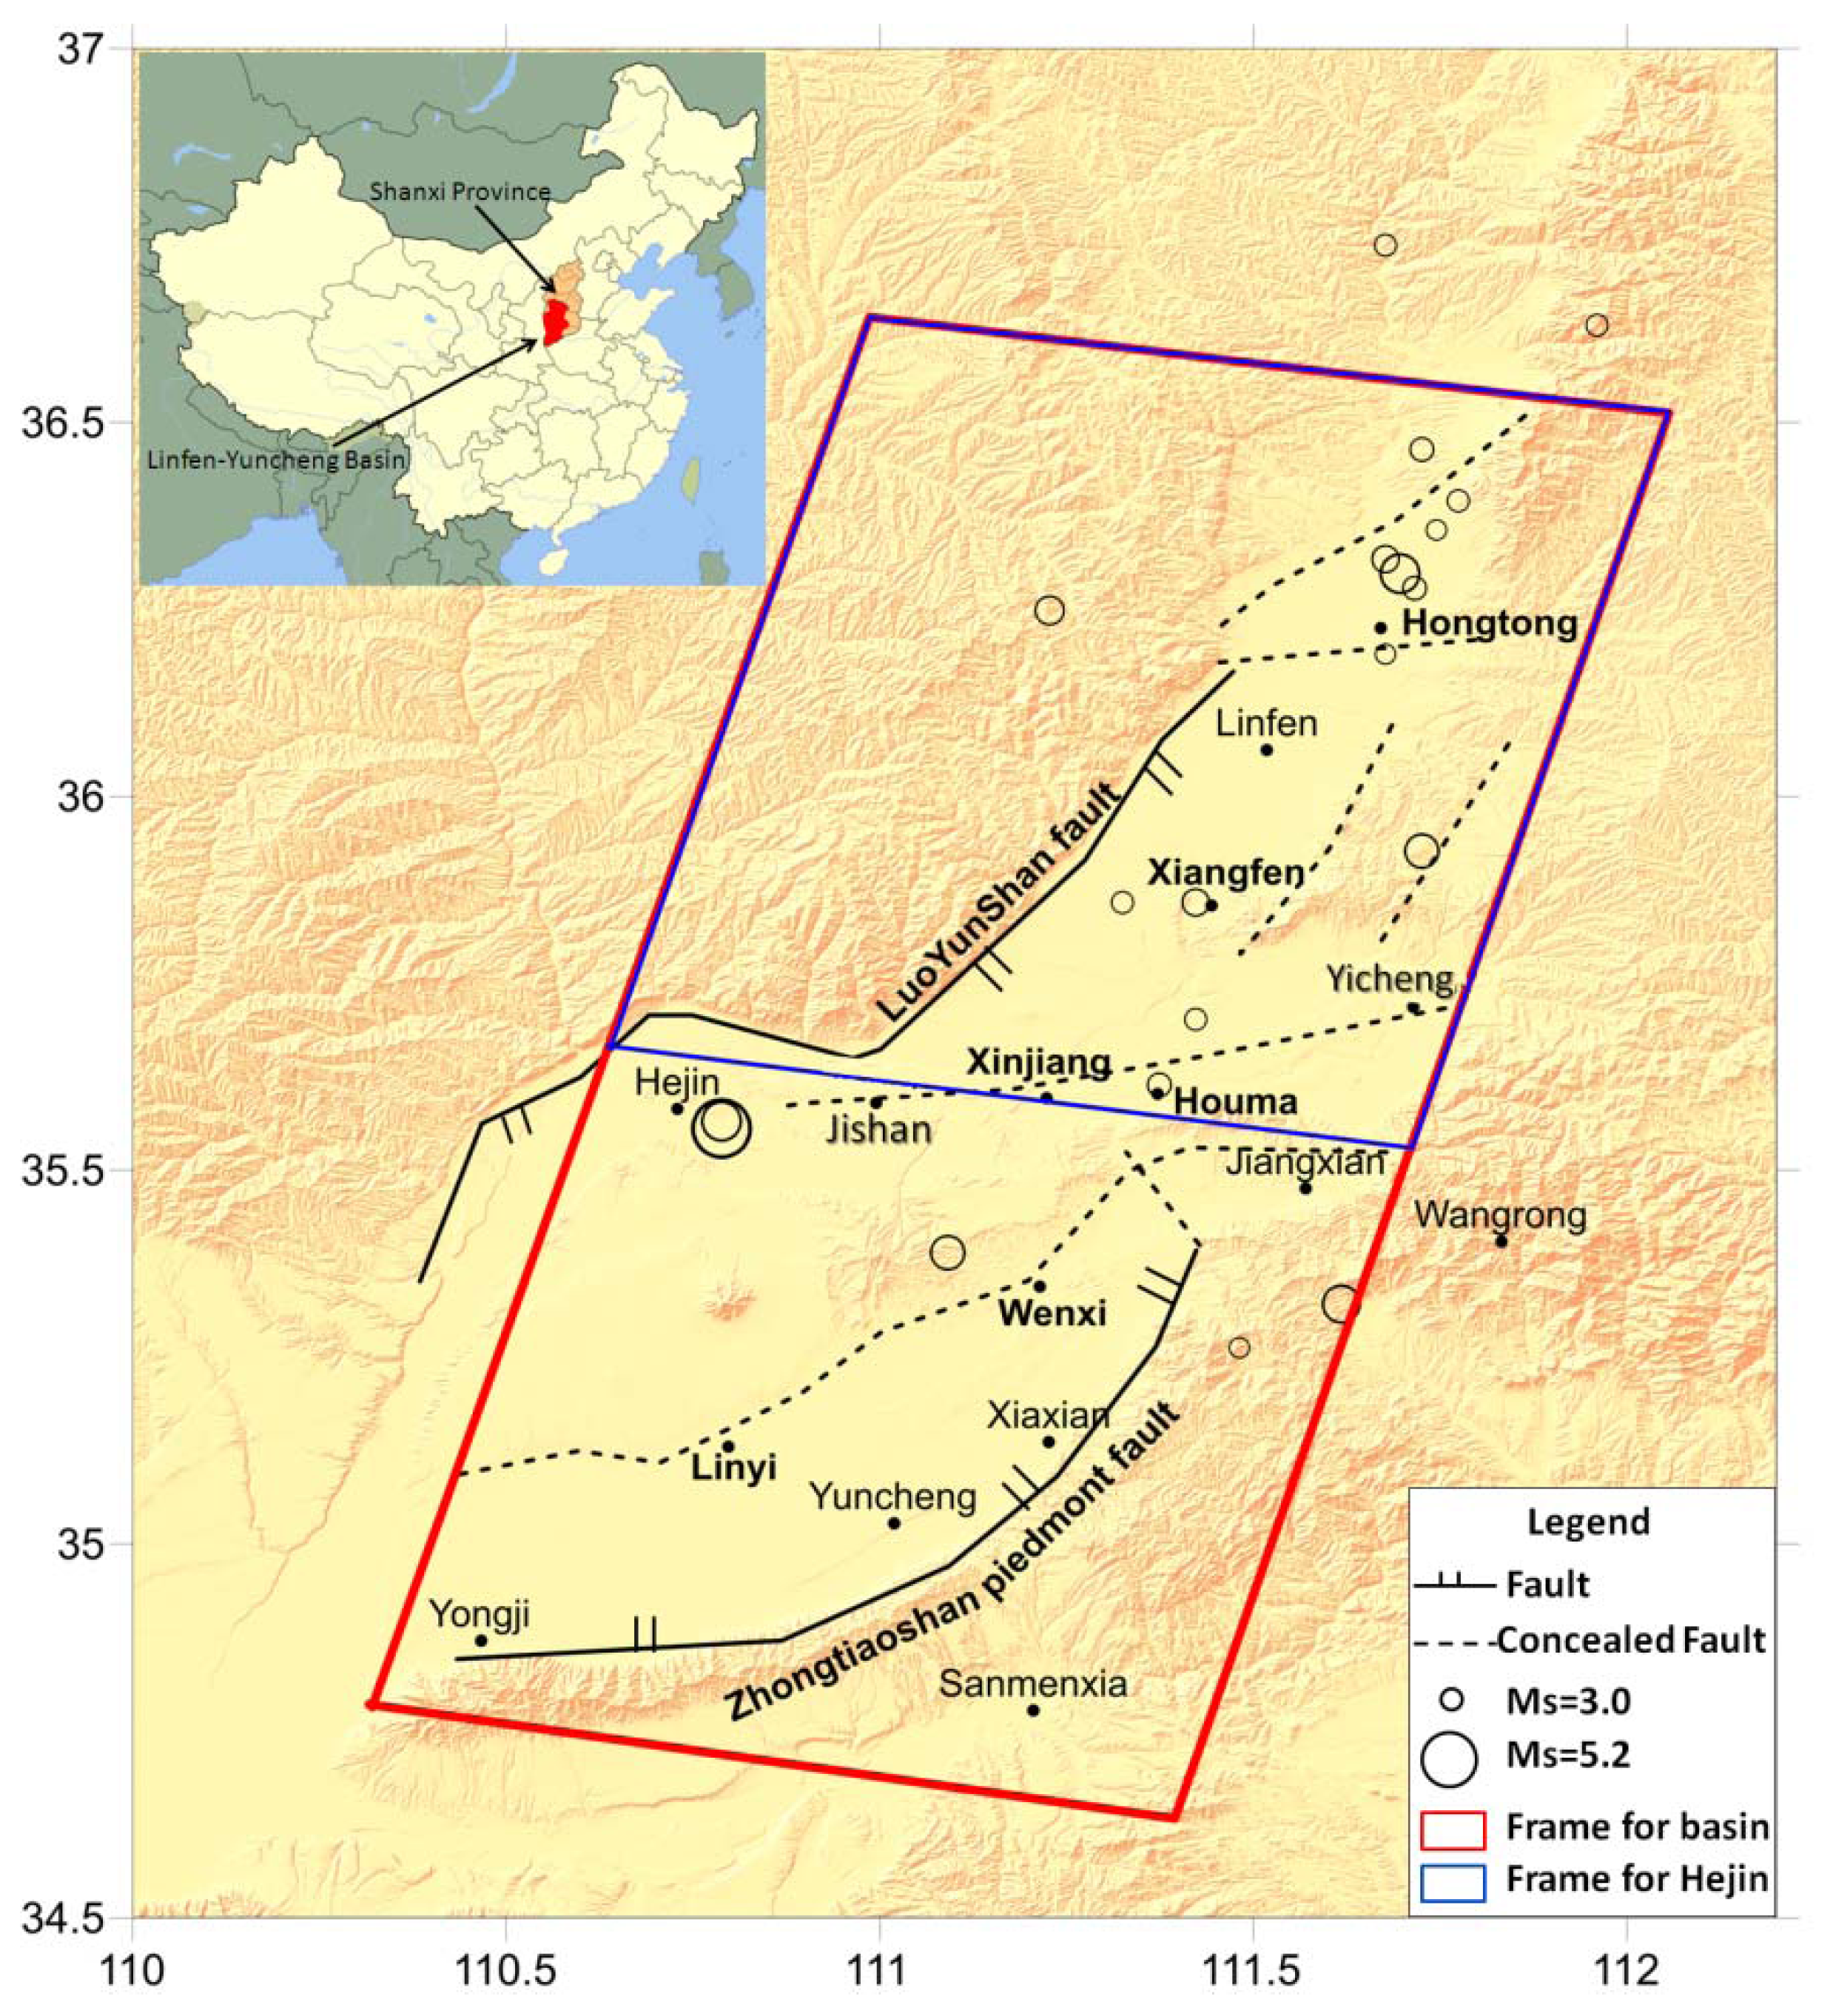
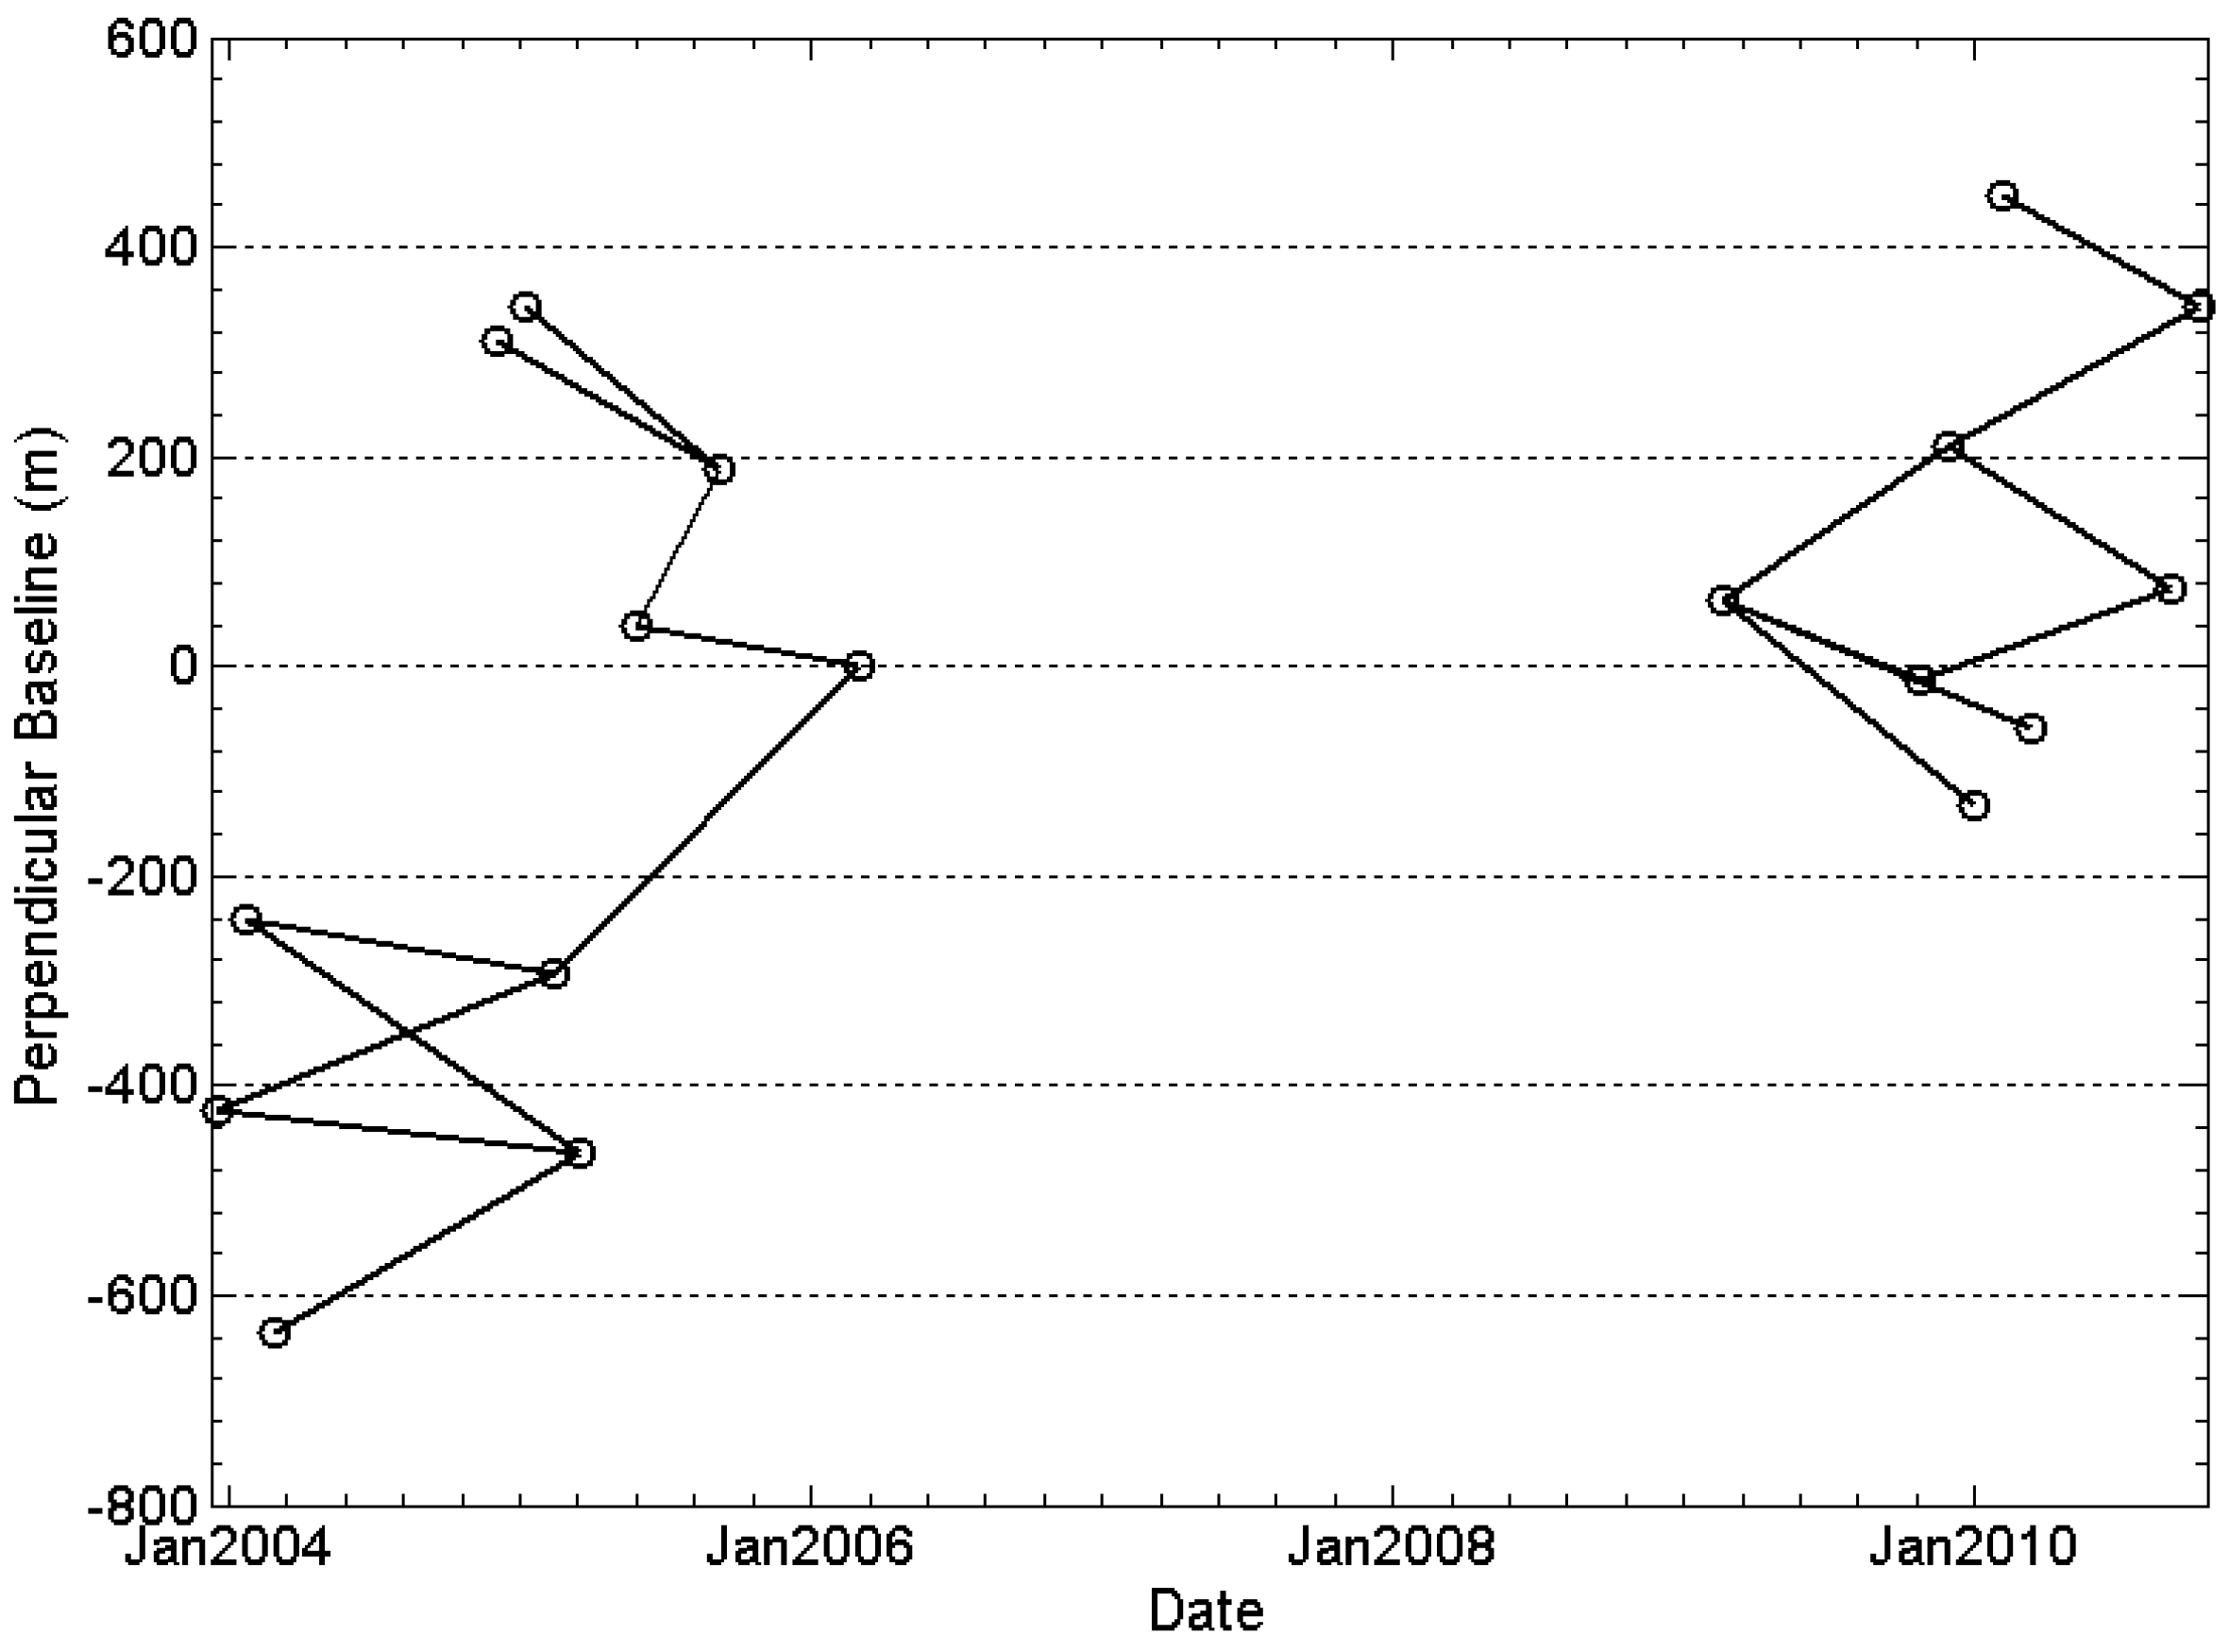
3. Data Collection and Processing

In total, eight C-band Envisat ASAR images with track 2347 in stripe mode, acquired from February 2009 to October 2010, were used to study ground deformation in the Linfen–Yuncheng basin (red frame in Figure 1). Underground water level data also were collected for this study. ASTER GDEM (Version 2) with resolution of 1 arc-second (30 m) was used as an external DEM to remove the topographic phase from the interferograms, and ESA DORIS precision orbits data for Envisat satellites were employed to remove the reference phase and orbital bias from the differential interferograms.
The StaMPS SBAS InSAR technique was used in this experiment [17,21]. First, to ensure the reliability of the deformation measurements, SAR interferometric combinations with a temporal baseline of less than 300 days and a spatial baseline of less than 300 m were outlined. Accordingly, 15 interferograms were generated (Figure 2) to study the ground deformation within the basin. After spatially filtering each interferogram, the spatially uncorrelated DEM error was iteratively optimized by setting a maximum error of 8 m. The standard deviation of each coherent pixel was estimated for all of the interferograms. Any pixels with a standard deviation larger than 1.0 radian were eliminated to refine the coherent points [22]. Considering the deformation gradient within the basin, the unwrapped grid size was resampled to 50 m. Atmospheric phases were separated from each differential interferogram by filtering the spatial and temporal domains according to their spatial and temporal correlations.

4. Results and Discussion

Ground deformation results over the Linfen–Yuncheng Basin were assessed from 2009 to 2010. The annual average deformation map is shown as Figure 3, in which positive and negative signs represent displacement toward and away from the satellite line-of-sight (LOS), respectively. According to the geological survey, the western mountainous area of Linfen is with hard rock bottom and close to the stable Ordos block tectonic units. So we selected an area about 10 km × 10 km as the reference region, which was represented in the Figure 3 as a five-pointed star marked area. The maximum displacement is from −62 to 20 mm/a. According to the results, the internal and marginal areas of the basin have different deformation characteristics. The internal basin showed land subsidence, but both sides of the basin showed relative uplift. Especially, at the eastern margin of the basin, there is an obvious difference of deformation on the two sides of the ZhongTiaoShan piedmont fault. From the local perspective, the tectonic units have different deformation rates, which show a gradually increasing trend from north to south.

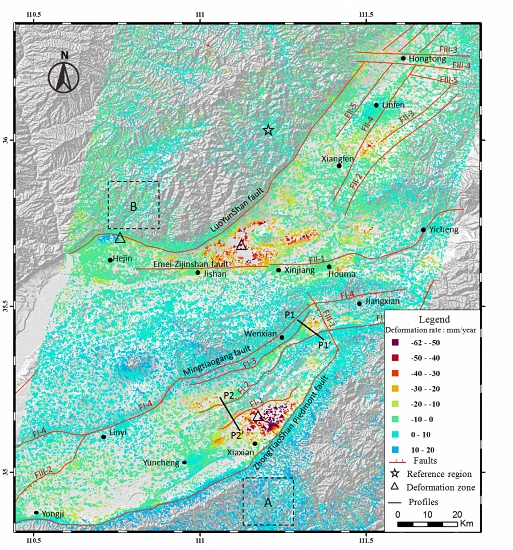
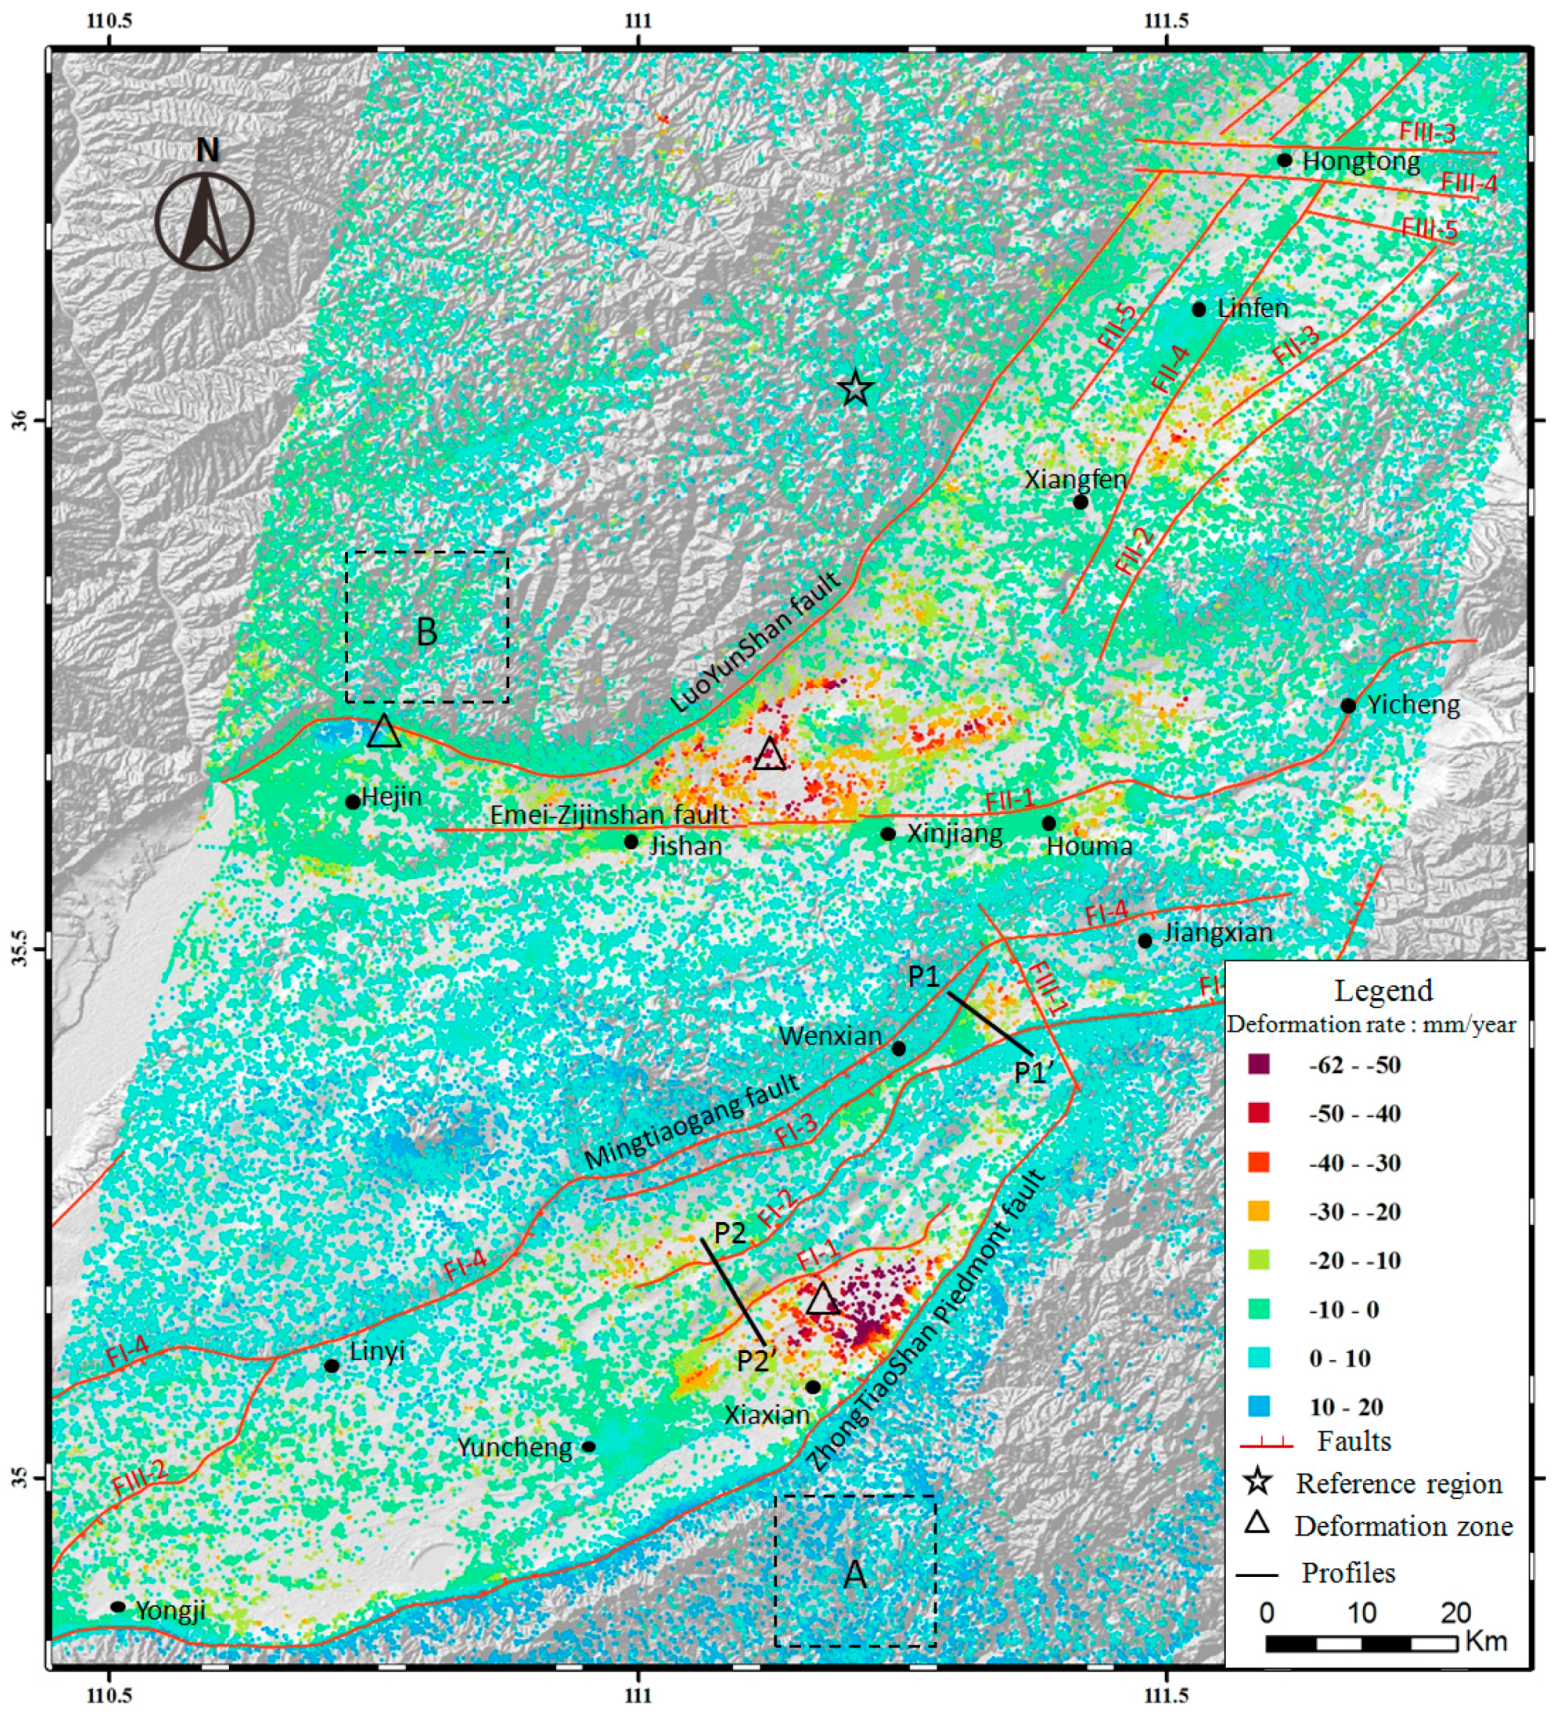
4.1. Deformation Characteristics Analysis

As is well known, the stratification of the lower troposphere may lead to topographically correlated propagation delays in interferometric phase (hereafter called stratified delay). Hence, the stratified delay can be approximately considered as a linear function of the terrain, as has been proven by earlier works [23,24,25,26,27,28]. After the temporal and spatial filtering in the SBAS–InSAR processing, the influence of tropospheric effects on the results comes mainly from the stratified delay. Because the deformation shares an obvious boundary with the basin topography (see Figure 3), we needed to analyze whether there was a topographically correlated stratified delay in the InSAR results; so we chose two regions, one in the eastern side and one in western side of the basin (shown as A and B in Figure 3, respectively), where analyzing the correlation between deformation rate and topography. The results showed that there was no obvious correlation between deformation rate and topography (Figure 4A,B). Thus, we concluded that the stratified delay had little effect on the monitoring results in this study.
According to the results shown in Figure 3, there are two obvious centers of subsidence and an uplift zone located near the towns of Xiaxian, Xinjiang and Hejin, respectively. Their locations are depicted in Figure 3. In order to analyze the deformation characteristics of the points that are marked with triangle in Figure 3, time series deformation results were extracted (shown in Figure 5). Based on Figure 5, the cumulative subsidence values around Xiaxian and Xinjiang through nearly one and one-half years were 100 mm and 70 mm, respectively, whereas the surface uplift in the Hejin region reached 40 mm. The uplift deformation in Hejin is discussed further in Section 5.

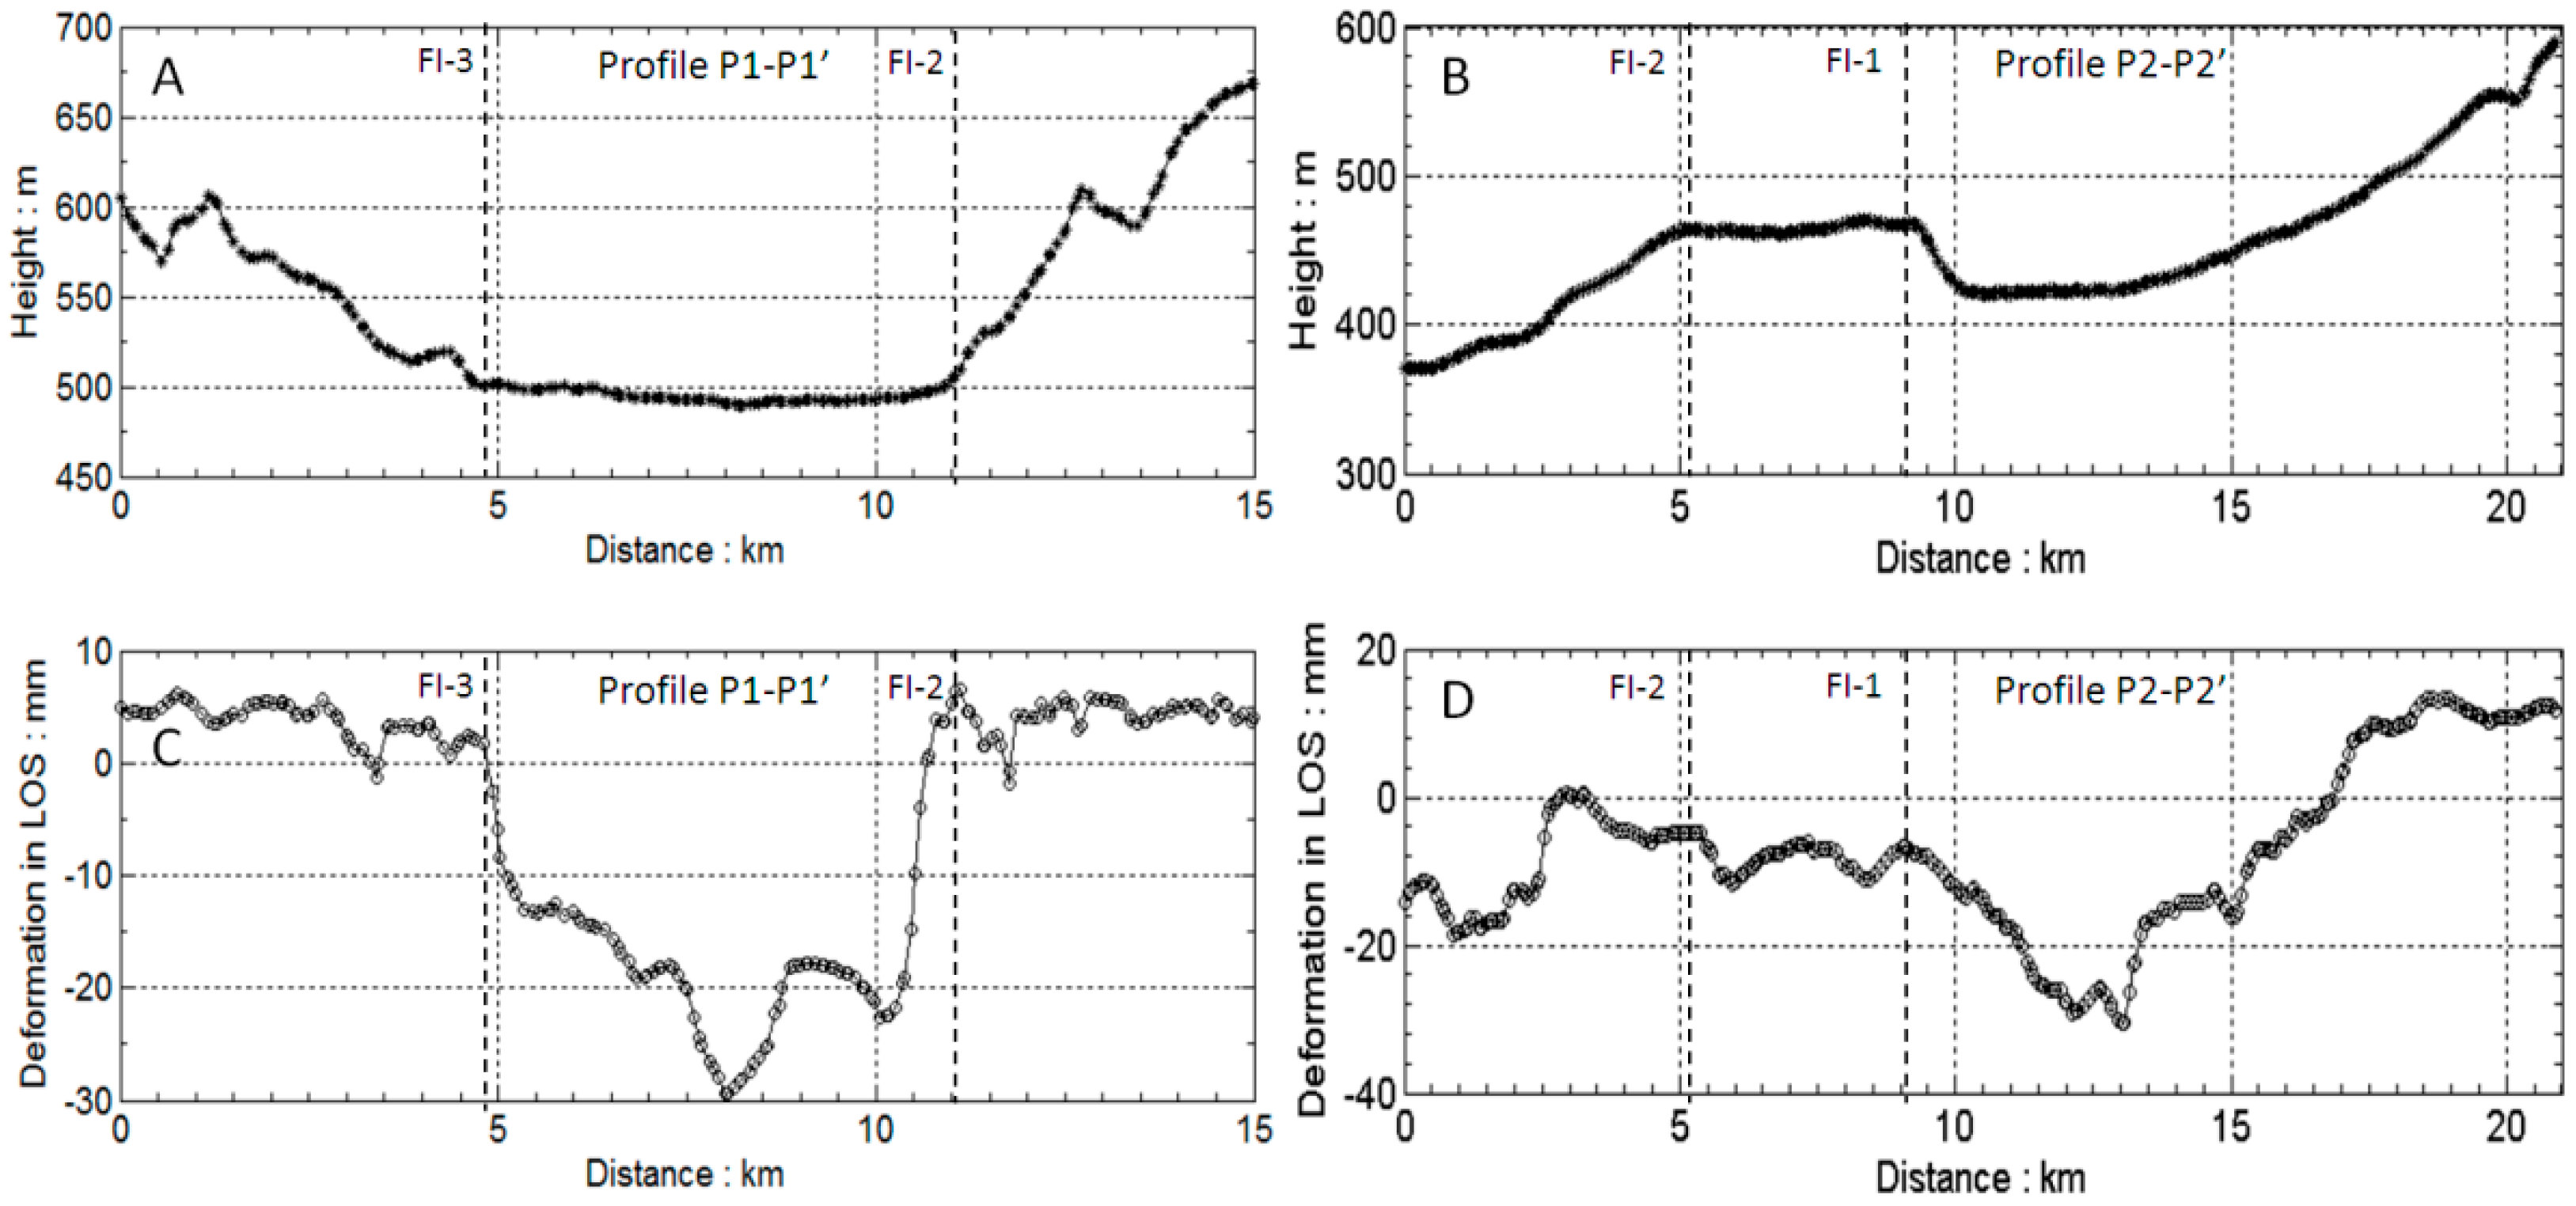
4.2. Fault Activity Analysis

According to the survey, there are more than 10 active faults in the study area. Among these, the ZhongTiaoShan piedmont fault, Emei–Zijinshan fault, and Mingtiaogang southeast fault are the three main active faults. In order to analyze the impacts of the faults on the regional deformation, two profiles were extracted along P1–P1" and P2–P2’, as shown in Figure 3, and the results are shown in Figure 6. The terrain profiles are also plotted in Figure 6.
Profile P1–P1’, crossing the FI-2 and FI-3 faults, is shown as Figure 6C. The ground subsidence shows an obvious difference between the two sides of the faults. The locations of the faults are showed by the dotted lines in the figure. The middle region of the two faults shows subsidence, but the lateral sides show uplift. There is about 15 mm/year of differential subsidence. We also extracted profile P2–P2’ perpendicular to faults FI-1 and FI-2 in Figure 3 (Figure 6D). The deformation difference on both sides of the faults is not as obvious, which shows that the influence of faults on ground subsidence varies in different areas.
As shown above, fault activity and the surrounding ground subsidence have a certain spatial correlation in the Linfen–Yuncheng basin. Deformation occurs within the fault-controlled basin, but no deformation occurs in the surrounding mountainous region without faults.

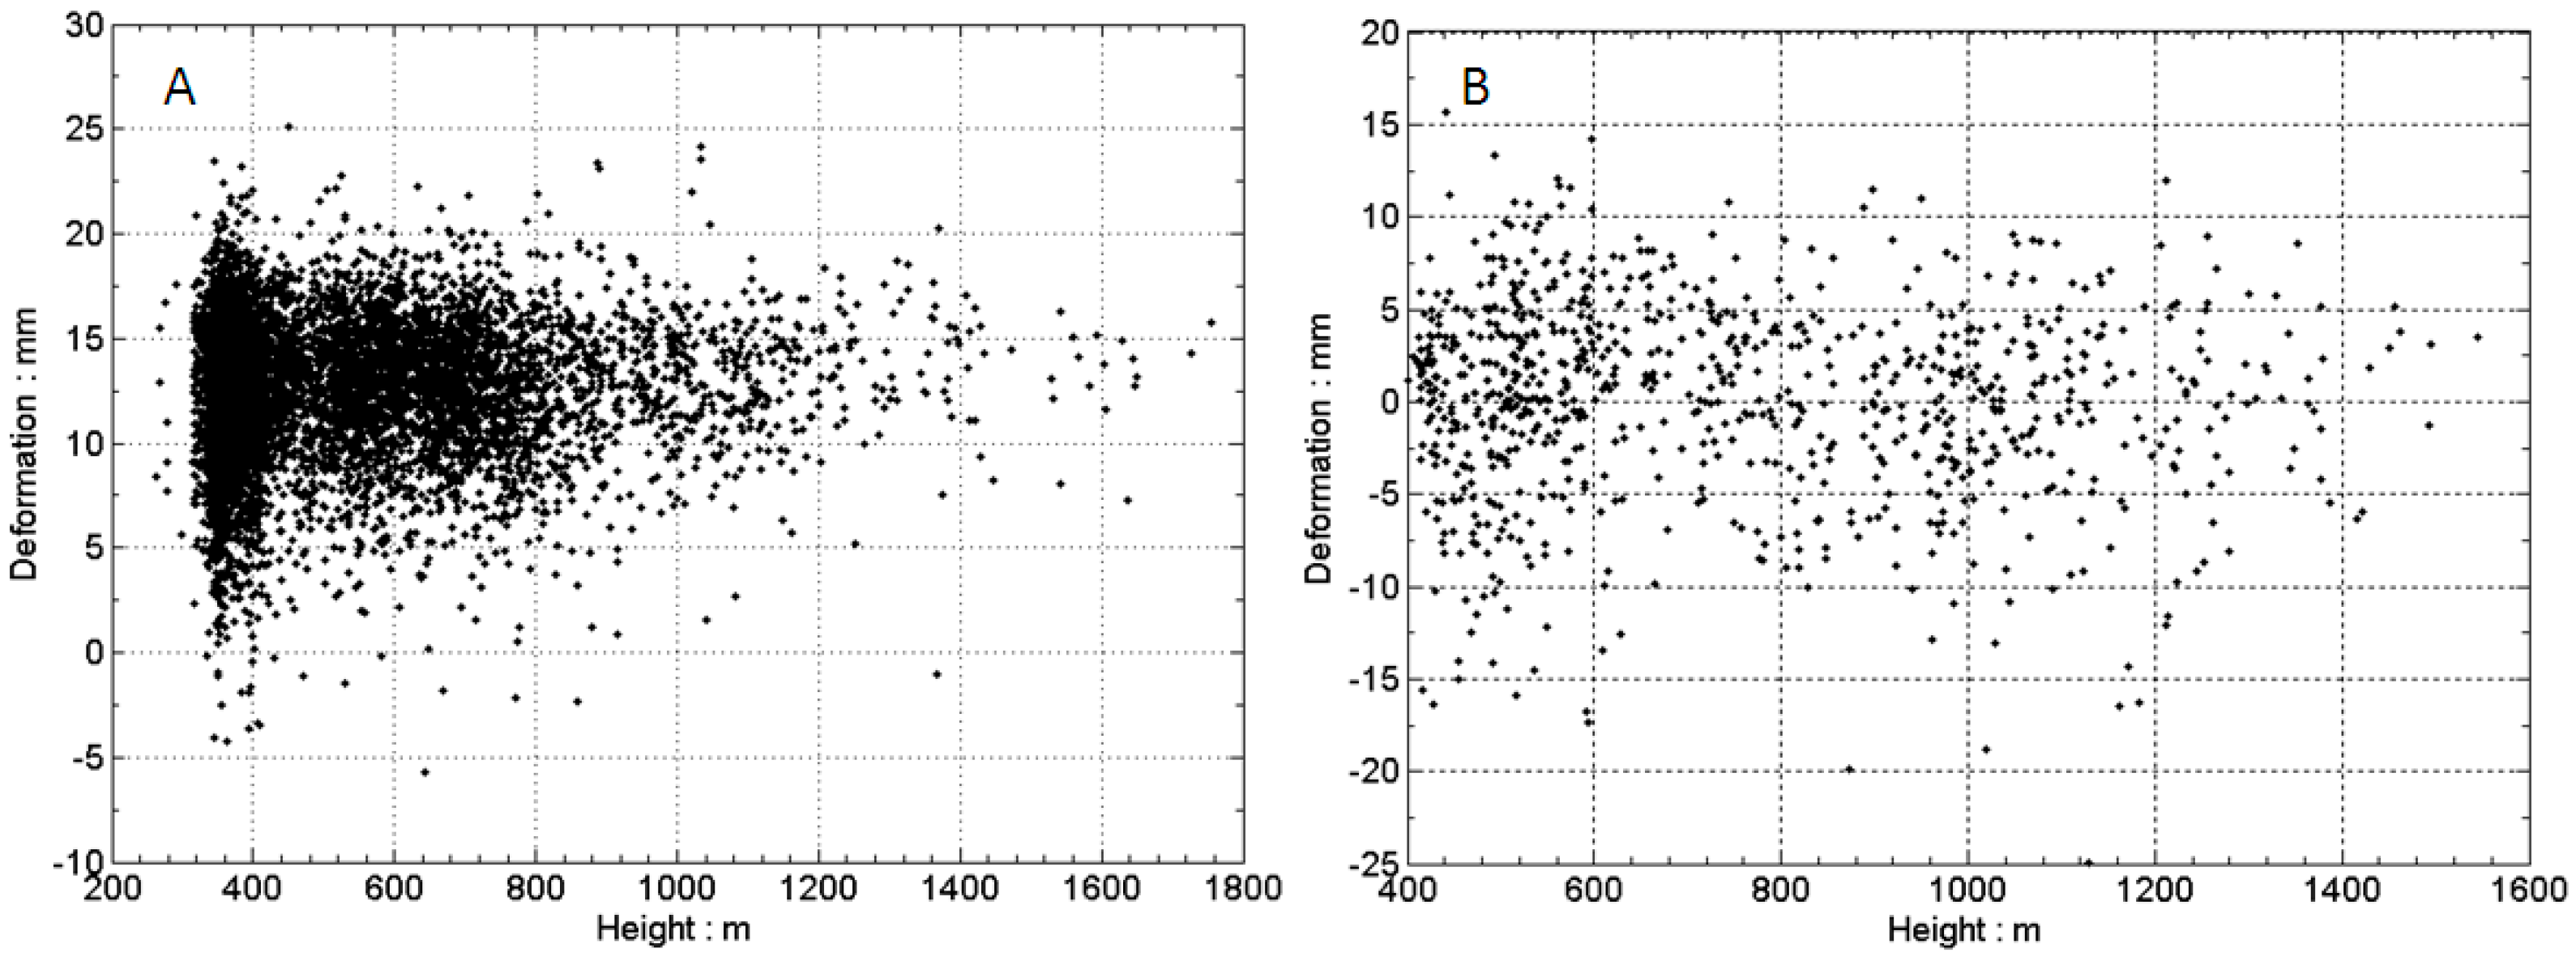
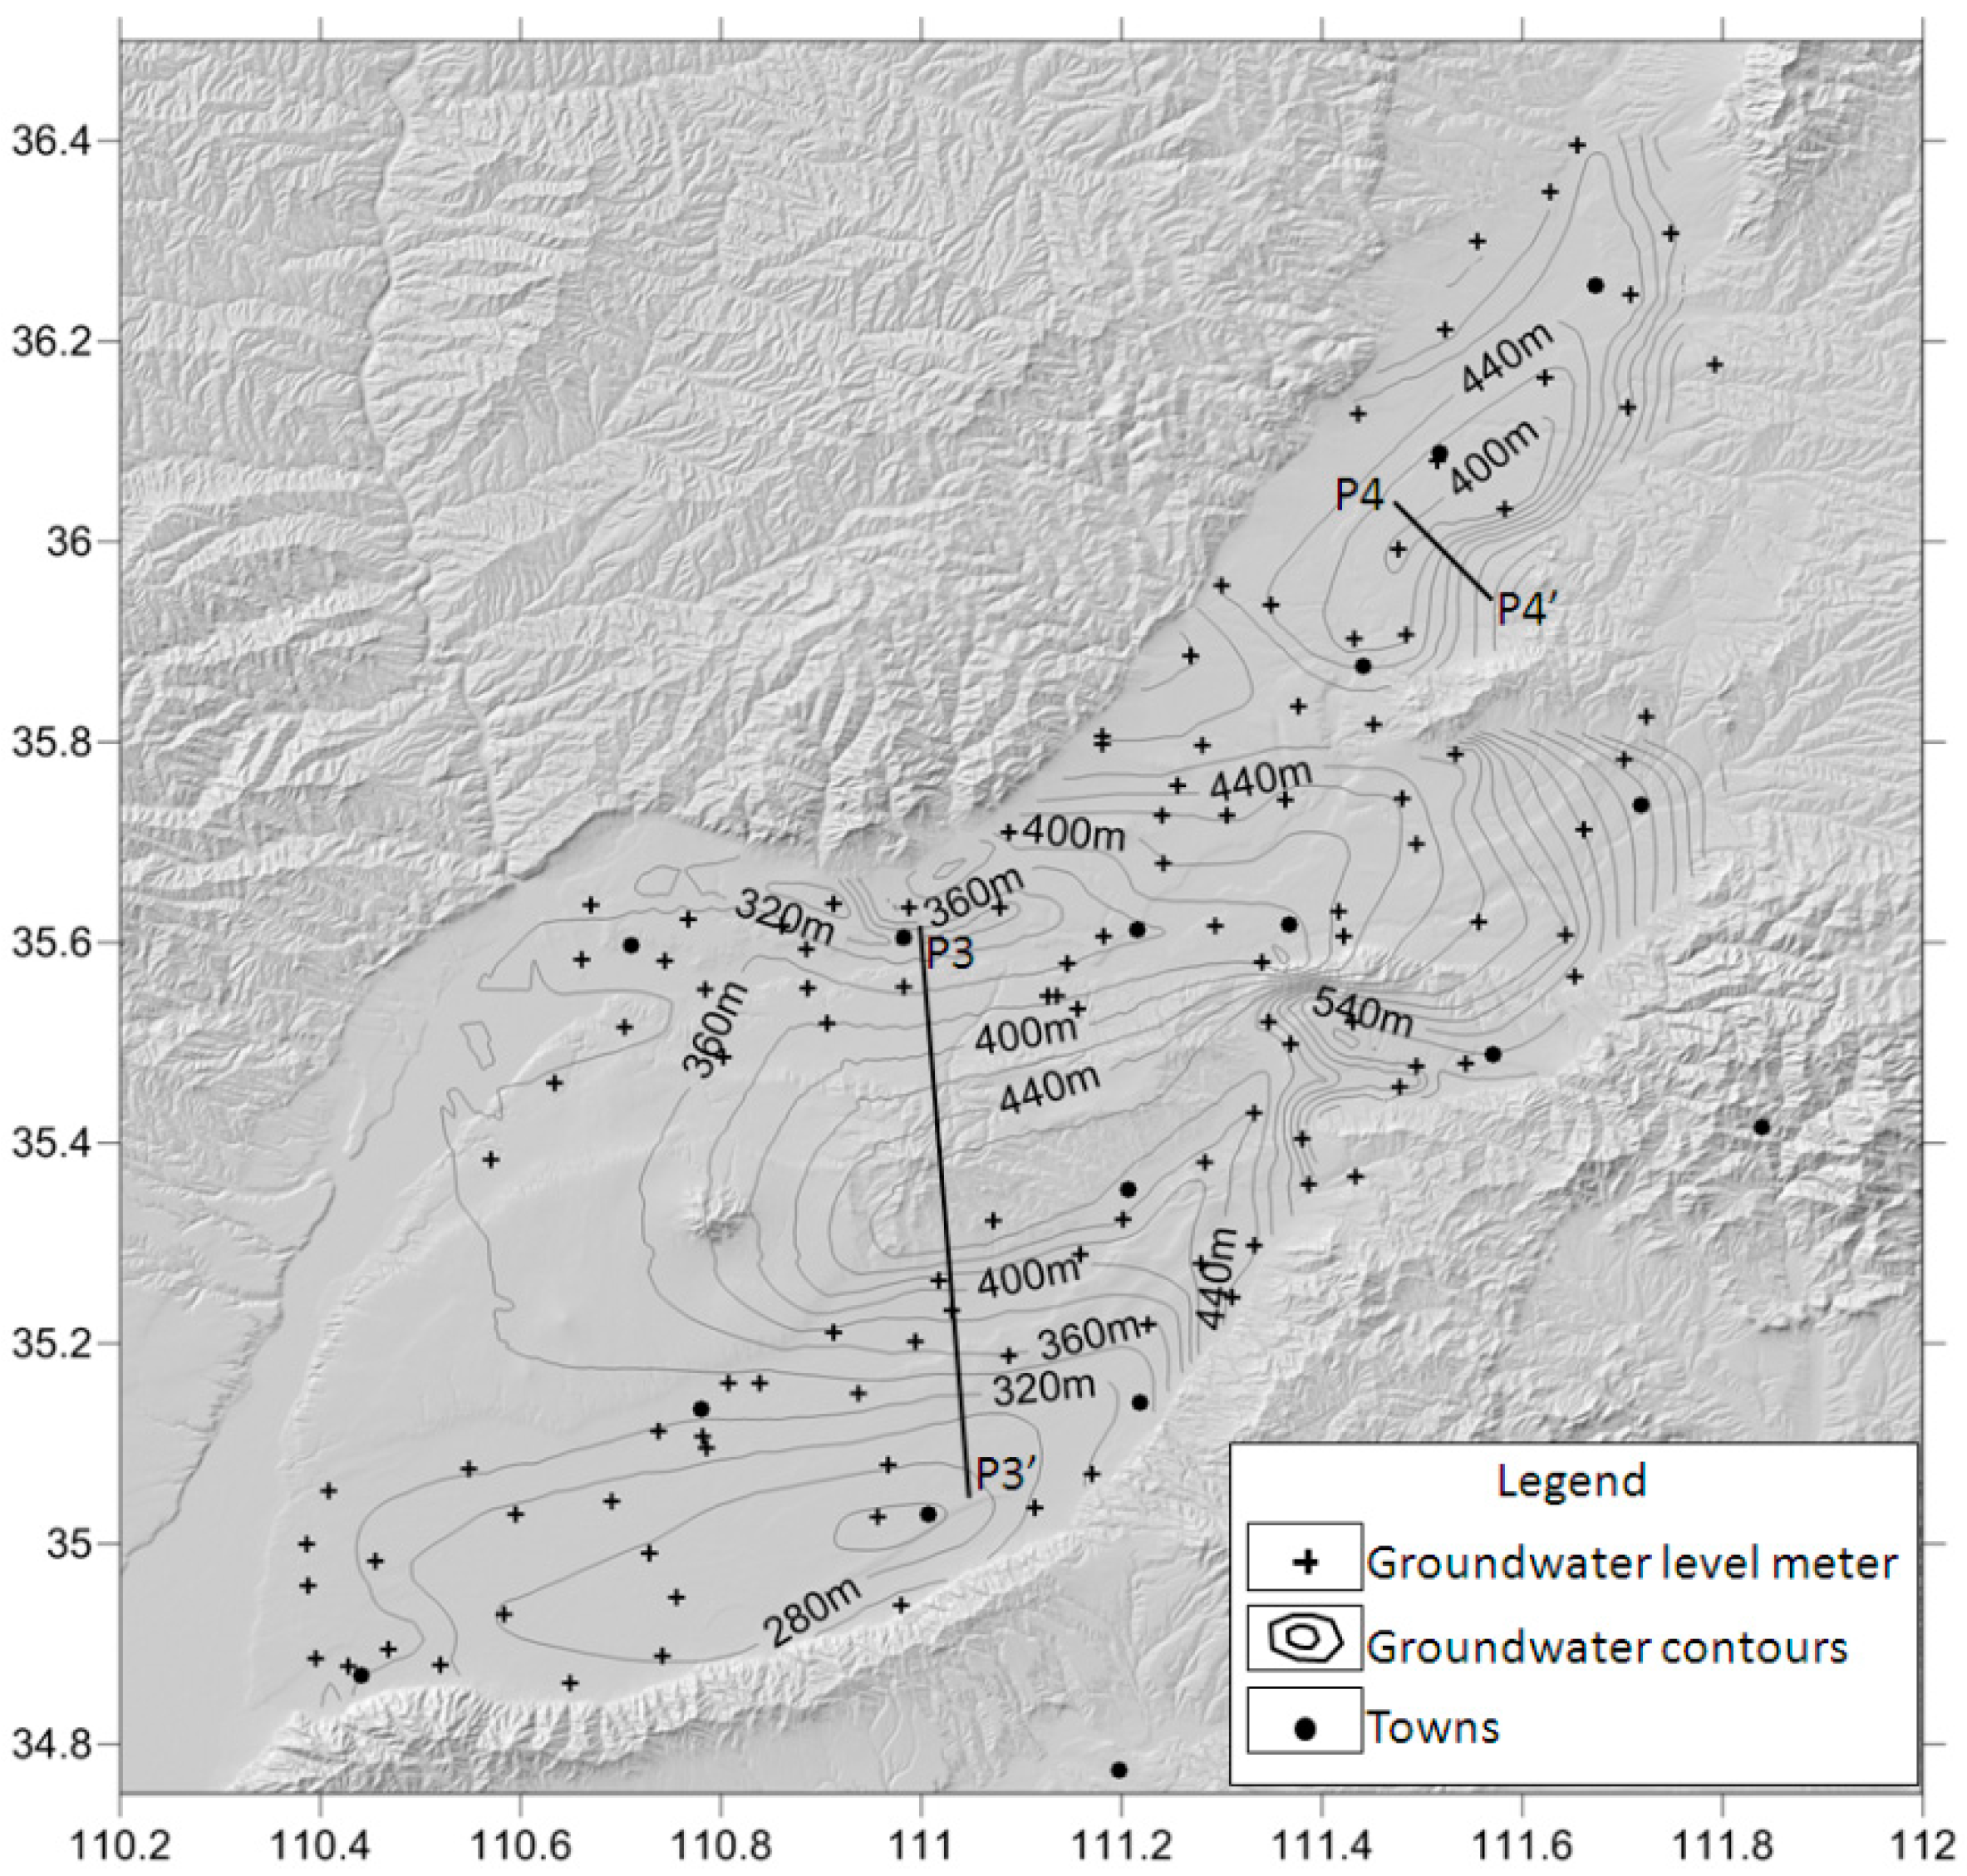
4.3. Relationship Analysis between Underground Water and Ground Subsidence

The Linfen–Yuncheng basin is surrounded by mountains. Its annual average rainfall is 572.5 mm, and the annual average evaporation is 1148.0 mm, twice the former. As a result, underground water is the main source of drinking water in the region.
Research has demonstrated that groundwater exploitation is an important factor in ground subsidence [11,29]. In order to study the relationship between ground subsidence and groundwater exploitation in the area, groundwater level data were collected by pressure-type water level meters, and the spatial distribution of the sensors was shown as in Figure 7. Two profiles of groundwater level, along lines P3–P3’ and P4–P4’ in Figure 7, were extracted (Figure 8A,B), along with the corresponding deformation values (Figure 8C,D), respectively.
It is worth noting that the two profiles are located in the groundwater level upheaval area, which is conducive to investigating the relationship between underground water level and ground subsidence. As shown in Figure 8, although the ground subsidence along P3–P3’ has small fluctuations, it has a trend that is generally similar with the trend of groundwater level. This similarity shows that the ground subsidence in the Xinjiang area is affected to a certain extent by the underground water level. However, this effect is not obvious in the Linfen region (Figure 8). Due to differences of soil physical and mechanical properties, the ground subsidence also shows some differences under the case of groundwater overexploitation. The Xinjiang–Xiaxian area is part of the Fen River floodplain, which has obvious plastic characteristics, and the degree of preconsolidation is relatively low. With the overexploitation of groundwater, pore water pressure was reduced, which inevitably led to ground subsidence. However, the Linfen region is part of the loess tableland, and the groundwater content varies widely, leading to the weak correlation between groundwater and land subsidence.

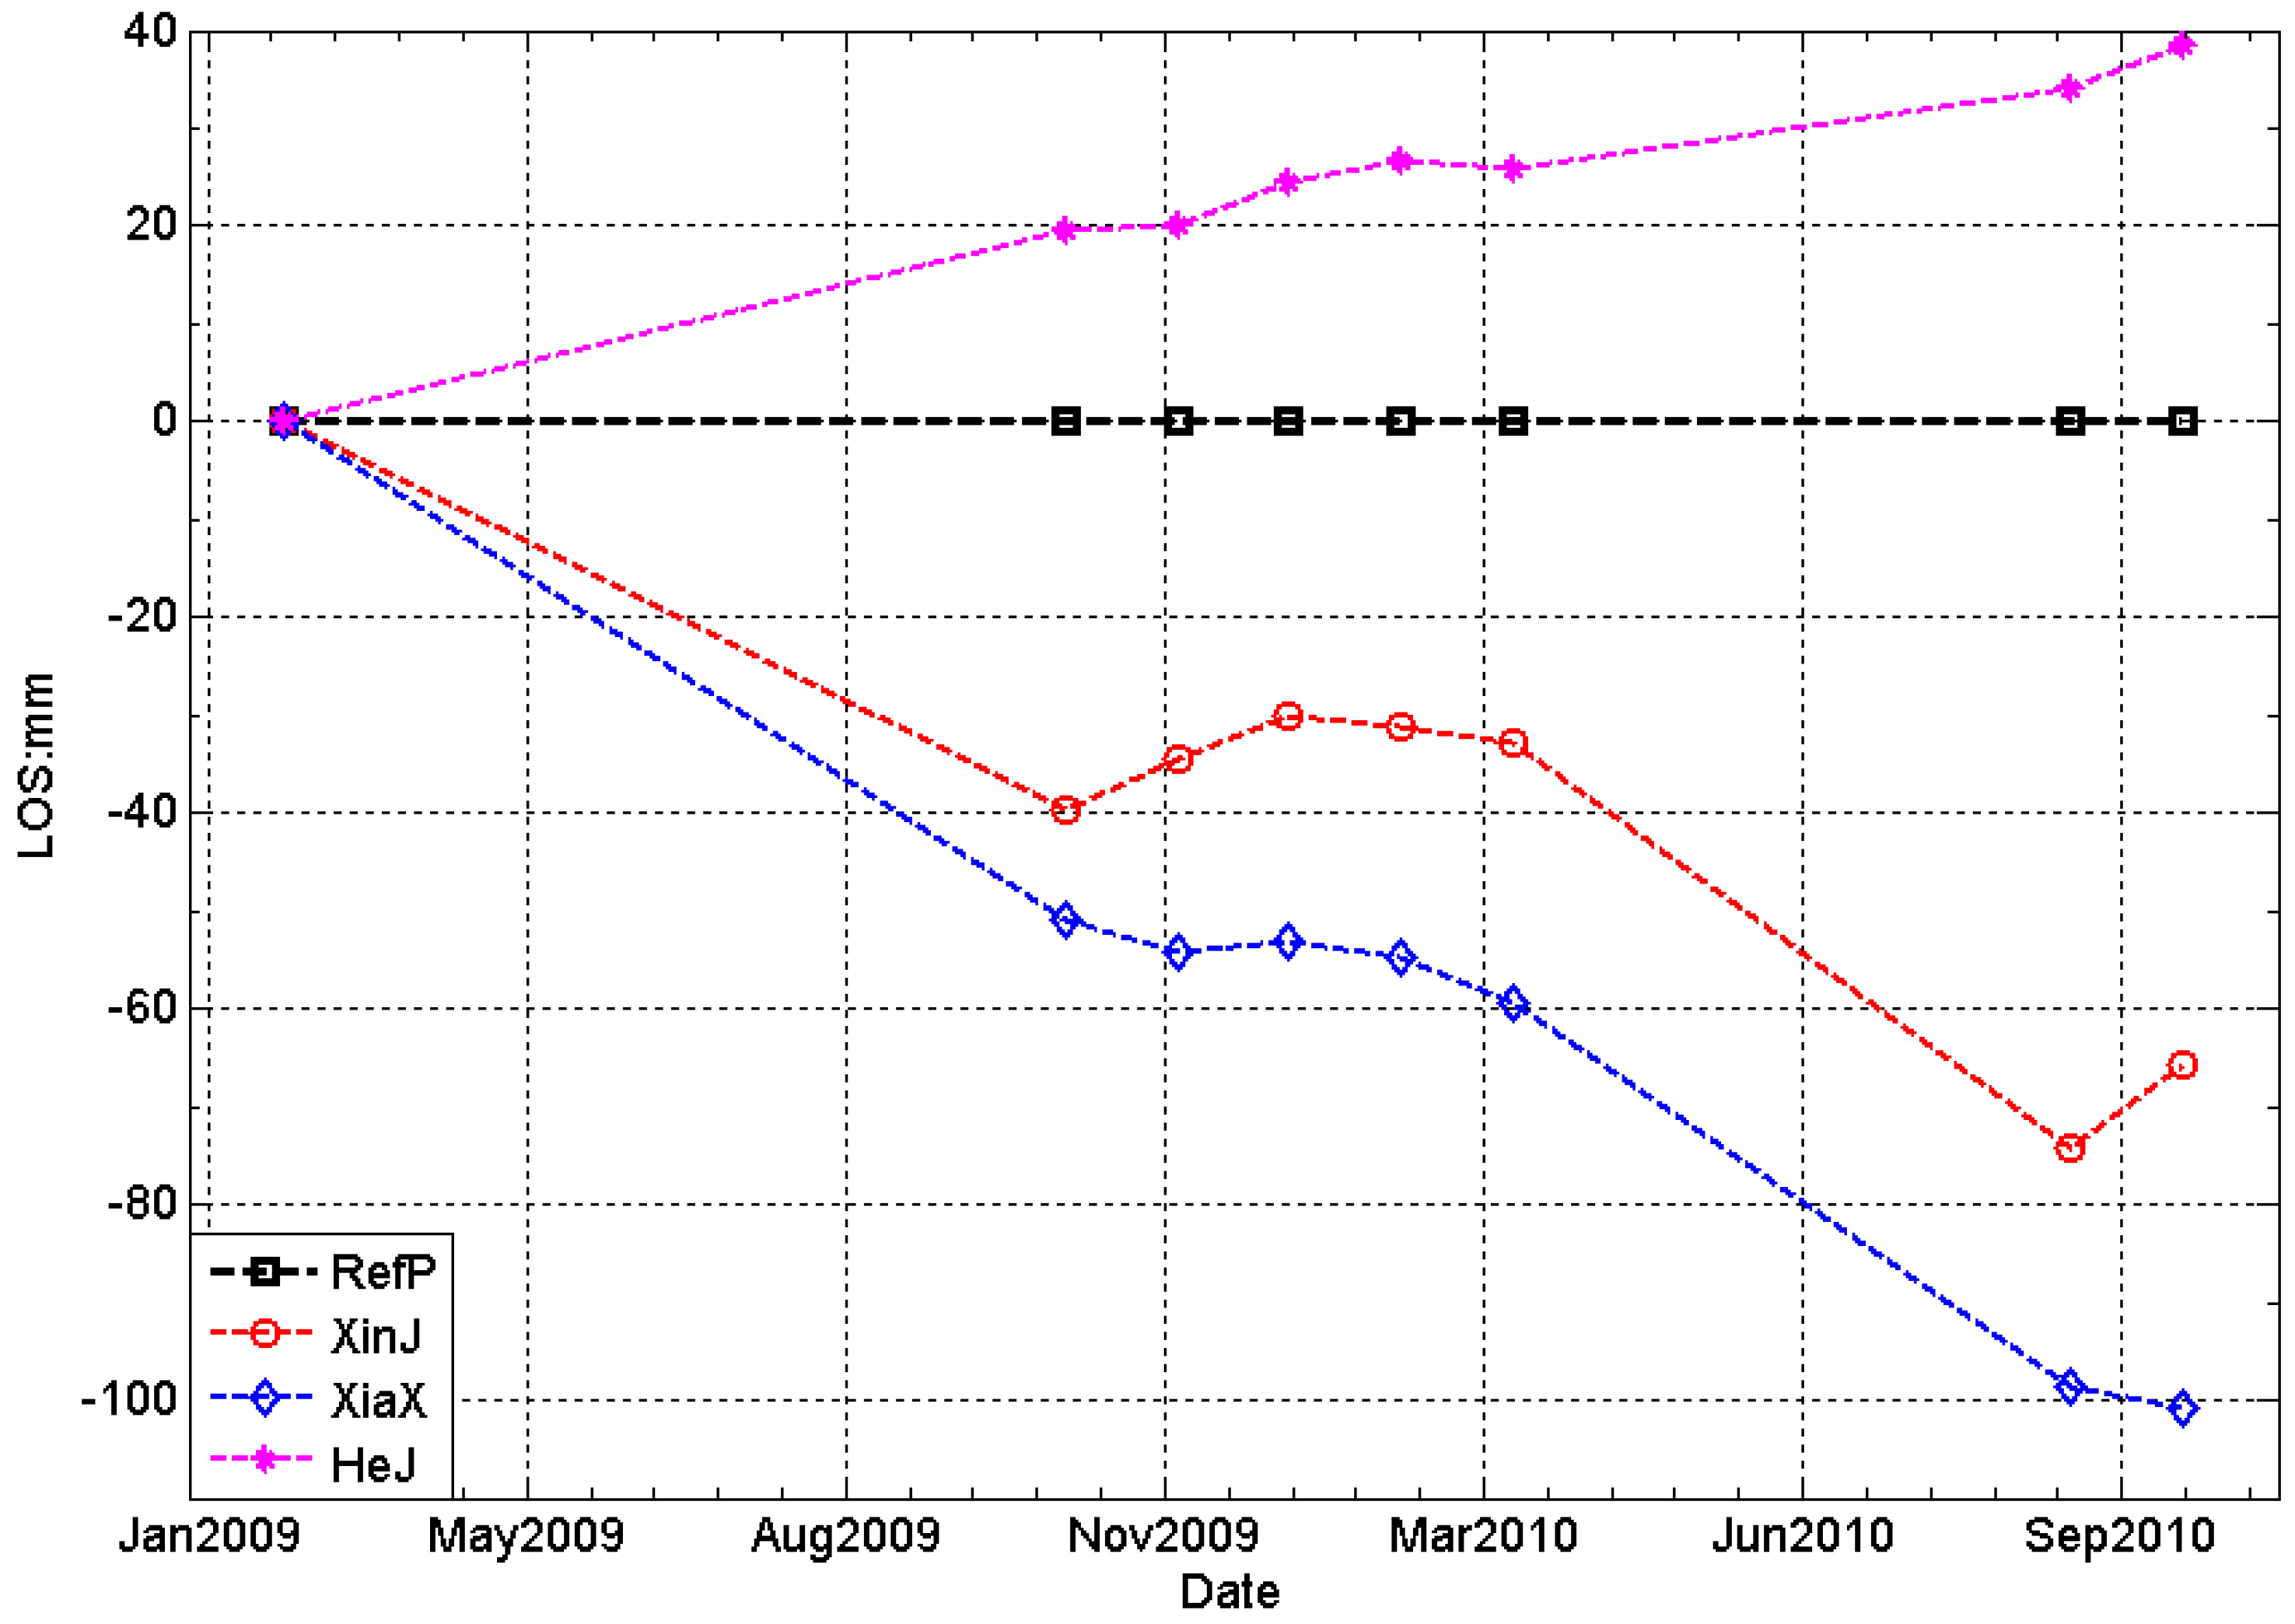
5. Hejin Abnormal Deformation Analysis

The Linfen–Yuncheng basin, where moderate–small earthquakes have occurred frequently in the recent past, is the only area in Shanxi Province that has incurred an Ms 8.0 earthquake. Hence, the abnormal deformation that occurred in this areas particularly attracted our attention. The InSAR results showed that the abnormal deformation is located in Hejin, south of the LuoYunShan fault (Figure 3). Exploring the process and the cause of this abnormal uplift is very important to an analysis of the seismic risk of the region.

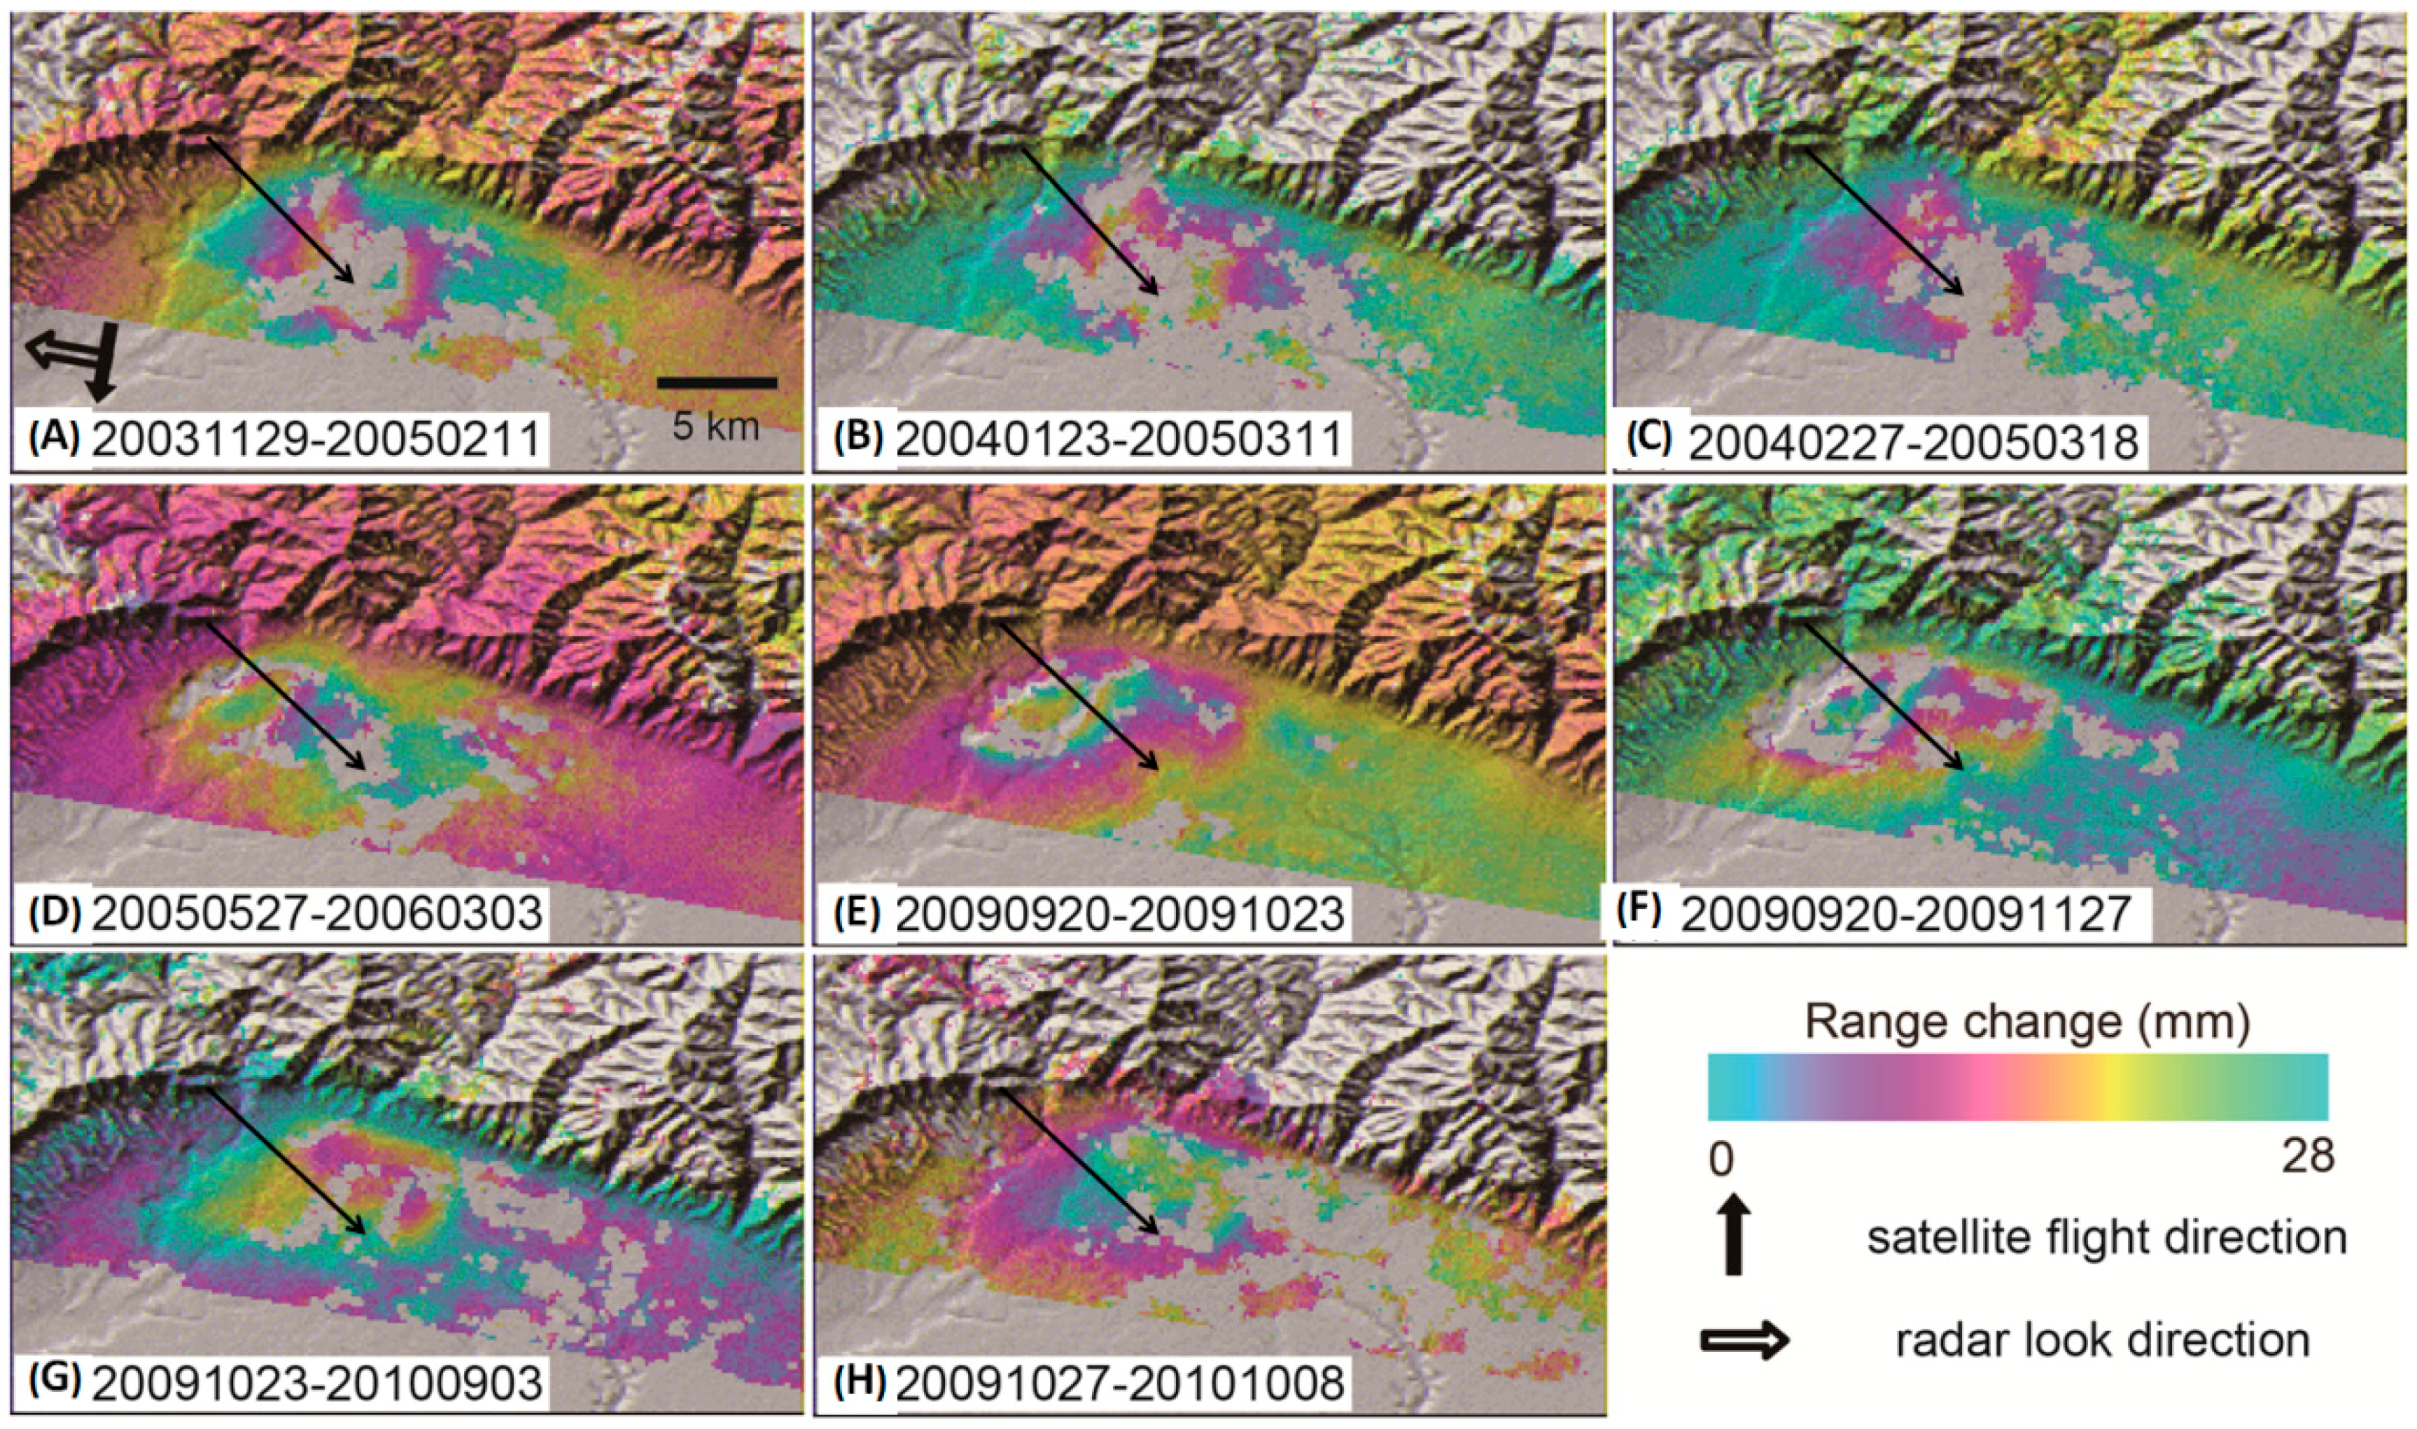
5.1. Interferogram Analysis

In order to obtain the process of the uplift deformation, we collected 18 scenes of ENVISAT ASAR standard images with track 2347 (blue frame in Figure 1), covering the Hejin area and spanning the years of 2003–2010 (there are no archived images for 2007 and 2008). Using these data, we began SBAS InSAR processing. ASTER GDEM Version 2 with resolution of 1 arc-second (30 m) was used as an external DEM to remove the topographic phase from the interferograms. Due to the notable temporal gap (no images for 2007 and 2008), we divided the total images into two subsets and carried out the processing separately. After careful data processing, 18 interferograms with good coherence were generated (Figure 9). We show eight typical interferograms, spanning several months to several years, in Figure 10. From these interferogram patterns, we developed the following observations.
(1)
Fringes that persist in time (e.g., Figure 10A–H) show deformation anomalies. These fringes are unlikely to be atmospheric artifacts because the interferograms were produced from independent SAR images. Additionally, the signals cannot be attributed to DEM errors because the baselines of these interferograms are short, making them insensitive to any plausible errors in the DEM.
(2)
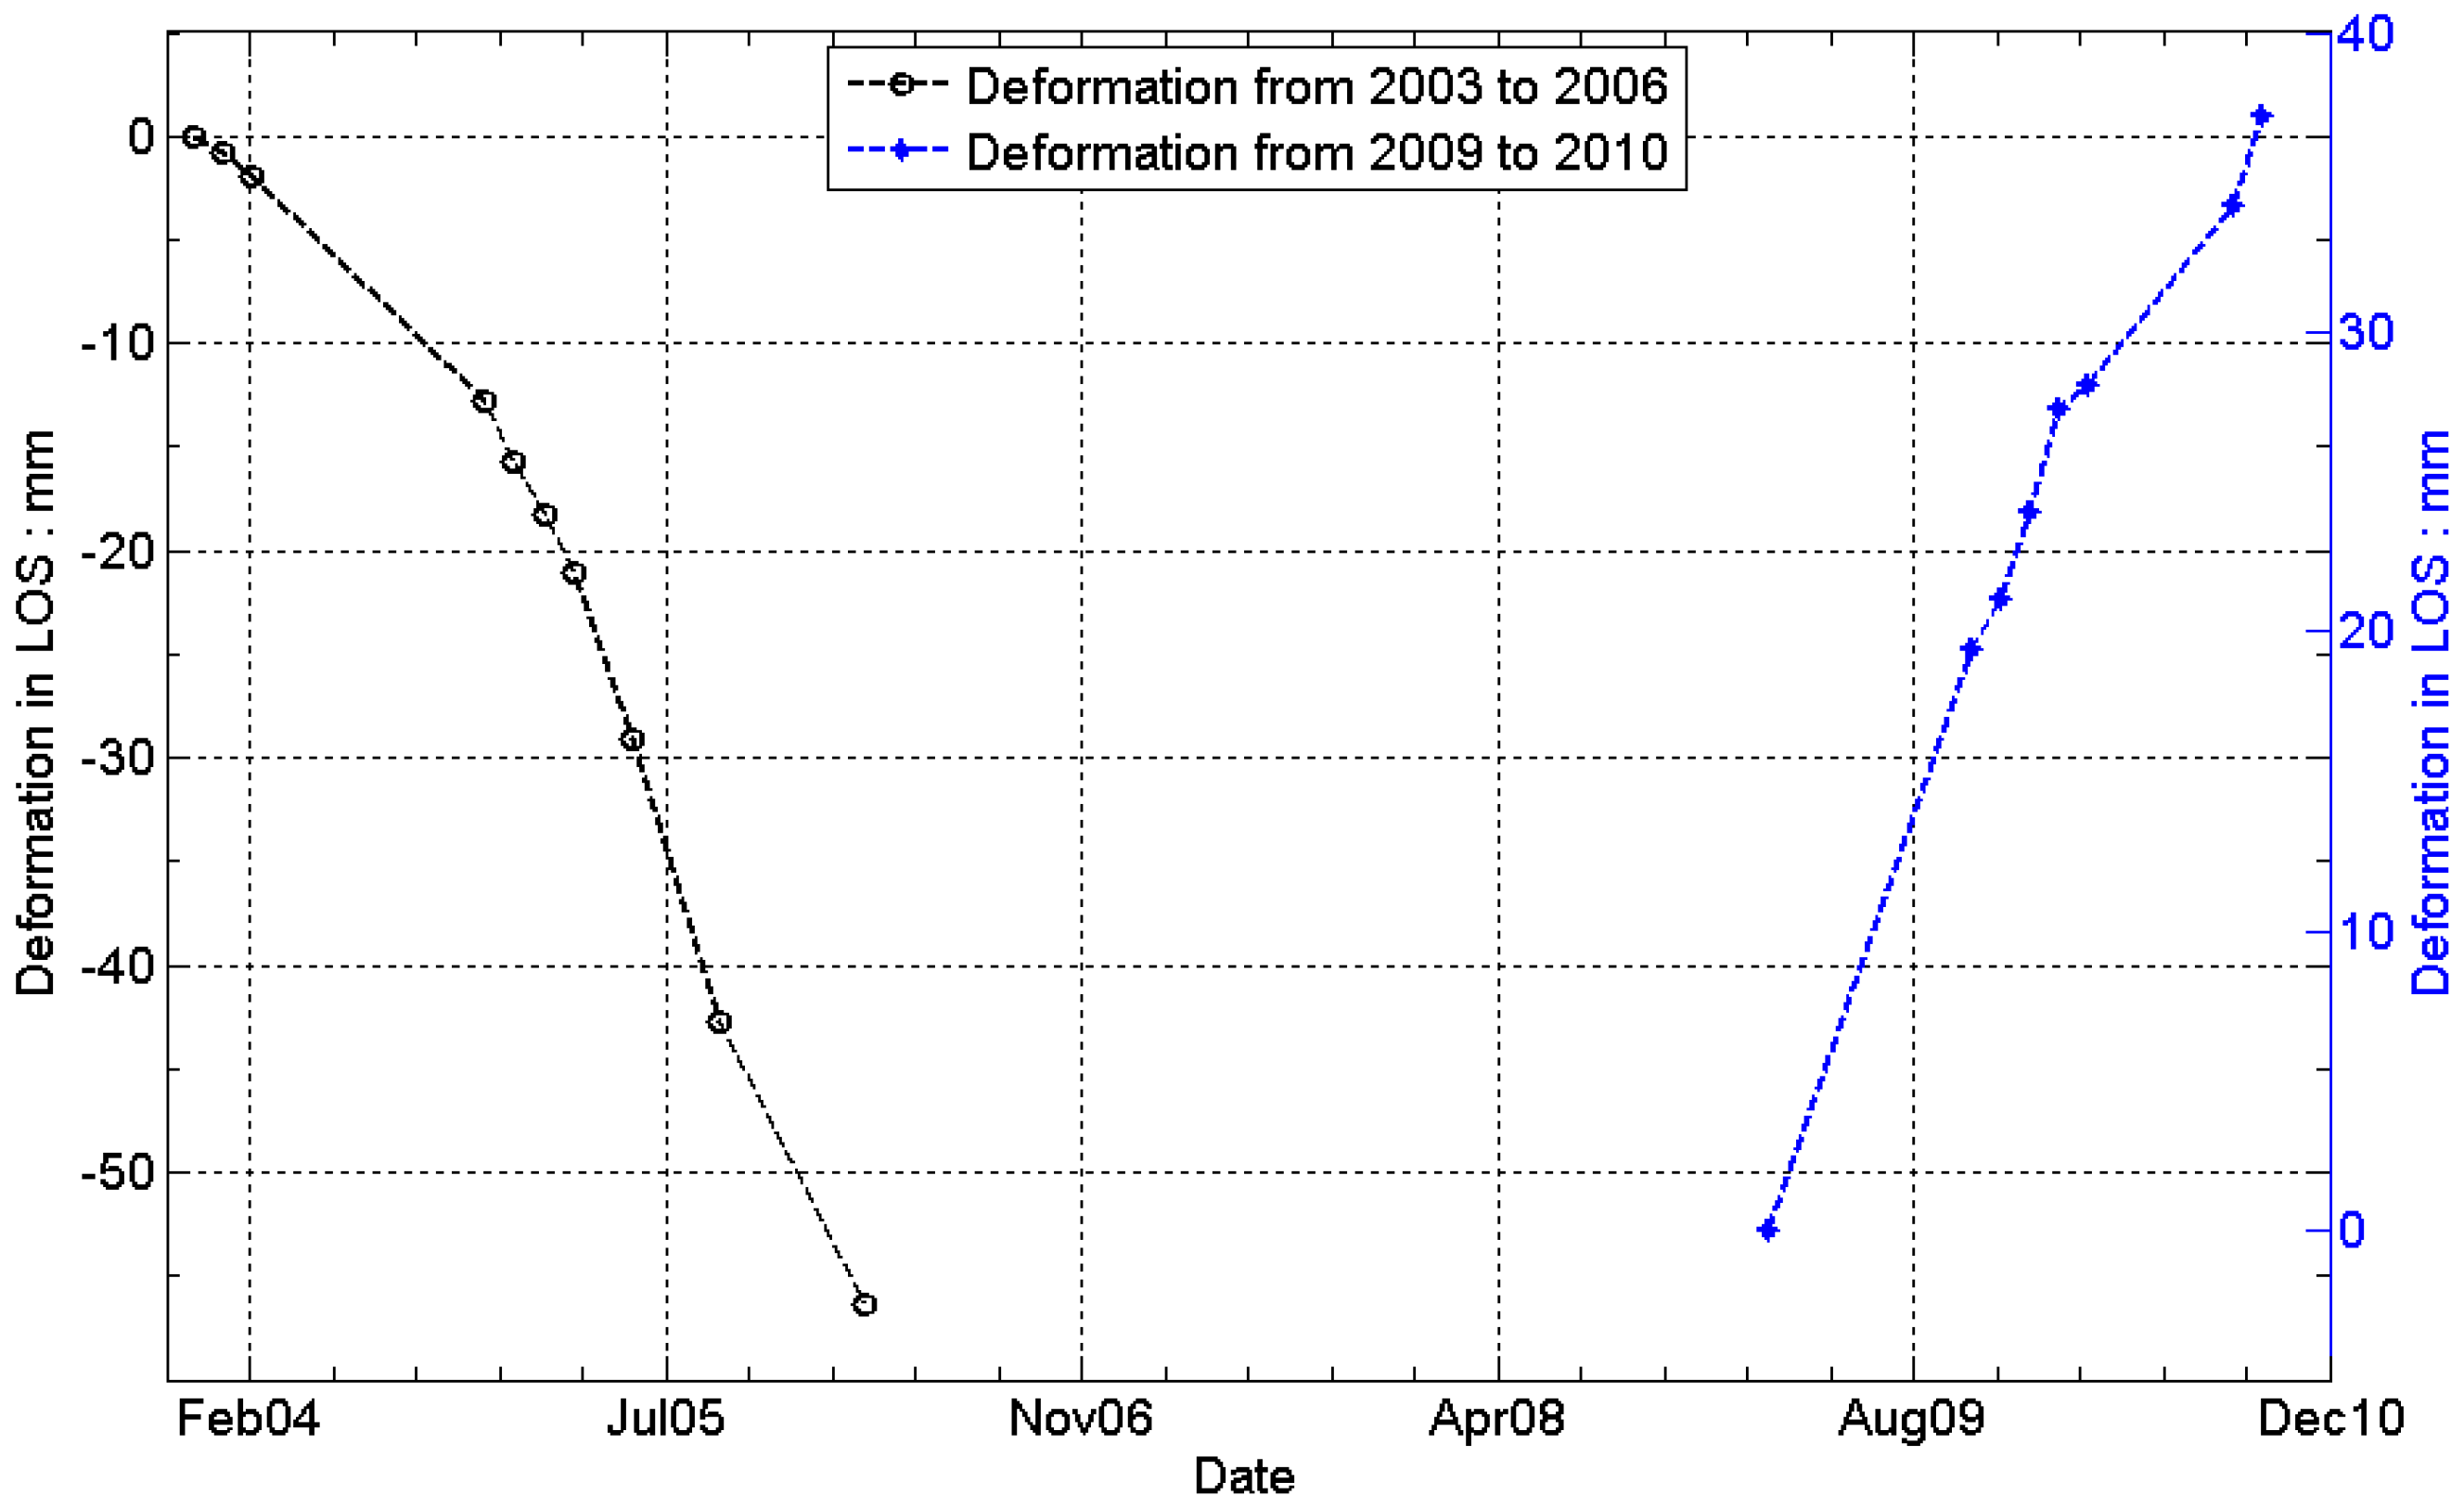
The deformation patterns are different during the periods spanning 2003–2006 (Figure 10A–D) and 2009–2010 (Figure 10E–H). The color changes from blue–red–yellow–blue along the direction of the arrow during 2003–2006 (Figure 10A–D). However, the color change shows the opposite trend along the direction of the arrow (yellow–red–blue–yellow) during 2009–2010 (Figure 10E–H). Another phenomenon of note is that the deformation center moved to the west during 2009–2010 (Figure 10E–H).

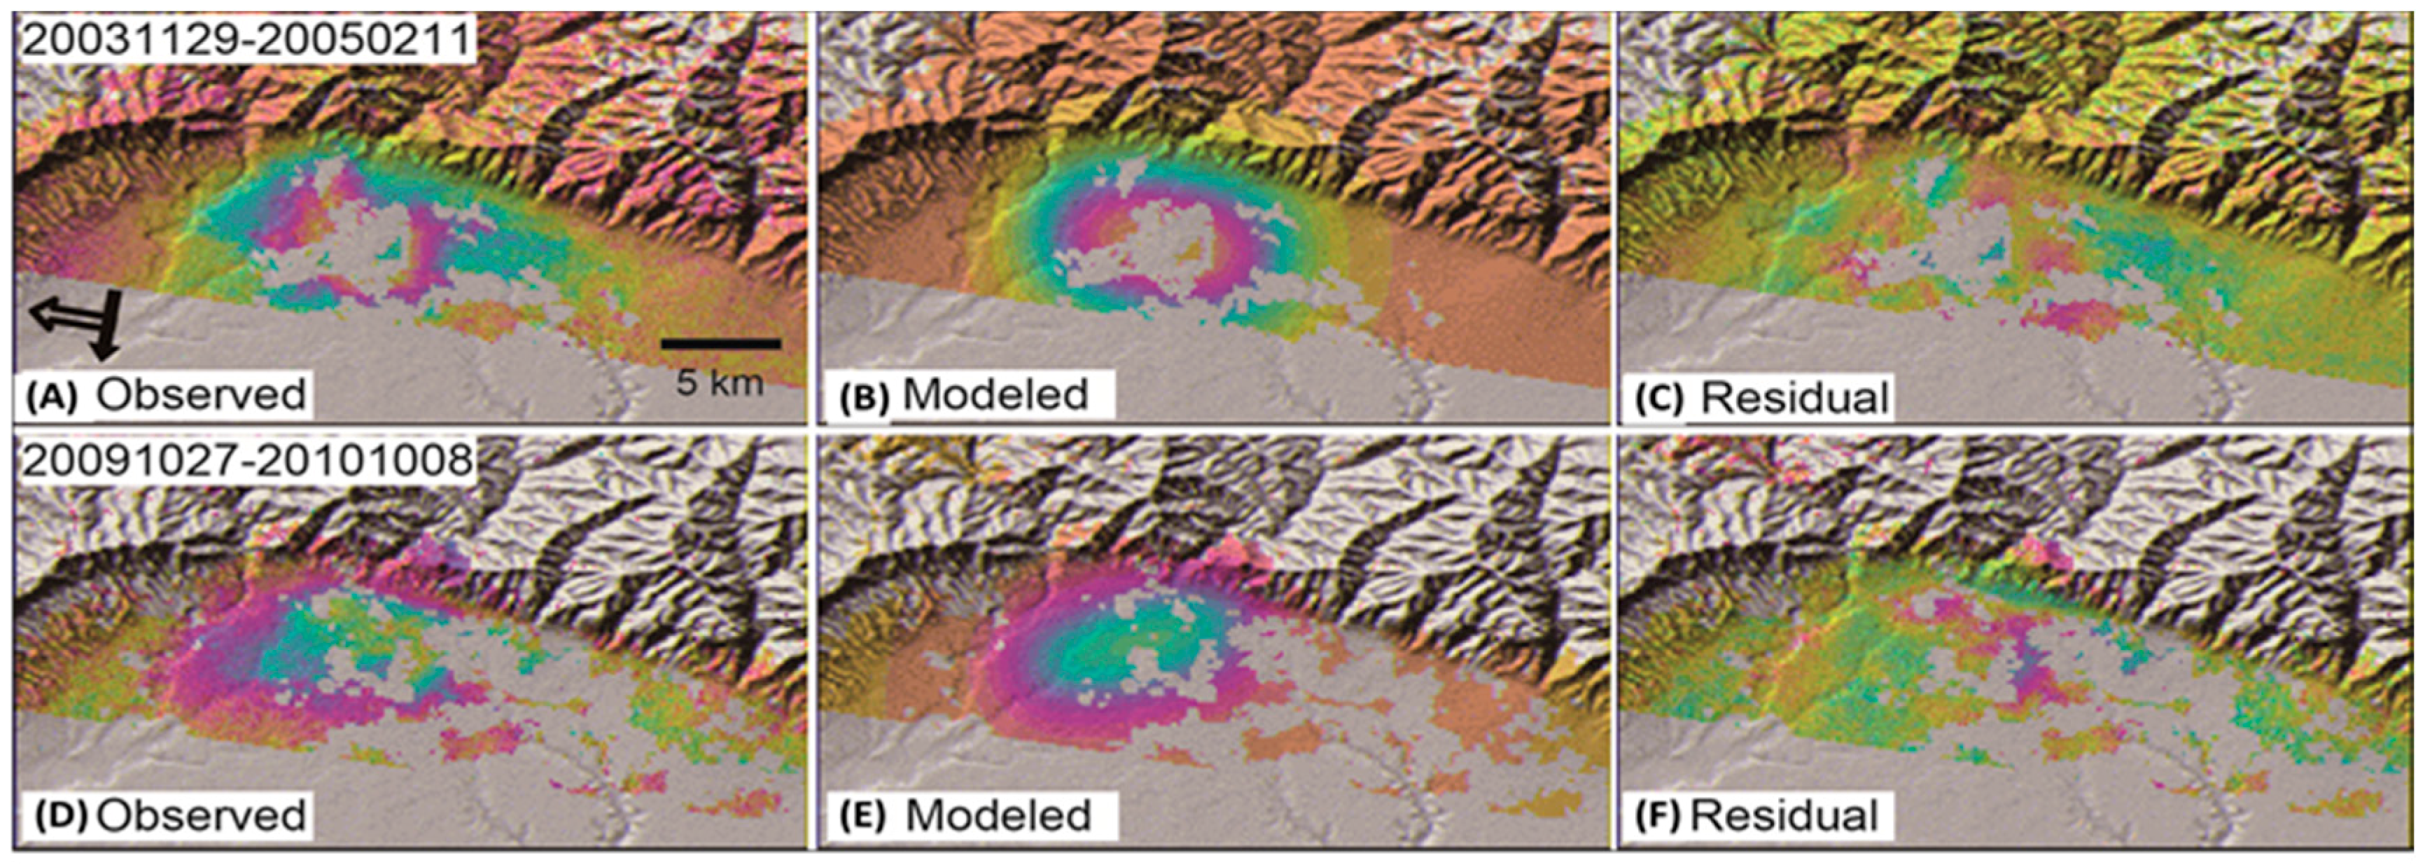
5.2. Deformation and Mechanism Inversion

In order to understand the uplift deformation process, we obtained the time series results of the deformation center (Figure 11) using the SBAS method for the data processing. As determined from the results, the deformation is divided into two stages, a subsidence stage from December 2003 to February 2006, with maximum subsidence of 57 mm, and an uplift stage from February 2009 to November 2010, with maximum uplift of 38 mm. Because of the absence of images from 2007 to 2008, we were unable to obtain the deformation process during this time period.
We assumed that the deformation was caused by a volume change beneath the northern Hejin area. In order to explain the InSAR-derived deformation field, we tried a uniformly opening sill (i.e., crack) embedded in an elastic half-space to model all the interferograms with reasonably good coherence individually [30]. Eight parameters defined the sill: length, width, depth, strike, dip, opening, and location (two parameters). In the model, we introduced linear terms to account for any possible phase ramp due to uncertainties in satellite positions [31]. We used the downhill simplex method and Monte Carlo simulations to estimate the optimal parameters and their uncertainties [32] and the root mean square error (RMSE) between the observed and modeled interferograms as the prediction-fit criterion. Figure 12 shows two examples with observed (Figure 12A,D), modeled (Figure 12B,E), and residual (Figure 12C,F) interferograms for the sill models. The models fit each of the observed interferograms reasonably well. Because the subsidence and uplift may have been caused by different mechanisms, we separately calculated the parameters of the sill models for seven deflationary and four inflationary interferograms. In other words, we achieved the parameters of the two sill models by averaging all the results for seven deflationary and four inflationary interferograms separately. This strategy provided a first-order approach to reducing errors in the modeling. Table 1 shows the averaged parameters of the sill sources for the seven deflationary and four inflationary interferograms. All of the model parameters are well constrained according to the uncertainties shown in Table 1. We attribute the goodness of fit to the averaging of the many interferograms. The best-fit model sill for the deflationary interferograms is 5.2 km long, 2.5 km wide, 1.5 km deep, and has a strike of N104°E, and the best-fit model sill for the inflationary interferograms is 5.4 km long, 1.6 km wide, 1.4 km deep, and has a strike of N78°E.

5.3. Discussion of Abnormal Deformation

The differences of location and depth of the sill sources beneath the northern Hejin area between the results of the subsidence and uplift interferograms are not significant at the 95% confidence level (Table 1), so we attribute both processes to the same source. The dimensions of the two sill models are also similar.
We speculate that the deformation was caused by underground water withdrawal and influx. First, no active faults or volcanoes are located in the northern Hejin area. Second, according to the patterns shown in the interferograms (Figure 10), it does not seem that the deformation was caused by tectonic movements. Third, the ground surface, as shown by the high-resolution remote sensing images, is covered mainly by crops, and there are some chemical plant distribution here. Therefore, we speculate that underground water was overextracted during 2003–2009. According to our field investigation, more than 50% of the small- and medium-sized enterprises were closed during 2009. After 2009, the local enterprises and residents stopped extracting underground water excessively, which caused the ground to rebound, i.e., subsidence to uplift.

6. Conclusions

Linfen–Yuncheng basin has suffered from severe geo-hazards, including large scale land subsidence and small scale fault activity, which has caused serious infrastructure damages and property losses. High accuracy InSAR results can show the relationships among the different scale deformation. In this study, ground deformation, fault activity, and the mechanism of abnormal deformation over the Linfen–Yuncheng basin were analyzed using InSAR deformation results. The influences of underground water on ground subsidence were analyzed, as were the controlling effects of the fault distribution on the deformation trend. The following conclusions were drawn.
First, there are two obvious centers of subsidence and one uplift zone within the Linfen–Yuncheng basin located in the towns of Xiaxian, Xinjiang, and Hejin, respectively. Second, deformation occurs within the fault-controlled basin, and the distribution of faults controls the ground subsidence trend. Third, excessive exploitation of underground water is one of the main causes of land subsidence in the Linfen–Yuncheng basin, and the effects of underground water level on ground subsidence show differences in different regions, which are influenced mainly by formation conditions. Fourth, an area of abnormal deformation was found and this deformation presented a reversal of trend, from ground subsidence to uplift, in about 2009. The abnormal deformation was mainly related to excessive groundwater exploitation.

Acknowledgments

This research was funded jointly by the National Natural Science Foundation of China (NSFC) (Nos. 41304016, 41372375, 41274004, and 41274005), the Special Earthquake Research Project of the China Earthquake Administration (No. 201508009), the National Program on Key Basic Research Project (973 Program) (Grant No. 2014CB744703), the Fundamental Research Funds for the Central Universities (310826161017), and the State Key Laboratory of Geohazard Prevention and Geoenvironment Protection (SKLGP2015K013). The SAR data used in this study were supplied under the Category 1 project (C1F.28413, C1F.28193). We also thank JPL/Caltech for ROI PAC, TU-Delft for DORIS, and Andy Hooper for StaMPS. We are grateful for the helpful corrections and suggestions made by four anonymous reviewers.

Author Contributions

Qin Zhang and Chao-ying Zhao conceived and designed the experiments; Cheng-sheng Yang performed experiments and drafted the manuscripts; Qiang Xu and Jian-bing Peng contributed to InSAR data analysis; Ling-yun Ji contributed to model calculations.

Conflicts of Interest

The authors declare no conflict of interest.

References

  1. Wang, X. Recent crustal deformation field and time-space evolution character in Linfen basin. Earthq. Res. Shanxi 1995, 83, 80–86. [Google Scholar]
  2. Liu, R.; Ji, L. Present-day crustal deformation of Linfen basin and its boundary faults. J. Geodesy Geodyn. 2014, 34, 28–31. [Google Scholar]
  3. Liu, R.; Han, S. The current seismic activity characteristics and seismic risk analysis of the Linfen basin, Shanxi, and its periphery. Earthq. Res. Shanxi 2013, 153, 1–3. [Google Scholar]
  4. Seismological Bureau of Shanxi Province. 2015. Available online: http://www.sxeq.com.cn/n16/index.html (accessed on 30 January 2016).
  5. Chang’an University. Monitoring Land Subsidence and Ground Fissures over Fenwei Basin by using InSAR and GPS Techniques; Chang’an University: Xi’an, China, 2014. [Google Scholar]
  6. Shanxi Geological Disaster Environment Monitoring Center. Report on Land Subsidence and Ground Fissure Monitoring within the Shanxi Basin; Geological Disaster Environment Monitoring Center of Shanxi Province: Taiyuan, China, 2013. [Google Scholar]
  7. Massonnet, D.; Rossi, M.; Carmona, C.; Adragna, F.; Peltzer, G.; Feigl, K.; Rabaute, T. The displacement field of the Landers earthquake mapped by radar interferometry. Nature 1993, 364, 138–142. [Google Scholar] [CrossRef]
  8. Zebker, H.A.; Rosen, P.A.; Goldstein, R.M.; Gabriel, A.; Werner, C.L. On the derivation of coseismic displacement fields using differential radar interferometry: The Landers earthquake. J. Geogr. Res. 1994, 99, 19617–19634. [Google Scholar]
  9. Lu, Z.; Patrick, M.; Fielding, E.J.; Trautwein, C. Lava volume from the 1997 eruption of Okmok Volcano, Alaska, estimated from spaceborne and airborne interferometric synthetic aperture radar. IEEE Trans. Geosci. Remote Sens. 2003, 41, 1428–1436. [Google Scholar]
  10. Zhao, C.Y.; Lu, Z.; Zhang, Q.; de La Fuente, J. Large-area landslides detection and monitoring with ALOS/PALSAR imagery data over Northern California and Southern Oregon, USA. Remote Sens. Environ. 2012, 124, 348–359. [Google Scholar] [CrossRef]
  11. Yang, C.-S.; Zhang, Q.; Zhao, C.-Y.; Wang, Q.L.; Ji, L.-Y. Monitoring land subsidence and fault deformation using the small baseline subset InSAR technique: A case study in the Datong Basin, China. J. Geodyn. 2014, 75, 34–40. [Google Scholar] [CrossRef]
  12. Hanssen, R. Radar Interferometry: Data Interpretation and Error Analysis; Springer: New York, NY, USA, 2001. [Google Scholar]
  13. Lanari, R.; Mora, O.; Manunta, M.; Mallorqu, J.J.; Berardino, P.; Sansosti, E. A small-baseline approach for investigating deformations on full-resolution differential SAR interferograms. IEEE Trans. Geosci. Remote Sens. 2004, 42, 1377–1386. [Google Scholar] [CrossRef]
  14. Lanari, R.; Casu, F.; Manzo, M.; Zeni, G.; Berardino, P.; Manunta, M.; Pepe, A. An overview of the small BAseline subset algorithm: A DInSAR technique for surface deformation analysis. Pure Appl. Geophys. 2007, 164, 637–661. [Google Scholar] [CrossRef]
  15. Usai, S. A least squares database approach for SAR interferometry data. IEEE Trans. Geosci. Remote Sens. 2003, 41, 753–760. [Google Scholar] [CrossRef]
  16. Berardino, P. A new algorithm for surface deformation monitoring based on small baseline differential SAR interferograms. IEEE Trans. Geosci. Remote Sens. 2002, 40, 2375–2383. [Google Scholar] [CrossRef]
  17. Hooper, A.; Zebker, H.; Segall, P.; Kampes, B. A new method for measuring deformation on volcanoes and other natural terrains using InSAR persistent scatterers. Geophys. Res. Lett. 2004, 31, L23611. [Google Scholar] [CrossRef]
  18. Hooper, A.; Zebker, H.A. Phase unwrapping in three dimensions with application to InSAR time series. J. Opt. Soc. Am. A: Opt. Image Sci. Vis. 2007, 24, 2737–2747. [Google Scholar] [CrossRef]
  19. Ferretti, A.; Prati, C.; Rocca, F. Permanent scatterers in SAR interferometry. IEEE Tans. Geosci. Remote Sens. 2001, 39, 8–20. [Google Scholar] [CrossRef]
  20. Hooper, A. A multi-temporal InSAR method incorporating both peristent scatterer and small baseline approaches. Geophys. Res. Lett. 2008, 35, L16302. [Google Scholar] [CrossRef]
  21. Hooper, A.; Spaans, K.; Bekaert, D.; Arikan, M. Recent advances in SAR interferometry time series analysis for measuring crustal deformation. Tectonophysics 2012, 514–517, 1–13. [Google Scholar] [CrossRef]
  22. Hooper, A.; Bekaert, D.; Spaans, K. Stamps/MTI Manual Version 3.3b1; University of Leeds: Leeds, UK, 2013; Available online: http://homepages.see.leeds.ac.uk/~earahoo/stamps/index.html (accessed on 30 January 2016).
  23. Li, Z.; Fielding, E.; Cross, P.; Muller, J.P. Interferometric synthetic aperture radar atmospheric correction: GPS topography-dependent turbulence model. J. Geophys. Res.: Solid Earth 2006, 111, B02404. [Google Scholar] [CrossRef]
  24. Doin, M.P.; Lasserre, C.; Peltzer, G.; Cavalie, O.; Doubre, C. Corrections of stratified tropospheric delays in SAR interferometry: Validation with global atmospheric models. J. Appl. Geophys. 2009, 69, 35–50. [Google Scholar] [CrossRef]
  25. Lin, Y.N.; Simons, M.; Hetland, E.A.; Muse, P.; DiCaprio, C. A multi-scale approach to estimating topographically-correlated propagation delays in radar interferograms. Geochem. Geophys. Geosys. 2010, 11, Q09002. [Google Scholar] [CrossRef]
  26. Béjar-Pizarro, M.; Socquet, A.; Armijo, R.; Carrizo, D.; Genrich, J.; Simons, M. Interseismic coupling and Andean structure in the north Chile subduction zone. Nat. Geosci. 2013, 6, 462–467. [Google Scholar] [CrossRef]
  27. Bekaert, D.P.S.; Walters, R.J.; Wright, T.J.; Hooper, A.J.; Parker, D.J. Statistical comparison of InSAR tropospheric correction techniques. Remote Sens. Environ. 2015, 170, 40–47. [Google Scholar] [CrossRef]
  28. Beauducel, F.; Briole, P.; Froger, J. Volcano-wide fringes in ERS synthetic aperture radar interferograms of Etna (1992–1998): Deformation or tropospheric effect? J. Geophys. Res. 2000, 105, 16391–16402. [Google Scholar] [CrossRef]
  29. Chaussard, E.; Wdowinski, S.; Cabral-Cano, E.; Amelung, F. Land subsidence in central Mexico detected by ALOS InSAR time-series. Remote Sens. Environ. 2014, 140, 94–106. [Google Scholar] [CrossRef]
  30. Okada, Y. Surface deformation due to shear and tensile faults in a half-space. Bull. Seismol. Soc. Am. 1985, 75, 1135–1154. [Google Scholar]
  31. Massonnet, D.; Feigl, K. Radar interferometry and its application to changes in the Earth’s surface. Rev. Geophys. 1998, 36, 441–500. [Google Scholar] [CrossRef]
  32. Press, W.; Teukolsky, S.; Vetterling, W.; Flannery, B. Numerical Recipes in C, the Art of Scientific Computing; Cambridge Univ. Press: New York, NY, USA, 1992; p. 994. [Google Scholar]
Figure 1. Shaded relief map of the Linfen–Yuncheng basin.
Remotesensing 08 00284 g001
Figure 2. Configurations of Interferometric Synthetic Aperture Radar (InSAR) pairs used for the basin ground deformation monitoring.
Remotesensing 08 00284 g002
Figure 3. Mean velocity of the Linfen–Yuncheng basin derived from the InSAR time series.
Remotesensing 08 00284 g003
Figure 4. Correlation between ground deformation and terrain: (A) area A Figure 3; and (B) area B in Figure 3.
Remotesensing 08 00284 g004
Figure 5. Cumulated subsidence curves. “RefP” is the reference point, “XinJ” is the town of Xinjiang, “XiaX” is the town of Xiaxian, and “HeJ” is the town of Hejin.
Remotesensing 08 00284 g005
Figure 6. Profiles across the faults: (A,B) terrain profiles; and (C,D) surface deformation rate profiles. The dotted lines show the locations of faults.
Remotesensing 08 00284 g006
Figure 7. Groundwater level contours and groundwater level meter locations.
Remotesensing 08 00284 g007
Figure 8. Profiles of groundwater level and ground deformation: (A,B) groundwater level profiles along P3–P3’ and P4–P4’ (Figure 7); and (C,D) respective deformation profiles along the same lines.
Remotesensing 08 00284 g008
Figure 9. Configurations of InSAR pairs used for the abnormal deformation monitoring.
Remotesensing 08 00284 g009
Figure 10. (AH) Interferograms labeled with period (date format is yyyymmdd). The satellite flight direction and radar look direction are labeled in (A). Each fringe (full color cycle) represents 28 mm of range change between ground and satellite. Areas that lack interferometric coherence are uncolored.
Remotesensing 08 00284 g010
Figure 11. InSAR Line-Of-Sight (LOS) deformation time series for the HeJin area.
Remotesensing 08 00284 g011
Figure 12. (AF) Observed interferograms; synthetic interferograms for sill sources that best fit the individual interferograms; and residual interferograms, which are the differences between the observed (left) and the modeled (middle) interferograms.
Remotesensing 08 00284 g012
Table 1. Parameters for the best-fitting model sill (see text for details). Uncertainties correspond to 95% confidence.
ParameterDeflationInflation
Length (km)5.2 ± 0.95.4 ± 0.5
Width (km)2.5 ± 0.41.6 ± 0.2
Depth (km)1.5 ± 0.51.4 ± 0.3
Strike (°)104.1 ± 1.478.3 ± 8.7
X (km)7.7 ± 0.37.0 ± 1.0
Y (km)3.7 ± 0.34.7 ± 0.1
Open (mm)−34.5 ± 14.538.6 ± 9.8

