
Tropical Forest Fire Susceptibility Mapping at the Cat Ba National Park Area, Hai Phong City, Vietnam, Using GIS-Based Kernel Logistic Regression

Abstract
:
1. Introduction
2. Study Area and Data
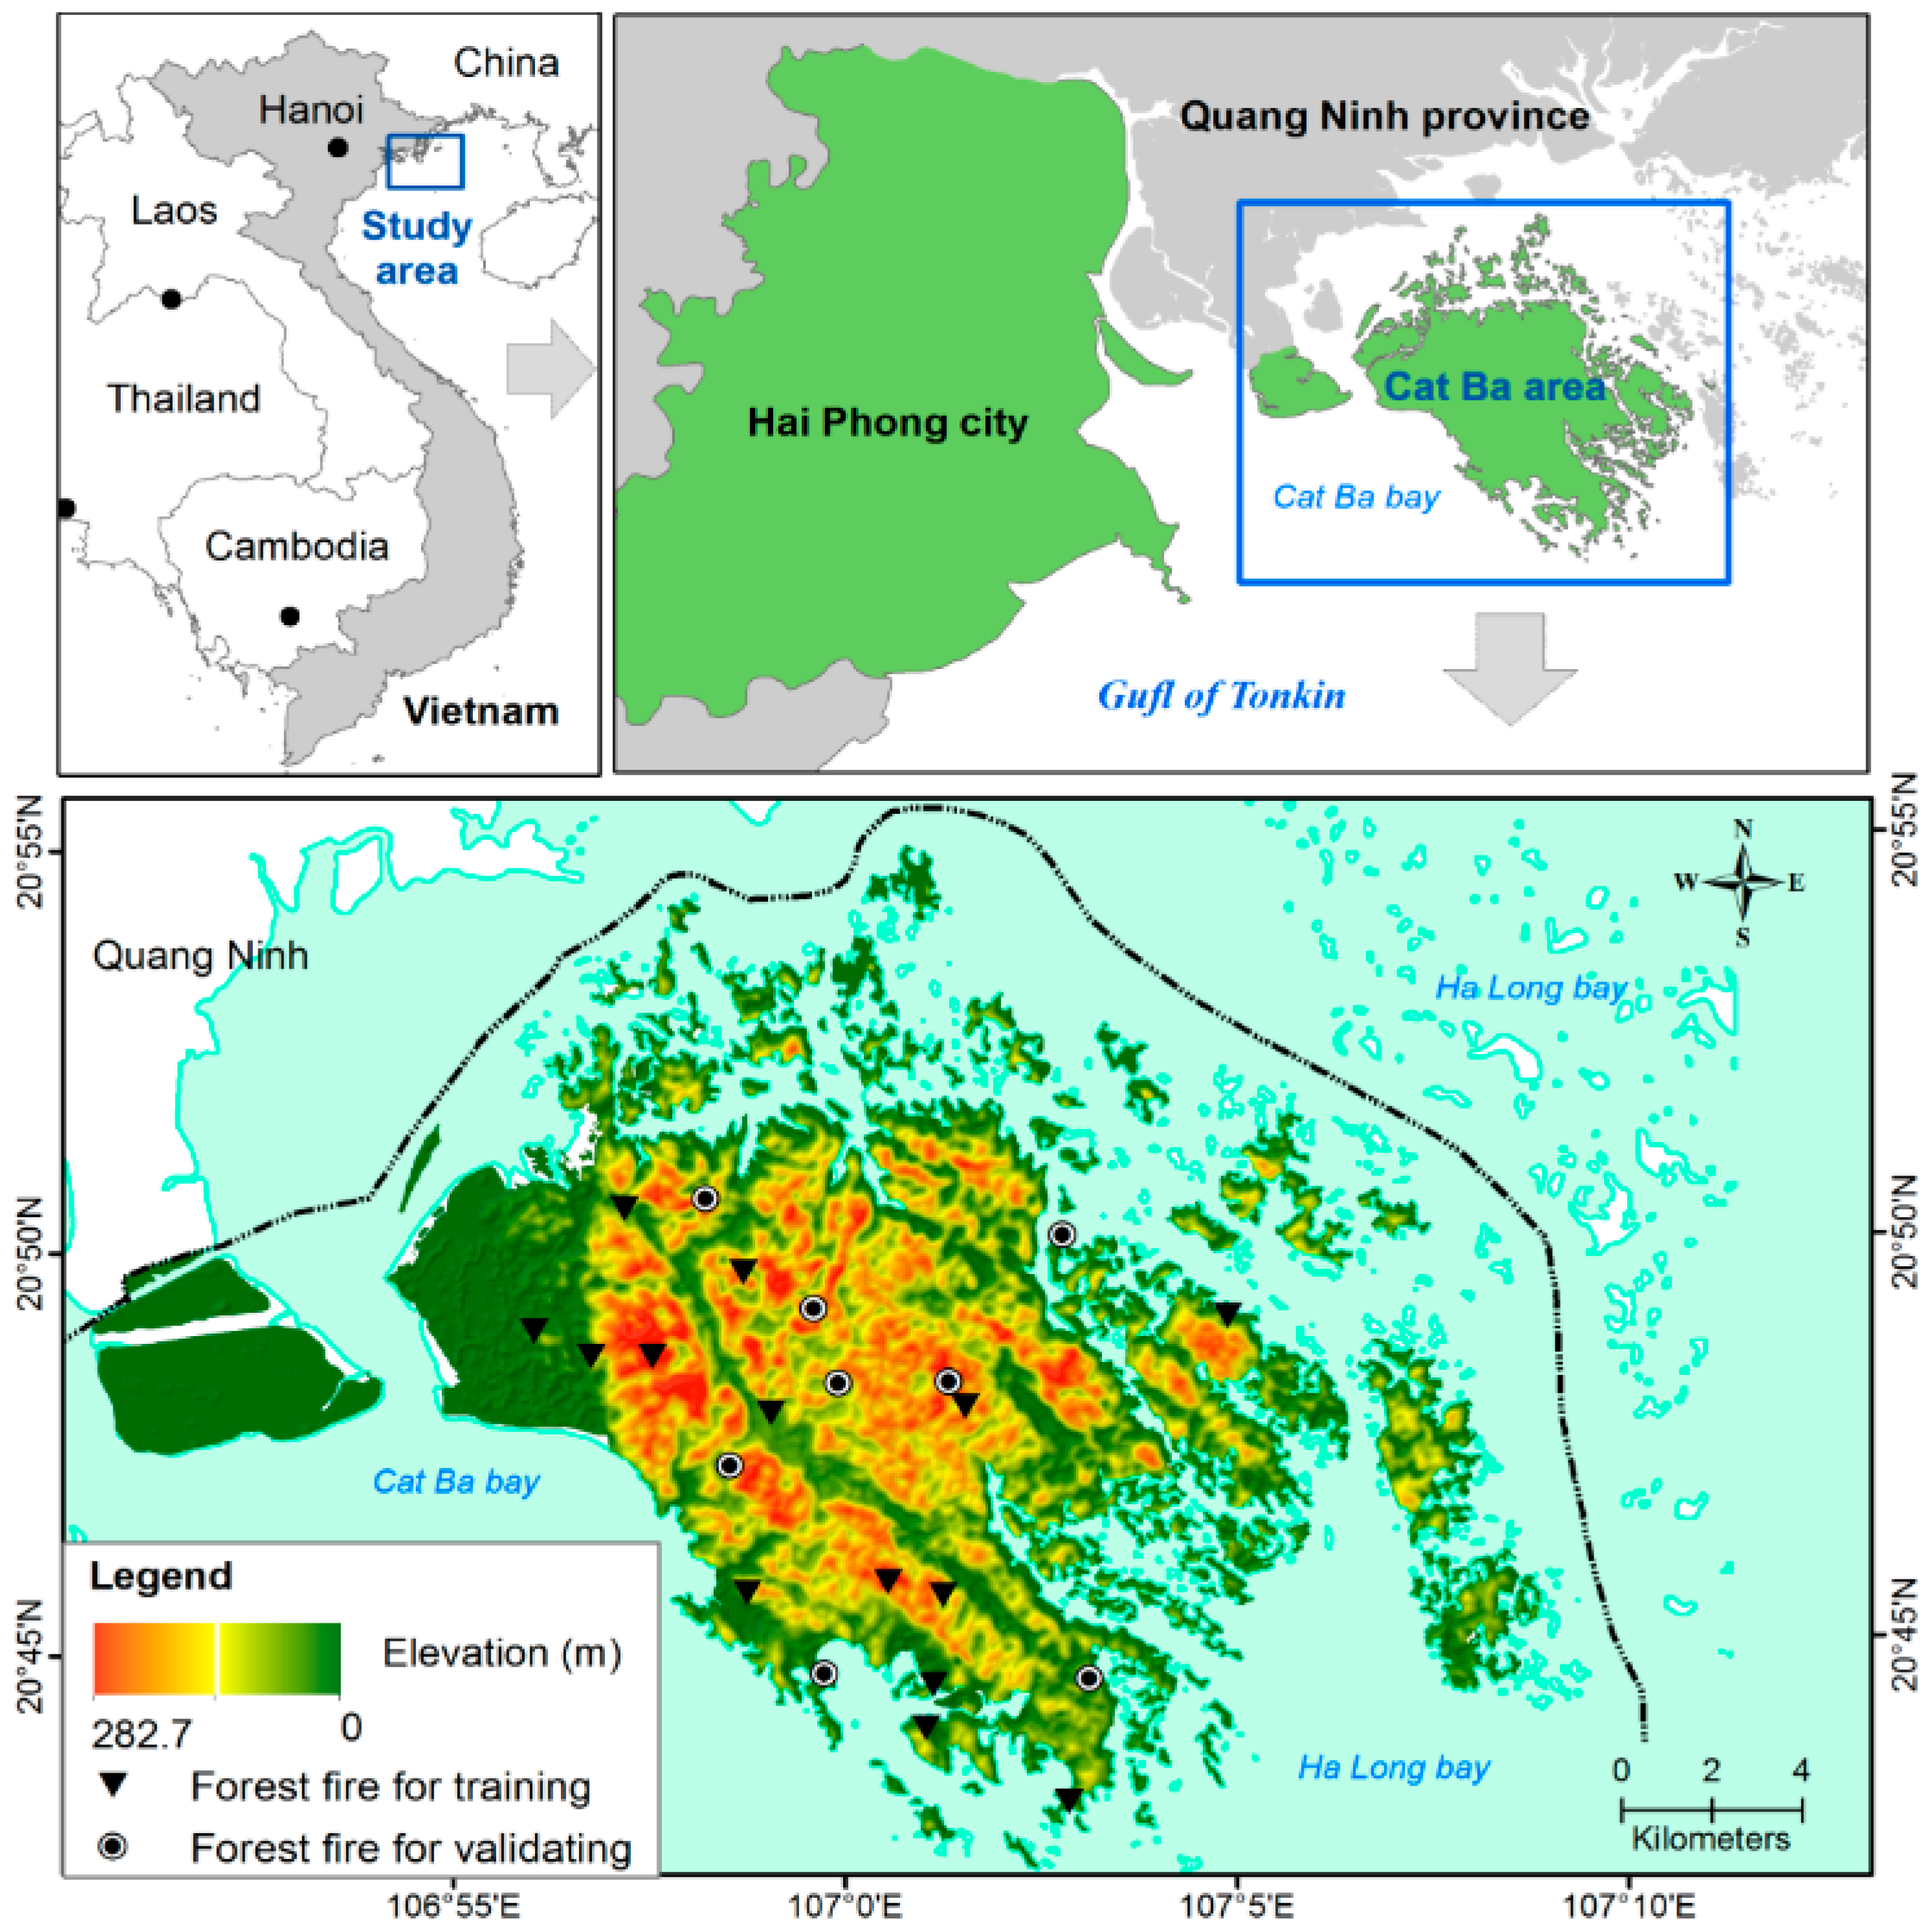
2.1. Description of the Study Area
2.2. Data Collection and Pre-Processing
2.2.1. Forest Fire Database
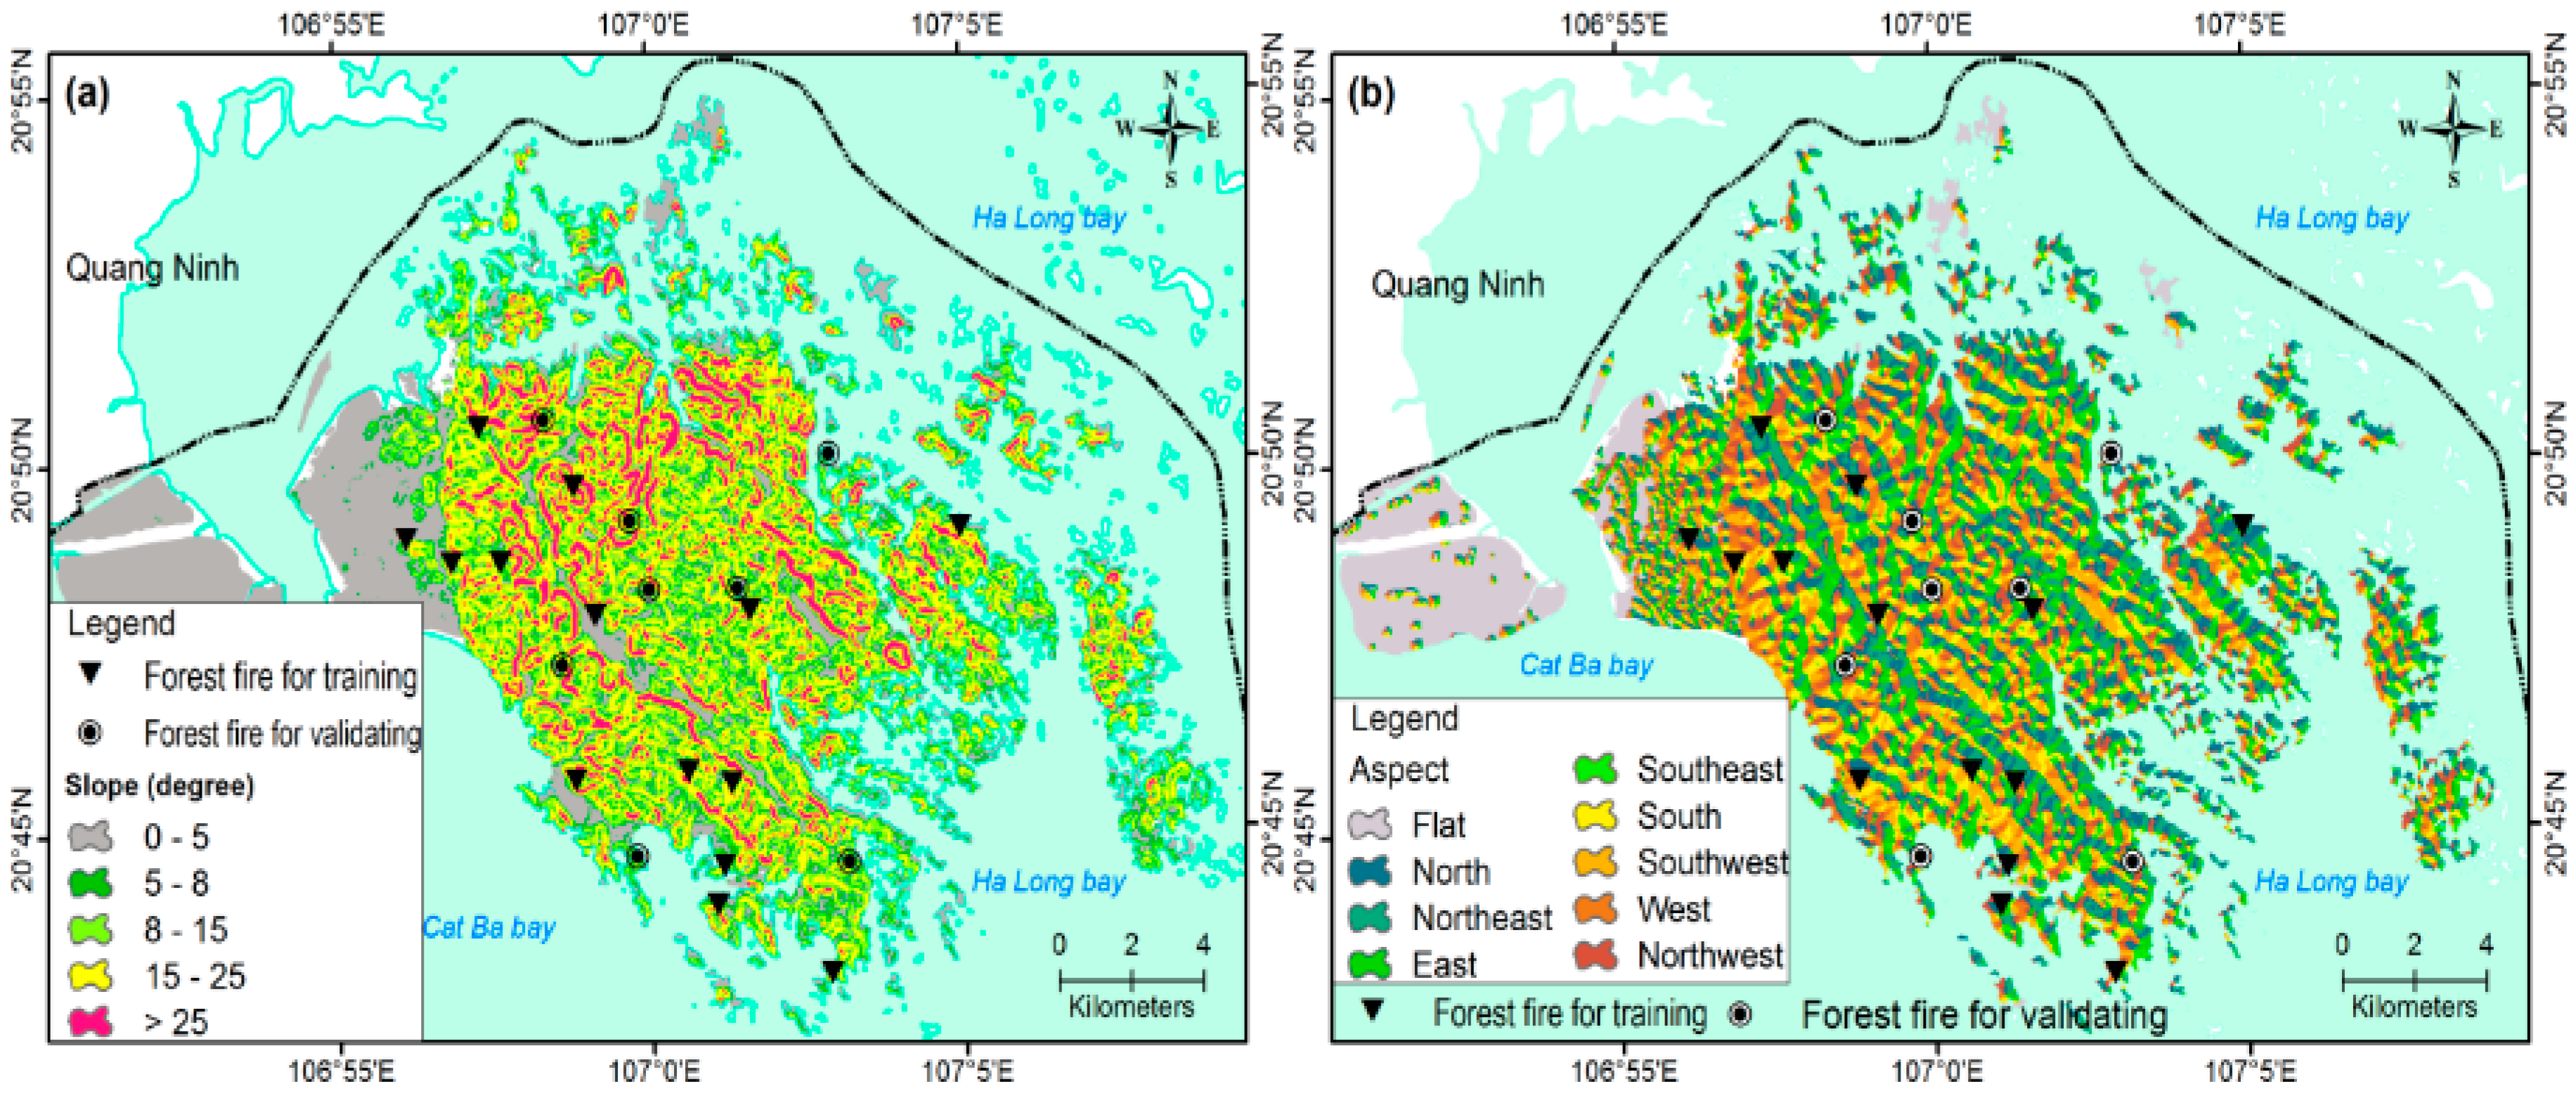
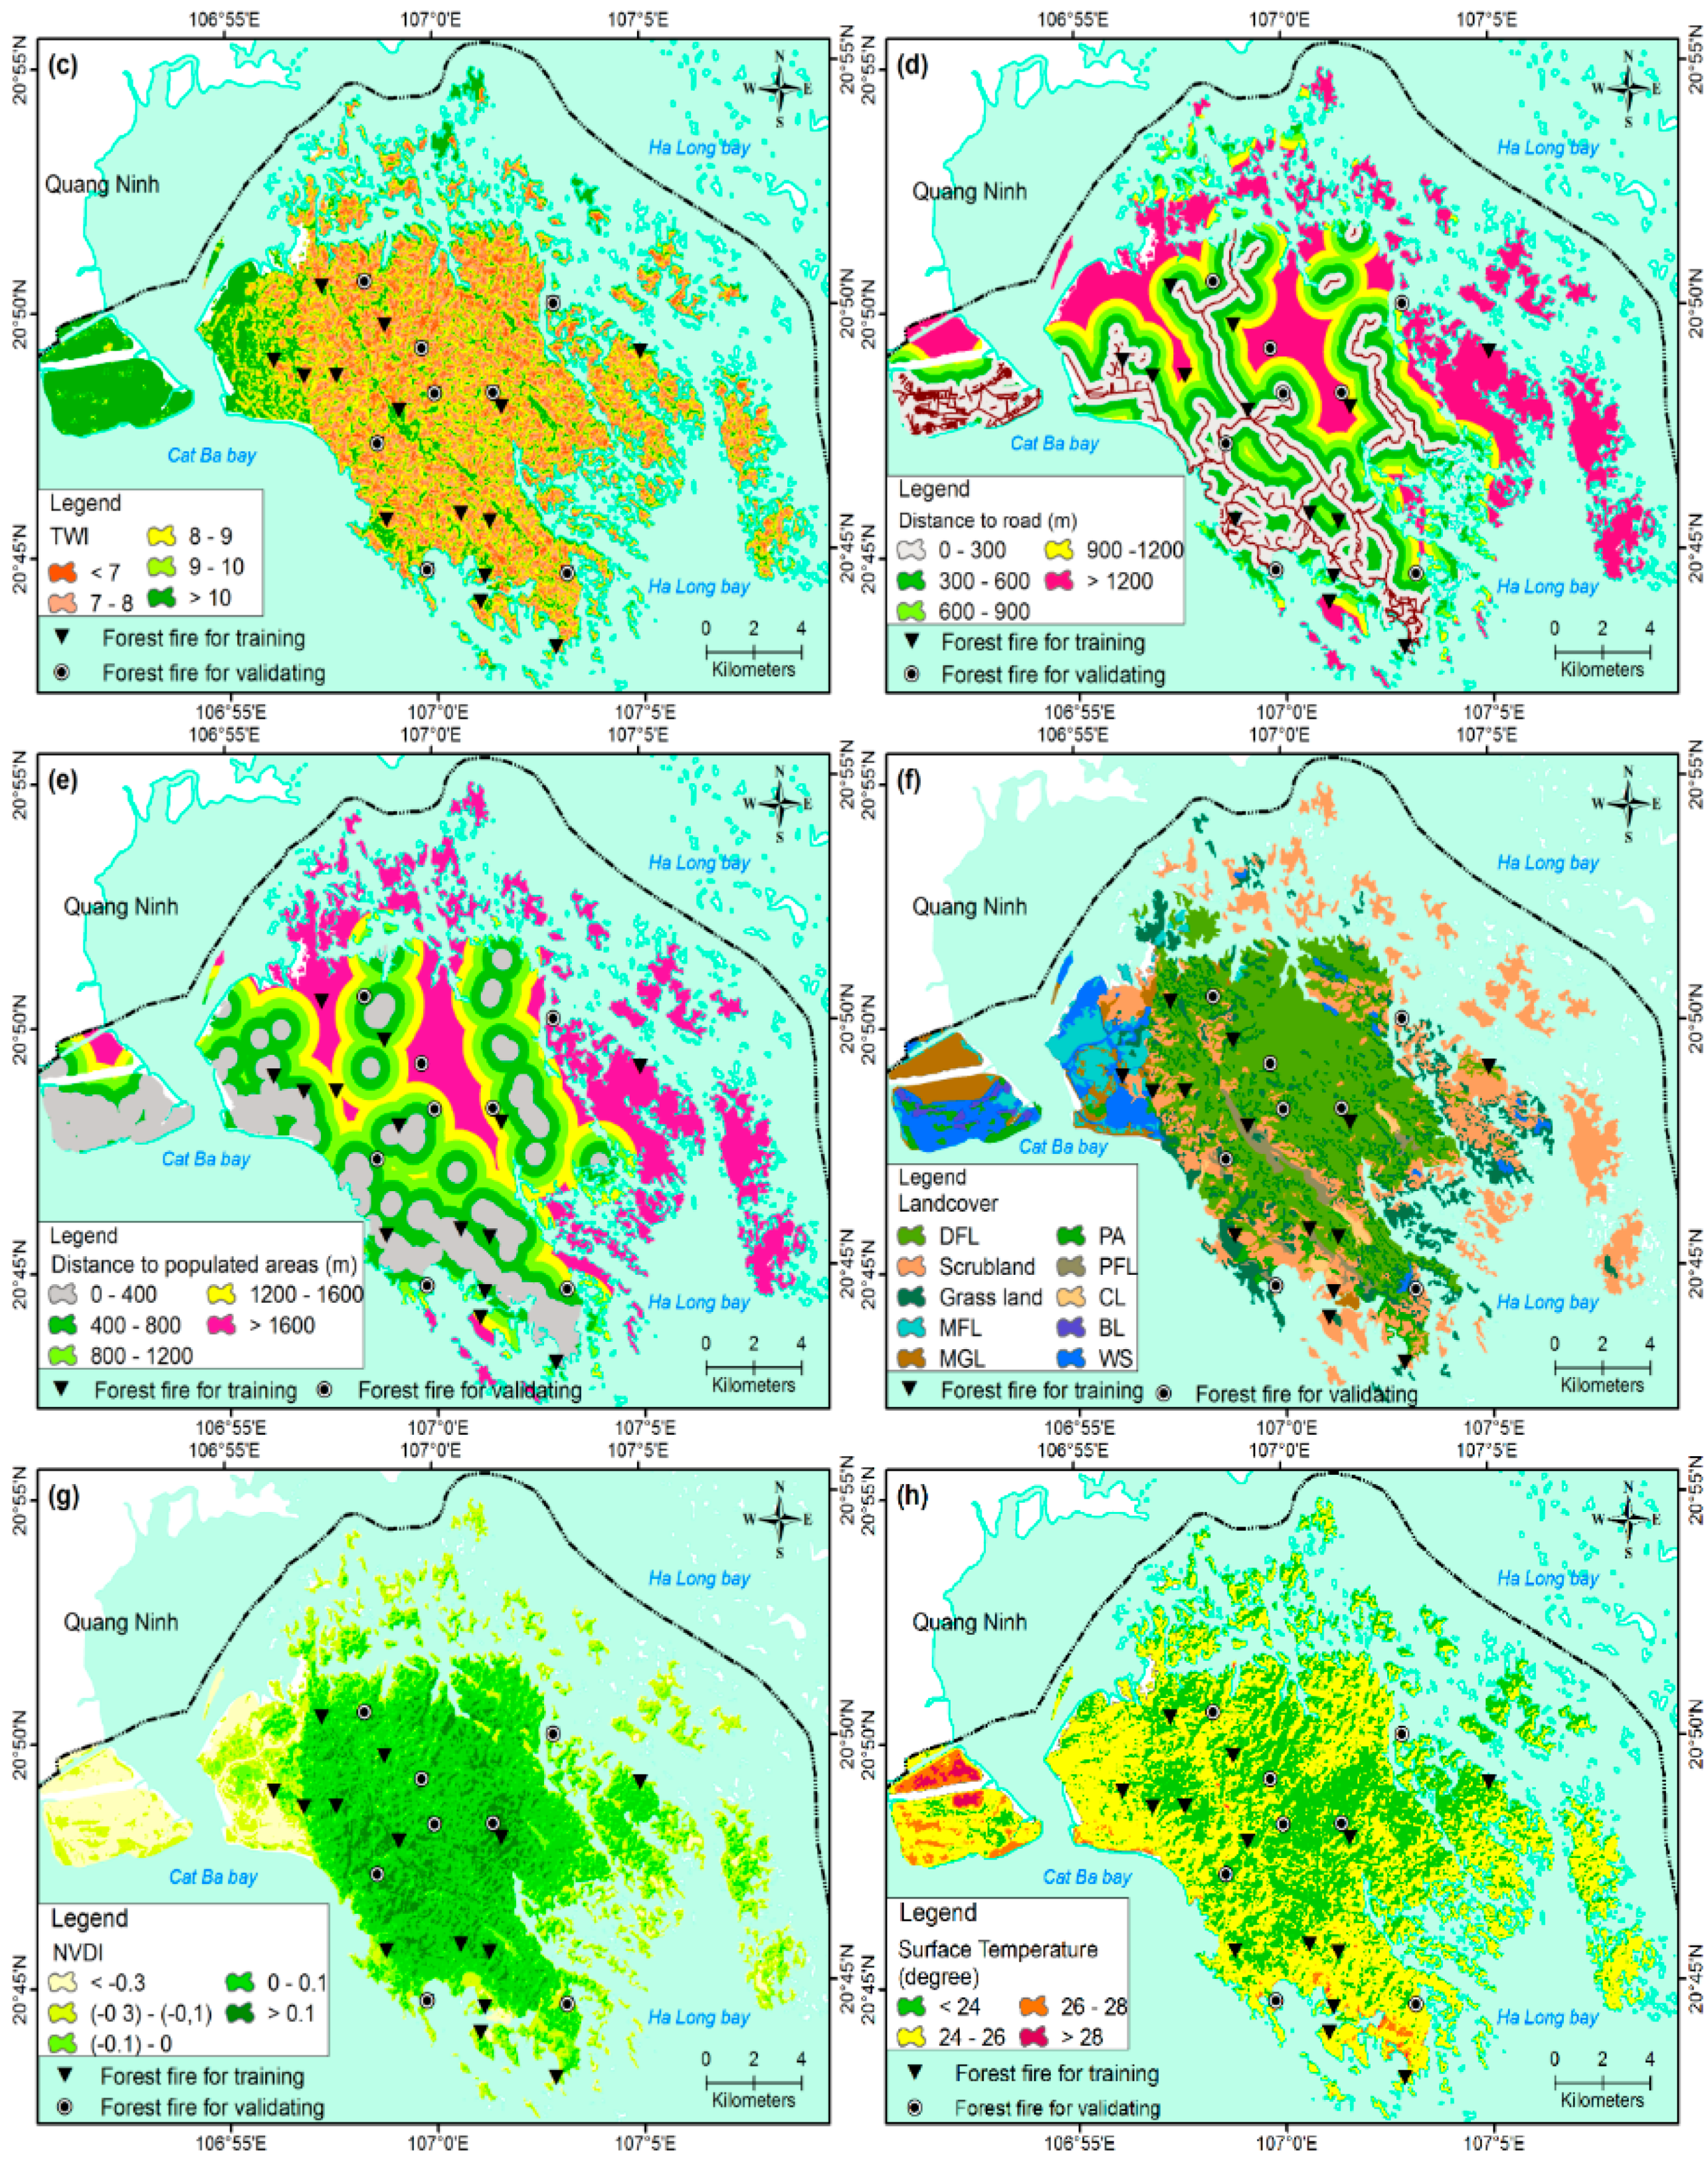
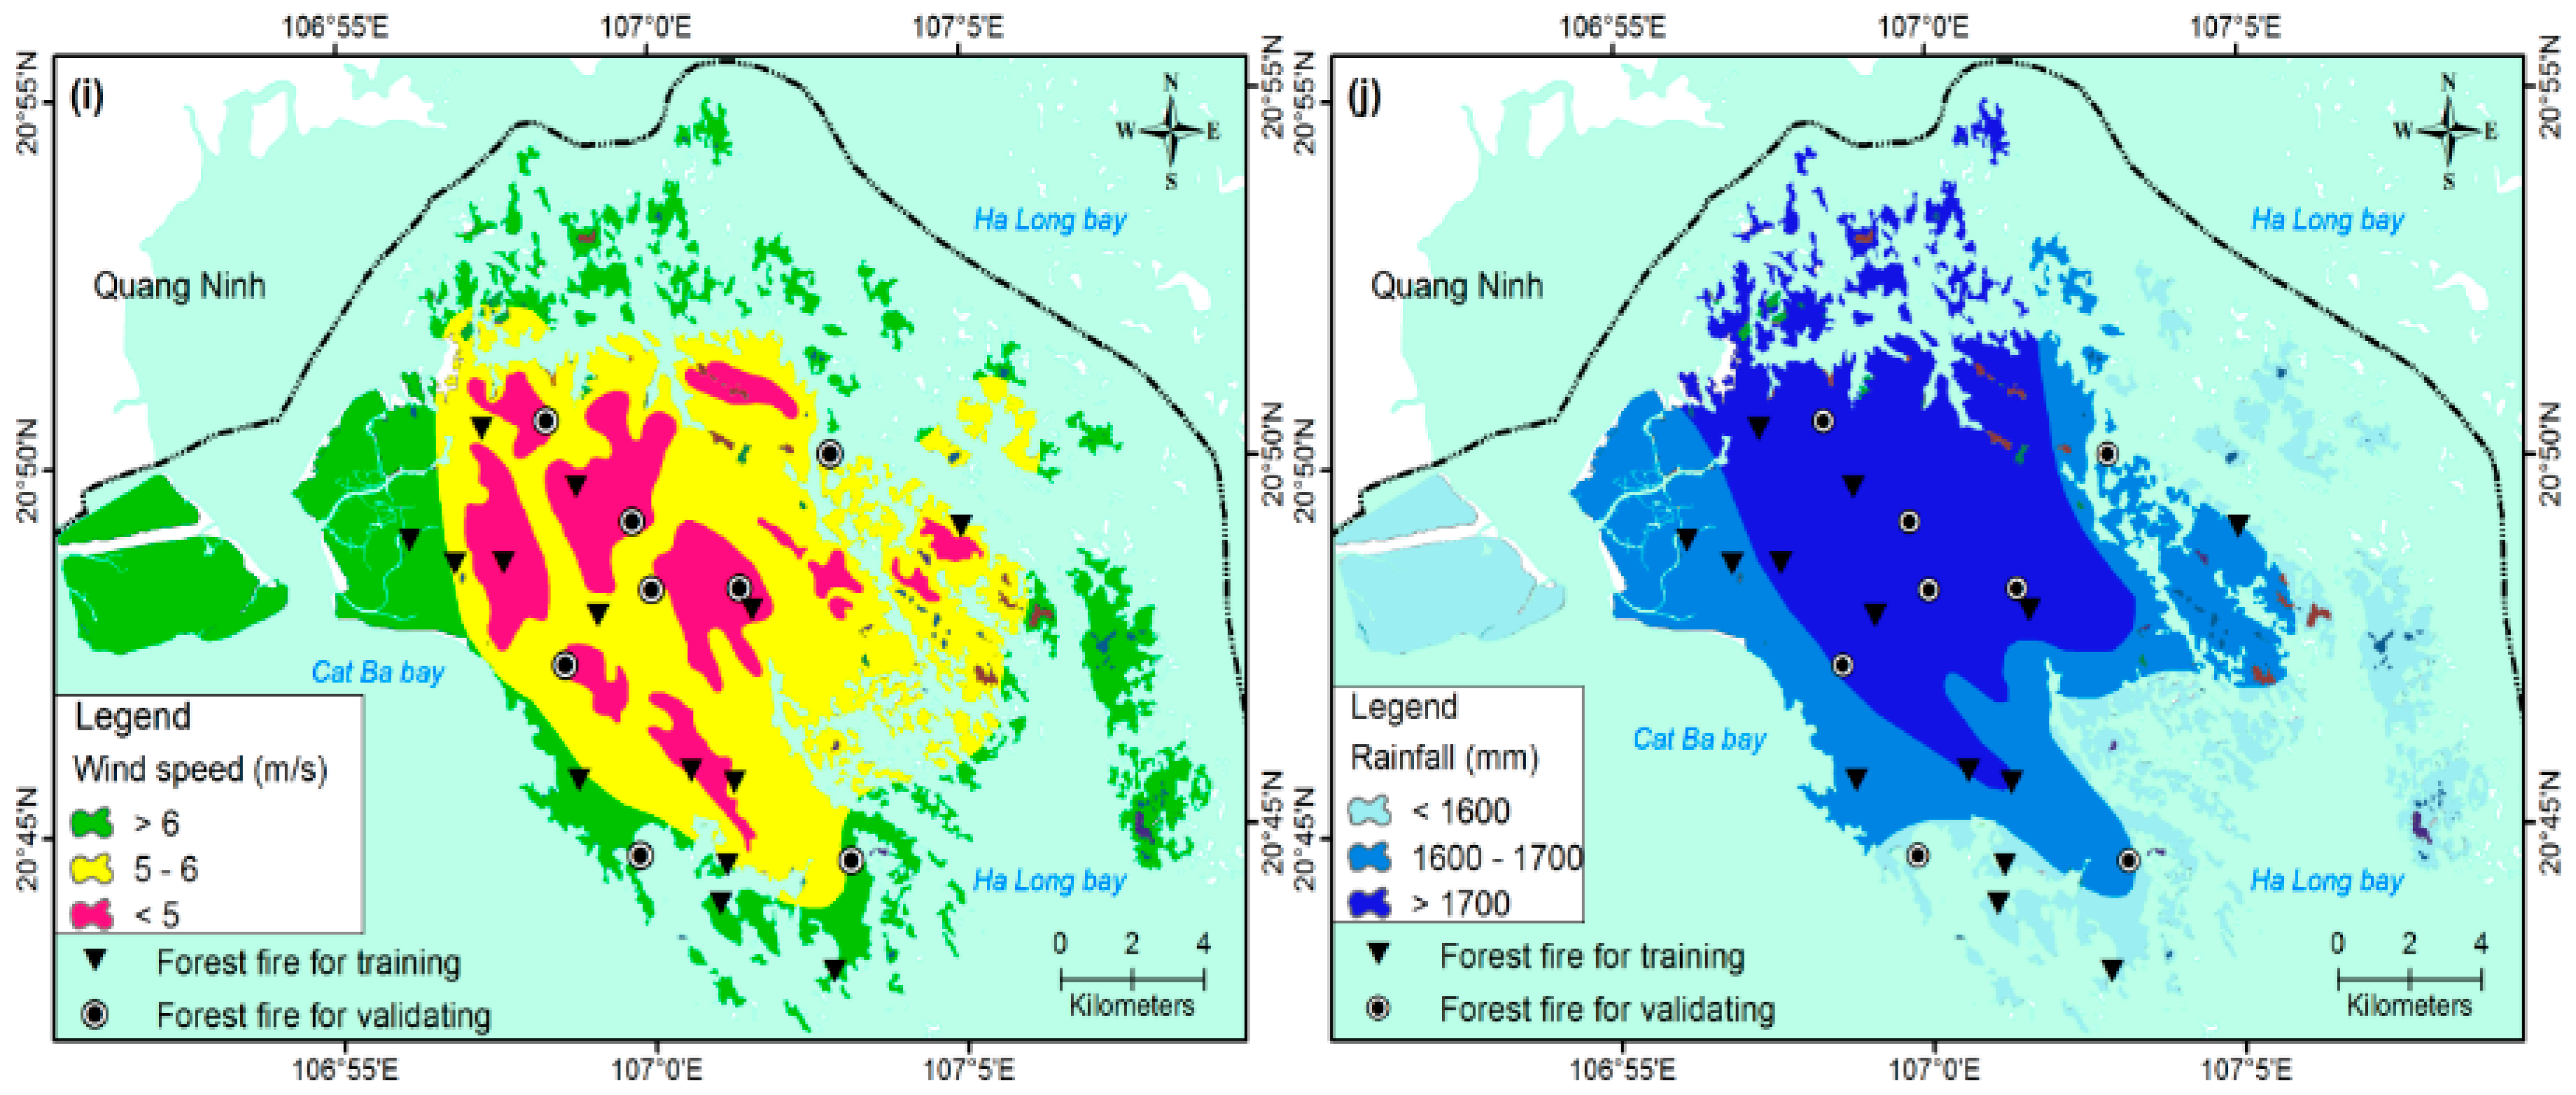
2.2.2. Fire Ignition Factors
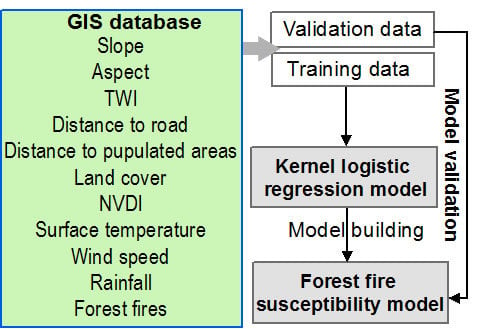
3. Methodology
3.1. Kernel Logistic Regression
3.2. Preparation of the Training and the Validation Dataset
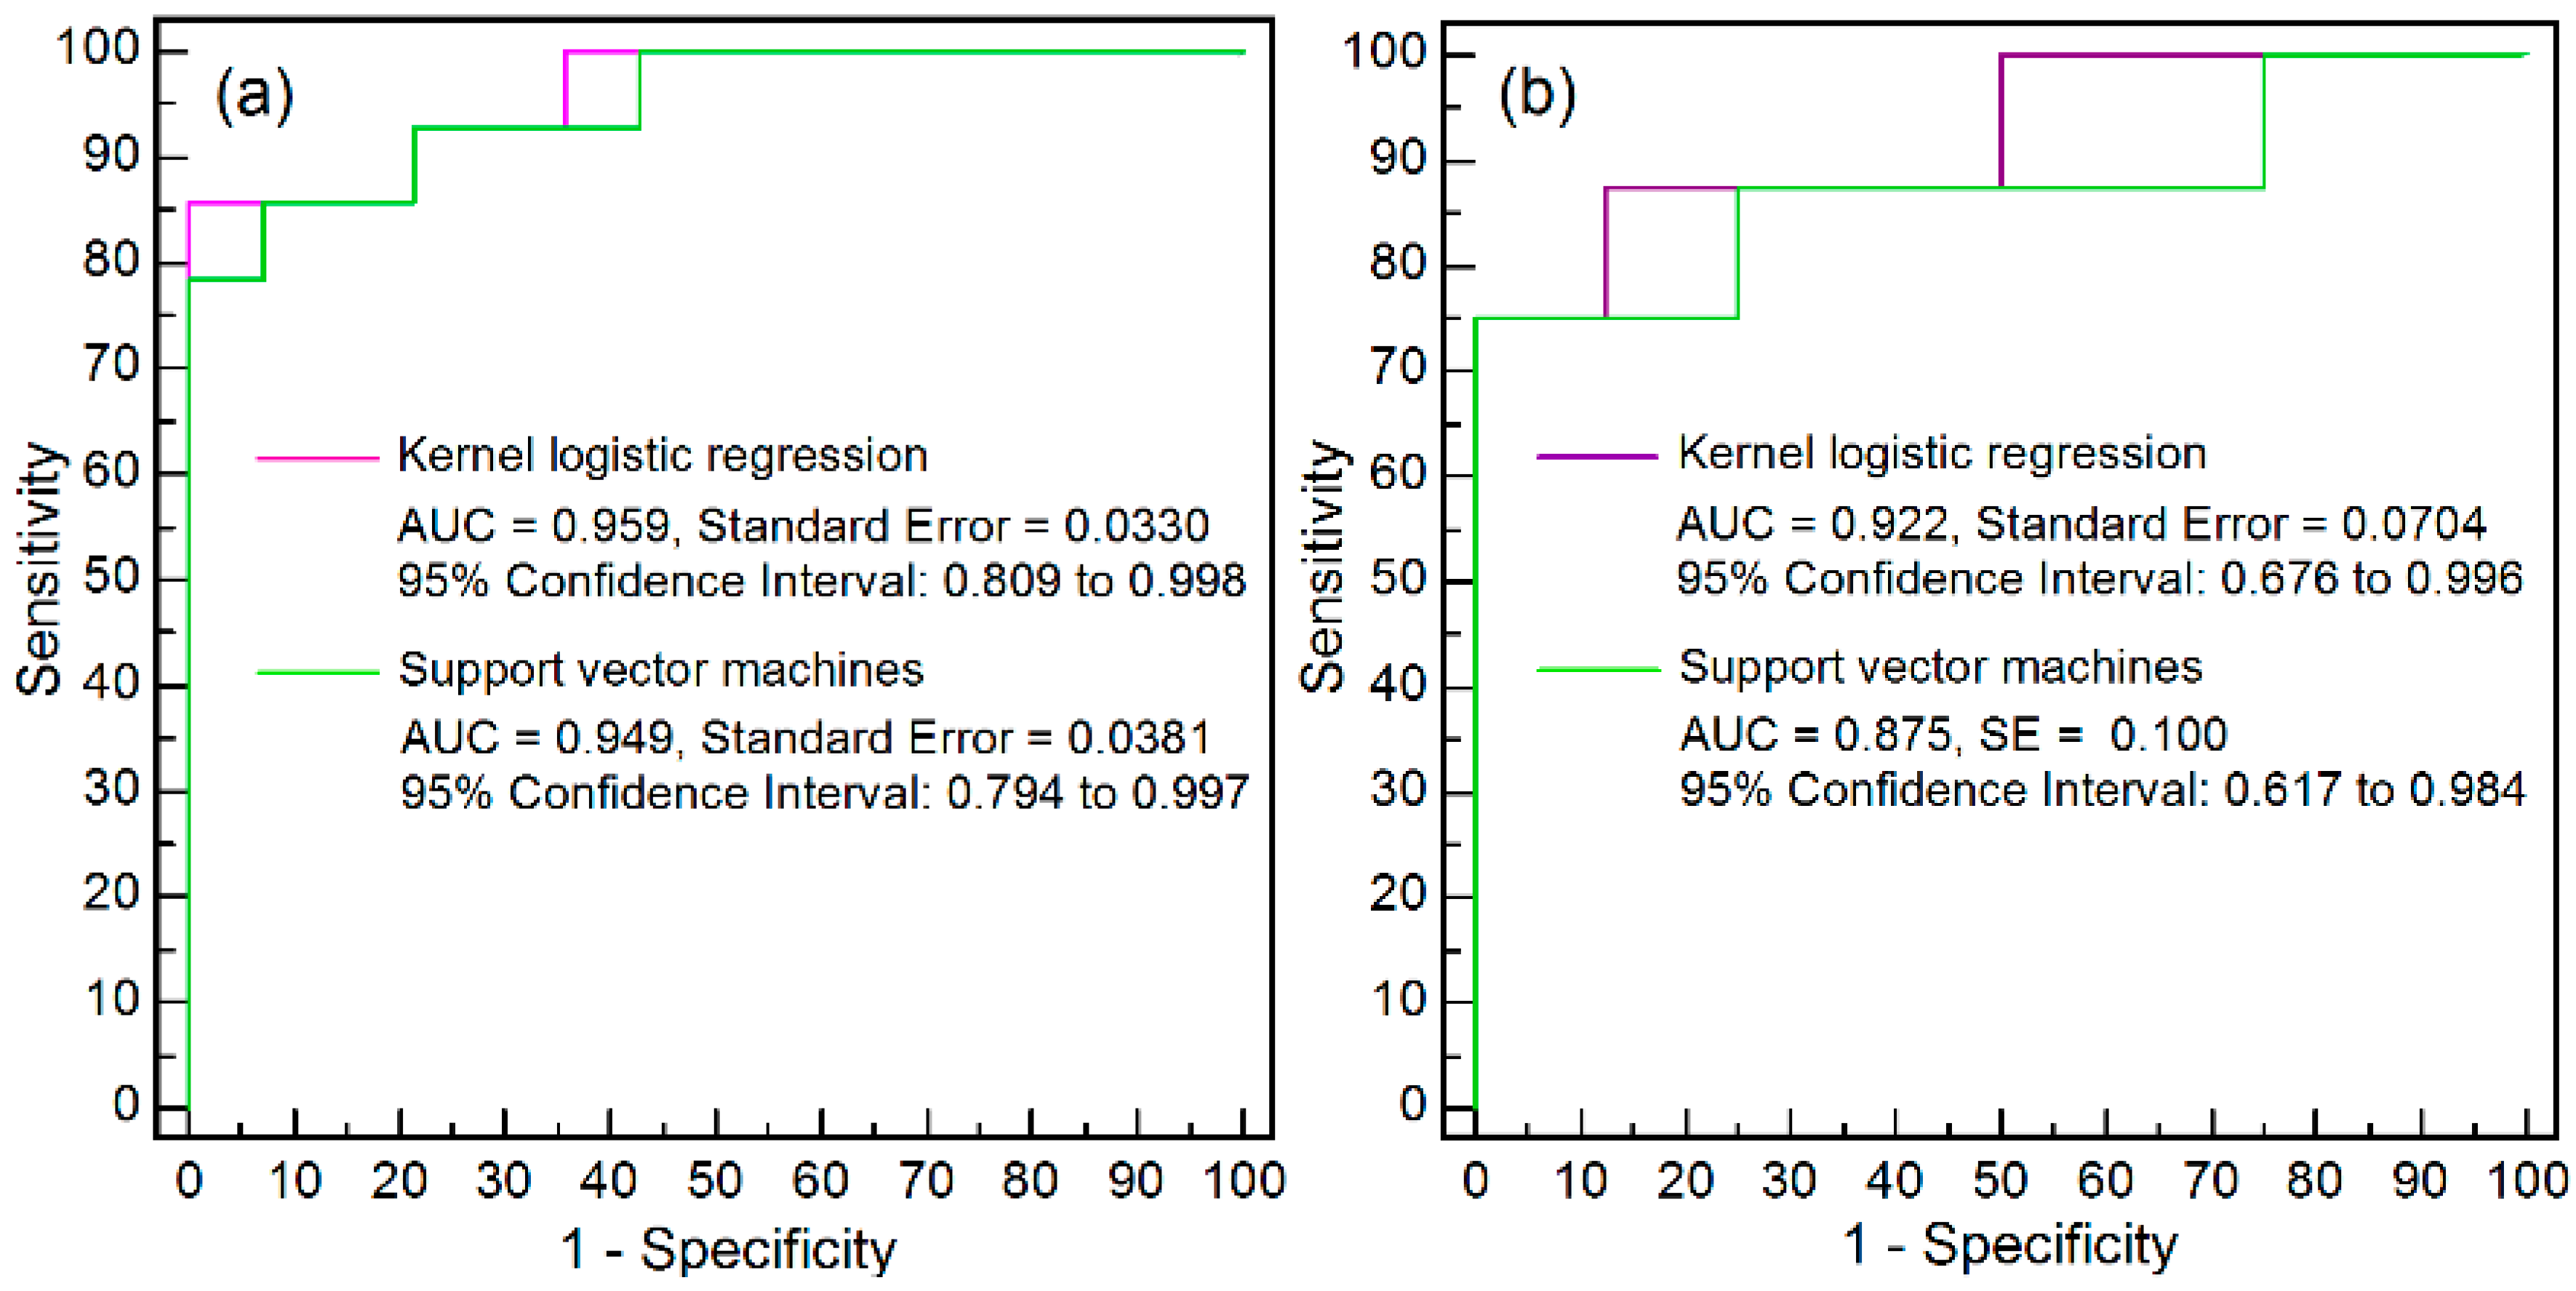
3.3. Performance Assessment
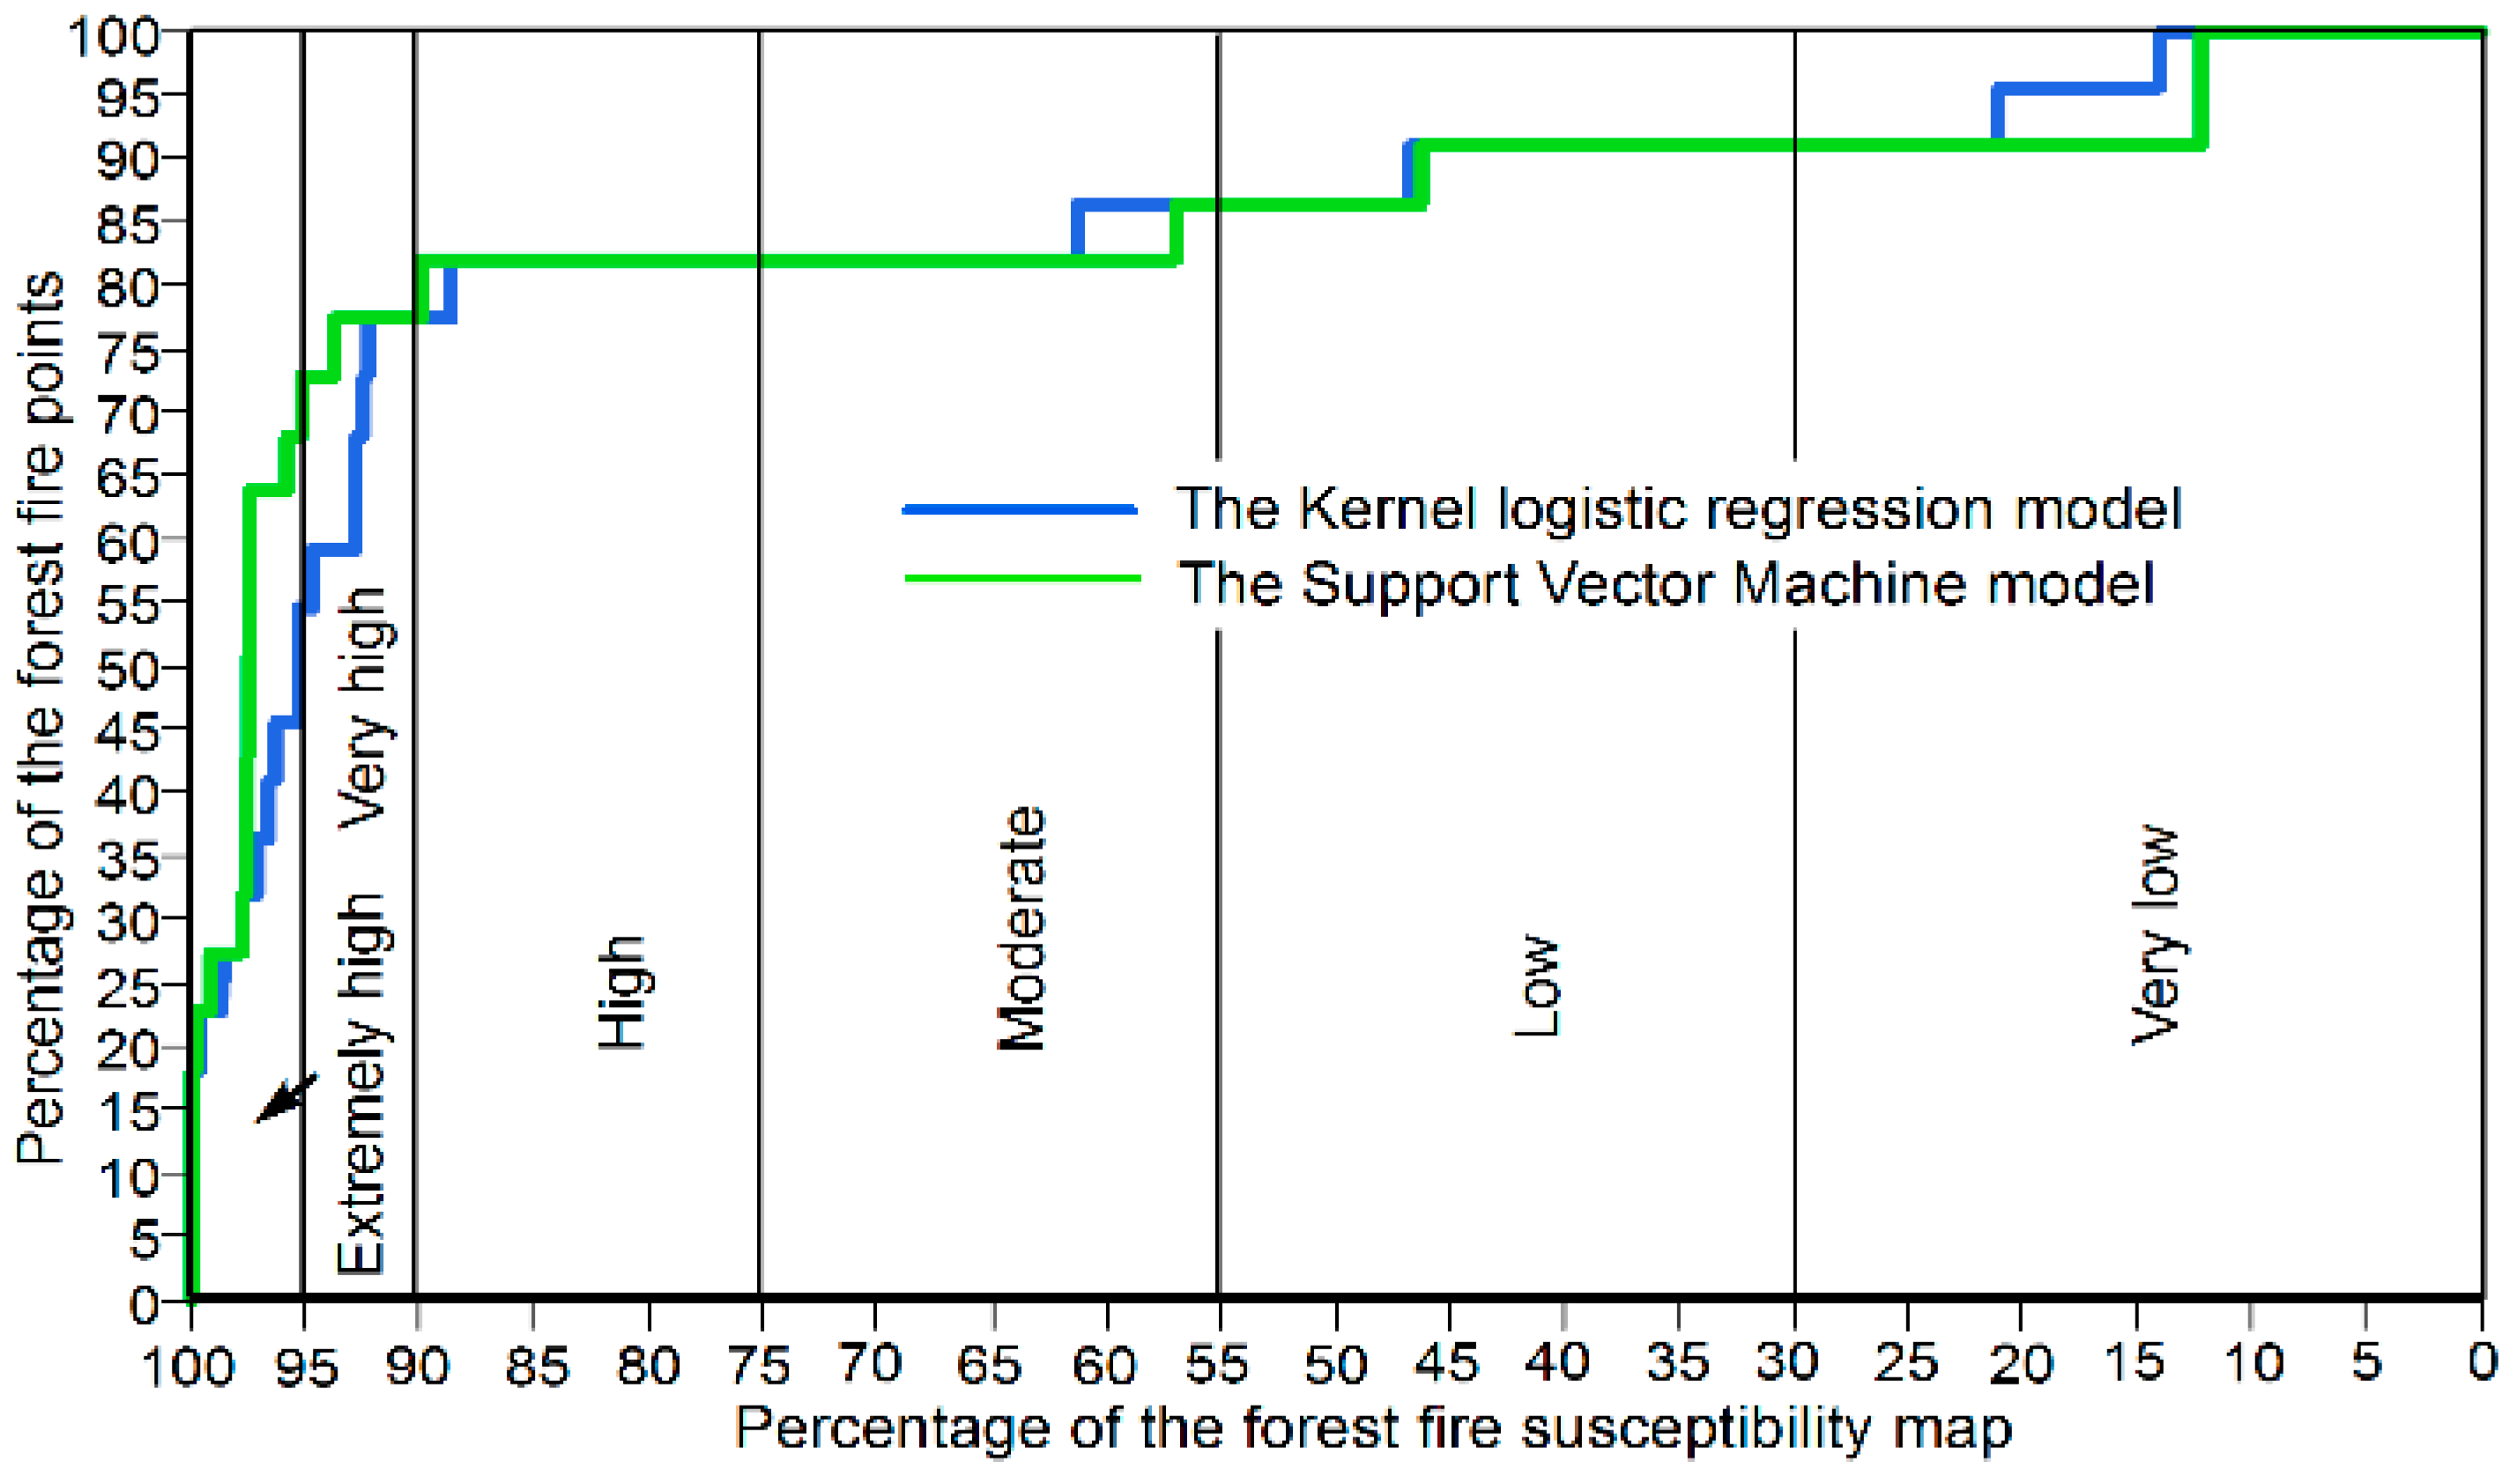
4. Results and Discussion
5. Conclusions
Acknowledgments
Author Contributions
Conflicts of Interest
References
- Dieterle, G. Sustaining the world’s forests: Managing competing demands for a vital resource—The role of the world bank. In Sustainable Forest Management in a Changing World; Springer: Medford, MA, USA, 2009; pp. 9–32. [Google Scholar]
- Köhl, M.; Lasco, R.; Cifuentes, M.; Jonsson, Ö.; Korhonen, K.T.; Mundhenk, P.; de Jesus Navar, J.; Stinson, G. Changes in forest production, biomass and carbon: Results from the 2015 un fao global forest resource assessment. For. Ecol. Manag. 2015, 352, 21–34. [Google Scholar] [CrossRef] [Green Version]
- Flannigan, M.D.; Stocks, B.J.; Wotton, B.M. Climate change and forest fires. Sci. Total Environ. 2000, 262, 221–229. [Google Scholar] [CrossRef]
- Flannigan, M.D.; Amiro, B.D.; Logan, K.A.; Stocks, B.; Wotton, B. Forest fires and climate change in the 21st century. Mitig. Adapt. Strateg. Glob. Chang. 2006, 11, 847–859. [Google Scholar] [CrossRef]
- Ha, C.T. Vietnam National Forest Status of 2012. In Annually Report of Ministry of Agriculture and Rural Development; Ministry of Agriculture and Rural Development: Hanoi, Vietnam, 2013. [Google Scholar]
- Samphantharak, K. Natural disasters and the economy: Some recent experiences from Southeast Asia. Asian-Pac. Econ. Lit. 2014, 28, 33–51. [Google Scholar] [CrossRef]
- Le, T.H.; Thanh Nguyen, T.N.; Lasko, K.; Ilavajhala, S.; Vadrevu, K.P.; Justice, C. Vegetation fires and air pollution in vietnam. Environ. Pollut. 2014, 195, 267–275. [Google Scholar] [CrossRef] [PubMed]
- Thuy, P.T.; Moeliono, M.; Hien, N.T.; Tho, N.H.; Hien, V.T. The Context of REDD+ in Vietnam: Drivers, Agents and Institutions; CIFOR Occasional Paper; CIFOR: Bogor, Indonesia, 2012. [Google Scholar]
- Asian Development Bank. Viet Nam: Environment and Climate Change Assessment; Asian Development Bank: Mandaluyong, Philippines, 2013. [Google Scholar]
- González, J.R.; Kolehmainen, O.; Pukkala, T. Using expert knowledge to model forest stand vulnerability to fire. Comput. Electron. Agric. 2007, 55, 107–114. [Google Scholar] [CrossRef]
- Jaiswal, R.K.; Mukherjee, S.; Raju, K.D.; Saxena, R. Forest fire risk zone mapping from satellite imagery and GIS. Int. J. Appl. Earth Observ. Geoinf. 2002, 4, 1–10. [Google Scholar] [CrossRef]
- Oliveira, S.; Oehler, F.; San-Miguel-Ayanz, J.; Camia, A.; Pereira, J.M.C. Modeling spatial patterns of fire occurrence in mediterranean Europe using multiple regression and random forest. For. Ecol. Manag. 2012, 275, 117–129. [Google Scholar] [CrossRef]
- Koutsias, N.; Martínez-Fernández, J.; Allgöwer, B. Do factors causing wildfires vary in space? Evidence from geographically weighted regression. GISci. Remote Sens. 2010, 47, 221–240. [Google Scholar] [CrossRef]
- Guo, F.; Su, Z.; Wang, G.; Sun, L.; Lin, F.; Liu, A. Wildfire ignition in the forests of southeast china: Identifying drivers and spatial distribution to predict wildfire likelihood. Appl. Geogr. 2016, 66, 12–21. [Google Scholar] [CrossRef]
- Pourghasemi, H.R. GIS-based forest fire susceptibility mapping in Iran: A comparison between evidential belief function and binary logistic regression models. Scand. J. For. Res. 2015, 31, 80–98. [Google Scholar] [CrossRef]
- Eastaugh, C.S.; Hasenauer, H. Deriving forest fire ignition risk with biogeochemical process modelling. Environ. Modell. Softw. 2014, 55, 132–142. [Google Scholar] [CrossRef] [PubMed]
- Pourtaghi, Z.; Pourghasemi, H.; Rossi, M. Forest fire susceptibility mapping in the minudasht forests, golestan province, Iran. Environ. Earth Sci. 2015, 73, 1515–1533. [Google Scholar] [CrossRef]
- Massada, A.B.; Syphard, A.D.; Stewart, S.I.; Radeloff, V.C. Wildfire ignition-distribution modelling: A comparative study in the huron–manistee national forest, Michigan, USA. Int. J. Wildland Fire 2013, 22, 174–183. [Google Scholar] [CrossRef]
- Le Viet, T.; Choisy, M.; Bryant, J.; Vu Trong, D.; Pham Quang, T.; Horby, P.; Nguyen Tran, H.; Tran Thi Kieu, H.; Nguyen Vu, T.; Van Nguyen, K.; et al. A dengue outbreak on a floating village at Cat Ba island in vietnam. BMC Public Health 2015, 15, 1–8. [Google Scholar] [CrossRef] [PubMed] [Green Version]
- Nguyen, N.C.; Bosch, O.J.H. A systems thinking approach to identify leverage points for sustainability: A case study in the Cat Ba biosphere reserve, Vietnam. Syst. Res. Behav. Sci. 2013, 30, 104–115. [Google Scholar] [CrossRef]
- Zingerli, C. Colliding understandings of biodiversity conservation in Vietnam: Global claims, national interests, and local struggles. Soc. Nat. Resour. 2005, 18, 733–747. [Google Scholar] [CrossRef]
- Thung, D.C. Distinctive features of the property of Cat Ba archipelago, Vietnam. J. Earth Sci. Eng. 2014, 4, 271–283. [Google Scholar]
- Van, Q.N.; Duc, T.T.; Van, H.D. Landscapes and ecosystems of tropical limestone: Case study of the Cat Ba islands, Vietnam. J. Ecol. Environ. 2010, 33, 23–36. [Google Scholar] [CrossRef]
- Schmidt-Thome, P.; Nguyen, T.H.; Pham, T.L.; Jarva, J.; Nuottimäki, K. Climate change in Vietnam. In Climate Change Adaptation Measures in Vietnam; Springer: Medford, MA, USA, 2015; pp. 7–15. [Google Scholar]
- Nguyen, Q.-T. Extreme climatic events over Vietnam from observational data and RegCM3 projections. Clim. Res. 2011, 49, 87–100. [Google Scholar]
- Massada, A.B.; Syphard, A.D.; Hawbaker, T.J.; Stewart, S.I.; Radeloff, V.C. Effects of ignition location models on the burn patterns of simulated wildfires. Environ. Model. Softw. 2011, 26, 583–592. [Google Scholar] [CrossRef]
- Ministry of Agriculture and Rural Development of Vietnam. The Vietnam’s Firewatch System for Online Monitoring and Management of Forest Fires. Available online: http://www.Kiemlam.Org.Vn/firewatchvn (accessed on 12 April 2016).
- Giglio, L.; Descloitres, J.; Justice, C.O.; Kaufman, Y.J. An enhanced contextual fire detection algorithm for MODIS. Remote Sens. Environ. 2003, 87, 273–282. [Google Scholar] [CrossRef]
- Cosslett, T.L.; Cosslett, P.D. Water Resources and Food Security in the Vietnam Mekong Delta; Springer: Medford, MA, USA, 2014. [Google Scholar]
- Cary, G.J.; Flannigan, M.D.; Keane, R.E.; Bradstock, R.A.; Davies, I.D.; Lenihan, J.M.; Li, C.; Logan, K.A.; Parsons, R.A. Relative importance of fuel management, ignition management and weather for area burned: Evidence from five landscape–fire–succession models. Int. J. Wildland Fire 2009, 18, 147–156. [Google Scholar] [CrossRef]
- Oliveira, S.; Pereira, J.M.; San-Miguel-Ayanz, J.; Lourenço, L. Exploring the spatial patterns of fire density in southern Europe using geographically weighted regression. Appl. Geogr. 2014, 51, 143–157. [Google Scholar] [CrossRef]
- Vasilakos, C.; Kalabokidis, K.; Hatzopoulos, J.; Matsinos, I. Identifying wildland fire ignition factors through sensitivity analysis of a neural network. Nat. Hazards 2009, 50, 125–143. [Google Scholar] [CrossRef]
- Conedera, M.; Peter, L.; Marxer, P.; Forster, F.; Rickenmann, D.; Re, L. Consequences of forest fires on the hydrogeological response of mountain catchments: A case study of the riale buffaga, Ticino, Switzerland. Earth Surf. Process. Landf. 2003, 28, 117–129. [Google Scholar] [CrossRef]
- United States Geological Survey. The United States Geological Survey Earth Resources Observation and Science Center. Available online: http://earthexplorer.Usgs.Gov (accessed on 12 April 2016).
- Sánchez, J.M.; Bisquert, M.; Rubio, E.; Caselles, V. Impact of land cover change induced by a fire event on the surface energy fluxes derived from remote sensing. Remote Sens. 2015, 7, 14899–14915. [Google Scholar] [CrossRef]
- Jiménez-Muñoz, J.C.; Cristóbal, J.; Sobrino, J.; Soria, G.; Ninyerola, M.; Pons, X. Revision of the single-channel algorithm for land surface temperature retrieval from Landsat thermal-infrared data. IEEE Trans. Geosci. Remote Sens. 2009, 47, 339–349. [Google Scholar] [CrossRef]
- Brabyn, L.; Zawar-Reza, P.; Stichbury, G.; Cary, C.; Storey, B.; Laughlin, D.C.; Katurji, M. Accuracy assessment of land surface temperature retrievals from Landsat 7 ETM+ in the Dry Valleys of Antarctica using iButton temperature loggers and weather station data. Environ. Monit. Assess. 2014, 186, 2619–2628. [Google Scholar] [CrossRef] [PubMed]
- Walawender, J.P.; Szymanowski, M.; Hajto, M.J.; Bokwa, A. Land surface temperature patterns in the urban agglomeration of Krakow (Poland) derived from Landsat-7/ETM+ data. Pure Appl. Geophys. 2014, 171, 913–940. [Google Scholar] [CrossRef]
- Viney, N.R. A review of fine fuel moisture modelling. Int. J. Wildland Fire 1991, 1, 215–234. [Google Scholar] [CrossRef]
- Witten, I.H.; Frank, E.; Mark, A.H. Data Mining: Practical Machine Learning Tools and Techniques, 3rd ed.; Morgan Kaufmann: Burlington, VT, USA, 2011. [Google Scholar]
- Tien Bui, D.; Tuan, T.A.; Klempe, H.; Pradhan, B.; Revhaug, I. Spatial prediction models for shallow landslide hazards: A comparative assessment of the efficacy of support vector machines, artificial neural networks, kernel logistic regression, and logistic model tree. Landslides 2015. [Google Scholar] [CrossRef]
- Hong, H.; Pradhan, B.; Xu, C.; Tien Bui, D. Spatial prediction of landslide hazard at the Yihuang Area (China) using two-class kernel logistic regression, alternating decision tree and support vector machines. CATENA 2015, 133, 266–281. [Google Scholar] [CrossRef]
- Tien Bui, D.; Pradhan, B.; Lofman, O.; Revhaug, I.; Dick, O.B. Landslide susceptibility mapping at Hoa Binh Province (Vietnam) using an adaptive neuro-fuzzy inference system and GIS. Comput. Geosci. 2012, 45, 199–211. [Google Scholar] [CrossRef]
- Fawcett, T. An introduction to ROC analysis. Pattern Recognit. Lett. 2006, 27, 861–874. [Google Scholar] [CrossRef]
- Martínez-Álvarez, F.; Reyes, J.; Morales-Esteban, A.; Rubio-Escudero, C. Determining the best set of seismicity indicators to predict earthquakes. Two case studies: Chile and the Iberian Peninsula. Knowl.-Based Syst. 2013, 50, 198–210. [Google Scholar] [CrossRef]
- Tien Bui, D.; Pradhan, B.; Lofman, O.; Revhaug, I. Landslide susceptibility assessment in Vietnam using support vector machines, decision tree and Naïve Bayes models. Math. Probl. Eng. 2012, 2012, 1–26. [Google Scholar] [CrossRef]
- Hong, H.; Pradhan, B.; Jebur, M.; Bui, D.; Xu, C.; Akgun, A. Spatial prediction of landslide hazard at the Luxi Area (China) using support vector machines. Environ. Earth Sci. 2015, 75, 1–14. [Google Scholar] [CrossRef]
- Tien Bui, D.; Pradhan, B.; Lofman, O.; Revhaug, I.; Dick, O.B. Application of support vector machines in landslide susceptibility assessment for the Hoa Binh Province (Vietnam) with kernel functions analysis. In Proceedings of the iEMSs Sixth Biennial Meeting: International Congress on Environmental Modelling and Software (iEMSs 2012), Leipzig, Germany, 1–5 July 2012.
- Tien Bui, D.; Anh Tuan, T.; Hoang, N.-D.; Quoc Thanh, N.; Nguyen, B.D.; Van Liem, N.; Pradhan, B. Spatial prediction of rainfall-induced landslides for the Lao Cai area (Vietnam) using a novel hybrid intelligent approach of least squares support vector machines inference model and artificial bee colony optimization. Landslides 2016. [Google Scholar] [CrossRef]
- Hoang, N.-D.; Tien Bui, D. A novel relevance vector machine classifier with cuckoo search optimization for spatial prediction of landslides. J. Comput. Civ. Eng. 2016. [Google Scholar] [CrossRef]
- Were, K.; Tien Bui, D.; Dick, Ø.B.; Singh, B.R. A comparative assessment of support vector regression, artificial neural networks, and random forests for predicting and mapping soil organic carbon stocks across an afromontane landscape. Ecol. Indic. 2015, 52, 394–403. [Google Scholar] [CrossRef]
- Chung, C.J.F.; Fabbri, A.G.; Van Westen, C.J. Multivariate regression analysis for landslide hazard zonation. In Geographical Information Systems in Assessing Natural Hazards; Carrara, A., Guzzetti, F., Eds.; Springer: New York, NY, USA, 1995; Volume 5, pp. 107–133. [Google Scholar]
- Tien Bui, D.; Pradhan, B.; Lofman, O.; Revhaug, I.; Dick, O.B. Spatial prediction of landslide hazards in Hoa Binh Province (Vietnam): A comparative assessment of the efficacy of evidential belief functions and fuzzy logic models. Catena 2012, 96, 28–40. [Google Scholar] [CrossRef]
- Tien Bui, D.; Pham, T.B.; Nguyen, Q.-P.; Hoang, N.-D. Spatial prediction of rainfall-induced shallow landslides using hybrid integration approach of least squares support vector machines and differential evolution optimization: A case study in central Vietnam. Int. J. Digit. Earth 2016. [Google Scholar] [CrossRef]
- Tien Bui, D.; Nguyen, Q.-P.; Hoang, N.-D.; Klempe, H. A novel fuzzy k-nearest neighbor inference model with differential evolution for spatial prediction of rainfall-induced shallow landslides in a tropical hilly area using GIS. Landslides 2016. [Google Scholar] [CrossRef]
- Tien Bui, D.; Pradhan, B.; Revhaug, I.; Trung Tran, C. A comparative assessment between the application of fuzzy unordered rules induction algorithm and j48 decision tree models in spatial prediction of shallow landslides at Lang son city, Vietnam. In Remote Sensing Applications in Environmental Research; Springer International Publishing: Cham, Switzerland, 2014; pp. 87–111. [Google Scholar]


| No. | Forest Fire Related Factor | Predictive Power Value |
|---|---|---|
| 1 | NVDI (Normalized Difference Vegetation Index) | 0.702 |
| 2 | TWI (Topographic Wetness Index) | 0.681 |
| 3 | Land cover | 0.188 |
| 4 | Surface temperature | 0.149 |
| 5 | Aspect | 0.110 |
| 6 | Distance to populated area | 0.099 |
| 7 | Slope | 0.084 |
| 8 | Distance to roads | 0.070 |
| 9 | Rainfall | 0.051 |
| 10 | Wind speed | 0.001 |
| Parameter | Training Data | Validation Data | ||
|---|---|---|---|---|
| Kernel Logistic Regression | Support Vector Machine | Kernel Logistic Regression | Support Vector Machine | |
| Sensitivity (%) | 92.86 | 85.71 | 87.50 | 87.50 |
| Specificity (%) | 85.71 | 85.71 | 75.00 | 75.00 |
| PPV (%) | 86.67 | 85.71 | 77.78 | 77.78 |
| NPV (%) | 92.31 | 85.71 | 85.71 | 85.71 |
| Overall accuracy (%) | 89.29 | 85.71 | 81.25 | 81.25 |
| Kappa index | 0.785 | 0.714 | 0.625 | 0.625 |
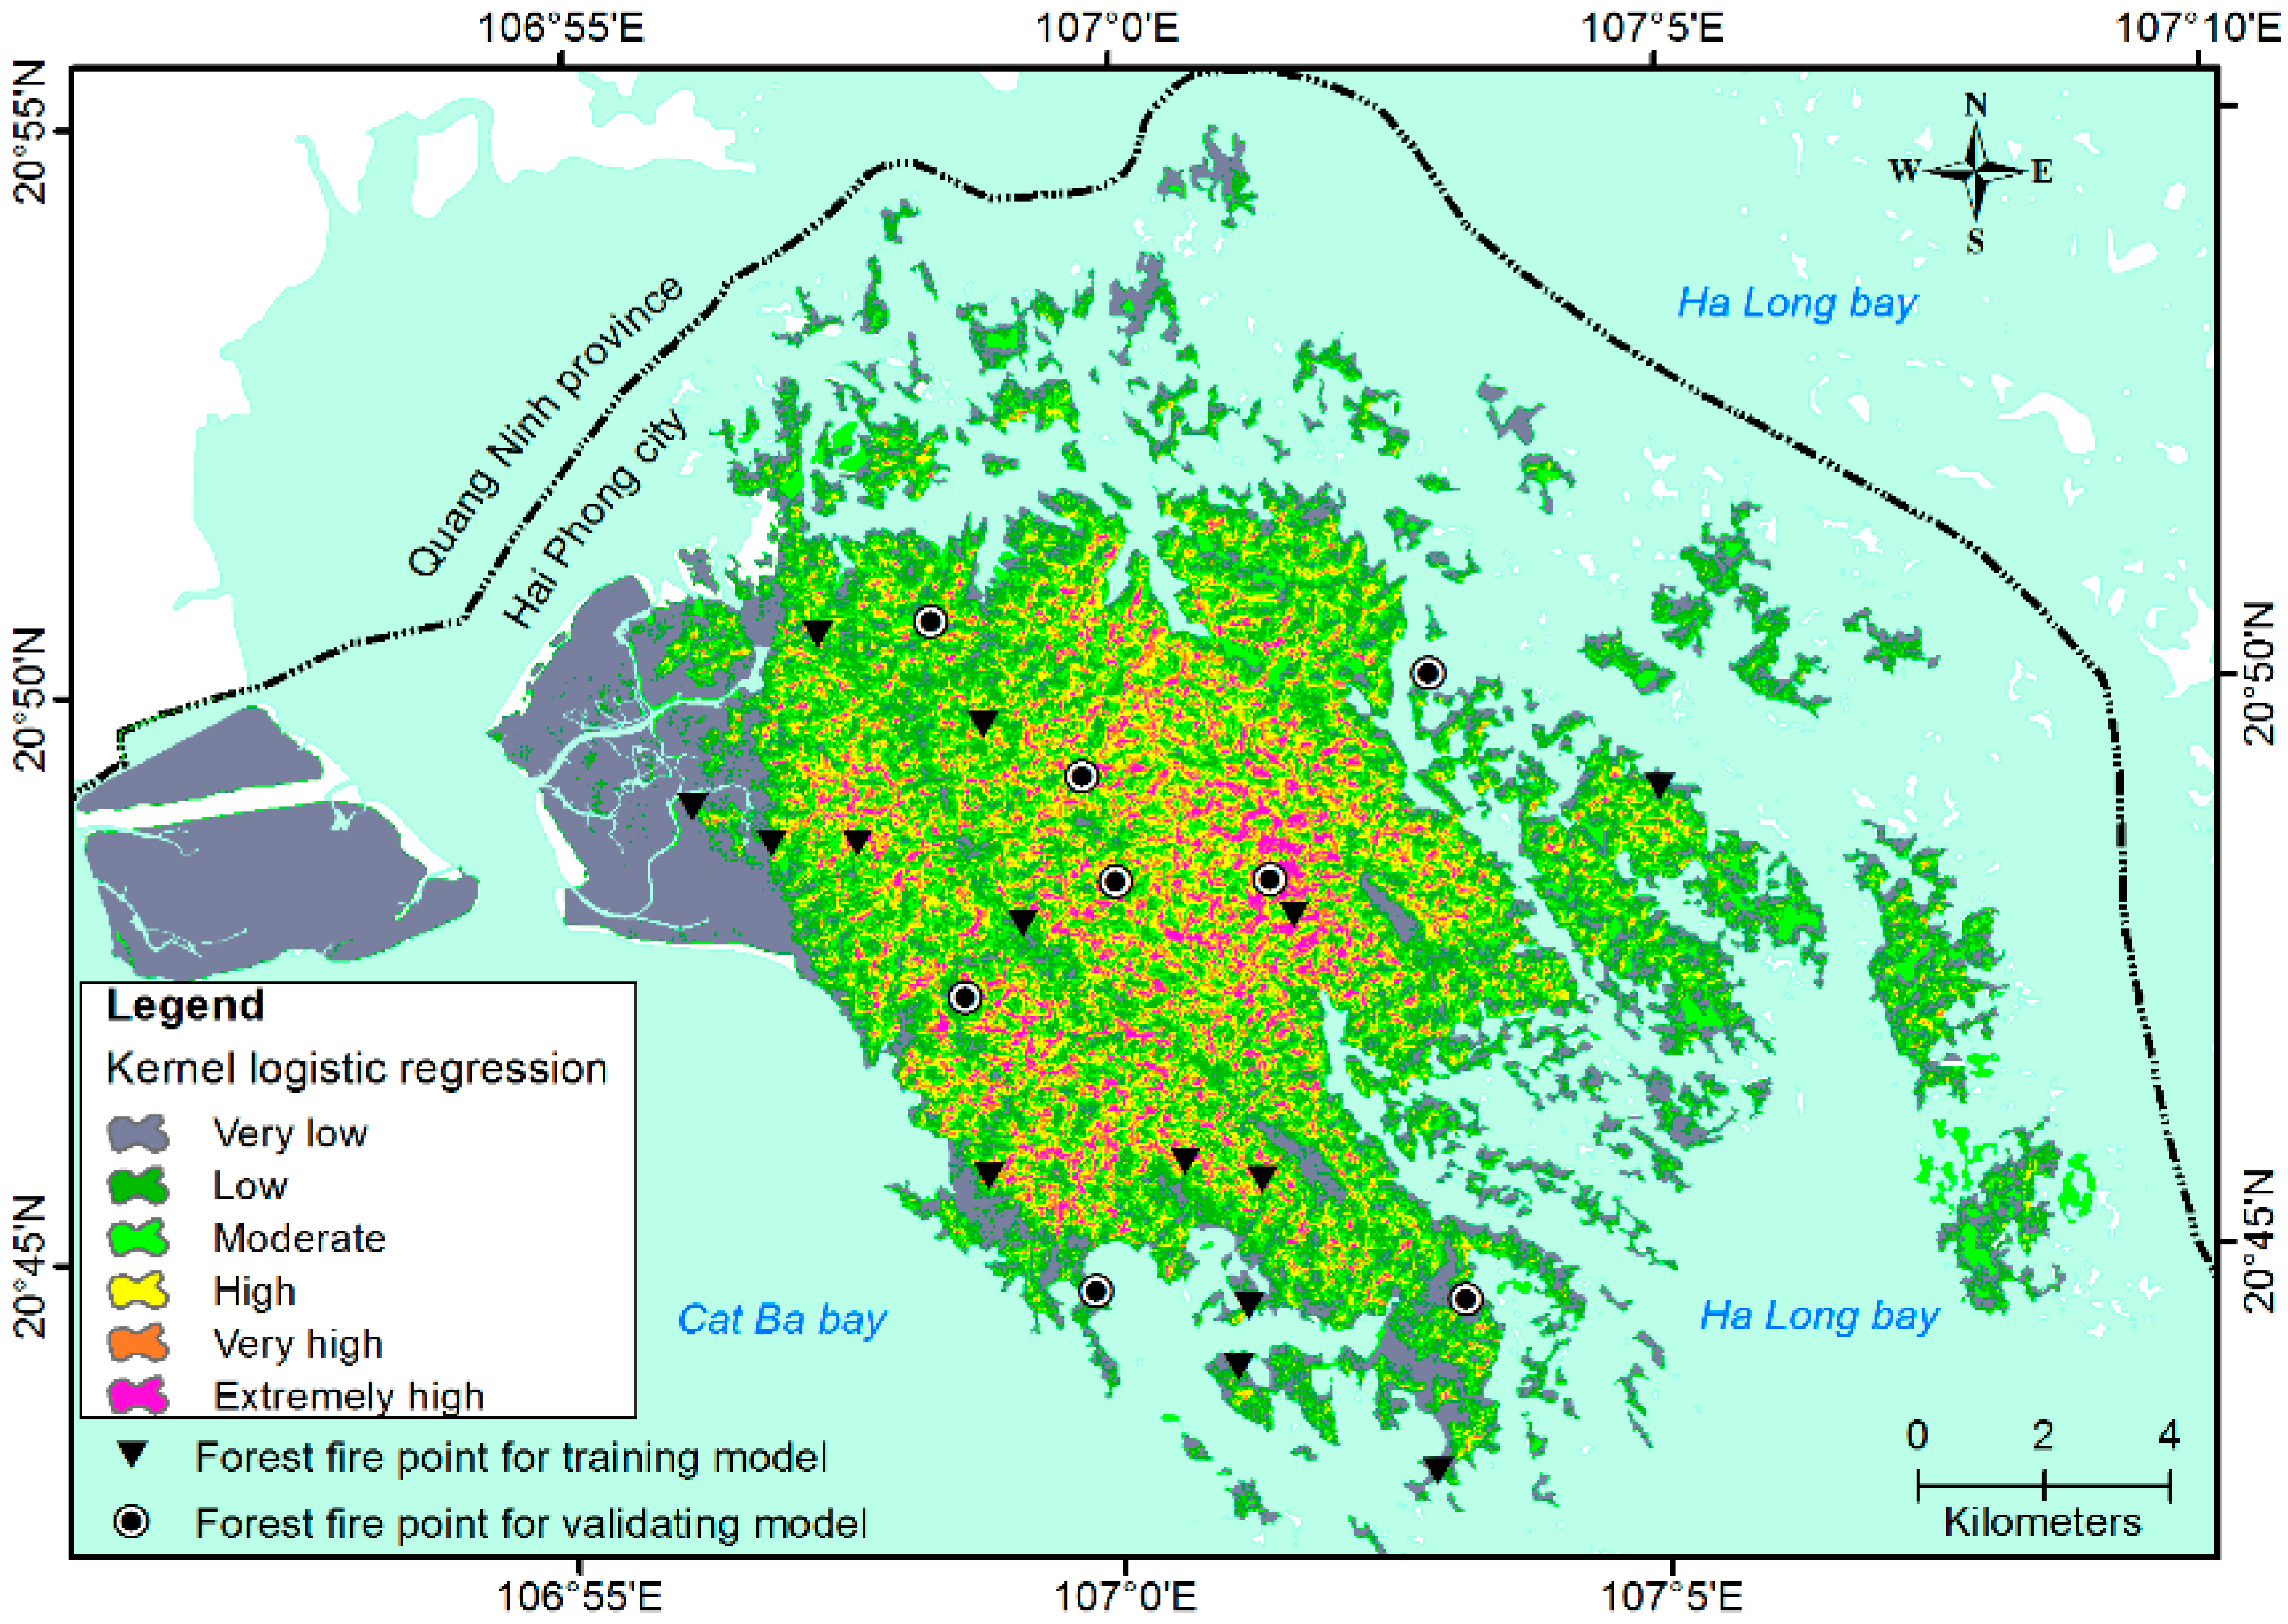
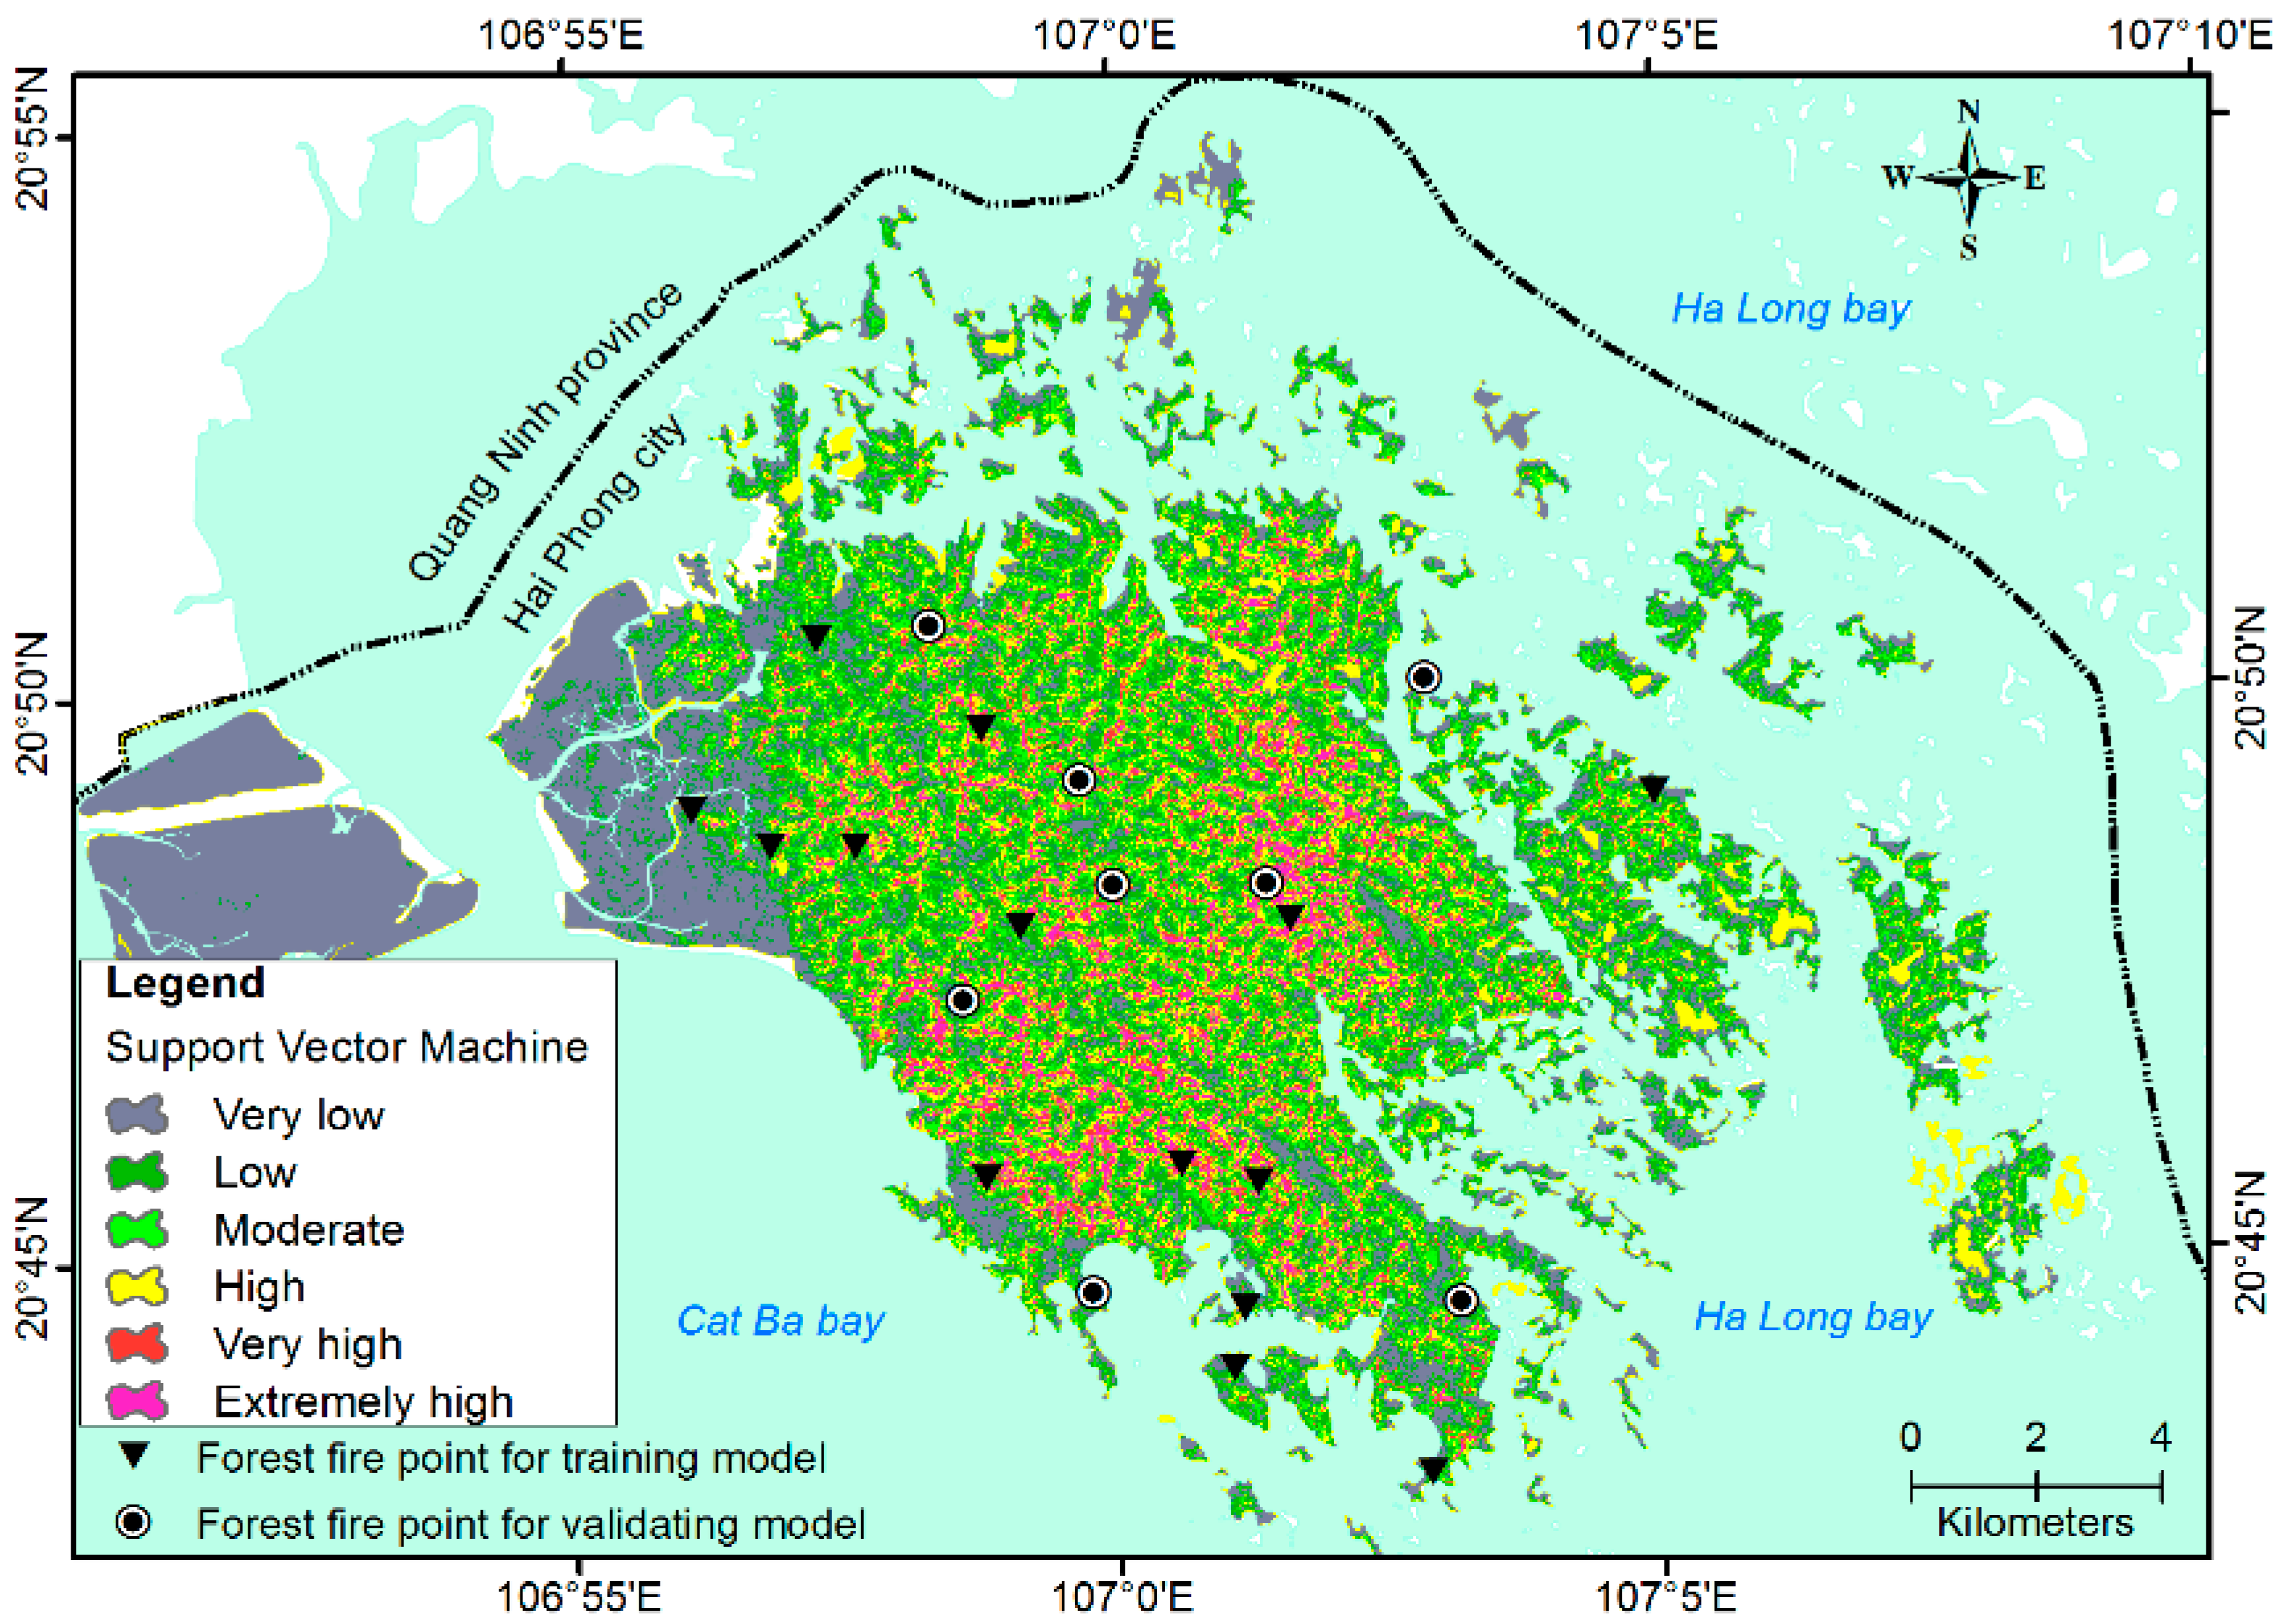
| No. | Susceptibility Index Range | Fire Susceptibility (%) | Verbal Expression | Areas (km2) |
|---|---|---|---|---|
| 1 | 0.903–0.746 | 100%–95% | Extremely high | 10.5 |
| 2 | 0.746–0.703 | 90%–95% | Very high | 10.5 |
| 3 | 0.703–0.614 | 75%–90% | High | 31.2 |
| 4 | 0.614–0.536 | 55%–75% | Medium | 41.8 |
| 5 | 0.536–0.372 | 30%–55% | Low | 52.2 |
| 6 | 0.372–0.065 | 0–30% | Very low | 62.7 |
© 2016 by the authors; licensee MDPI, Basel, Switzerland. This article is an open access article distributed under the terms and conditions of the Creative Commons by Attribution (CC-BY) license (http://creativecommons.org/licenses/by/4.0/).
Share and Cite
Tien Bui, D.; Le, K.-T.T.; Nguyen, V.C.; Le, H.D.; Revhaug, I. Tropical Forest Fire Susceptibility Mapping at the Cat Ba National Park Area, Hai Phong City, Vietnam, Using GIS-Based Kernel Logistic Regression. Remote Sens. 2016, 8, 347. https://0-doi-org.brum.beds.ac.uk/10.3390/rs8040347
Tien Bui D, Le K-TT, Nguyen VC, Le HD, Revhaug I. Tropical Forest Fire Susceptibility Mapping at the Cat Ba National Park Area, Hai Phong City, Vietnam, Using GIS-Based Kernel Logistic Regression. Remote Sensing. 2016; 8(4):347. https://0-doi-org.brum.beds.ac.uk/10.3390/rs8040347
Chicago/Turabian StyleTien Bui, Dieu, Kim-Thoa Thi Le, Van Cam Nguyen, Hoang Duc Le, and Inge Revhaug. 2016. "Tropical Forest Fire Susceptibility Mapping at the Cat Ba National Park Area, Hai Phong City, Vietnam, Using GIS-Based Kernel Logistic Regression" Remote Sensing 8, no. 4: 347. https://0-doi-org.brum.beds.ac.uk/10.3390/rs8040347