Article

Active Optical Sensing of Spring Maize for In-Season Diagnosis of Nitrogen Status Based on Nitrogen Nutrition Index

1
Key Laboratory of Plant-Soil Interactions, Ministry of Education, International Center for Agro-Informatics and Sustainable Development, College of Resources and Environmental Sciences, China Agricultural University, Beijing 100193, China
2
Department of Soil and Crop Sciences, Colorado State University, Fort Collins, CO 80523, USA
*
Authors to whom correspondence should be addressed.
Submission received: 1 April 2016 / Revised: 2 July 2016 / Accepted: 11 July 2016 / Published: 19 July 2016
(This article belongs to the Special Issue Remote Sensing in Precision Agriculture)

Abstract

:
The nitrogen (N) nutrition index (NNI) is a reliable indicator of crop N status and there is an urgent need to develop efficient technologies for non-destructive estimation of NNI to support the practical applications of precision N management strategies. The objectives of this study were to: (i) validate a newly established critical N dilution curve for spring maize in Northeast China; (ii) determine the potential of using the GreenSeeker active optical sensor to non-destructively estimate NNI; and (iii) evaluate the performance of different N status diagnostic approaches based on estimated NNI via the GreenSeeker sensor measurements. Four field experiments involving six N rates (0, 60, 120,180, 240, and 300 kg·ha−1) were conducted in 2014 and 2015 in Lishu County, Jilin Province in Northeast China. The results indicated that the newly established critical N dilution curve was suitable for spring maize N status diagnosis in the study region. Across site-years and growth stages (V5–V10), GreenSeeker sensor-based vegetation indices (VIs) explained 87%–90%, 87%–89% and 83%–84% variability of leaf area index (LAI), aboveground biomass (AGB) and plant N uptake (PNU), respectively. However, normalized difference vegetation index (NDVI) became saturated when LAI > 2 m2·m−2, AGB > 3 t·ha−1 or PNU > 80 kg·ha−1. The GreenSeeker-based VIs performed better for estimating LAI, AGB and PNU at V5–V6 and V7–V8 than the V9–V10 growth stages, but were very weakly related to plant N concentration. The response index calculated with GreenSeeker NDVI (RI–NDVI) and ratio vegetation index (R2 = 0.56–0.68) performed consistently better than the original VIs (R2 = 0.33–0.55) for estimating NNI. The N status diagnosis accuracy rate using RI–NDVI was 81% and 71% at V7–V8 and V9–V10 growth stages, respectively. We conclude that the response indices calculated with the GreenSeeker-based vegetation indices can be used to estimate spring maize NNI non-destructively and for in-season N status diagnosis between V7 and V10 growth stages under experimental conditions with variable N supplies. More studies are needed to further evaluate different approaches under diverse on-farm conditions and develop side-dressing N recommendation algorithms.

Graphical Abstract

1. Introduction

Maize (Zea mays L.) is the second most important staple food crop in China and accounts for about 33% of total Chinese cereal production [1]. Over-application of nitrogen (N) has been a common problem in China, resulting in low N use efficiency (NUE) and environmental pollution [2,3,4]. Precision N management (PNM) strategies that match N supply with maize N demand in both space and time are urgently needed to increase NUE and mitigate negative environment impacts [4,5,6]. For such strategies to be successful and practical, non-destructive methods for real-time diagnosis of maize N status before making side-dressing N application recommendations need to be developed.
Nitrogen nutrition index (NNI) has been regarded as a reliable indicator of crop N status [7]. It has been observed that plant N concentration (PNC) decreases with increasing plant aboveground biomass (AGB), which can be described with a critical N dilution curve [7,8]. This is due to the self-shading of the leaves and the increase of the proportion of plant structural and storage tissues with a lower N concentration [7]. As the ratio of actual PNC over critical PNC, the NNI can be used to diagnose crop N nutritional status [7]. An NNI value of 1 indicates optimal N status, while NNI values less or greater than 1 indicates deficient or surplus N status, respectively [7]. For more practical on-farm applications of NNI, Cilia et al. [9] proposed to classify NNI into five classes (NNI ≤ 0.7, 0.7 < NNI ≤ 0.9, 0.9 < NNI ≤ 1.1, 1.1 < NNI ≤ 1.3, and NNI > 1.3) for diagnosing maize N status in Italy and regarded NNI ≤ 0.9 as N deficient, 0.9 < NNI ≤ 1.1 as N optimal and NNI > 1.1 as N surplus. Huang et al. [10] proposed the following NNI thresholds for rice (Oryza sativa L.) in Northeast China: NNI ≤ 0.95 as N deficient, 0.95 < NNI ≤ 1.05 as N optimal and NNI > 1.05 as N surplus. However, the calculation of NNI needs AGB and PNC information, which requires destructive sampling and chemical analysis, and thus not very practical for in-season site-specific N management applications.
A promising approach is to use proximal and remote sensing technologies to non-destructively estimate crop NNI. The chlorophyll meter (CM) has been used for estimating NNI [11,12,13]. However, CM is a leaf sensor and it is still time consuming for instituting NNI based on CM for large area applications in PNM [6]. Passive hyperspectral canopy spectrometers have been used to estimate wheat (Triticum aestivum L.) and maize NNI, and achieved impressive results [14,15,16]. However, passive sensors are influenced by environmental light conditions. In addition, they are expensive for on-farm applications [10]. Active optical sensors (AOS) are more efficient than leaf sensors, yet much cheaper than hyperspectral spectrometers. They have their own source of energy, and are not significantly influenced by environmental light conditions. They can be used at any time of the day, even under cloudy conditions or at night [5,17,18]. Therefore, an AOS is more suitable for applications in PNM.
A widely used AOS is the GreenSeeker sensor (Trimble Navigation Limited, Sunnyvale, CA, USA). It has a red (R) and a near-infrared (NIR) band and is configured to provide two vegetation indices (VIs), the Normalized Difference Vegetation Index (NDVI) and the Ratio Vegetation Index (RVI). Yao et al. [19] used the GreenSeeker sensor to non-destructively estimate rice NNI in Northeast China, with R2 being only 0.25–0.34 and 0.30–0.31 at the stem elongation and heading stages, respectively. Cao et al. [5] used this sensor to estimate winter wheat NNI in North China Plain, and the reported R2 was 0.13–0.20 and 0.60–0.63 at Feekes growth stage 4–7 and 8–10, respectively.
The GreenSeeker sensor has also been used for PNM of maize. Martin et al. [20] collected NDVI values with the GreenSeeker sensor at multiple growth stages and found that it performed best at V8 growth stage [21] for estimating maize yield potential and AGB. Thomason et al. [22] reported a R2 value of 0.81 between NDVI and AGB across V5 to V9 growth stages. However, review of literature indicates that no study has been reported to determine how well can the GreenSeeker sensor be used to estimate NNI of spring maize at different growth stages around side-dressing N application and how accurate can the GreenSeeker sensor-based maize N status diagnosis be. Two basic approaches can be taken to use remote sensing to estimate NNI to diagnose crop N status: mechanistic and semi-empirical methods [16]. The mechanistic method uses remote sensing to estimate plant AGB and PNC, and then calculates NNI according to its definition. The semi-empirical method uses spectral indices to estimate NNI directly. Chen [16] evaluated these two methods for estimating winter wheat NNI based on hyperspectral canopy sensing data and found that the mechanistic method worked better than the semi-empirical method, which was more influenced by phenology. Studies are needed to determine if this is also true for estimating spring maize NNI using active canopy sensor GreenSeeker.
The Northeast China Plain accounts for 35% of the total maize production in China [23]. To improve the diagnosis of spring maize N status in this region, Li et al. [24] established a new critical N dilution curve for the calculation of NNI. Studies are needed to validate this critical N dilution curve using independent dataset and develop efficient non-destructive methods to estimate NNI for in-season site-specific N management applications. Therefore, the objectives of this study were to: (i) validate the newly developed critical N dilution curve for spring maize in Northeast China; (ii) determine the potential of using the GreenSeeker sensor to non-destructively estimate NNI; and (iii) evaluate the performance of different N status diagnostic approaches based on the estimated NNI via the GreenSeeker sensor measurements.

2. Materials and Methods

2.1. Study Site Description and Experimental Design

The study was conducted in Lishu County (43°2′N, 123°3′E), Siping City, Jilin Province in Northeast China. This area is a typical region of rain-fed spring maize in Northeast China, where annual average precipitation is 556 mm, 70%–80% of which occurs between June and September. The rainfall distribution and mean temperature during the study years in Lishu is shown in Figure 1. The two study sites (Sites 1 and 2) selected for this study are about 50 km apart. The soil at the two study locations was classified as Black Soil, equivalent to typical Haplaboroll in the USDA Soil Taxonomy [25]. The soil pH, organic matter, total N, Olsen-Phosphorous (P) and exchangeable Potassium (K) were 5.1 and 5.0, 18.7 and 17.9 g·kg−1, 0.93 and 1.01 g·kg−1, 36.7 and 20.7 mg·kg−1, and 235 and 197 mg·kg−1 for Sites 1 and 2, respectively.
Four N experiments were conducted in 2014 and 2015 (Table 1). Each experiment used the same maize variety (Liangyu 11), the same plant population of 65,000 plant·ha−1, and had the same six N rate treatments (0, 60, 120, 180, 240, and 300 kg·ha−1). The N fertilizers were applied in two split applications: 1/3 as basal application before planting, and the remaining 2/3 as side-dressing at the V8 growth stage. Sufficient phosphate (90 kg P2O5·ha−1) and potash (100 kg K2O·ha−1) fertilizers were applied before planting to make sure phosphorus (P) and potassium (K) nutrients were not limiting. Crop planting and harvest dates are listed in Table 1.
The two field experiments had four replications, with plot area being 60 m2 and 30 m2 for Sites 1 and 2, respectively. All plots were kept free of weeds, insects and diseases with chemicals based on standard practices. No drought stress was reported during the growth period and no irrigation was applied.

2.2. Active Canopy Sensor Data Collection

The GreenSeeker ACS Model 505 was used in this research. This sensor detects reflection in red (650–670 nm) and NIR (755–785 nm) spectral regions. It has a nadir viewing angle with a field of view of 0.0052–0.0145 m2 and acquisition interval from 20 to 1500 ms [26]. Sensor readings were collected over all of the maize plants in each plot except the border rows by holding GreenSeeker approximately 0.7 m above the crop canopy at different stages and walking at a constant speed in all experimental plots. The sensor uses built-in software to calculate NDVI and RVI directly and generates 10 VI readings per second. Details of the sensing times for each experiment are shown in Table 1 and the GreenSeeker readings of one plot were averaged to represent each plot.

2.3. Plant Sampling and Measurements

Maize plant samples were acquired immediately after acquiring sensor readings at each crop growth stage. Five plants were randomly selected from each plot and their height and leaf age were determined. This information was used as reference to select two representative plants with similar height and leaf age in each plot. Green leaf area (GLA) was determined using the following formula [27]:
GLA = leaf length × maximum leaf width × 0.75 (fully expanded leaf)
or
GLA = leaf length × maximum leaf width × 0.5 (none-fully expanded leaf)
LAI was measured as total GLA per unit of soil area. All plant samples were oven-dried at 105 °C for 30 min, then dried at 70 °C to a constant weight, and finally weighed to obtain the AGB. They were later ground into fine powder to determine PNC by a modified Kjeldahl digestion method [28]. The plant nitrogen uptake (PNU) was determined by multiplying PNC with AGB.
At maturity, grain yield was determined by harvesting 20 m2 area of each plot, and standardized to 14% grain moisture content. To evaluate and determine NNI threshold values, relative grain yield was calculated as the ratio of the grain yield for a given N rate treatment and the highest yield observed in that specific site-year N rate experiment.

2.4. Calculation of Nitrogen Nutrition Index

The critical N dilution curve of spring maize developed by Li et al. [24] was used in this study:
Nc = 36.5 W−0.48
where Nc is the critical N concentration expressed as g·kg−1 dry matter (DM) and W is the AGB expressed in Mg DM·ha−1.
The NNI was calculated following Lemaire et al. [7]:
NNI = Na/Nc
where Na is the actual measured N concentration and Nc is the critical N concentration as determined by Equation (3).
The NNI can also be calculated using PNU:
NNI = PNUa/PNUc
where PNUa is the actual measured PNU and PNUc is the critical PNU (Nc × AGB).
The N treatment plots were grouped into three classes based on NNI values: deficit (NNI < 0.95), optimal (0.95 ≤ NNI < 1.05) and surplus (NNI ≥ 1.05).

2.5. Statistical Analysis

To evaluate the newly developed critical N dilution curve of spring maize for Northeast China [24], the data with AGB larger than 1 t·ha−1 were divided into non-N-limiting and N-limiting groups, using the procedure proposed by Greenwood et al. [29] and Ziadi et al. [30]. For each site-year experiment at each sampling date, all the AGB data were subject to analysis of variation (ANOVA) using SPSS 18.0 (SPSS Inc., Chicago, IL, USA) and compared using the least square difference (LSD) test at 5% probability level. Sampling dates were not used to test the validity of the critical N dilution curve if the ANOVA indicated no significant differences (p > 0.05) among the N application rates. The N-limiting treatment is defined as a treatment for which an increase of N application leads to a significant increase in AGB. The non-N-limiting treatment is defined as treatment for which additional N application leads to significant increase in PNC, but not in AGB.
Data collected from the N rate experiments were pooled together. The data for each site, year, growth stage and N rate were randomly divided into calibration dataset (75% of the observations) and validation dataset (25% of the observations). The mean value, standard deviation (SD) and the coefficient of variation (CV, %) of spring maize N status indicators were calculated using Microsoft Excel (Microsoft Corporation, Redmond, WA, USA). The coefficients of determination (R2) of the relationships between VIs and agronomic parameters were calculated using SPSS 18.0, and the model with the highest R2 was selected. In addition to R2, the performance of the model for predicting spring maize N status indicators was also evaluated using the root mean square error (RMSE) and the relative error (RE).
To evaluate the possibility of using normalized VIs to improve the estimation of NNI, N response index (RI) was calculated in this study. It was calculated by dividing GreenSeeker VI of N-rich plots (plots receiving sufficient N supply) by VI of check plots or plots receiving normal N rates. In this study, the plots of 240 kg·ha−1 were used as N rich plots and their average VI values were used for RI calculation.
Different approaches can be taken to non-destructively estimate NNI with the GreenSeeker sensor. The first is to estimate AGB and PNC using NDVI or RVI and from the estimated biomass, Nc can be determined using the established critical N dilution curve and NNI can then be calculated (NNI–PNC–NDVI or NNI–PNC–RVI). The second approach is to use the GreenSeeker NDVI or RVI to estimate biomass and PNU. Using the estimated biomass, Nc can be calculated. The product of biomass and Nc is PNUc, and NNI can be calculated as the ratio of PNU and PNUc (NNI–PNU–NDVI or NNI–PNU–RVI). The third approach is to estimate NNI directly using GreenSeeker NDVI (NNI–NDVI) or RVI (NNI–RVI). The fourth approach is to use RI calculated with GreenSeeker NDVI (RI–NDVI) or RVI (RI–RVI) to estimate NNI directly (NNI–RI–NDVI or NNI–RI–RVI). The fifth approach used the relationships between RI and NNI to determine the corresponding RI values when NNI is 0.95 and 1.05 and the following threshold values were used to diagnose maize N status directly: RI–NDVI > 1.06 (N deficient), 1.03 < RI–NDVI < 1.06 (N optimal), and RI–NDVI < 1.03 (N surplus); and RI–RVI > 1.32 (N deficient), 1.17 < RI–RVI < 1.32 (N optimal), and RI–RVI < 1.17 (N surplus). Based on these threshold values, RI–NDVI or RI–RVI can be used to directly diagnose maize N status (RI–NDVI or RI–RVI). Different N status diagnostic approaches were compared with areal agreement and kappa statistics [31]. The areal agreement is the percentage of plots that shared a common classification and the Kappa statistics provides a more robust measure of how two classifications agreed compared with a “chance” agreement and is, therefore, a more rigorous statistical indicator to compare two classifications.

3. Results

3.1. Variability of Spring Maize Nitrogen Status Indicators

The spring maize N status indicators varied greatly across different N rate treatments, growth stages and site-years (Table 2). Across growth stages, the AGB was most variable, with CV of 78%, followed by PNU (CV = 77%), LAI (CV = 64%), PNC (CV = 25%) and NNI (CV = 24%). The validation dataset had similar variability as the calibration dataset, except for PNU, which had slightly larger variability than the calibration dataset (Table 2). For calibration dataset, the average LAI, AGB and PNU increased from V5 to V10 crop growth stage, while the average PNC decreased from 39.0 g·kg−1 at the V5 growth stage to 21.1 g·kg−1 at the V10 stage. For a single growth stage, the PNU was most variable. These results indicated that maize plant growth was significantly affected by N application rates, and the large variability of these parameters made it a good dataset to evaluate the potential of using GreenSeeker sensor for estimating maize N status.

3.2. Maize Grain Yield as Affected by Different Nitrogen Rates

Maize grain yield responded differently to N fertilizer application in different site-years (Figure 2). Linear with plateau response curves were fitted to each site-year. In general, Site 1 was less responsive to N fertilization than Site 2. It could produce 13.6 t·ha−1 grain yield in 2014 even without any N fertilizer application and grain yield reached plateau (15.4 t·ha−1) at 178 kg N ha−1. Yield was only increased 1.8 t·ha−1 by N fertilization. In 2015, yield with no N application was lower (9.5 t·ha−1) and grain yield reached plateau (13.9 t·ha−1) at 121 kg·ha−1. The N fertilization increased yield by 4.4 t·ha−1. The grain yields without N application at Site 2 were only 4.2 t·ha−1 and 2.7 t·ha−1 in 2014 and 2015, respectively. They reached plateau (14.9 t·ha−1 and 13.3 t·ha−1 in 2014 and 2015, respectively) at 137 kg·ha−1 and 143 kg·ha−1, resulting in yield increase of 10.7 t·ha−1 and 10.6 t·ha−1 by N fertilization in 2014 and 2015, respectively. Grain yield was lower in 2015 than in 2014 for both sites, possibly due to the July drought in 2015 (Figure 1).

3.3. Evaluation of the Existing Critical Nitrogen Dilution Curve

When plotting PNC and AGB data together with the Nc dilution curve (Figure 3), 84% of N-limiting data points were below the curve and 97% of non-N-limiting data points were above the curve (Figure 3a). From Figure 3b, it was obvious that N surplus dots were all above the Nc dilution curve, N deficient dots were all below the curve, and N optimal dots were all on or close to the curve. These results indicated the validity of this critical N dilution curve for Lishu region.
The relationship between NNI calculated with the Nc curve and the relative grain yield was expressed with a linear with plateau model, with R2 of 0.87 (Figure 4). Based on this relationship, for NNI > 0.96, relative grain yield reached a plateau, and was close to 1. This finding confirmed the validity of the critical Nc curve and the resulting NNI was a reliable indicator of the N status of spring maize.

3.4. Relationships between Vegetation Indices and Nitrogen Status Indicators

3.4.1. Leaf Area Index

Across growth stages and site-years, GreenSeeker NDVI and RVI were significantly correlated with LAI (R2 = 0.90 and 0.87, respectively), but the NDVI became saturated when LAI reached 2 m2·m−2 and was almost invariant when LAI was larger than 3 (Figure 5a). However, this saturation effect was not found for RVI at moderate to high LAI values up to the V10 stage (Figure 5b).
In this study, we collected data at different growth stages (V5 to V10), but considering the difficulty of distinguishing adjacent growth stages very accurately under on-farm condition by farmers, we combined two adjacent growth stages together (V5–V6, V7–V8, and V9–V10). The relationships between GreenSeeker VIs and LAI decreased from R2 of 0.66–0.67 at the V5–V6 growth stages to 0.58–0.59 at the V7–V8 growth stages and further down to 0.44–0.48 at the V9–V10 growth stages (Table 3).
The above models describing relationships between VIs and N status indicators were further evaluated with the validation dataset (Table 4). Across different growth stages, the NDVI and RVI models performed similarly for predicting LAI (R2 = 0.89 and 0.87, respectively), with similar RMSE and RE (Table 4; Figure 6a,b). The model for V7–V8 growth stages performed better than those for V5–V6 and V9–V10 growth stages, with the highest R2 and the lowest RE.

3.4.2. Aboveground Biomass

Across growth stages and site-years, GreenSeeker-based VIs were highly related to AGB (R2 = 0.87–0.89) (Table 3), however, NDVI became saturated when AGB > 3 t·ha−1 (Figure 7a). The average AGB increased to 2.76 t·ha−1 at the V9 stage, and further increased to 3.94 t·ha−1 at the V10 stage, which indicated that NDVI should only be used before the V10 stage.
The R2 for the relationships between GreenSeeker indices and AGB decreased from 0.63–0.66 at the V5–V6 growth stages to 0.54–0.57 at the V7–V8 growth stages, and further down to 0.38–0.42 at the V9–V10 growth stage (Table 3), similarly as LAI.
Validation results indicated that NDVI and RVI models could predict AGB well across all growth stages, with R2, RMSE and RE being 0.83–0.84, 0.56–0.61 t·ha−1 and 30%–33%, respectively (Table 4; Figure 6c,d). The GreenSeeker indices performed better at V7–V8 than V5–V6 and V9–V10 growth stages, in terms of R2 and RE.

3.4.3. Plant Nitrogen Concentration

Across growth stages and site-years, the GreenSeeker NDVI and RVI were negatively related to PNC, with the relationships being quadratic and logarithmic (R2 = 0.46), respectively (Table 3, Figure 8a,b). The validation results indicated that the NDVI and RVI models performed similarly as the calibration dataset (R2 = 0.47) (Figure 6e,f).
At specific growth stages, the GreenSeeker indices were either not or very weakly related to PNC (R2 < 0.25) (Table 3), and the validation results were also very poor (R2 < 0.15) (Table 4).

3.4.4. Plant Nitrogen Uptake

Across growth stages and site-years, the GreenSeeker NDVI and RVI were positively related to PNU, with R2 being 0.83 and 0.84, respectively (Table 3; Figure 9a,b). This is similar to the results reported for winter wheat (R2 = 0.78–0.82) [5,32], and slightly better than rice (R2 = 0.70–0.73) [19].
For specific growth stages, the GreenSeeker indices performed slightly better at V5–V6 (R2 = 0.65–0.67) and V7–V8 (R2 = 0.60) than V9–V10 growth stages (R2 = 0.50–0.52) for estimating PNU (Table 3). The decreasing performance was caused by the saturation effect as with AGB. The NDVI became saturated when PNU was about 80 kg·ha−1 (Figure 9a). The validation results indicated that GreenSeeker NDVI and RVI models could predict PNU well across site-years and growth stages, with similar R2 (0.78–0.80), RMSE and RE (Table 4; Figure 6g,h). For specific growth stages, the models performed better at the V5–V6 (R2 = 0.67–0.70) and V7–V8 (R2 = 0.70–0.74) stages than at the V9–V10 stage (R2 = 0.46–0.47).

3.4.5. Nitrogen Nutrition Index

The GreenSeeker VIs were more strongly related to NNI at V7–V8 (R2 = 0.51–0.55) than at V9–V10 growth stages (R2 = 0.44–0.45). However, unlike the other N status indicators, the relationships were weaker across growth stages (R2 = 0.33–0.36) than at specific stages (Table 5). The validation results showed similar patterns (Table 6). In this study, RI values calculated with GreenSeeker NDVI (RI–RVI) and RVI (RI–RVI) were more strongly related to NNI than the original VIs with relatively more stable performance (R2 = 0.56–0.68) (Table 5; Figure 10a–d). The validation results confirmed this observation (Table 6; Figure 10e–h).

3.5. Evaluating Different Nitrogen Status Diagnostic Approaches

To evaluate the diagnosis accuracy of these different approaches, the experimental plots were divided into three classes: N deficient, N optimal and N surplus based on destructively measured NNI and the threshold values proposed in this study. The diagnosis results of different approaches were compared with the results based on measured NNI.
The results indicated that the RI–NDVI approach performed the best at the V7–V8 growth stages, with the diagnosis accuracy rate of 81% and kappa statistics of 0.66. The NNI–RI–NDVI approach was the second best approach at the V7–V8 growth stages with the diagnosis accuracy rate of 76% and kappa statistics of 0.56. At the V9–V10 growth stages, the different approaches had similar accuracy rate (67%–71%) with the RI–RVI approach having the highest kappa statistics (0.52) (Table 7). The strength of the agreement can be classified as fair, moderate and substantial if the Kappa statistics is 0.21–0.40, 0.41–0.60 and 0.61–0.80, respectively [33,34]. Therefore, all of these approaches performed moderately or substantially well at the V7–V8 growth stages while all of the approaches performed moderately well at the V9–V10 growth stages except the NNI–PNC–NDVI and NNI–PNU–NDVI approaches (Table 7).

4. Discussions

If crop NNI can be non-destructively estimated at key growth stages during the growing season, it will make significant contributions to the development of PNM strategies. The GreenSeeker active sensor has been evaluated for in-season estimation of winter wheat and rice NNI [5,19]. Maize is a row crop and much taller than wheat and rice. How well can maize NNI be estimated using the GreenSeeker sensor? Of the different approaches that can be taken for non-destructive estimation of crop NNI, which one will work best for in-season N status diagnosis of spring maize? This study was conducted to answer these questions.

4.1. Non-Destructive Estimation of Spring Maize Nitrogen Nutrition Index

In this study, five approaches were evaluated for estimating spring maize NNI. The first two approaches can be classified as mechanistic methods and the rest three approaches can be classified as semi-empirical methods, according to Chen [16].
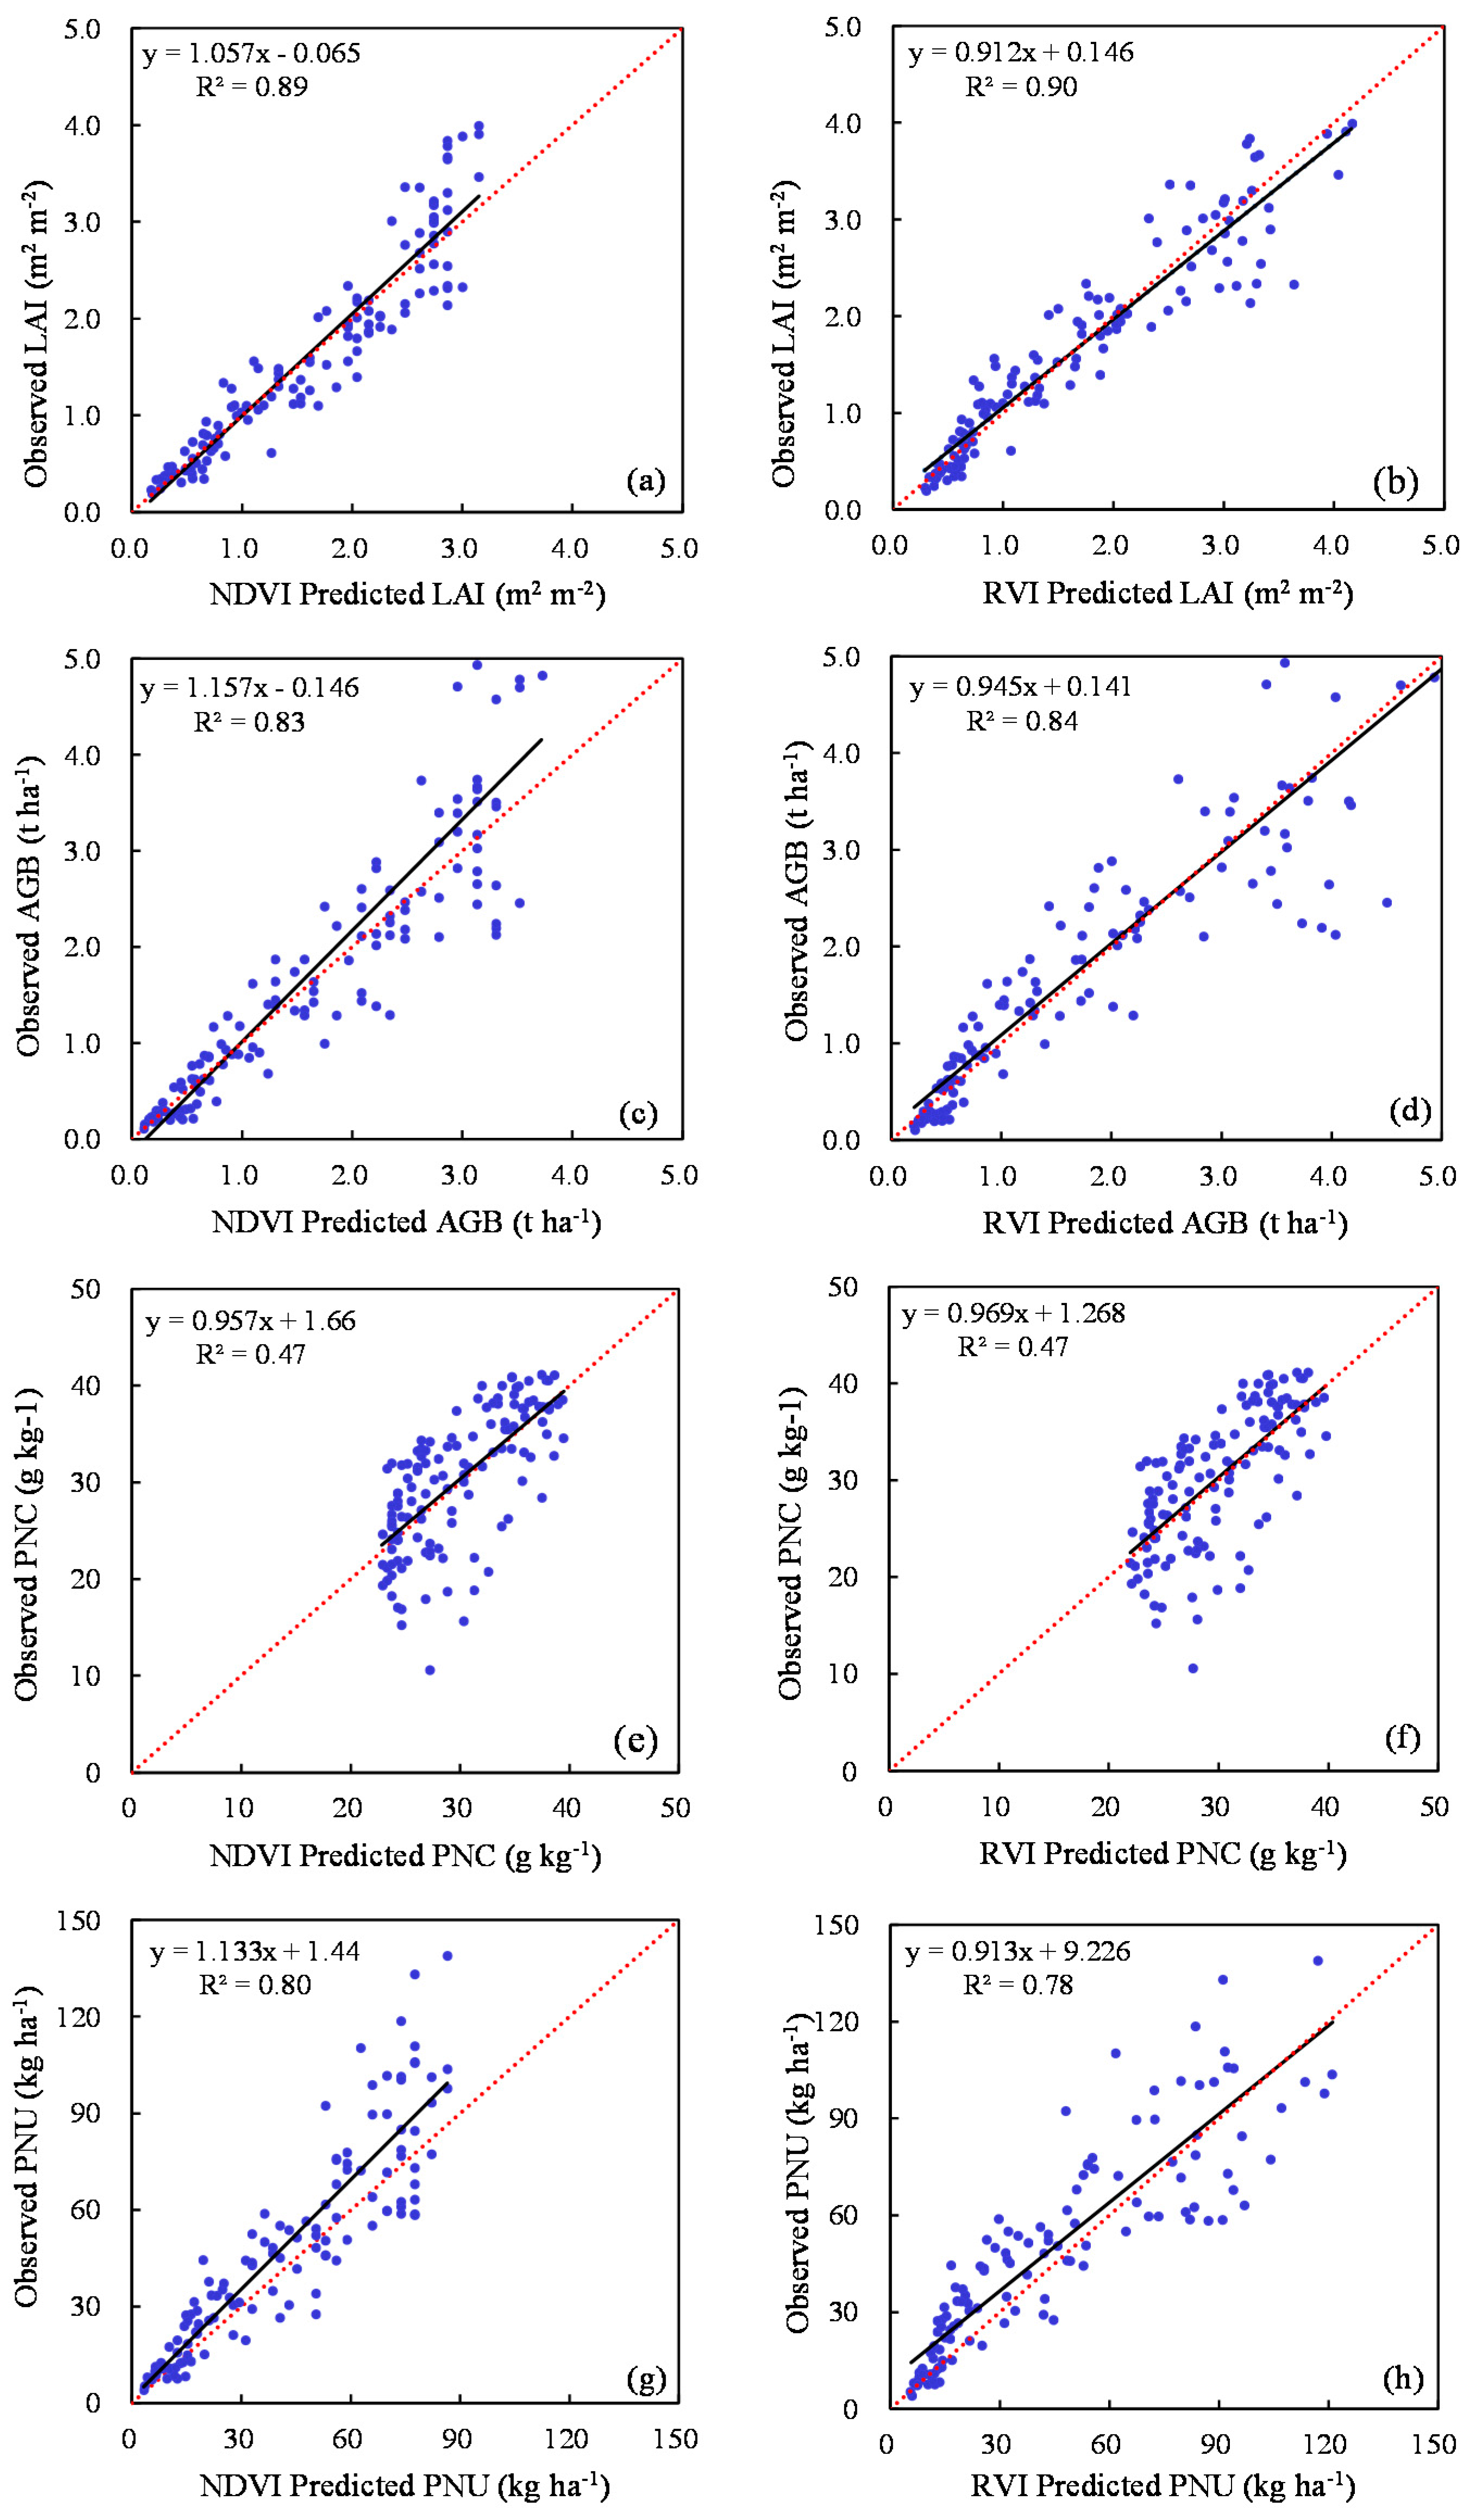
The first mechanistic method to NNI estimation is NNI–PNC–NDVI (or RVI), which requires the estimation of AGB and PNC. The results of this study indicated that AGB could be estimated well using GreenSeeker sensor across V5 to V10 (R2 = 0.87–0.89). However, NDVI became saturated at the V10 stage when AGB was greater than 3 t·ha−1. This should not limit its practical applications because most N management strategies recommend side-dressing N fertilizers to be applied before the V10 stage. High clearance fertilizer application machines will be needed at later growth stages and yield losses may occur. Thomason et al. [22] found a liner plus plateau relationship between GreenSeeker NDVI and maize biomass across growth stages from V5 to V9 growth stages and NDVI reached a plateau at 0.82. Other researchers also reported the saturation effects of NDVI for winter wheat [5,32,35] and rice [19,36]. The saturation effect of NDVI was mainly due to the canopy closure, the differences in penetration into the canopy between visible light (R) and NIR, and the normalization effect embedded in the calculation formula of this index [
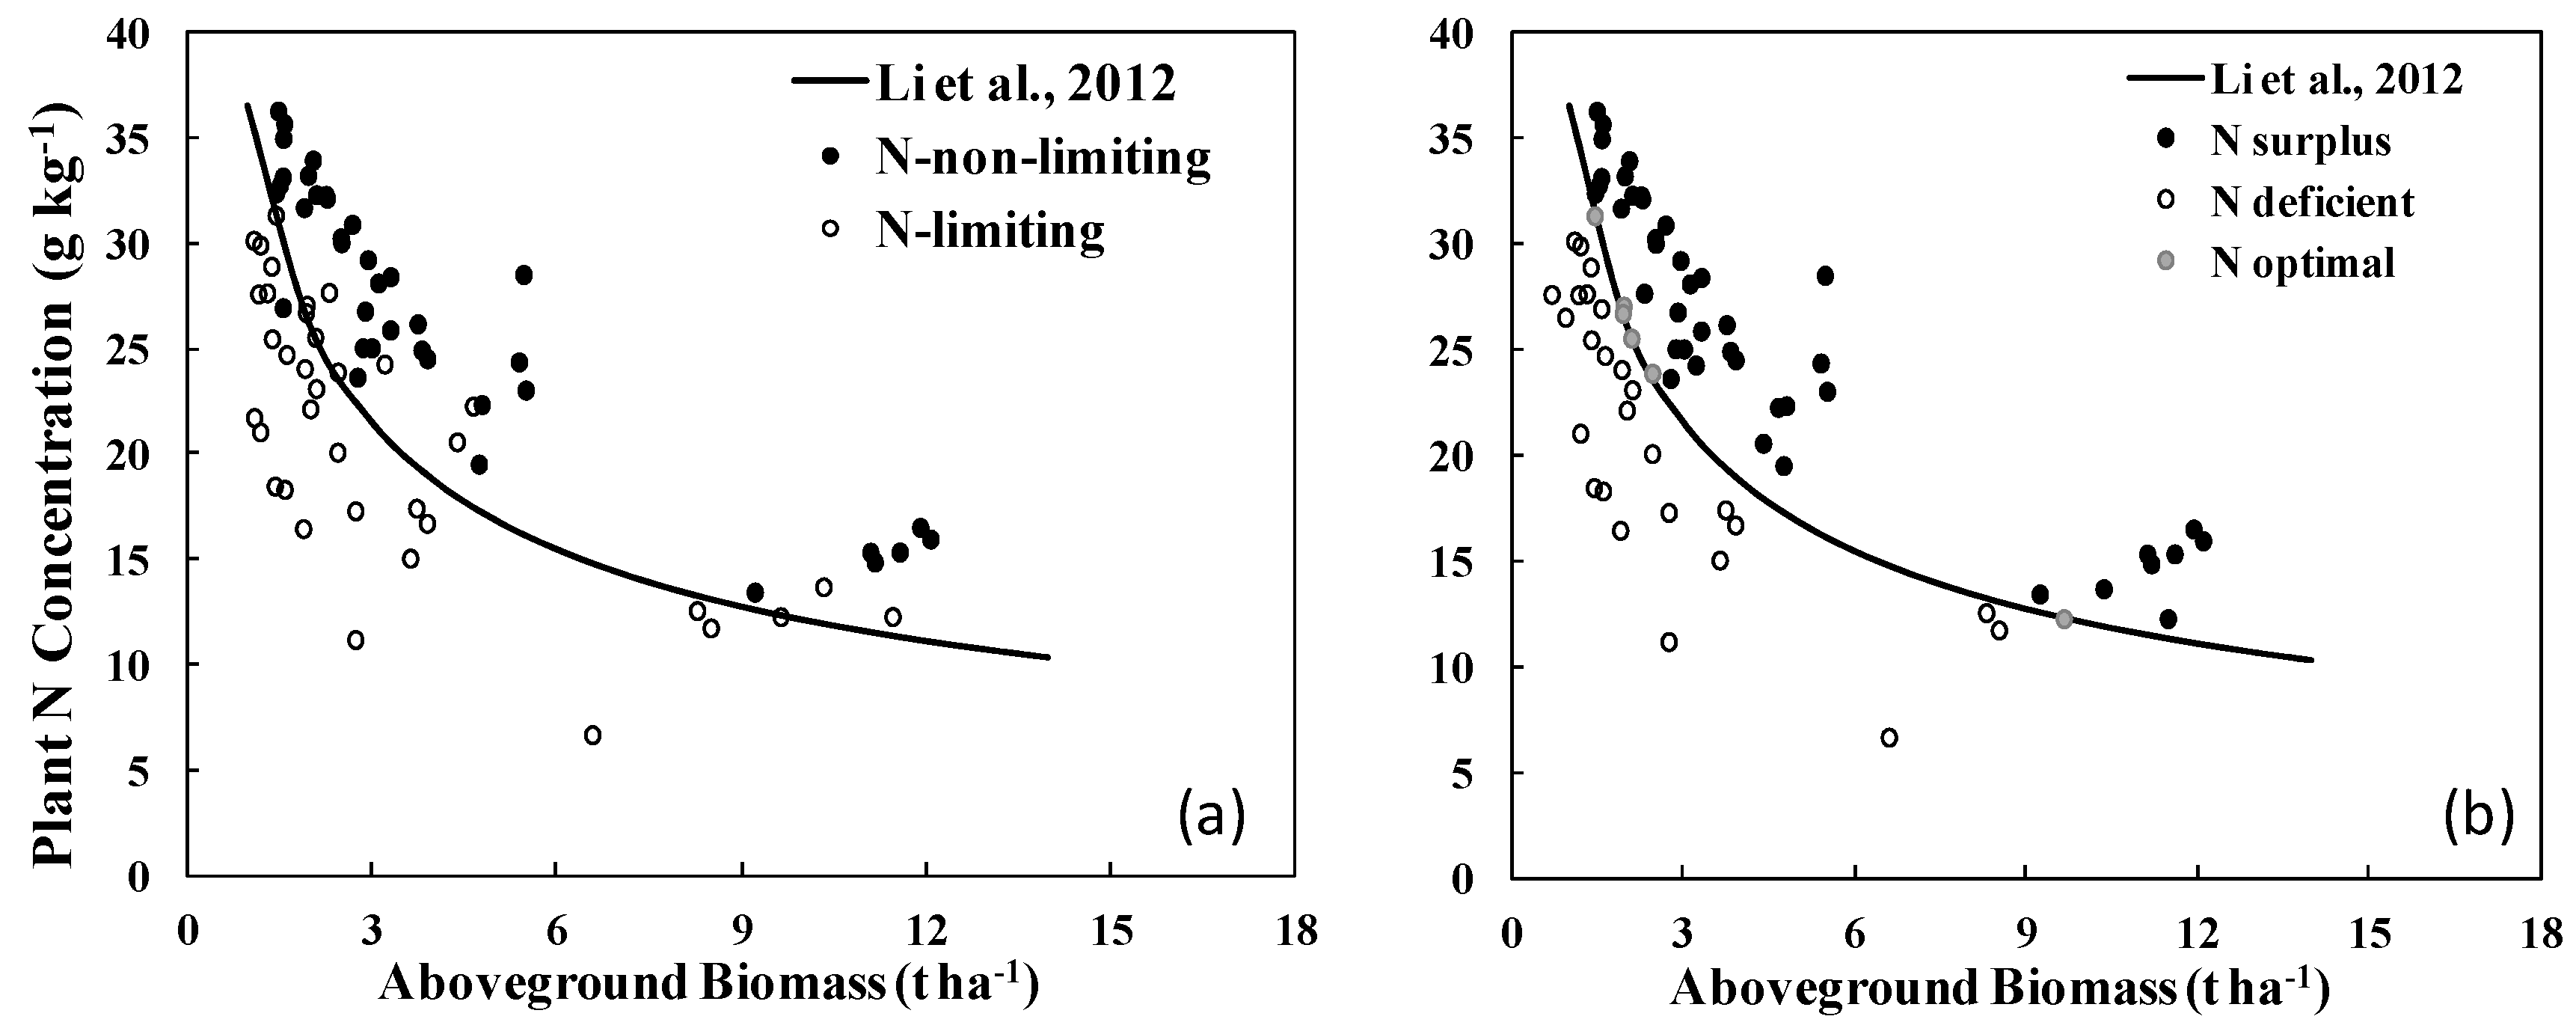
37]. The saturation effect could be reduced using VIs with wavebands of similar penetration into crop canopy or using ratio indices [
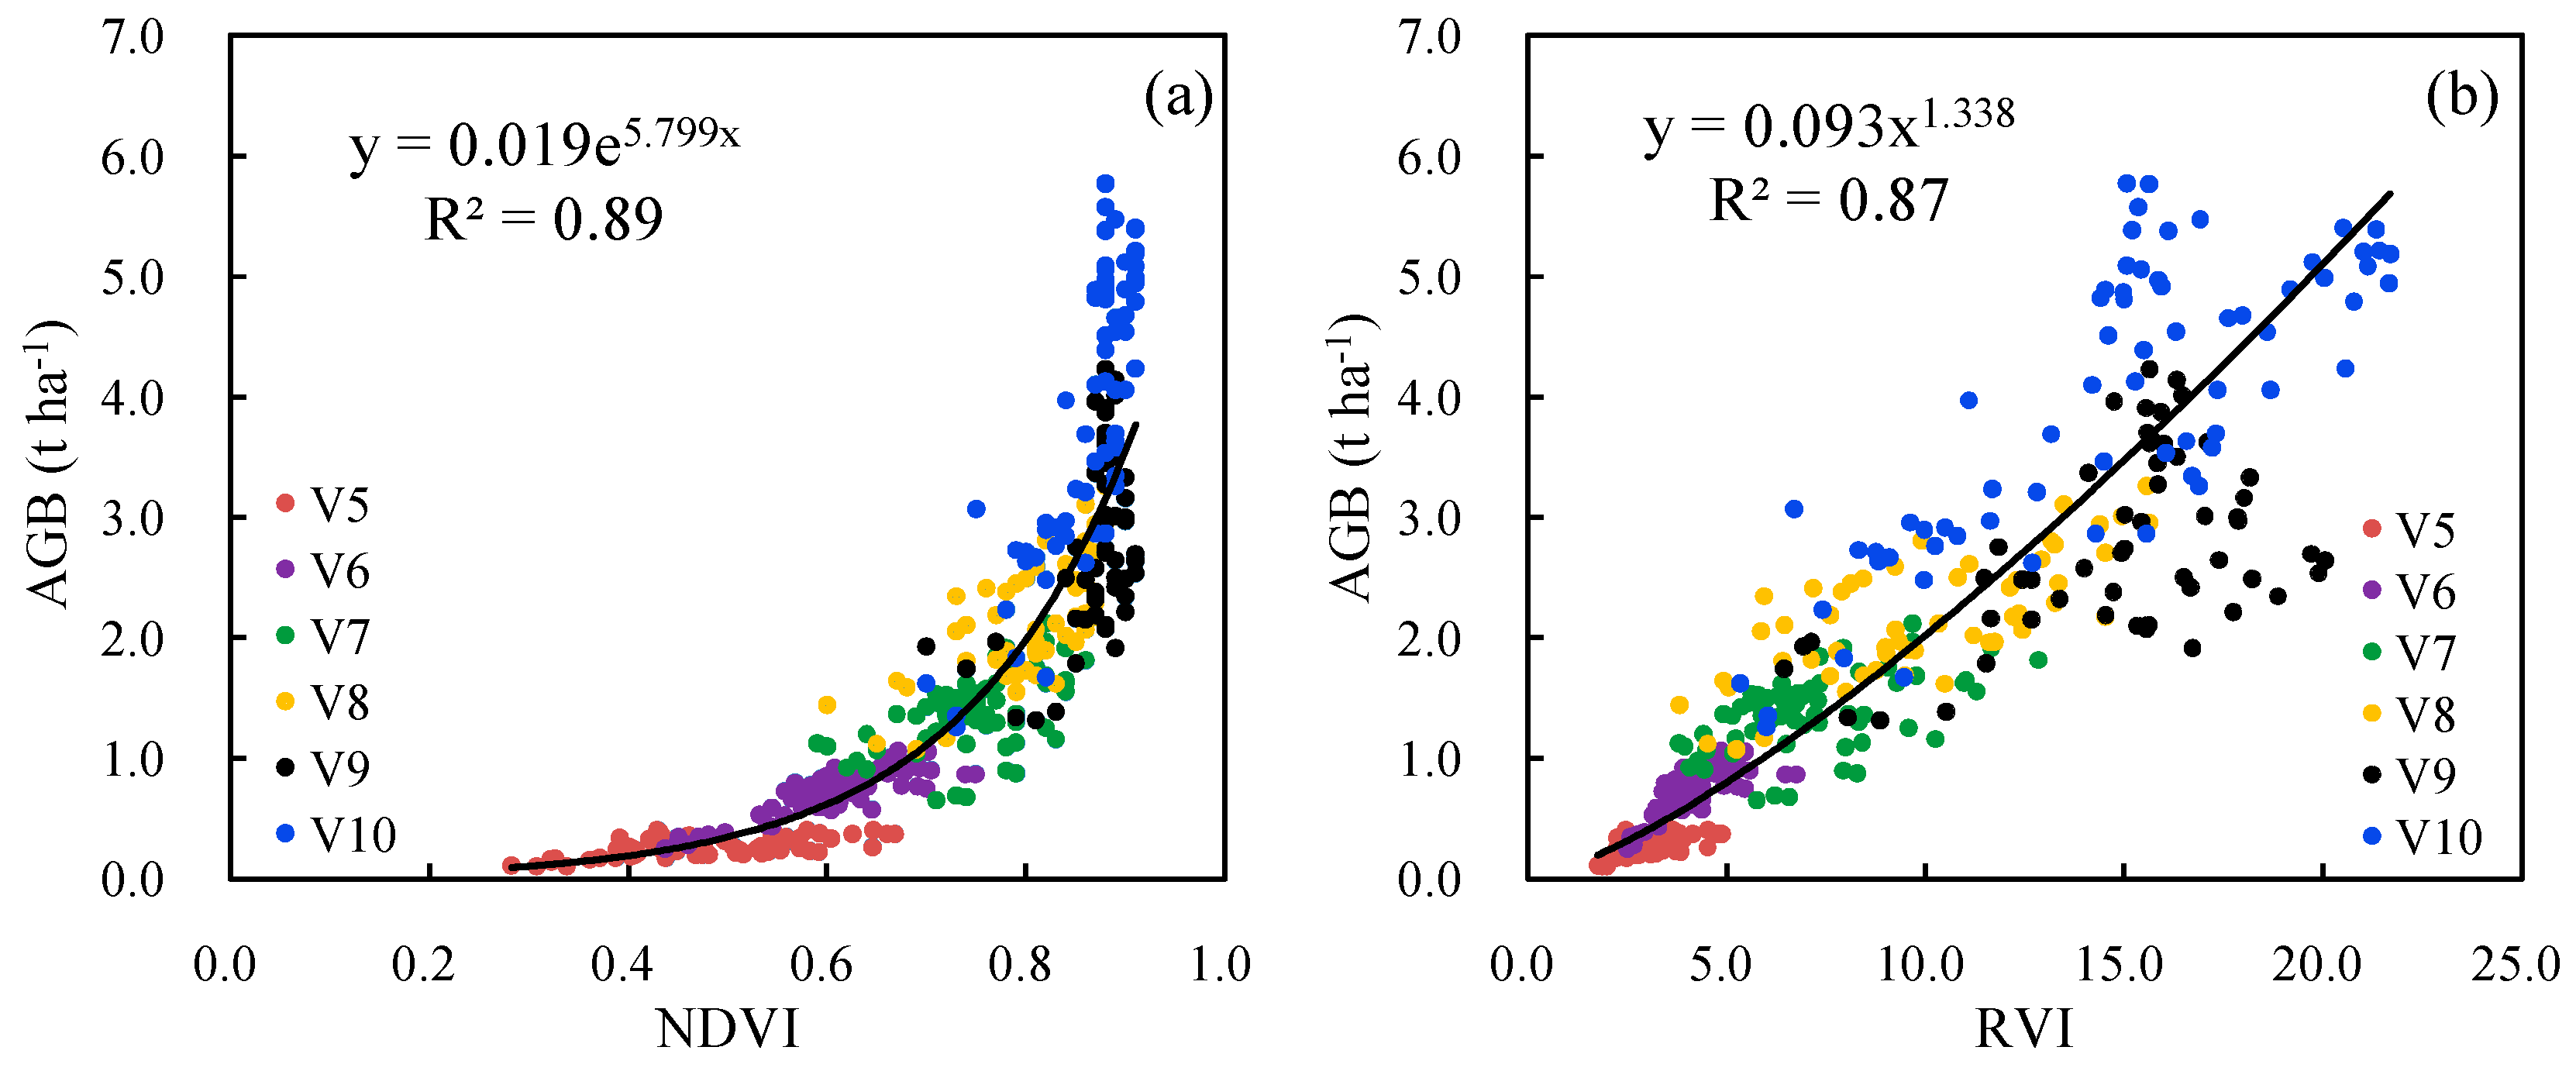
37], as indicated by the relationship between AGB and RVI up to about 6 t·ha−1 (Figure 7b). Previous research indicated that RVI did not become saturated even after AGB reached 6 t·ha−1, but the relationships became more scattered [5,
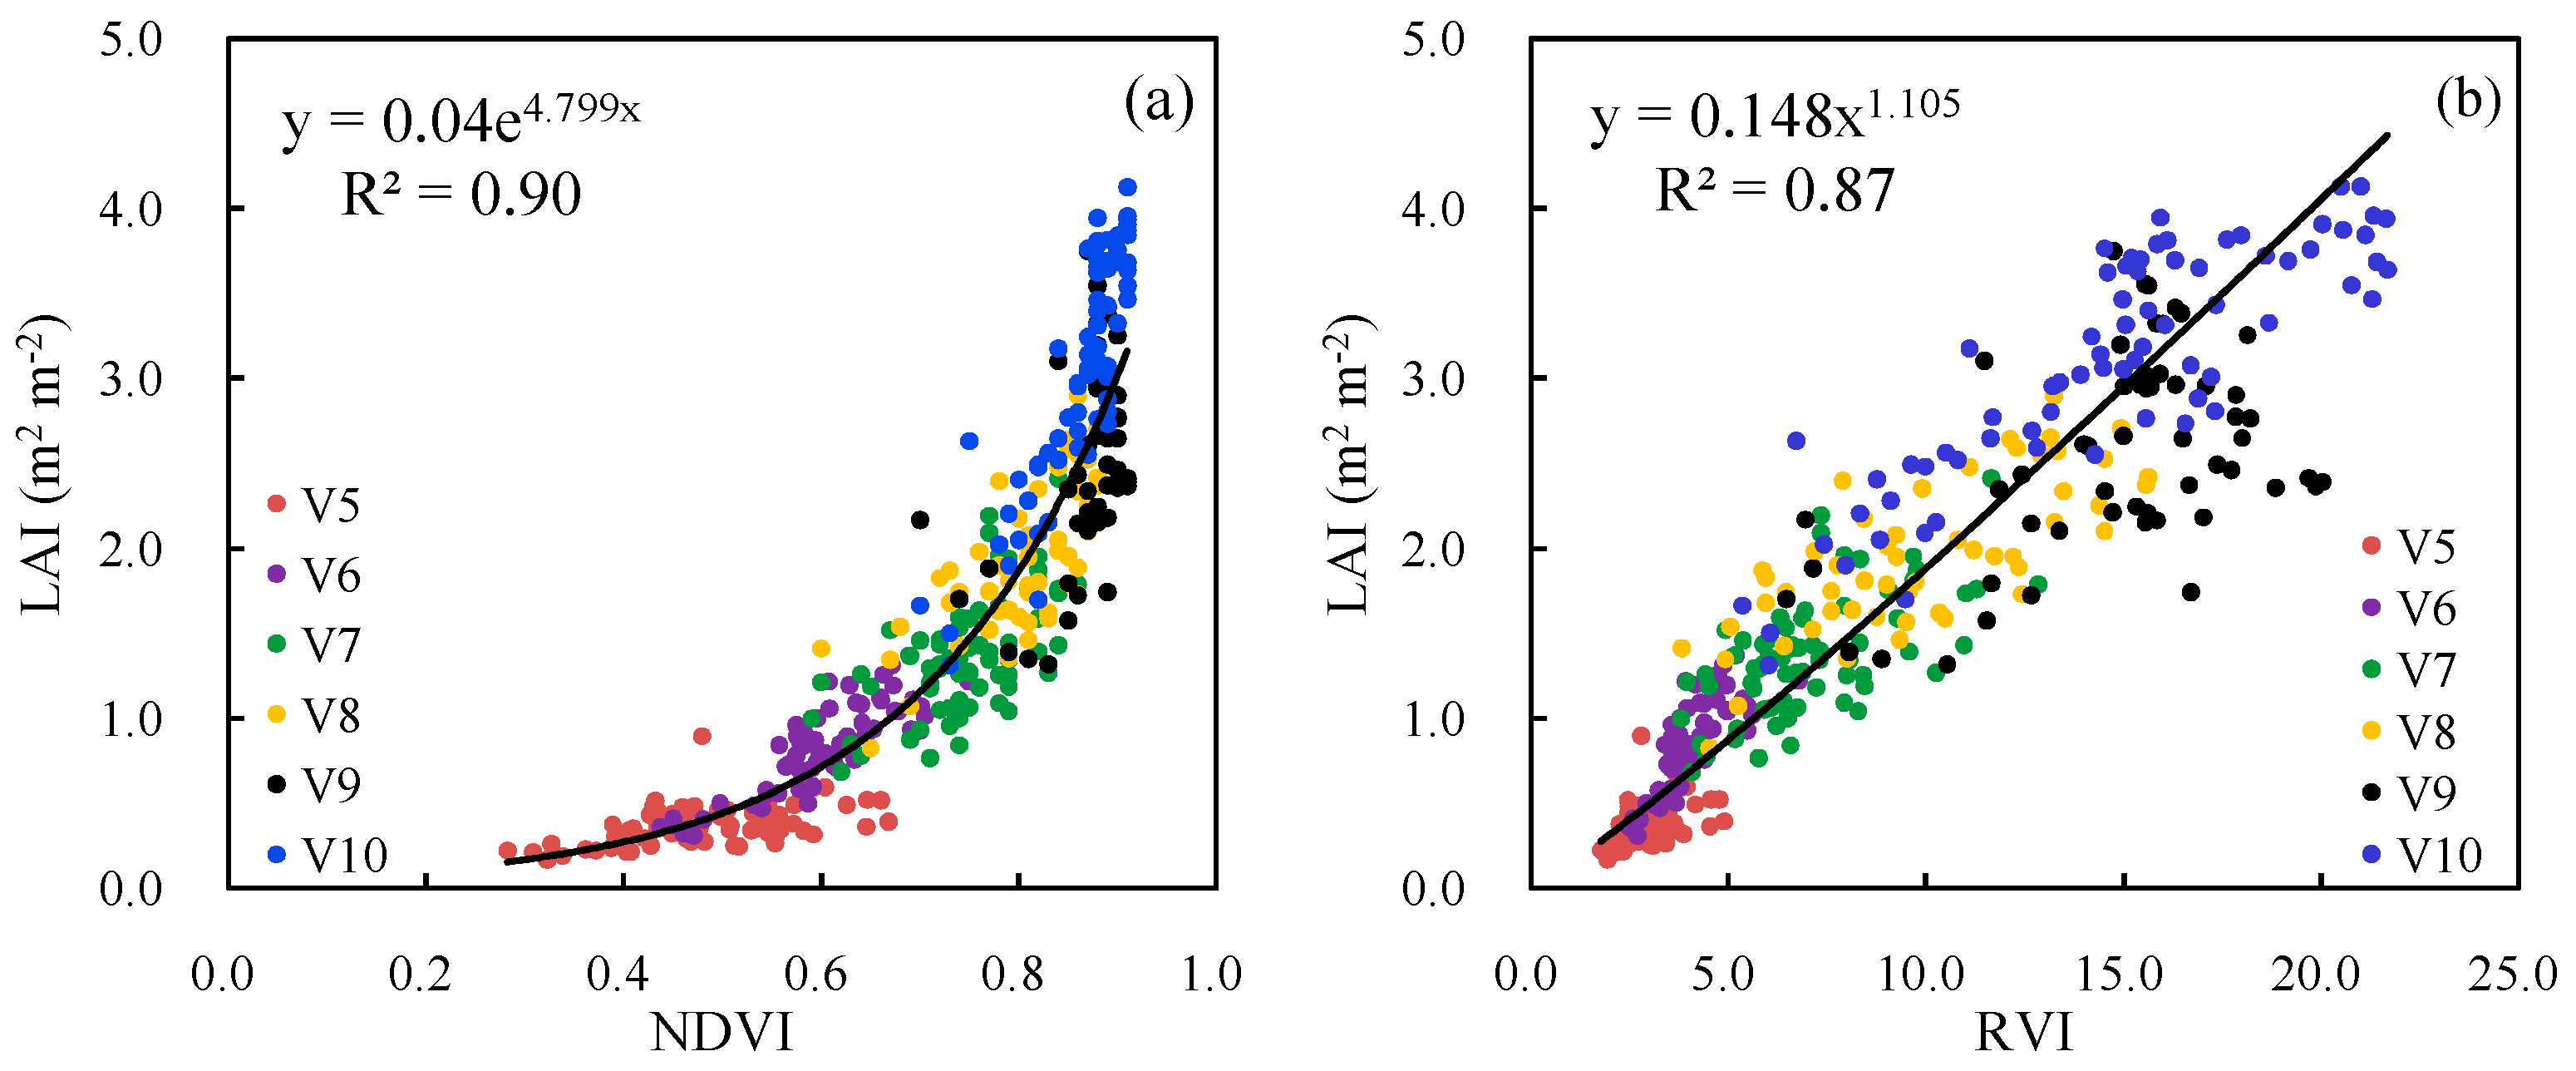
19]. Nguy-Robertson et al. [38] also reported that the NDVI index was most sensitive to LAI below 2 m2·m−2, while ratio indices (e.g., RVI) were most sensitive to LAI above this threshold. They suggested that NDVI and RVI should be combined for estimating LAI for improved sensitivity [38]. This possibility should be evaluated for estimating maize AGB.
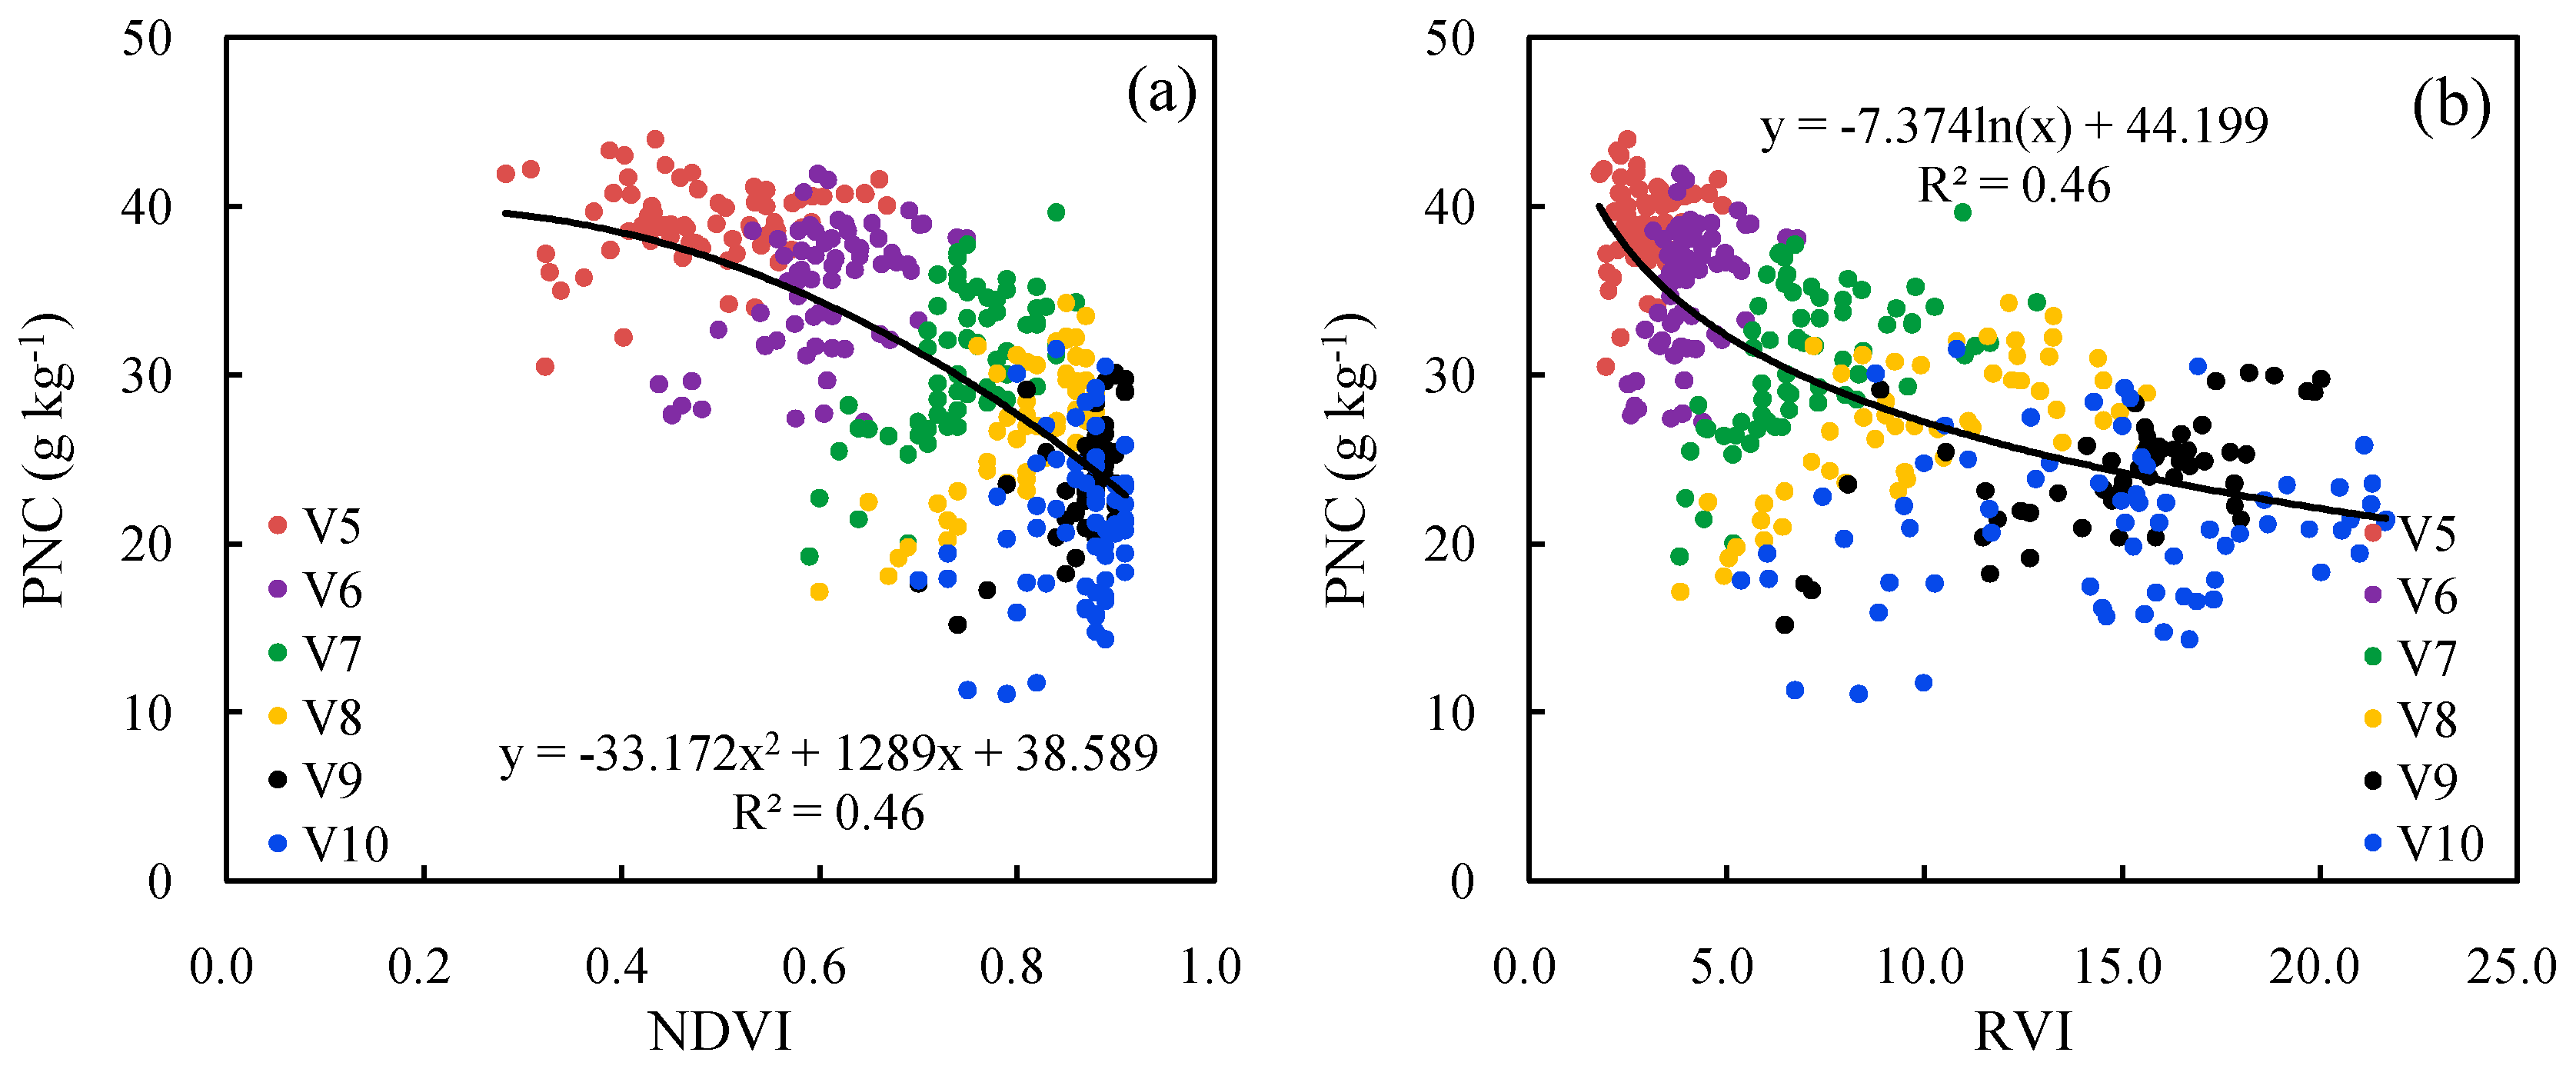
Maize PNC was slightly better estimated using the GreenSeeker sensor across growth stages (R2 = 0.46) than the results previously reported for rice (R2 < 0.40) [19] and winter wheat (R2 = 0.08–0.41) [5]. The results for specific growth stages were much worse. Such results confirmed the difficulty to reliably estimate PNC at early crop growth stages before canopy closure, mainly because AGB increases faster than the plant uptake of N during this period and dominates canopy reflectance [5,19,39]. The influence of the soil background may not be a problem, because the active light intensity decreases with measuring distance and follows the inverse square law, and the GreenSeeker sensing depth was confined to the upper canopy layer [40]. It has been found that the canopy chlorophyll content index (CCCI) based on the theory of two-dimensional planar domain was highly related to summer maize PNC at the V6–V7 growth stages (R2 = 0.65–0.68) [41]. This integrated index uses NDVI as a surrogate for ground cover to separate soil signal from plant signal and normalized difference red edge (NDRE) as a measure of canopy N status, thus allowing a relative measure of plant N status while minimizing the influence of ground cover [42]. Li et al. [41] used passive hyperspectral reflectance data to simulate the bands of active sensor Crop Circle ACS 430, and calculated CCCI. However, it should be noted that the passive canopy sensors can detect the N status of the entire maize foliage, while active optical sensors can only detect the upper canopy layer [40]. Therefore, the performance of AOS-based CCCI for estimating maize PNC has yet to be confirmed.
The estimation of PNC can also be improved using hyperspectral remote sensing. Chen et al. [43] proposed a new spectral index, Double-peak Canopy Nitrogen Index (DCNI), which worked well for estimating maize PNC (R2 = 0.72). Cilia et al. [9] used aerial hyperspectral remote sensing and found an integrated index, Modified Chlorophyll Absorption Ratio Index/Modified Triangular Vegetation Index 2 (MCARI/MTVI2), performed well for estimating maize PNC (R2 = 0.59), and they used this mechanistic method to estimate maize NNI (R2 = 0.70). Chen [16] also found that when using hyperspectral canopy sensing, this mechanistic method worked very well for winter wheat NNI estimation (R2 = 0.82–0.94 for validation results).
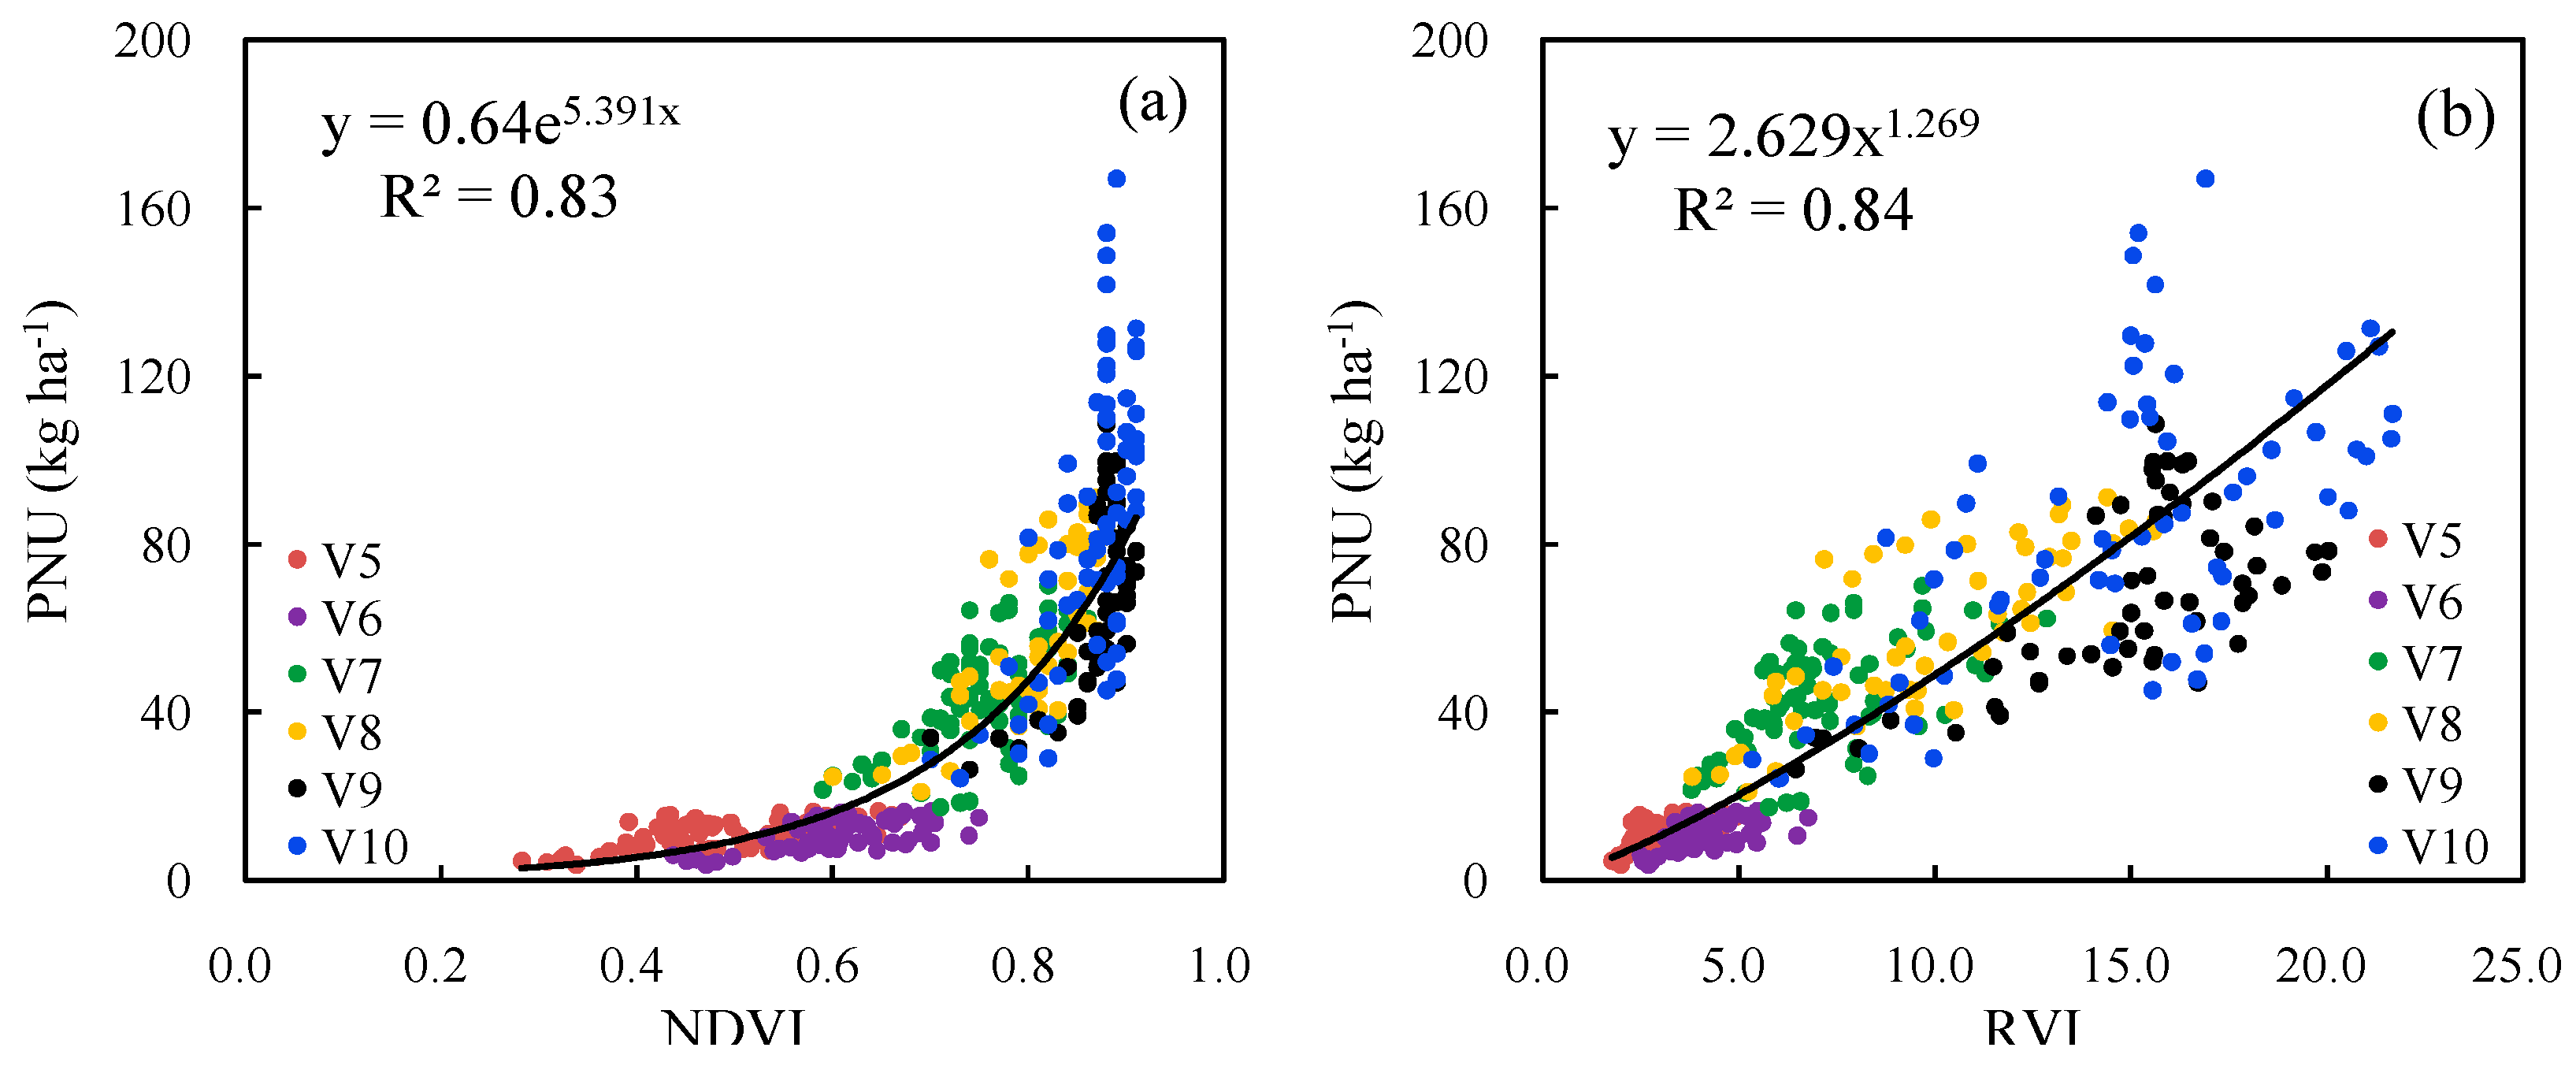
The second approach is NNI–PNU–NDVI (or RVI), which is also a mechanistic method requiring the estimation of AGB and PNU. Maize PNU was well estimated across growth stages (R2 = 0.83–0.84), but GreenSeeker NDVI became saturated when PNU reached about 80 kg·ha−1, which was lower than the values reported for rice (about 100 kg·ha−1) [19] and winter wheat (131–135 kg·ha−1) [5,32]. Perhaps this threshold value was affected by the plant height. Maize plants are much taller than rice and winter wheat and the GreenSeeker sensor can only sense the upper canopy layer [40]. Freeman et al. [44] found a new index, NDVI × Plant height, to be an excellent predictor of maize PNU and performed well in later growth stages (V11-R1 growth stages). This should be investigated to overcome the saturation problem of NDVI. This mechanistic method has also been taken for rice NNI estimation [10].
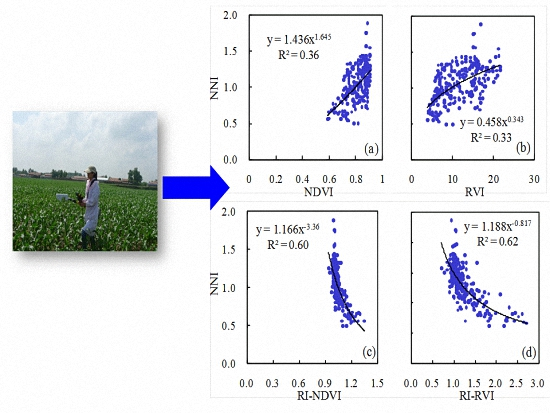
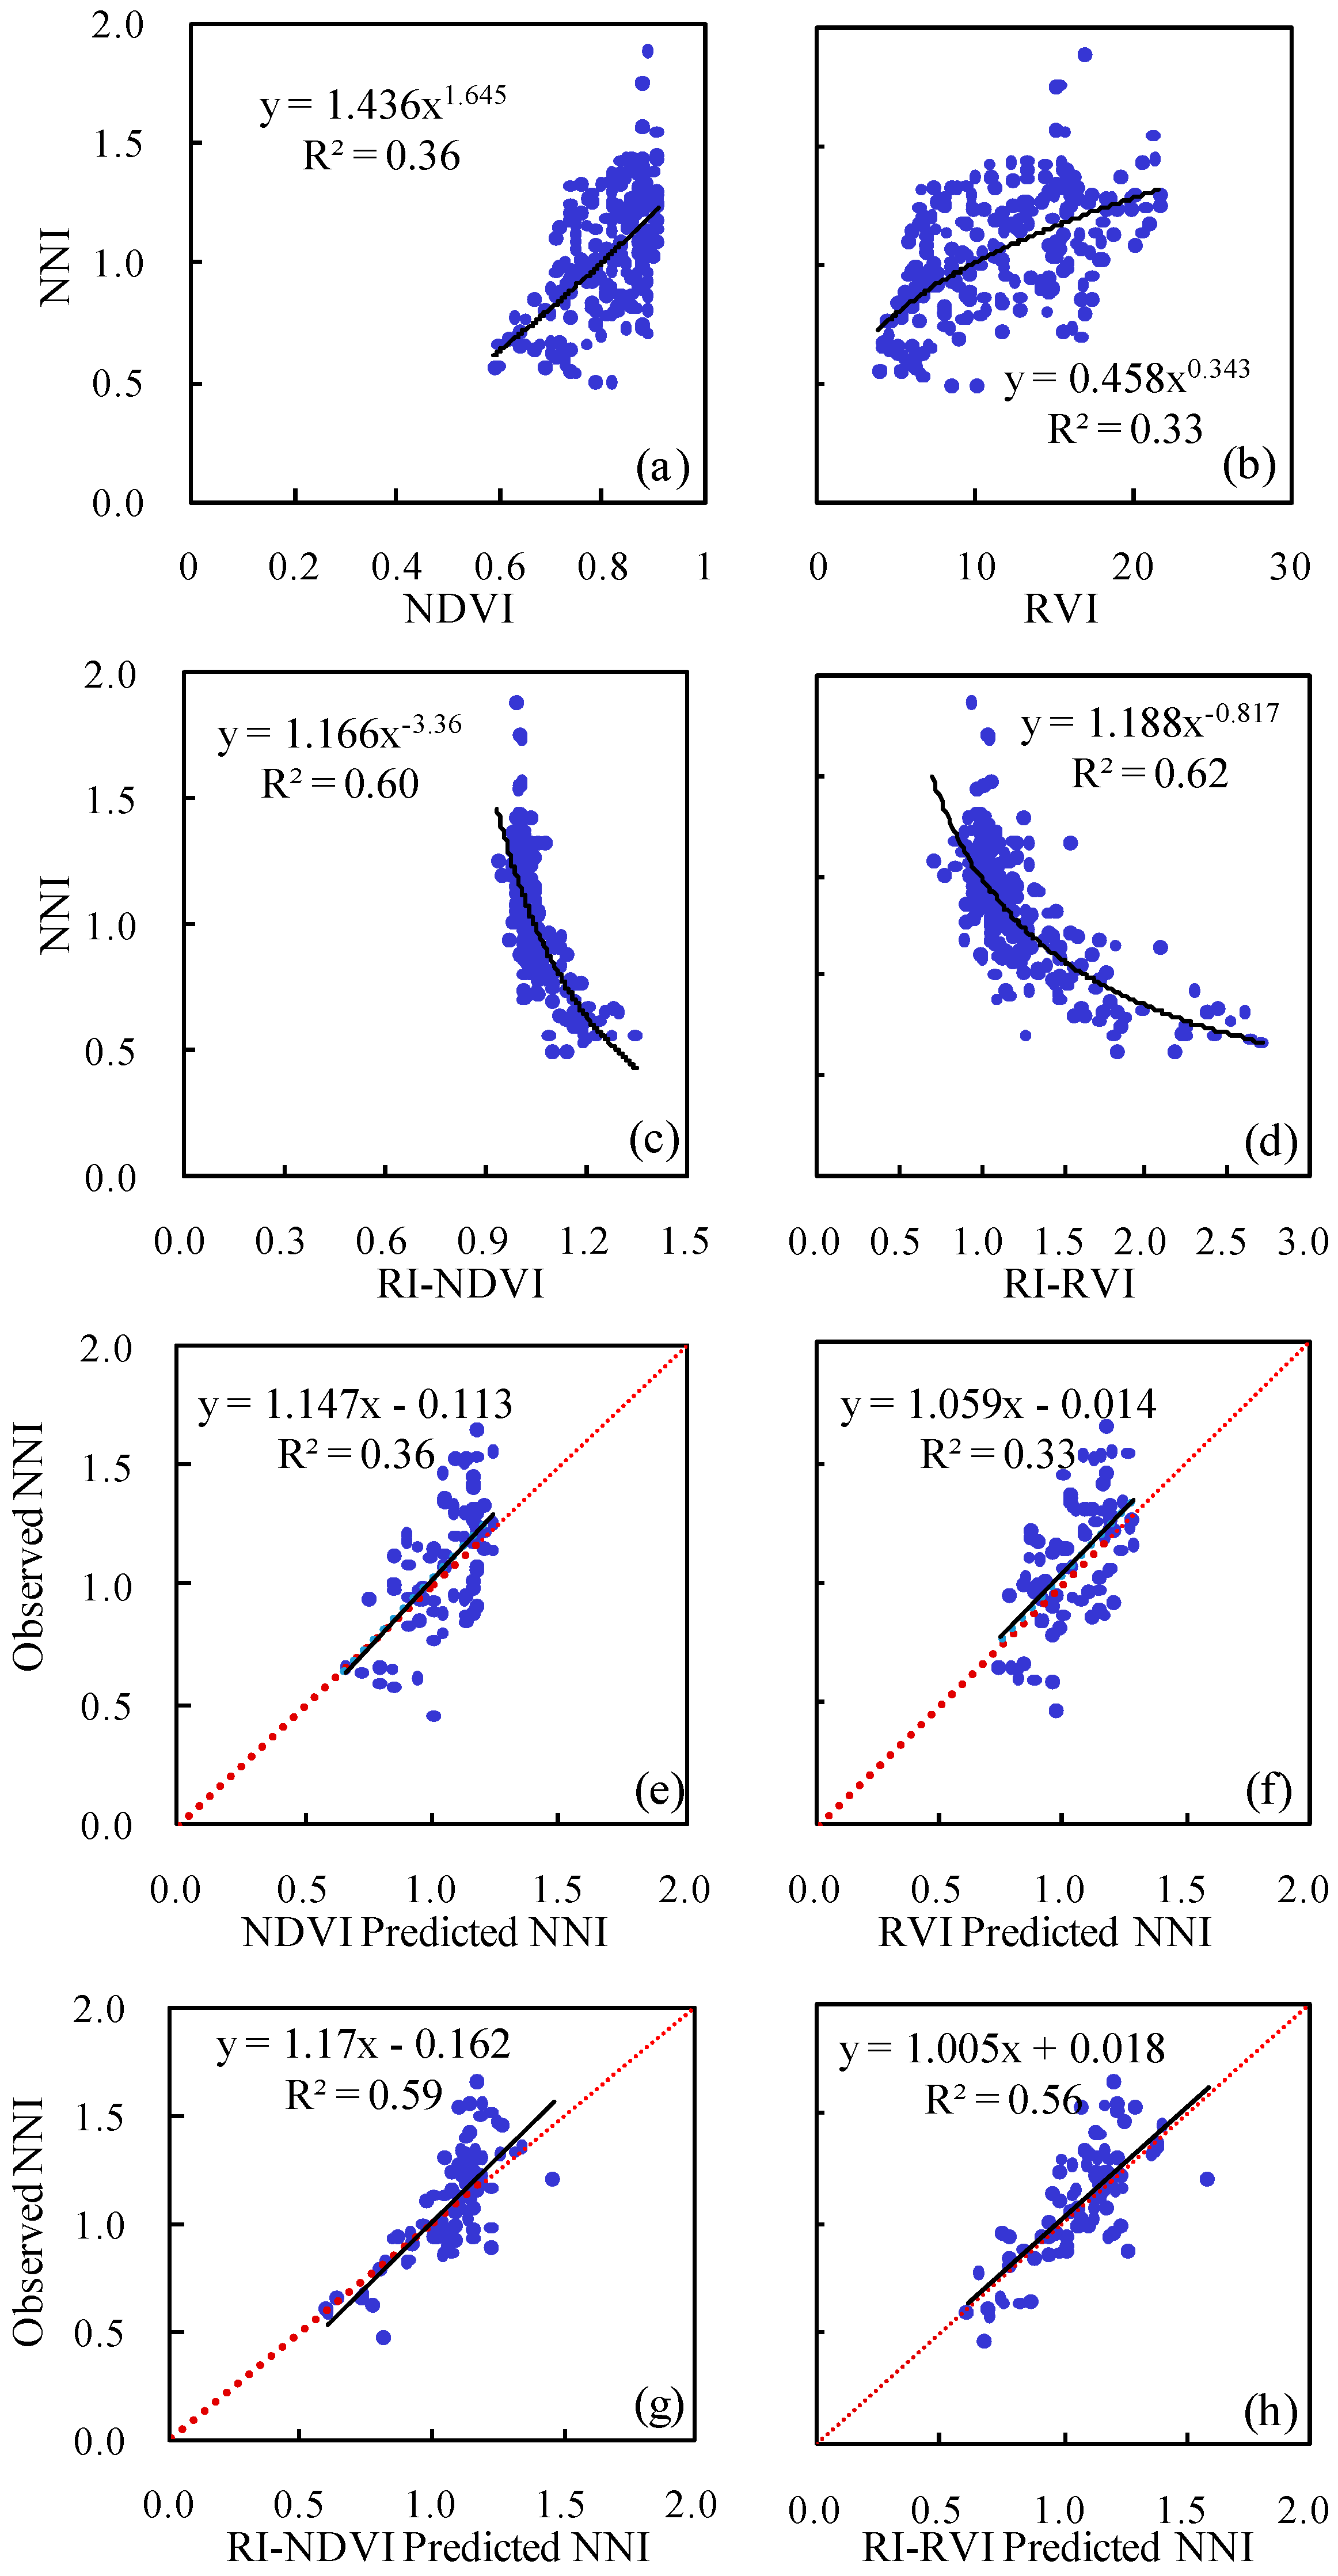
The third approach is NNI–NDVI (or RVI), which is a semi-empirical method. The results of this study indicated that maize NNI was better estimated using the GreenSeeker sensor at specific growth stages than across growth stages. This agreed with previous results reported for other crops [5,16,19]. For rice, GreenSeeker VIs were moderately related to NNI at stem elongation (R2 = 0.25–0.34) and heading (R2 = 0.30–0.31) stages, but only weekly across growth stages (R2 = 0.07–0.11) [19]. For winter wheat, the R2 values for the relationships between GreenSeeker VIs and NNI were 0.52–0.54, 0.55–0.64 and 0.44–0.47 at Feekes growth stages 4–7, 8–10, and across growth stages, respectively [5]. This may be due to the fact that NNI is a relative value not significantly influenced by growth stages while GreenSeeker NDVI and RVI are significantly related to AGB, which increases very fast at the vegetative growth stages. The sensitivity to the influence of phenology (or growth stages) will limit the practical application of this semi-empirical method for NNI estimation [16].
The fourth approach, NNI–RI–NDVI (or RVI), is also a semi-empirical method, but it performed consistently well either across growth stages or at specific growth stages (R2 = 0.56–0.68). The RI is a relative value normalized by the well-fertilized reference plots, which have been commonly used to reduce the influence of other confounding factors on sensor-based N status diagnosis and eliminate the need to develop site-specific calibrations [45]. A similar approach using relative CM readings was used to improve estimation of maize NNI in Canada [13]. This approach effectively overcame the influence of phenology on the performance of the first semi-empirical approach for estimating NNI.

4.2. In-Season Non-Destructive Diagnosis of Maize N Status

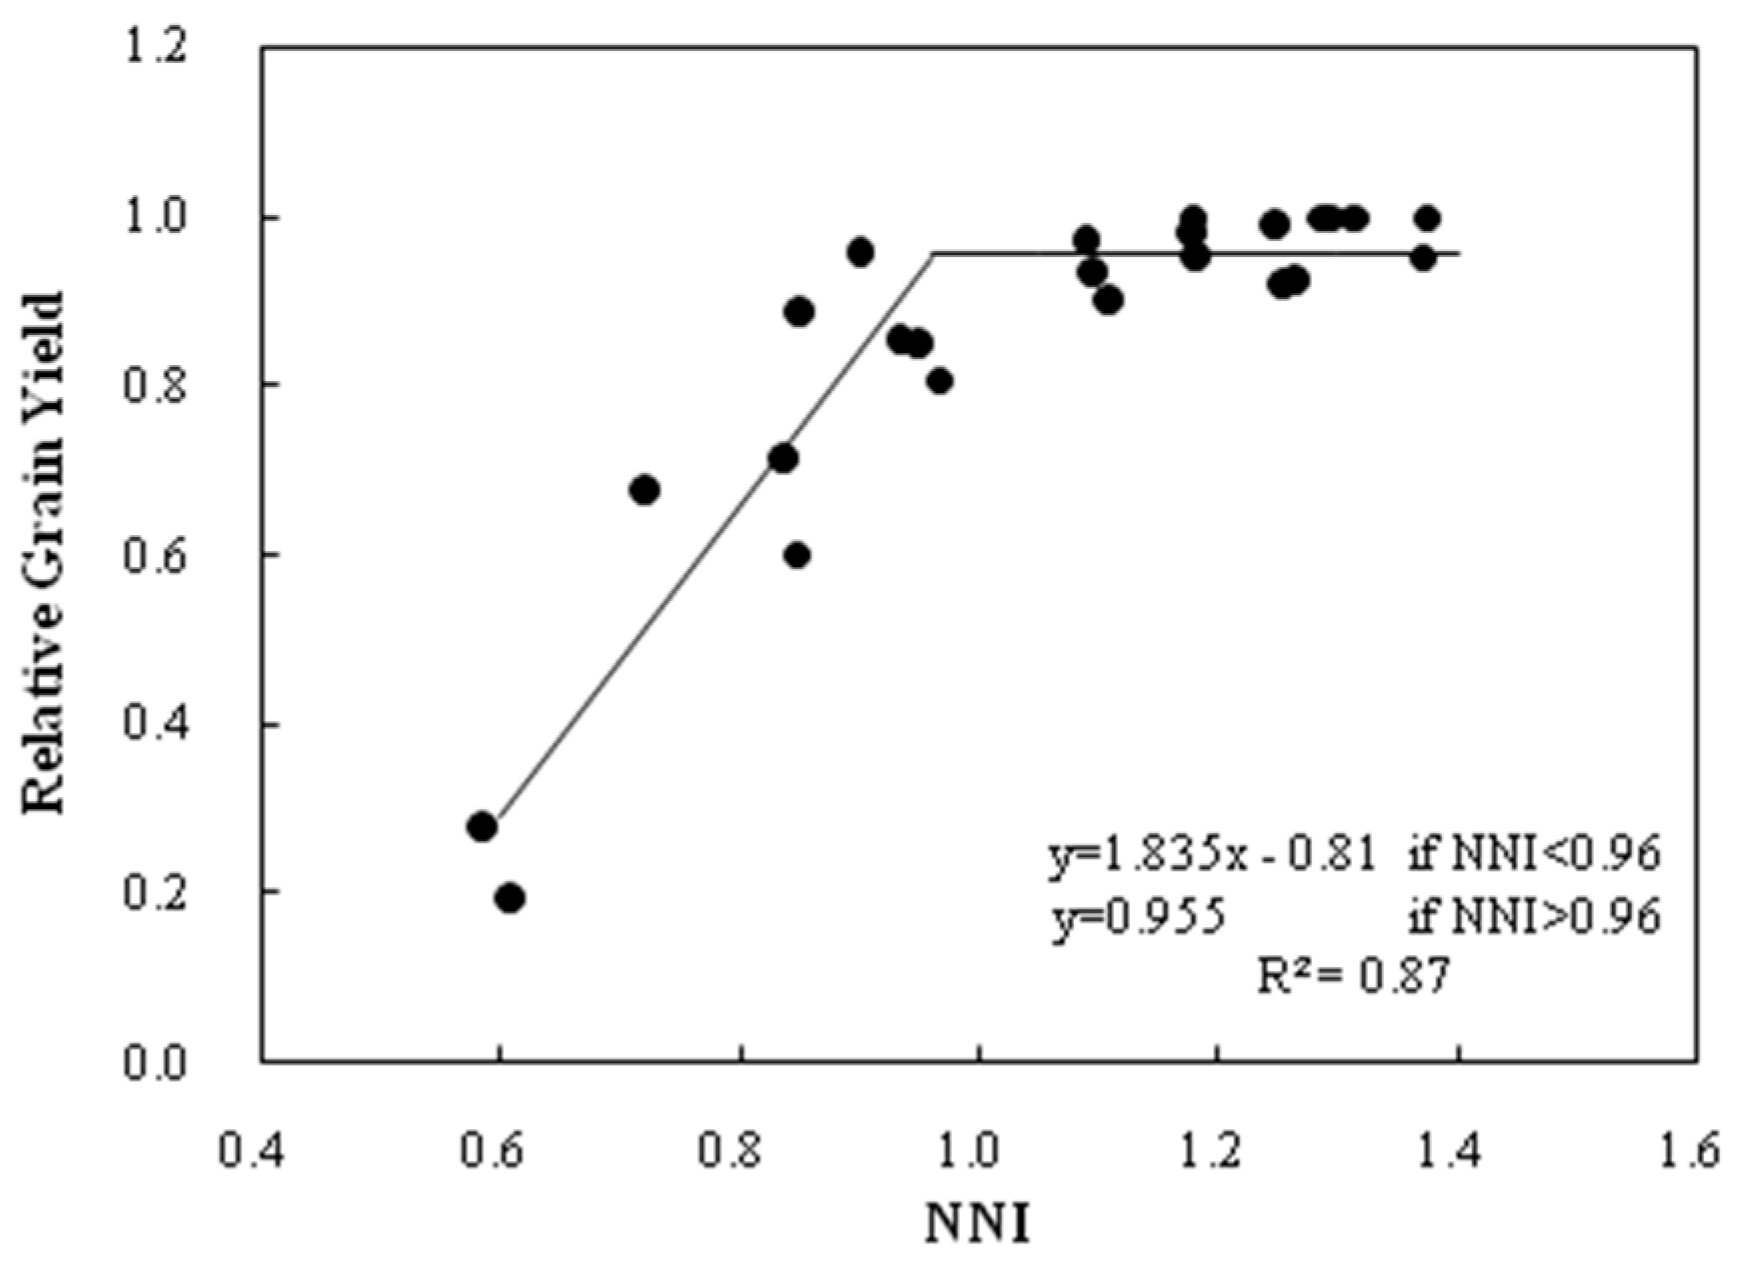
After maize NNI is non-destructively predicted, it is necessary to determine the threshold values. Based on the relationship between relative yield and NNI (Figure 4), the NNI thresholds of <0.95, 0.95–1.05, and >1.05 were proposed to indicate deficient, optimal, and surplus N status. The lower threshold value of 0.95 was chosen with the consideration to be on the conservative side and grain yield would not be reduced significantly. These threshold values were the same as those proposed by Huang et al. [10] for rice and were more suitable for this study than the thresholds proposed by Cilia et al. [9] for maize. If the lower threshold value of 0.9 as proposed by Cilia et al. [9] was adopted, the relative yield would be 0.84, which was 16% yield reduction compared with 100% relative yield or it would be 0.88 compared with 95.5% relative yield (when NNI was >0.96), which was 12% yield reduction. This would not be acceptable to farmers. Such threshold values may need to be adjusted for different regions.
Based on the predicted NNI using the four approaches discussed previously and the NNI threshold values, maize N status can be diagnosed. The results of this study indicated that the NNI–RI–NDVI approach performed the best at the V7–V8 stage, with accuracy rate of 76%. The fifth approach used the relationship between NNI and RI–NDVI (or RI–RVI), and determined the corresponding threshold values of RI–NDVI (or RI–RVI) when NNI was 0.95 and 1.05. Such RI–NDVI (or RI–RVI) threshold values can be used directly for N status diagnosis without the need to predict NNI. The results of this study indicated that the RI–NDVI approach performed even better than NNI–RI–NDVI at the V7–V8 stage, with the accuracy rate of 81%. The RI was proposed by Johnson and Raun [46] to predict the crop response to additional N fertilizer application and previous research results indicated that RI–NDVI and grain yield at harvest were significantly correlated [47,48]. At the V9–V10 stages, all the five approaches performed similarly. These results indicated that the RI–NDVI approach was a reliable and simple approach that can be easily adopted by farmers. More studies are needed to determine if these threshold values are applicable across diverse on-farm conditions in Northeast China.

4.3. Implications for Precision Nitrogen Management of Spring Maize

The N fertilizer application rates by farmers varied significantly from farmer to farmer with the proportion of under-application, optimum rate and over-application being about 1/3 each, respectively [4]. The first step to improve the farmer’s N management is to recommend a regional optimum N rate (RONR). A moderate amount of the RONR can be applied as basal fertilizer, and AOS can be used to diagnose the crop N status before side-dressing N application and the actual side-dressing N rate can be adjusted based on the N status diagnosis results [18]. Although the critical N dilution curve for spring maize in Northeast China has been established [24], it is still not practical to use NNI for in-season site-specific N status diagnosis.
The results of this study indicated that the GreenSeeker AOS could be used to estimate spring maize NNI non-destructively, especially using RI–NDVI or RI–RVI. The diagnosis accuracy rate was acceptable at V7–V8 and V9–V10 growth stages (71%–81%). The V7–V8 stage was the optimum stage recommended for side-dressing N application. Sometimes it can be delayed to V9–V10 stage due to bad weather or labor shortage. Theoretically, the normalization of GreenSeeker VIs using the well-fertilized reference plots or strips in the form of RI will eliminate the need for site-specific calibrations of the established relationships or models and this would greatly facilitate the application of NNI for in-season site-specific N status diagnosis. Based on the results of this study, it is recommended that RI–NDVI should be used to diagnose maize N status directly at V7–V8 growth stages while either RI–NDVI or RI–RVI can be used at the V9–V10 growth stages. This makes it more practical and convenient to use the sensors for in-season N status diagnosis without the need to estimate NNI after the threshold values are established. Further studies are needed to evaluate these threshold values and determine how many N rich strips should be used, how they should be arranged, and how to account for the variability within the reference strip(s) [49], especially under small scale Chinese farming systems.
After maize N status is determined, the side-dressing N rate of the RONR can be increased or decreased by a fixed amount if the crop N status is N deficient or N surplus. A more quantitative approach proposed by Huang et al. [10] is to use remote sensing technology to estimate biomass and PNU before side-dressing N application, and the difference between PNU and PNUc can be calculated. The final side-dressing N application rate can be calculated as side-dressing N rate of RONR—(PNU–PNUc). In addition to the NNI approach, the side-dressing N application rate can be determined using the N fertilizer optimization algorithm [50] or empirical relationships between relative sensor readings and side-dressing N rates [51].
Cilia et al. [9] evaluated an aerial hyperspectral remote sensing approach to estimate maize NNI at V10 growth stage. They suggested to use remote sensing technology to estimate maize biomass (R2 = 0.80) and PNC (R2 = 0.59), NNI can be calculated using the estimated PNC and the calculated Nc. They found that the mean NNI estimated for each field parcel was significantly correlated with the NNI determined destructively (R2 = 0.70). Our results indicated that similar results could be achieved with the GreenSeeker sensor. For large area applications of the proposed approaches, satellite or aerial remote sensing technologies may be more practical. However, images cannot be obtained under bad weather or cloudy conditions which can limit their on-farm applications. The active sensing systems don’t have such limitations. They have been installed on fertilizer application machines and on-the-go sensing and variable rate side-dressing N application have already been conducted [51]. Such N sensing and fertilizer application systems need to be developed and evaluated in China. Future research also needs to investigate the potential of improving spring maize N status diagnosis using active canopy sensors with red edge band like Crop Circle ACS-470 or Crop Circle ACS-430 sensors (Holland Scientific, Lincoln, NE, USA) [5,41].
Although active sensors are advantageous since they are not influenced by the ambient light conditions, their disadvantages of reducing light intensity with measuring distance cannot be ignored, especially for tall row crops [40,52]. The measuring distance between the GreenSeeker sensor and the crop canopy should be maintained in the range of 0.7–1.4 m to collect stable sensor readings [52]. The Crop Circle ACS-430 sensor has a unique feature that the reflectance data collected by this sensor are not affected by measuring distance in the range of 0.3–2.0 m. It also has a red edge band, in addition to red and NIR bands. A recent study indicated that the GreenSeeker VIs were not significantly related to rice yield or rice yield responsiveness to N fertilization at the heading stage, while red edge-based VIs obtained with Crop Circle ACS-470 sensor were still significantly related to these parameters (R2 = 0.68–0.75) and effectively overcame the saturation problem of NDVI [53]. More studies are needed to determine the potential of Crop Circle sensor to improve crop N status diagnosis and side-dressing N recommendation for maize.
One thing to be noted is that only two plant samples were collected from each plot in this study, due to the challenge to collect large number of maize plant samples with high frequencies. Care was taken to determine plant height and leaf age of five randomly selected plant samples in each plot and use this information as reference to select two representative plant samples for destructive sampling and analysis. Chen et al. [54] also collected three maize plants in their research. Even so, future research should consider increasing sampling size to minimize errors.

5. Conclusions

This study evaluated the potential of using GreenSeeker active optical sensor for estimating N status indicators of spring maize in Northeast China and evaluated different N status diagnostic approaches based on estimated NNI via GreenSeeker sensor measurements. The results of this study indicated that the recently established critical N dilution curve was suitable for applications in spring maize N status diagnosis in Northeast China. The GreenSeeker sensor-based VIs (NDVI and RVI) were significantly related to LAI (R2 = 0.87–0.90), AGB (R2 = 0.87–0.89) and PNU (R2 = 0.83–0.84) across growth stages. However, NDVI became saturated when LAI > 2 m2·m−2, AGB > 3 t·ha−1 or PNU > 80 kg·ha−1, while no obvious saturation effect was found with RVI. The GreenSeeker sensor performed better for estimating these parameters at V5–V6 and V7–V8 than at V9–V10 growth stages. The GreenSeeker indices were very weakly related to PNC at specific growth stages and were better related to PNC across growth stages (R2 = 0.46). The response index calculated with GreenSeeker NDVI (RI–NDVI) and RVI (RI–RVI) were more stable and strongly related to NNI either at specific growth stages or across growth stages (R2 = 0.56–0.68) than NDVI and RVI (R2 = 0.33–0.55). The N status diagnosis results indicated RI–NDVI could be used to diagnose spring maize N status directly with the diagnosis accuracy rate of 81% and 71% at V7–V8 and V9–V10 growth stages, respectively. We conclude that the GreenSeeker active optical sensor can be used to estimate spring maize nitrogen nutrition index non-destructively across V7 and V10 growth stages under experimental conditions with variable N supplies. The response indices calculated with GreenSeeker NDVI and RVI can be used to diagnose spring maize N status directly at V7–V8 and V9–V10 growth stages. More studies are needed to further evaluate this approach under diverse on-farm conditions and develop site-specific side-dressing N recommendation methods.

Acknowledgments

This work was financially supported by National Basic Research Program (2015CB150405), the Innovative Group Grant of Natural Science Foundation of China (31421092), and the 948 Project of Ministry of Agriculture (2011-G18).

Author Contributions

Yuxin Miao and Guohua Mi conceived and guided the study. Tingting Xia, Dali Wu and Hui Shao conducted the field experiments. Tingting Xia performed the data analysis. Tingting Xia and Yuxin Miao wrote the paper. Rajiv Khosla and Guohua Mi provided suggestions for the study, reviewed and edited the manuscript.

Conflicts of Interest

The authors declare no conflict of interest.

References

  1. FAOSTAT Agriculture Database. Available online: http://faostat.fao.org/site/339/default.aspx (accessed on 22 March 2016).
  2. Guo, J.H.; Liu, X.J.; Zhang, Y.; Shen, J.L.; Han, W.X.; Zhang, W.F.; Christie, P.; Goulding, K.W.T.; Vitousek, P.M.; Zhang, F.S. Significant acidification in major Chinese croplands. Science 2010, 327, 1008–1010. [Google Scholar] [CrossRef] [PubMed] [Green Version]
  3. Le, C.; Zha, Y.; Li, Y.; Sun, D.; Lu, H.; Yin, B. Eutrophication of lake waters in China: Cost, causes, and control. J. Environ. Manag. 2010, 45, 662–668. [Google Scholar] [CrossRef] [PubMed]
  4. Miao, Y.; Stewart, B.A.; Zhang, F. Long-term experiments for sustainable nutrient management in China. A review. Agron. Sustain. Dev. 2011, 31, 397–414. [Google Scholar] [CrossRef]
  5. Cao, Q.; Miao, Y.; Feng, G.; Gao, X.; Li, F.; Liu, B.; Yue, S.; Cheng, S.; Ustin, S.; Khosla, R. Active canopy sensing of winter wheat nitrogen status: An evaluation of two sensor systems. Comput. Electron. Agric. 2015, 112, 54–67. [Google Scholar] [CrossRef]
  6. Miao, Y.; Mulla, D.J.; Randall, G.W.; Vetsch, J.A.; Vintila, R. Combining chlorophyll meter readings and high spatial resolution remote sensing images for in-season site-specific nitrogen management of corn. Precis. Agric. 2009, 10, 45–62. [Google Scholar] [CrossRef]
  7. Lemaire, G.; Jeuffroy, M.H.; Gastal, F. Diagnosis tool for plant and crop N status in vegetative stage: Theory and practices for crop N management. Eur. J. Agron. 2008, 28, 614–624. [Google Scholar] [CrossRef]
  8. Plénet, D.; Lemaire, G. Relationships between dynamics of nitrogen uptake and dry matter accumulation in maize crops. Determination of critical N concentration. Plant Soil 1999, 216, 65–82. [Google Scholar] [CrossRef]
  9. Cilia, C.; Panigada, C.; Rossini, M.; Meroni, M.; Busetto, L.; Amaducci, S.; Boschetti, M.; Picchi, V.; Colombo, R. Nitrogen status assessment for variable rate fertilization in maize through hyperspectral imagery. Remote Sens. 2014, 6, 6549–6565. [Google Scholar] [CrossRef] [Green Version]
  10. Huang, S.; Miao, Y.; Zhao, G.; Yuan, F.; Ma, X.; Tan, C.; Yu, W.; Gnyp, M.L.; Lenz-Wiedemann, V.I.S.; Rascher, U.; et al. Satellite remote sensing-based in-season diagnosis of rice nitrogen status in Northeast China. Remote Sens. 2015, 7, 10646–10667. [Google Scholar] [CrossRef]
  11. Cao, Q.; Cui, Z.; Chen, X.; Khosla, R.; Dao, T.H.; Miao, Y. Quantifying spatial variability of indigeneous nitrogen supply for precision nitrogen management in small scale farming. Precis. Agric. 2012, 13, 45–61. [Google Scholar] [CrossRef]
  12. Zhao, B.; Liu, Z.; Ata-Ul-Karim, S.T.; Xiao, J.; Liu, Z.; Qi, A.; Ning, D.; Nan, J.; Duan, A. Rapid and nondestructive estimation of the nitrogen nutrition index in winter barley using chlorophyll measurements. Field Crops Res. 2016, 185, 59–68. [Google Scholar] [CrossRef]
  13. Ziadi, N.; Brassard, M.; Bélanger, G.; Claessens, A.; Tremblay, N.; Cambouris, A.N.; Nolin, M.C.; Parent, L.-É. Chlorophyll measurements and nitrogen nutrition index for the evaluation of corn nitrogen status. Agron. J. 2008, 100, 1264–1273. [Google Scholar] [CrossRef]
  14. Chen, P.; Wang, J.; Huang, W.; Tremblay, N.; Ouyang, Z.; Zhang, Q. Critical nitrogen curve and remote detection of nitrogen nutrition index for corn in the Northwestern Plain of Shandong Province, China. IEEE J. Sel. Top. Appl. Earth Obs. Remote Sens. 2013, 6, 682–689. [Google Scholar] [CrossRef]
  15. Mistele, B.; Schmidhalter, U. Estimating the nitrogen nutrition index using spectral canopy reflectance measurements. Eur. J. Agron. 2008, 29, 184–190. [Google Scholar] [CrossRef]
  16. Chen, P. A comparison of two approaches for estimating the wheat nitrogen nutrition index using remote sensing. Remote Sens. 2015, 7, 4527–4548. [Google Scholar] [CrossRef]
  17. Holland, K.H.; Lamb, D.W.; Schepers, J.S. Radiometry of proximal active optical sensors (AOS) for agricultural sensing. IEEE J. Sel. Top. Appl. Earth Obs. Remote Sens. 2012, 5, 1793–1802. [Google Scholar] [CrossRef]
  18. Yao, Y.; Miao, Y.; Huang, S.; Gao, L.; Zhao, G.; Jiang, R.; Chen, X.; Zhang, F.; Yu, K.; Gnyp, M.L.; et al. Active canopy sensor-based precision N management strategy for rice. Agron. Sustain. Dev. 2012, 32, 925–933. [Google Scholar] [CrossRef]
  19. Yao, Y.; Miao, Y.; Cao, Q.; Wang, H.; Gnyp, M.L.; Bareth, G.; Khosla, R.; Yang, W.; Liu, F.; Liu, C. In-season estimation of rice nitrogen status with an active crop canopy sensor. IEEE J. Sel. Top. Appl. Earth Obs. Remote Sens. 2014, 7, 4403–4413. [Google Scholar] [CrossRef]
  20. Martin, K.L.; Girma, K.; Freeman, K.W.; Teal, R.K.; Tubańa, B.; Arnall, D.B.; Chung, B.; Walsh, O.; Solie, J.B.; Stone, M.L.; et al. Expression of variability in corn as influenced by growth stage using optical sensor measurements. Agron. J. 2007, 99, 384–389. [Google Scholar] [CrossRef]
  21. Ritchie, S.W.; Hanway, J.J.; Benson, G.O. How a Corn Plant Develops; Special Report No. 48 (Revised); Iowa State University of Science and Technology, Cooperative Extension Service: Ames, IA, USA, 1997. [Google Scholar]
  22. Thomason, W.E.; Phillips, S.B.; Raymond, F.D. Defining useful limits for spectral reflectance measures in corn. J. Plant Nutr. 2007, 30, 1263–1277. [Google Scholar] [CrossRef]
  23. Yang, X.; Lin, E.; Ma, S.M.; Ju, H.; Guo, L.; Xiong, W.; Li, Y.; Xu, Y. Adaptation of agriculture to warming in Northeast China. Clim. Chang. 2007, 84, 45–58. [Google Scholar] [CrossRef]
  24. Li, W.; He, P.; Jin, J. Critical nitrogen curve and nitrogen nutrition index for spring maize in North-East China. J. Plant Nutr. 2012, 35, 1747–1761. [Google Scholar] [CrossRef]
  25. Soil Survey Staff. Keys to Soil Taxonomy; United States Department of Agriculture, Natural Resources Conservation Services: Washington, DC, USA, 1998; p. 328.
  26. Raper, T.B.; Varco, J.J.; Hubbard, K.J. Canopy-based normalized difference vegetation index sensors for monitoring cotton nitrogen status. Agron. J. 2013, 105, 1345–1354. [Google Scholar] [CrossRef]
  27. Montgomery, E.G. Correlation studies in corn. Neb. Agric. Exp. Stn. Annu. Rep. 1911, 24, 108–109. [Google Scholar]
  28. Nelson, D.W.; Sommers, L.E. Determination of total nitrogen in plant material. Agron. J. 1973, 65, 109–112. [Google Scholar] [CrossRef]
  29. Greenwood, D.J.; Lemaire, G.; Gosse, G.; Cruz, P.; Draycott, A.; Neeteson, J.J. Decline in percentage N of C3 and C4 crops with increasing plant mass. Ann. Bot. 1990, 66, 425–436. [Google Scholar]
  30. Ziadi, N.; Bélanger, G.; Claessens, A.; Lefebvre, L.; Cambouris, A.N.; Tremblay, N.; Nolin, M.C.; Parent, L.É. Determination of a critical nitrogen dilution curve for spring wheat. Agron. J. 2010, 102, 241–250. [Google Scholar] [CrossRef]
  31. Campbell, J.B. Introduction to Remote Sensing, 3rd ed.; The Guilford Press: New York, NY, USA, 2002. [Google Scholar]
  32. Li, F.; Miao, Y.; Chen, X.; Zhang, H.; Jia, L.; Bareth, G. Estimating winter wheat biomass and nitrogen status using an active crop sensor. Intell. Autom. Soft Comput. 2010, 16, 1221–1230. [Google Scholar]
  33. Hornung, A.; Khosla, R.; Reich, R.; Inman, D.; Westfall, D. Comparison of site-specific management zones: Soil color based and yield based. Agron. J. 2006, 98, 405–417. [Google Scholar] [CrossRef]
  34. Landis, J.R.; Koch, G.G. The measurement of observer agreement for categorical data. Biometrics 1977, 33, 159–174. [Google Scholar] [CrossRef] [PubMed]
  35. Erdle, K.; Mistele, B.; Schmidhalter, U. Comparison of active and passive spectral sensors in discriminating biomass parameters and nitrogen status in wheat cultivars. Field Crops Res. 2011, 124, 74–84. [Google Scholar] [CrossRef]
  36. Gnyp, M.L.; Miao, Y.; Yuan, F.; Ustin, S.L.; Yu, K.; Yao, Y.; Huang, S.; Bareth, G. Hyperspectral canopy sensing of paddy rice aboveground biomass at different growth stages. Field Crops Res. 2014, 155, 42–55. [Google Scholar] [CrossRef]
  37. Van Niel, T.G.; McVicar, T.R. Current and potential uses of optical remote sensing in rice-based irrigation systems: A review. Aust. J. Agric. Res. 2004, 55, 155–185. [Google Scholar] [CrossRef]
  38. Nguy-Robertson, A.; Gitelson, A.; Peng, Y.; Viñab, A.; Arkebauerc, T.; Rundquista, D. Green leaf area index estimation in maize and soybean: Combining vegetation indices to achieve maximal sensitivity. Agron. J. 2012, 104, 1336–1347. [Google Scholar] [CrossRef]
  39. Li, F.; Mistele, B.; Hu, Y.; Yue, X.; Yue, S.; Miao, Y.; Chen, X.; Cui, Z.; Meng, Q.; Schmid-halter, U. Remotely estimating aerial N status of phenologically differing winter wheat cultivars grown in contrasting climatic and geographic zones in China and Germany. Field Crops Res. 2012, 138, 21–32. [Google Scholar] [CrossRef]
  40. Winterhalter, L.; Mistele, B.; Schmidhalter, U. Evaluation of active and passive sensor systems in the field to phenotype maize hybrids with high-throughput. Field Crops Res. 2013, 154, 236–245. [Google Scholar] [CrossRef]
  41. Li, F.; Miao, Y.; Feng, G.; Yuan, F.; Yue, S.; Gao, X.; Liu, Y.; Liu, B.; Ustin, S.L.; Chen, X. Improving estimation of summer maize nitrogen status with red edge-based spectral vegetation indices. Field Crops Res. 2014, 157, 111–123. [Google Scholar] [CrossRef]
  42. Fitzgerald, G.; Rodriguez, D.; O’Leary, G. Measuring and predicting canopy nitrogen nutrition in wheat using a spectral index—The canopy chlorophyll content index (CCCI). Field Crops Res. 2010, 116, 318–324. [Google Scholar] [CrossRef]
  43. Chen, P.; Haboudane, D.; Tremblay, N.; Wang, J.; Vigneault, P.; Li, B. New spectral indicator assessing the efficiency of crop nitrogen treatment in corn and wheat. Remote Sens. Environ. 2010, 114, 1987–1997. [Google Scholar] [CrossRef]
  44. Freeman, K.W.; Girma, K.; Arnall, D.B.; Mullen, R.W.; Martin, K.L.; Teal, R.K.; Raun, W.R. By-plant prediction of corn forage biomass and nitrogen uptake at various growth stages using remote sensing and plant height. Agron. J. 2007, 99, 530–536. [Google Scholar] [CrossRef]
  45. Samborski, S.M.; Tremblay, N.; Fallon, E. Strategies to make use of plant sensors-based diagnostic information for nitrogen recommendations. Agron. J. 2009, 101, 800–816. [Google Scholar] [CrossRef]
  46. Johnson, G.V.; Raun, W.R. Nitrogen response index as a guide to fertilizer management. J. Plant Nutr. 2003, 26, 249–262. [Google Scholar] [CrossRef]
  47. Mullen, R.W.; Freeman, K.W.; Raun, W.R.; Johnson, G.V.; Stone, M.L.; Solie, J.B. Identifying an in-season response index and the potential to increase wheat yield with nitrogen. Agron. J. 2003, 95, 347–351. [Google Scholar] [CrossRef]
  48. Hodgen, P.J.; Raun, W.R.; Johnson, G.V.; Teal, R.K.; Freeman, K.W.; Brixey, K.B.; Martin, K.L.; Solie, J.B.; Stone, M.L. Relationship between response indices measured in-season and at harvest in winter wheat. J. Plant Nutr. 2005, 28, 221–235. [Google Scholar] [CrossRef]
  49. Bausch, W.C.; Brodahl, M.K. Strategies to evaluate goodness of reference strips for in-season, field scale, irrigated corn nitrogen sufficiency. Precis. Agric. 2012, 13, 104–122. [Google Scholar] [CrossRef]
  50. Tubana, B.S.; Arnall, D.B.; Walsh, O.; Chung, B.; Solie, J.B.; Girma, K.; Raun, W.R. Adjusting midseason nitrogen rate using a sensor-based optimization algorithm to increase use efficiency in corn. J. Plant Nutr. 2008, 31, 1393–1419. [Google Scholar] [CrossRef]
  51. Scharf, P.C.; Shannon, D.K.; Palm, H.L.; Sudduth, K.A.; Drummond, S.T.; Kitchen, N.R.; Mueller, L.J.; Hubbard, V.C.; Oliveira, L.F. Sensor-based nitrogen applications out-performed producer-chosen rates for corn in on-farm demonstrations. Agron. J. 2011, 103, 1683–1691. [Google Scholar] [CrossRef]
  52. Kipp, S.; Mistele, B.; Schmidhalter, U. The performance of active spectral reflectance sensors as influenced by measuring distance, device temperature and light intensity. Comput. Electron. Agric. 2014, 100, 24–33. [Google Scholar] [CrossRef]
  53. Cao, Q.; Miao, Y.; Shen, J.; Yu, W.; Yuan, F.; Cheng, S.; Huang, S.; Wang, H.; Yang, W.; Liu, F. Improving in-season estimation of rice yield potential and responsiveness to topdressing nitrogen application with Crop Circle active crop canopy sensor. Precis. Agric. 2016, 17, 136–154. [Google Scholar] [CrossRef]
  54. Chen, Y.; Xiao, C.; Chen, X.; Li, Q.; Zhang, J.; Chen, F.; Yuan, L.; Mi, G. Characterization of the plant traits contributed to high grain yield and high grain nitrogen concentration in maize. Field Crops Res. 2014, 159, 1–9. [Google Scholar] [CrossRef]
Figure 1. Accumulated rainfall (mm) every 10 days and corresponding average temperature (°C) for the growing season of spring maize in 2014 and 2015 in Lishu County, Jilin Province, China.
Remotesensing 08 00605 g001
Figure 2. Maize grain yield responses to N fertilizer application rates in different site-years.
Remotesensing 08 00605 g002
Figure 3. Evaluation of the existing critical N dilution curve for spring maize in Northeast China using plant N concentration and biomass data under N-limiting and non-N-limiting conditions (a); and under N deficient (nitrogen nutrition index (NNI) < 0.95), N optimal (0.95 ≤ NNI ≤ 1.05) and N surplus (NNI > 1.05) conditions (b). The critical N dilution curve was developed for spring maize by Li et al. [24] (Nc = 36.5 W−0.48).
Remotesensing 08 00605 g003
Figure 4. Relationships between relative grain yield and the N nutrition index (NNI) of spring maize. The NNI data were averaged over all sampling dates (V7, V8, V9, and V10).
Remotesensing 08 00605 g004
Figure 5. Relationships between leaf area index (LAI) and GreenSeeker sensor-based normalized difference vegetation index (NDVI) (a) or ratio vegetation index (RVI) (b) across V5 to V10 growth stages in 2014–2015.
Remotesensing 08 00605 g005
Figure 6. Relationships between the predicted and observed spring maize leaf area index (LAI) (a,b); aboveground biomass (AGB) (c,d); plant N concentration (PNC) (e,f); and plant N uptake (PNU) (g,h) for the validation dataset (n = 132) using the established model across growth stages with GreenSeeker sensor-based indices (normalized difference vegetation index (NDVI) and ratio vegetation index (RVI)). Black and red lines indicate the regression and the 1:1 lines, respectively.
Remotesensing 08 00605 g006
Figure 7. Relationships between aboveground biomass (AGB) and GreenSeeker sensor-based normalized difference vegetation index (NDVI) (a) or ratio vegetation index (RVI) (b) across V5 to V10 growth stage in 2014–2015.
Remotesensing 08 00605 g007
Figure 8. Relationships between plant N concentration (PNC) and GreenSeeker sensor-based normalized difference vegetation index (NDVI) (a) or ratio vegetation index (RVI) (b) across V5 to V10 growth stages in 2014 and 2015.
Remotesensing 08 00605 g008
Figure 9. Relationships between plant N uptake (PNU) and GreenSeeker sensor-based normalized difference vegetation index (NDVI) (a) or ratio vegetation index (RVI) (b) across V5 to V10 growth stages.
Remotesensing 08 00605 g009
Figure 10. Relationships between N nutrition index (NNI) and GreenSeeker sensor-based normalized difference vegetation index (NDVI) (a); ratio vegetation index (RVI) (b); response index based on NDVI (RI–NDVI) (c) or RVI (RI–RVI) (d) across V7 to V10 growth stages, and validation results for the prediction of NNI using NDVI (e); RVI (f); RI–NDVI (g); and RI–RVI (h). Black and red lines indicate the regression and the 1:1 lines, respectively.
Remotesensing 08 00605 g010
Table 1. Detailed information about the experiments conducted in this study in 2014 and 2015.
ExperimentPlanting DateHarvest DateSensing StagesSensing Date
2014
Site 16 May4 OctoberV5, V6, V7, V8, V9, V1012 June, 17 June, 22 June, 25 June, 29 June, 4 July
Site 227 April29 SeptemberV5, V6, V7, V8, V9, V1011 June, 18 June, 22 June, 25 June, 30 June, 5 July
2015
Site 13 May29 SeptemberV5, V6, V7, V8, V9, V1012 June, 17 June, 21 June, 24 June, 27 June, 4 July
Site 227 April3 OctoberV5, V6, V7, V1014 June, 23 June, 29 June, 5 July
Note: Due to bad weather conditions, sensor data and plant samples could not be collected at V8 and V9 at Site 2 in 2015.
Table 2. Descriptive statistics of spring maize leaf area index (LAI), aboveground biomass (AGB), plant N concentration (PNC), plant N uptake (PNU) and N nutrition index (NNI) for calibration and validation datasets at different growth stages across 2014 and 2015.
Growth StageLAI (m2·m−2)AGB (t·ha−1)PNC (g·kg−1)PNU (kg·ha−1)NNI
MeanSDCVMeanSDCVMeanSDCVMeanSDCVMeanSDCV
Calibration dataset
V5 (n = 72)0.380.12330.270.082939.02.4610.73.331
V6 (n = 72)0.840.25300.720.192635.03.81125.57.831
V7 (n = 72)1.400.37261.420.332430.94.21444.413.9311.000.2121
V8 (n = 54)1.950.44232.160.512326.94.21659.519.8331.070.2524
V9 (n = 54)2.540.60232.760.752724.23.31467.221.1311.070.2120
V10 (n = 72)3.090.69223.941.203021.14.52283.934.1411.110.3229
Across all stages (n = 396)1.651.06641.801.417830.07.32543.933.8771.060.2624
Validation dataset
V5 (n = 24)0.390.09240.260.072538.51.82510.02.727
V6 (n = 24)0.880.3340.720.213035.13.71125.68.935
V7 (n = 24)1.390.4291.530.432831.33.51148.315.5321.050.219
V8 (n = 18)1.950.45232.370.652827.64.41666.825.0371.140.326
V9 (n = 18)2.540.55222.650.642425.24.01661.923.7381.090.2120
V10 (n = 24)3.120.74244.011.263121.34.32082.938.0461.130.3128
Across all stages (n = 132)1.631.03641.851.457830.37.02361.151.1841.100.2625
Note: SD: standard deviation of the mean; CV: coefficient of variation (%).
Table 3. Coefficients of determination (R2) for the relationships between GreenSeeker indices (normalized difference vegetation index (NDVI) and ratio vegetation index (RVI)) and spring maize leaf area index (LAI), aboveground biomass (AGB), plant N concentration (PNC) and plant N uptake (PNU) at different growth stages across 2014 and 2015.
Growth StageIndexLAI (m2·m−2)AGB (t·ha−1)PNC (g·kg−1)PNU (kg·ha−1)
Model *R2ModelR2ModelR2ModelR2
V5–V6NDVIE0.67E0.66QNSE0.67
RVIP0.66Q0.63QNSP0.65
V7–V8NDVIQ0.58Q0.54Q0.24Q0.60
RVIQ0.59Q0.57Q0.21Q0.60
V9–V10NDVIQ0.44E0.38P0.13E0.50
RVIP0.48P0.42P0.11P0.52
Across all stagesNDVIE0.90E0.89Q0.46E0.83
RVIP0.87P0.87L0.46P0.84
Note: * E, P, Q and L stand for exponential, power, quadratic and linear models, respectively. NS stands for not significant.
Table 4. Validation results of the GreenSeeker sensor-based indices (normalized difference vegetation index (NDVI) and ratio vegetation index (RVI)) for estimating spring maize leaf area index (LAI), aboveground biomass (AGB), plant N concentration (PNC) and plant N uptake (PNU) at different growth stages across 2014 and 2015.
Growth StageIndexLAIAGB (t·ha−1)PNC (g·kg−1)PNU (kg·ha−1)
R2RMSE (m2·m−2)RER2RMSE (t·ha−1)RER2RMSE (g·kg−1)RER2RMSE (kg·ha−1)RE
V5–V6NDVI0.750.1828.10.690.1632.9NS3.339.10.705.0428.3
RVI0.750.1828.50.660.1633.5NS3.329.00.675.1729.0
V7–V8NDVI0.800.2515.40.680.4121.90.143.9213.20.7012.7422.8
RVI0.810.2414.90.720.4021.00.104.1814.00.7411.9121.3
V9–V10NDVI0.530.4917.20.410.9628.20.124.3018.70.4722.6729.2
RVI0.550.4917.30.450.9327.30.074.4319.30.4622.8429.4
All stagesNDVI0.890.3521.50.830.6132.80.475.1116.90.8016.834.6
RVI0.870.3521.40.840.5630.40.475.1016.90.7816.634.2
RMSE: root mean square error; RE: relative error, RE in %.
Table 5. Coefficients of determination (R2) for the relationships between spring maize N nutrition index (NNI) and GreenSeeker sensor-based indices (normalized difference vegetation index (NDVI) and ratio vegetation index (RVI)) and response indices (RI–NDVI and RI–RVI) at different growth stages across 2014 and 2015.
Growth StageIndexModel *R2IndexModelR2
V7–V8NDVIP0.55RI–NDVIP0.68
RVIP0.51RI–RVIP0.63
V9–V10NDVIE0.45RI–NDVIP0.56
RVIP0.44RI–RVIP0.63
Across stagesNDVIP0.36RI–NDVIP0.60
RVIP0.33RI–RVIP0.62
Note: * E and P stand for exponential and power models, respectively.
Table 6. Validation results for the estimation of spring maize N nutrition index (NNI) using GreenSeeker sensor-based indices (normalized difference vegetation index (NDVI) and ratio vegetation index (RVI)) and response indices (RI–NDVI and RI–RVI) at different growth stages across 2014 and 2015.
Growth StageIndexR2RMSERE (%)IndexR2RMSERE (%)
V7–V8NDVI0.620.1614.4RI–NDVI0.660.1413.3
RVI0.620.1514.2RI–RVI0.600.1514.0
V9–V10NDVI0.450.2018.4RI–NDVI0.620.1816.0
RVI0.410.2119.2RI–RVI0.660.1715.2
Across stagesNDVI0.360.2119.2RI–NDVI0.590.1715.2
RVI0.330.2219.6RI–RVI0.560.1715.6
Table 7. Areal agreement and Kappa statistics for different N status diagnostic approaches at different growth stages across 2014 and 2015.
ApproachAreal AgreementKappa Statistics
V7–V8V9–V10V7–V8V9–V10
NNI–PNC–NDVI69670.470.39
NNI–PNC–RVI69710.450.44
NNI–PNU–NDVI67670.420.36
NNI–PNU–RVI67690.430.45
NNI–NDVI69690.480.41
NNI–RVI67690.440.45
NNI–RI–NDVI76710.560.46
NNI–RI–RVI71710.490.48
RI–NDVI81710.660.48
RI–RVI69710.430.52
Note: NNI–PNC–NDVI and NNI–PNC–RVI: the approaches using GreenSeeker sensor-based NDVI and RVI to estimate PNC and biomass, and then to estimate NNI indirectly; NNI–PNU–NDVI and NNI–PNU–RVI: the approaches using GreenSeeker sensor-based NDVI and RVI to estimate PNU and biomass, and then to estimate NNI indirectly; NNI–NDVI, NNI–RVI, NNI–RI–NDVI, and NNI–RI–RVI: the approaches using GreenSeeker sensor-based NDVI, RVI, RI–NDVI and RI–RVI to estimate NNI directly; RI–NDVI and RI–RVI: the approaches using GreenSeeker sensor-based RI–NDVI and RI–RVI to diagnose spring maize N status directly.

