Article

Hydrological Utility and Uncertainty of Multi-Satellite Precipitation Products in the Mountainous Region of South Korea

1
Disaster Information Research Division, National Disaster Management Research Institute, 365 Jongga-ro, Jung-gu, Ulsan 44538, Korea
2
Climate Research Department, APEC Climate Center (APCC), 12 Centum 7-ro, Haeundae-gu, Busan 48058, Korea
3
Chungcheong Regional Division, K-Water, 1571 2sunhwan-ro, Seowon-gu, Cheongju-si, Chungcheongbuk-do 28632, Korea
*
Author to whom correspondence should be addressed.
Submission received: 31 May 2016 / Revised: 7 July 2016 / Accepted: 15 July 2016 / Published: 21 July 2016

Abstract

:
Satellite-derived precipitation can be a potential source of forcing data for assessing water availability and managing water supply in mountainous regions of East Asia. This study investigates the hydrological utility of satellite-derived precipitation and uncertainties attributed to error propagation of satellite products in hydrological modeling. To this end, four satellite precipitation products (tropical rainfall measuring mission (TRMM) multi-satellite precipitation analysis (TMPA) version 6 (TMPAv6) and version 7 (TMPAv7), the global satellite mapping of precipitation (GSMaP), and the climate prediction center (CPC) morphing technique (CMORPH)) were integrated into a physically-based hydrologic model for the mountainous region of South Korea. The satellite precipitation products displayed different levels of accuracy when compared to the intra- and inter-annual variations of ground-gauged precipitation. As compared to the GSMaP and CMORPH products, superior performances were seen when the TMPA products were used within streamflow simulations. Significant dry (negative) biases in the GSMaP and CMORPH products led to large underestimates of streamflow during wet-summer seasons. Although the TMPA products displayed a good level of performance for hydrologic modeling, there were some over/underestimates of precipitation by satellites during the winter season that were induced by snow accumulation and snowmelt processes. These differences resulted in streamflow simulation uncertainties during the winter and spring seasons. This study highlights the crucial need to understand hydrological uncertainties from satellite-derived precipitation for improved water resource management and planning in mountainous basins. Furthermore, it is suggested that a reliable snowfall detection algorithm is necessary for the new global precipitation measurement (GPM) mission.

Graphical Abstract

1. Introduction

Spatially homogeneous precipitation at high spatial resolution is a prerequisite for practical water resources management in mountainous basins where ground-based climate records are limited. Over the last few decades, many satellite-derived precipitation algorithms have been developed to produce precipitation data at a high spatial and temporal resolution on a quasi-global scale. Currently, several satellite precipitation products are available and in operational use. This includes the precipitation estimation from remotely sensed information using artificial neural networks (PERSIANN) [1,2], the tropical rainfall measuring mission (TRMM) multi-satellite precipitation analysis (TMPA) [3], the climate prediction center (CPC) morphing technique (CMORPH) [4], and the global satellite mapping of precipitation (GSMaP) [5]. These precipitation algorithms have been used for diverse hydrologic applications, such as runoff simulation in ungauged basins [6,7,8,9], flood detection and control [10,11,12], and drought monitoring [13].
Satellite-derived precipitation can provide spatially consistent measurements at high resolution over quasi-global scales. However, the performance of these products in hydrologic applications varies regionally due to differing retrieval algorithms and instrument characteristics. In addition, regional satellite precipitation estimates can be affected by sources of error such as revisit time, orbit geometry, atmospheric conditions, and poor relationships between remotely sensed signals and local rainfall amounts [14,15]. Therefore, numerous studies have evaluated the hydrologic performance of satellite-derived precipitation products over many regions of the world (e.g., [16,17,18,19]).
Su et al. [16] assessed the hydrologic utility of TMPA products using the semi-distributed variable infiltration capacity (VIC) model in the La Plata basin in South America. They showed that TMPA has potential for hydrologic prediction in ungauged regions. Yong et al. [17] evaluated the data quality of the TMPA precipitation product and investigated the hydrological utility of the TMPA-RT (a real-time version) and TMPA version 6 (TMPAv6) using the three-layer variable infiltration capacity (VIC-3L) hydrologic model in the Laohahe basin, China. They reported that the TMPA-RT had no hydrological utility even at a monthly time scale, whereas the TMPAv6 showed improved hydrological prediction capacity at daily and monthly time scales. They further highlighted that the error distributions of TMPA-RT and TMPAv6 significantly depended on the topography associated with latitudes and elevation. Behrangi et al. [18] evaluated the hydrologic applicability of five satellite-based rainfall products (TMPA-RT, TMPA-V6, CMORPH, PERSIANN, and PERSIANN-adj) using the Sacramento soil moisture accounting (SAC-SMA) model in the mid-sized Illinois River basin, USA. They showed that the satellite-derived precipitation greatly influenced streamflow simulations and led to significant overestimations in spring and summer and underestimations in winter. Ward et al. [19] reported that the TRMM 3B42 (or TMPA) and PERSIANN products maintained a good representation of seasonal rainfall but low correlations on daily and monthly timesteps in the tropical Andes of Ecuador and Patagonia. Xue et al. [9] investigated the hydrological utility of the TMPAv6 and TMPA version 7 (TMPAv7) products using the coupled routing and excess storage (CREST) hydrologic model over the mountainous mid-size Wangchu basin (3550 km2) in Bhutan. They concluded that the TMPAv7 algorithm was a significant upgrade from the TMPAv6 in terms of precipitation accuracy, which improved its potential utility in hydrologic models. Kim et al. [20] tried to assess the performance of multi-satellite precipitation and its hydrological utility in South Korea. Most previous studies focused on America, Europe, and Africa, but few investigations (e.g., [20,21]) were performed in East Asia (especially so in a mountainous basin with complex terrain).
Another key issue when analyzing the hydrologic utility of satellite precipitation products is the potential for precipitation error propagation in hydrological model simulations (e.g., [21,22,23,24,25,26]). Nikolopoulos et al. [22] focused on flash flood estimations in Northern Italy using the PERSIANN, CMORPH, and TRMM 3B42 products and showed that error propagation could be magnified when the systematic error of satellite products is transformed into hydrological modeling under dry initial soil conditions. Thiemig et al. [23] investigated how to increase the performance of satellite precipitation products for hydrologic simulations by using four satellite products in the LISFLOOD hydrological model. Based on an analysis in two distinct Nile River basins, they emphasized the importance of bias-corrections of satellite products prior to model calibration from use of a specific satellite precipitation source. Mei et al. [26] investigated the error characteristics of six satellite precipitation products and their error propagation in streamflow simulation in the Upper Adige basin of Northeastern Italy. They concluded that error ratios of simulated flow to precipitation depended on basin scale and seasonality. To improve our understanding of precipitation-to-streamflow error propagation, studies that investigate how precipitation error transfers into hydrological processes (including evapotranspiration, snowmelt, soil moisture, etc.) are needed.
This study assesses the hydrological utility of four widely used multi-satellite precipitation products including TMPAv6, TMPAv7, GSMaP, and CMORPH, in the mountainous basin of South Korea. In addition, we investigate how satellite precipitation errors can propagate through hydrological models in a mountainous basin. We employ a physically-based, semi-distributed hydrological model. In this study, the satellite-derived precipitation errors are defined as the differences of precipitation occurrence and amount as compared with precipitation gauged on the ground. To evaluate the performance of the satellite precipitation products, we compare them with the ground-based rain gauge observations at daily, monthly, and annual timesteps. We then examine the performance in hydrological applications and potential uncertainty attributed to precipitation error propagations.

2. Materials and Methods

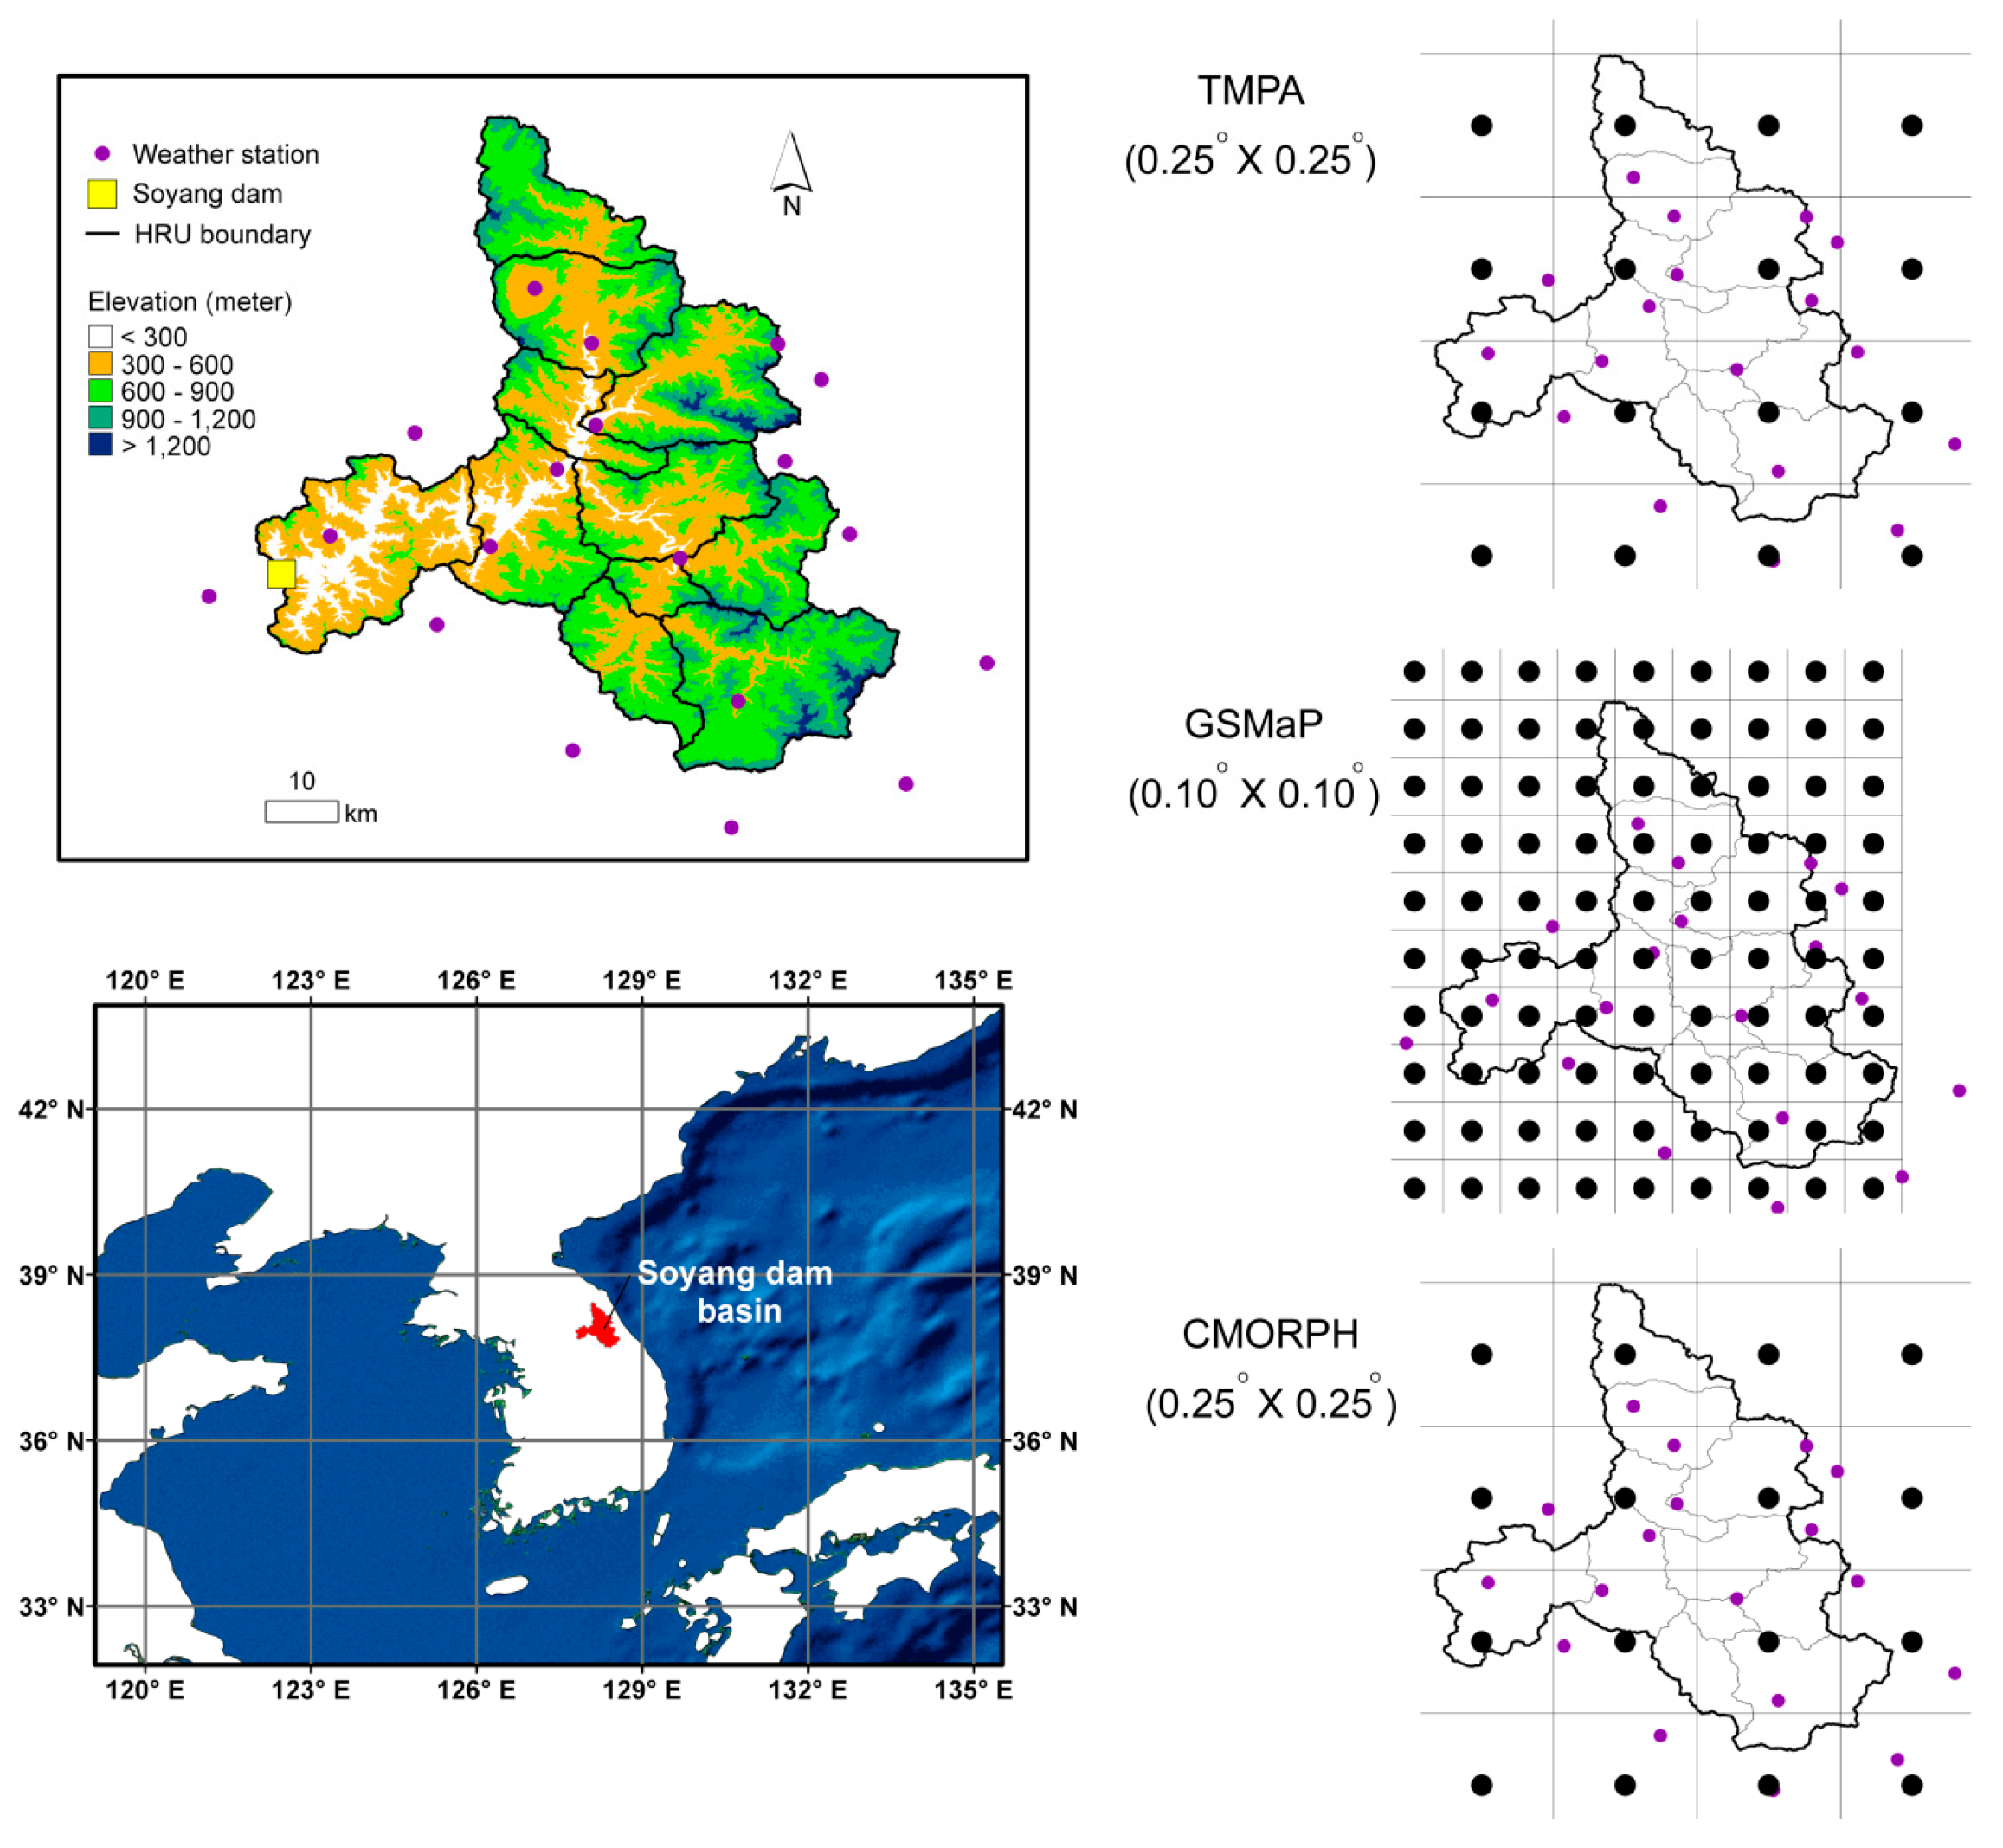
2.1. Study Area and Observation

The Soyang Dam basin has a drainage area of approximately 2703 km2 and was selected for this study because it contains a dense rain gauge network and has reliable long-term dam inflow records (Figure 1). The Soyang dam inflow is commonly regarded as unregulated natural flow because the anthropogenic effects from the upper dam regions can be ignored [27]. The daily dam inflow during the study period of 2002 to 2009 was collected from the water management information system (WAMIS) website [28]. The climate of the Soyang Dam basin is characterized by extreme seasonal variations such as cold, dry winters and hot, wet summers. Between 1966 and 2009, the mean annual precipitation was ~1250 mm [28]. Approximately 60% of the annual precipitation is concentrated during summer (July, August, and September) from heavy rainfall events [29]. Approximately 68% of the annual precipitation contributes to dam inflow. Most of the dam inflow is seasonally driven by summer precipitation [30]. To directly compare the satellite precipitation products with the ground-based gauge data, the precipitation estimates were areal-averaged over the watershed using the Thiessen polygon approach [31]. There is gauged precipitation and temperature data at 19 weather stations provided by the Korean Meteorological Administration (KMA) [32]. These are located in or near the Soyang dam basin and cover the period between 2000 and 2009 (Figure 1).

2.2. Satellite-Derived Precipitation Products

This study used three high-resolution satellite precipitation estimates for the period between 2002 and 2009. The datasets are available from the Goddard Space Flight Center (GSFC) [33] for TMPAv6 and TMPAv7, the Climate Prediction Center (CPC) [34] for CMORPH, the Earth Observation Research Center (EORC) for GSMaP [35]. These datasets are a combination of retrievals from high-temporal infrared sensors on geostationary satellites and the microwave brightness temperature measurements that are directly associated with precipitation [36].
Each combination algorithm retrieves precipitation rates in different ways. TMPAv6 is a merged satellite precipitation product with a 3-hourly temporal scale and a 0.25° × 0.25° spatial resolution with coverages available between 50°N and 50°S [3]. TMPAv6 is a post-processed product (approximately 10 to 15 days after the end of each month), based on a calibration by the TRMM combined instrument and the TRMM microwave imager precipitation product [3,16]. In addition to the data sources in TMPAv6, the TMPAv7 uses supplementary datasets, including the special sensor microwave imager/sounder (SSMIS) F16~18, microwave humidity sounder (MHS) N18~19, meteorological operational satellite programme (MetOp), and the 0.07° Grisat-B1 infrared data [3,9].
GSMaP [5,36] and CMORPH [4] are also available as a post-processed product. GSMaP has an hourly temporal scale and 0.10° × 0.10° spatial resolution (Figure 1). To produce a high-precision, high-resolution global precipitation map, GSMaP combines precipitation retrievals from TRMM and other polar-orbiting satellites. These are then interpolated using cloud motion vectors from infrared images at geostationary satellites. The CMORPH product are based on rainfall estimates from microwave data and a morphing algorithm to derive cloud motion vectors from infrared images on a 3-hourly temporal scale and a 0.25° × 0.25° resolution (Figure 1).
To achieve a daily precipitation dataset, we accumulated the hourly (GSMaP and CMORPH) and 3-hourly (TMPAv6 and TMPAv7) satellite precipitation data over 1 day, from 15 to 12 (The nominal 3-hourly observation times actually represents averages over the time range ±90 min) coordinated universal time (UTC), to consider the local measurement time of daily precipitation in the Soyang Dam basin. The TMPA precipitation products were multiplied by a factor of 3 to account for the 3-h interval; the unit of 3-h TMPA data is mm/h.

2.3. Performance Statistics for Precipitation

This study used several statistical indicators to measure the quantitative and categorical performances of satellite-derived estimates when compared to the gauged precipitation. This includes the correlation coefficient (γ) (Equation (1)), percent bias (P-bias) (Equation (2)), and the root-mean-square error (RMSE) (Equation (3)).
γ = i = 1 n [ ( x o , i     x o ¯ ) ( x s , i     x s ¯ ) ] [ i = 1 n ( x o , i     x o ¯ ) 1 / 2 ] [ i = 1 n ( x s , i     x s ¯ ) 1 / 2 ]
P bias = i = 1 n x s , i     i = 1 n x o , i   i = 1 n x o , i   × 100 %
RMSE = i = 1 n ( x o , i     x s , i ) 2 n
where x o is the observed precipitation value, x s is the satellite-derived (or simulated) value, i is the time step (e.g., day), n is the total number of time steps, x o ¯ is the mean of observed values, and x s ¯ is the mean of satellite-derived (or simulated) values.
To categorically verify the daily satellite-derived precipitation against the ground-based precipitation for each month, four additional statistical measures are calculated in a 2 × 2 contingency table (a: satellite yes, observation yes; b: satellite yes, observation no; c: satellite no, observation yes; and d: satellite no, observation no):
The frequency bias index (FBI) = (a + b)/(a + c); the probability of detection (POD) = a/(a + c); the false alarm ratio (FAR) = b/(a + b); and the equitable threat score (ETS) = (a − He)/(a + b + c − He), where He = (a + c)(a + b)/N, and N is the total number of satellite-observation pairs [37]. The FBI is the ratio of satellite yes events to observed yes events and is an indicator of satellite underestimates (FBI < 1) and overestimates (FBI > 1) from the observed precipitation events. The FBI ranges from 0 to positive infinity (perfect score = 1) [16]. The POD, also known as the hit rate, represents how often occurrences of observed precipitation events are correctly detected by the satellite. The POD ranges from 0 to 1 (perfect score = 1). The FAR is the fraction of satellite precipitations yes events with observed precipitation no events and ranges from 0 (best score) to 1 (worst score). The ETS represents how well satellite-derived precipitation yes events correspond to observation yes events and accounts for hits that happen purely by chance [38]. The ETS ranges between −1/3 and 1 (perfect score = 1).
This study compares satellite-derived precipitation and basin-averaged precipitation using ground-gauged data. Direct comparison of the satellite precipitation (areal averaged values) and gauged observation (point values) could induce significant spatial scale discrepancy [14].

2.4. Hydrological Modeling Framework

The Precipitation-Runoff Modeling System (PRMS), developed by the US Geological Survey (USGS) is a physically based, semi-distributed hydrologic model [39]. The model has been employed in a wide range of geographic areas to investigate diverse water-related issues (e.g., [27,40,41,42]). The PRMS model simulates the daily water and energy balances of each hydrologic response unit (HRU), which can account for the temporal and spatial variability of land surface hydrologic processes. Runoff is simulated at each HRU from a variety of interconnected virtual reservoirs such as interception, snow water equivalent (SWE), soil moisture accounting, impervious, subsurface, and groundwater reservoirs and runoff from the HRUs, which are combined at basin outlets. Detailed descriptions of model structures and the governing equations are available in the PRMS user manual [39,43] and the executable file of the PRMS model and its source codes are available online [44]. This study used PRMS version 4.0.
This study partitioned the Soyang dam basin into 11 HRUs based on the real stream network (see Figure 1). A recent study has indicated that the size and subdivision of HRU does not significantly impact PRMS model performance [45]. The geographic PRMS parameters at each HRU were estimated from Geographic Information System (GIS) datasets including digital elevation models (DEM), soil maps, and land cover maps obtained online [28]. We employed the Food and Agriculture Organization (FAO) Penman-Monteith method [46] to calculate potential evapotranspiration. This study calibrated 21 sensitive parameters (Table 1). These parameters have been considered as the most sensitive parameters in many studies (e.g., [40,42,47]). Table 1 lists the calibrated parameters, including descriptions, ranges, and initial values. The calibration and validation periods were defined as 2002 to 2005 and 2006 to 2009, respectively. This study uses the same calibrated parameters values as seen in PRMS. If we used the different parameter values calibrated by each satellite precipitation analysis, the effect of the satellite product in the hydrologic simulation would be hampered by further parameter uncertainties. To avoid this, we used the same parameters for all applications.
The shuffle complex evolution algorithm of the University of Arizona (SCE-UA) [48] was used to find optimized parameters automatically. SCE-UA is a robust and efficient global search method based on a population-evolution and complex shuffling strategy. We employed Nash-Sutcliffe efficiency (NSE) (Equation (4)) as an objective function. NSE is one of the most widely used performance measures in hydrology [49]. NSE is calculated as 1.0 min the normalization of the mean squared error (MSE) by the variance of the observation (Equation (4)) and ranges from minus infinity to 1.0 (perfect fit), with higher values indicating a better agreement between simulated and observed values. The negative values of NSE value indicate that using the mean of the observation is statistically better than using the model simulations.
NSE = 1     [ i = 1 n ( Q o , i     Q s , i ) 2 i = 1 n ( Q o , i     Q o ¯ ) 2 ]
where Q o is the observed value, Q s is the simulated value, i is the time step (e.g., day), n is the total number of time steps, Q o ¯ is the mean of observed value, and Q s ¯ is the mean of the simulated values.
This study evaluated the performance of satellite precipitation products in streamflow simulations by comparing simulated and observed streamflow hydrographs through the following goodness-of-fit measures: γ, Kling-Gupta Efficiency (KGE) [50] (Equation (5)), index of agreement (d) [51] (Equation (6)), and P-bias (Equation (2)).
KGE is composed of the decomposition of the MSE and the NSE, which facilitates analysis of the relative importance of correlation (γ), variability (α), and bias (β) between the observed and simulated flow [50]. This study used θ 1 = 1, θ 2 = 1, θ 3 = 1, which indicates three statistics have the same level of importance.
KGE = 1     θ 1 ( γ 1 ) 2 + θ 2 ( α 1 ) 2 + θ 3 ( β 1 ) 2   α =   Q o ¯ Q s ¯   1 n 1 i = 1 n ( Q s , i   Q s ¯ ) 2 1 n 1 i = 1 n ( Q o , i   Q o ¯ ) 2 β =   i = 1 n Q s , i i = 1 n Q o , i
where θ is a weighting factor. γ is the Pearson correlation coefficient (Equation (1)), α is a measure of relative variability between observed and simulated values and β is a measure of bias.
The index of agreement ( d ), another statistical measure of hydrologic model performance, ranges from 0 to 1 (1 = perfect agreement between simulated and observed values). It was introduced because the correlation coefficient is sensitive to outliers [51].
d = 1     i = 1 n ( Q o , i     Q s , i ) 2 i = 1 n ( | Q s , i     Q o ¯ | + | Q o , i     Q o ¯ | ) 2  

3. Results

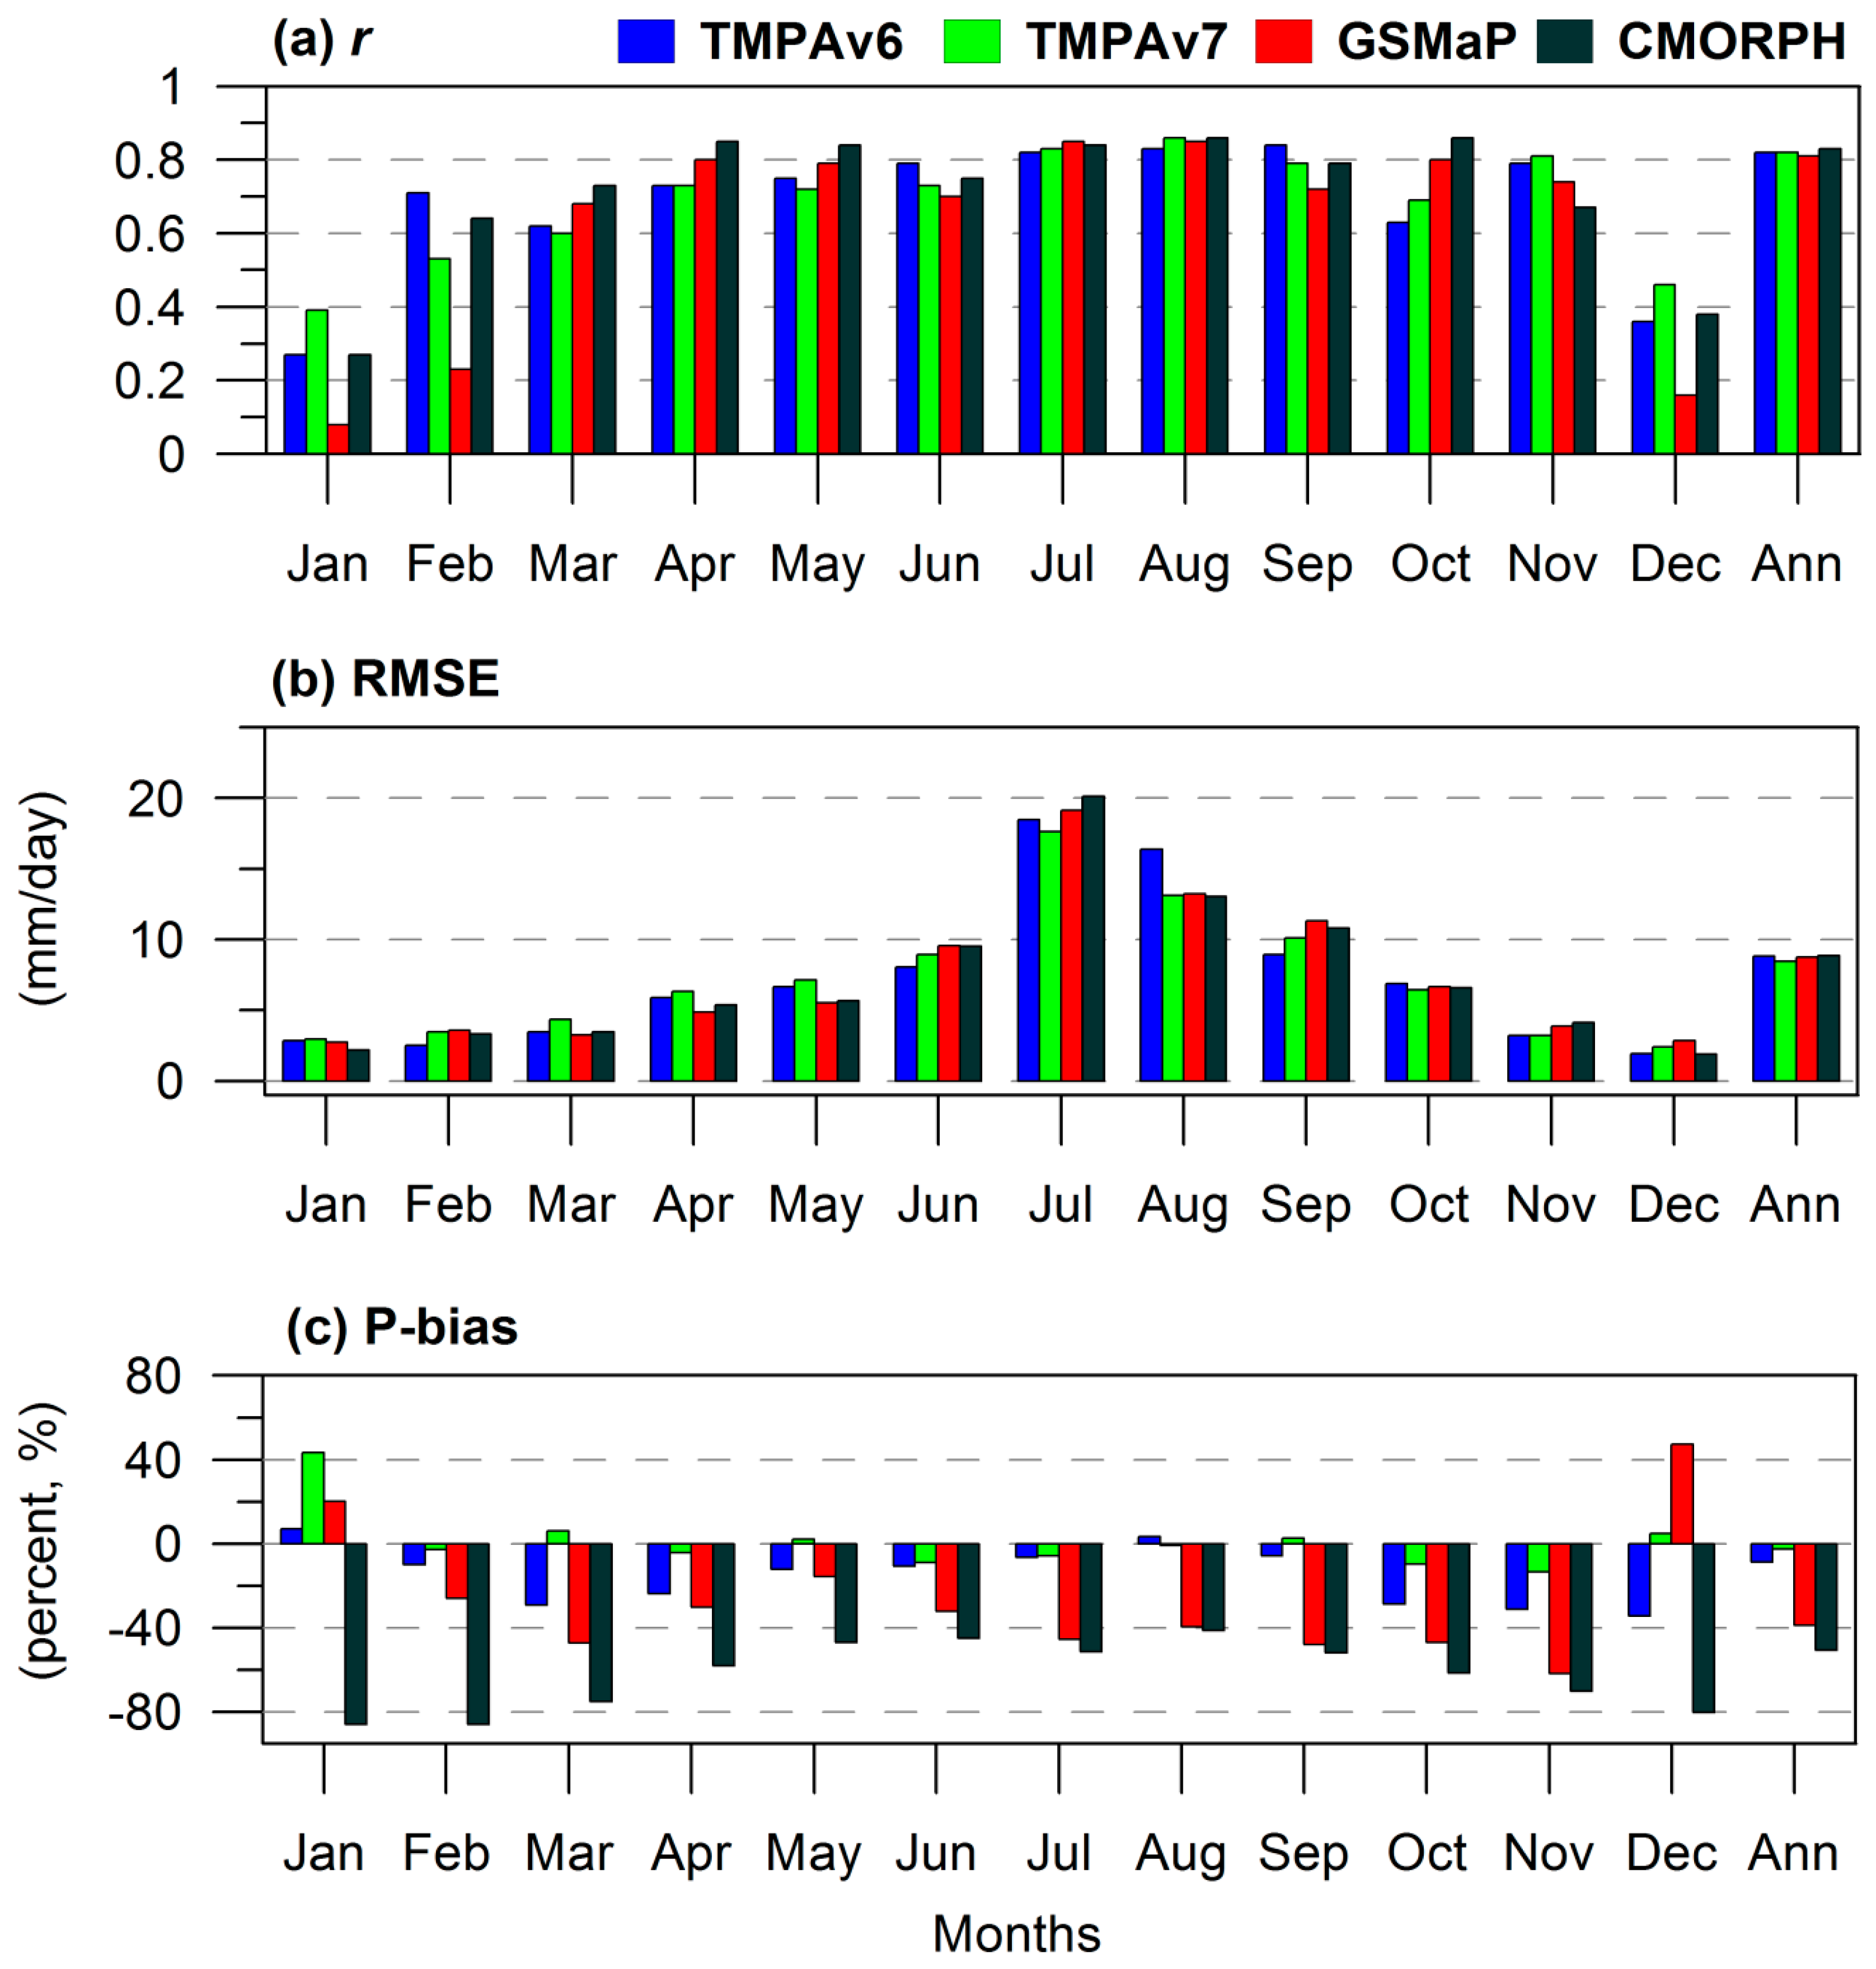
3.1. Temporal Evaluation of Satellite-Derived Precipitation

This study estimated the skill of the satellite-derived precipitation from TMPAv6, TMPAv7, GSMaP, and CMORPH for 8 years (2002–2009) at a basin scale. Figure 2 shows correlation coefficients and RMSEs for each year calculated by a time series comparison of satellite-derived precipitation and gauged daily precipitation. All satellite-derived precipitation estimates show significant linear correlations with the gauged data (γ > 0.67, significance level of 0.01). This indicates good performance in detecting the occurrence of basin-averaged precipitation events. Annual correlation patterns are similar between the satellite products. However, RMSE patterns are annually inconsistent, especially in 2002, 2008, and 2009. Although the performance of the satellite data fluctuates annually, there is no notable relationship between annual precipitation quantities and correlation or RMSE patterns (Figure 2). Overall, the performance of satellite-derived precipitation slightly increases after 2006 with a higher correlation and lower RMSE. This is especially notable with the TMPAv6 and TMPAv7 products and might be due to the addition of high-quality microwave instruments including SSMIS/DMSP-F16 on 20 November 2005 and MHS/NOAA-18 on 25 May 2005.
Figure 3 shows monthly performances of the satellite precipitation products for the analysis period between 2002 and 2009. They have high correlation with the observations, except during the winter season (December, January, and February). RMSEs for each month show little variation between each satellite product. However, there are major differences in the P-bias. Compared to the observations, GSMaP and CMORPH highly underestimate precipitation in most months, even though they demonstrate a high correlation with observed precipitation. GSMaP underestimates monthly precipitation by −16% (May) to −62% (November), but overestimates monthly precipitation during January (+20%) and December (+47%). CMORPH underestimates precipitation for all months by −41% (August) to −86% (January). This indicates the need for a systematic bias correction in GSMaP and CMORPH products for hydrologic applications. With respect to P-bias, TMPAv6 and TMPAv7 show better performance than GSMaP and CMORPH (Figure 3). In addition, TMPAv7 shows significant improvements in bias reduction when compared to TMPAv6, especially between March and May and October through December. TMPAv6 and TMPAv7 employ a bias adjustment that is based on the Global Precipitation Climatology Centre (GPCC) monthly rain gauge analysis [3]. Three weather stations used in this study are involved in GPCC network. Therefore, TMPA products are not completely independent, which would partially explain its better performance than CMORPH and GSMaP.

3.2. Spatial Evaluation of Satellite-Derived Precipitation

Overall, performance of the satellite derived precipitation products displayed high temporal correlations (>0.71) in all HRUs (Figure 4). TMPAv6, TMPAv7, and CMORPH show generalized elevation-dependencies. At low elevations, the correlations are high; and at high elevations, the correlations are low. However, GSMaP reveals an opposing trend relative to elevation. This indicates that GSMaP gives a slightly different spatial structure relative to the TMPA and CMORPH products. All satellite precipitation products give considerable underestimates at the high-elevation sites, with the exception of the northernmost HRU. However, the northernmost subbasin (Figure 1) has no weather station. Due to this, the gauged areal precipitation may be less reliable than other subbasins. GSMaP and CMORPH considerably underestimate precipitation for most subbasins, by up to 54% and 56%, respectively.

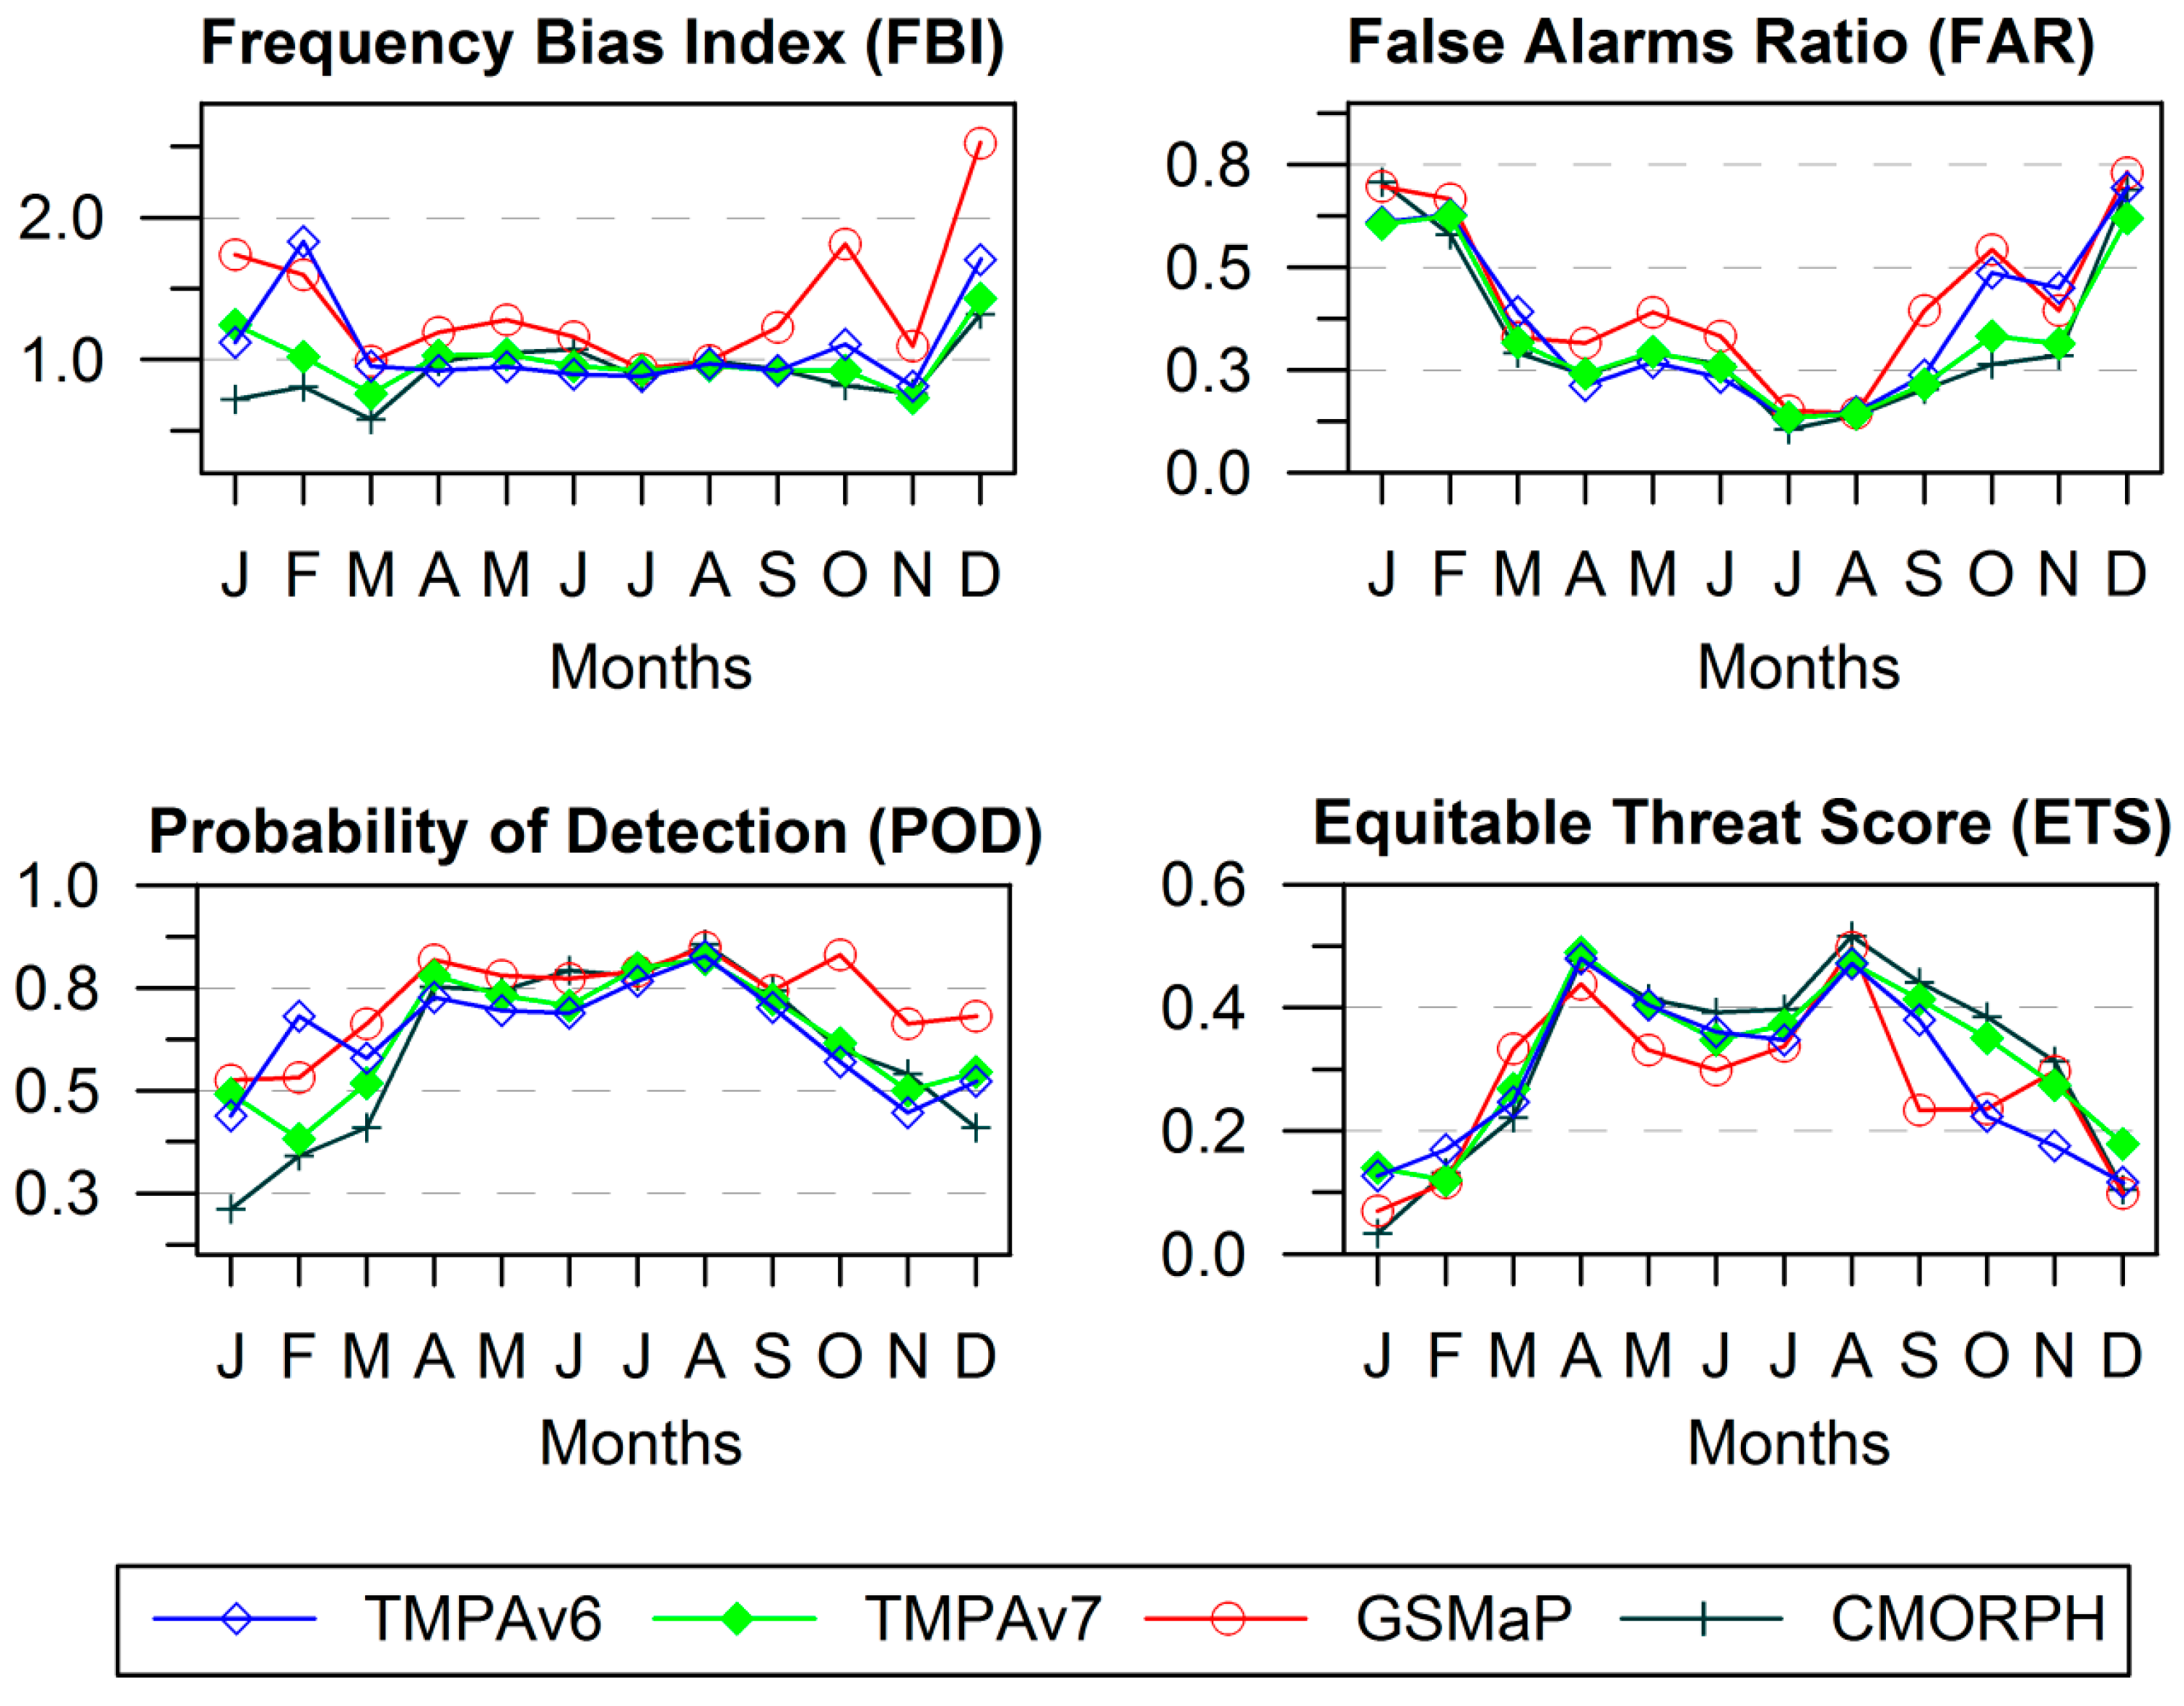
3.3. Quantitative Verification of Satellite-Derived Precipitation

According to the FBI (Figure 5), both of the TMPA products detect a similar frequency of gauged precipitation events for most months (FBI close to 1). The TMPAv6 overestimates precipitation events in February, while TMPAv7 detects almost the same frequency of gauged events. This indicates that TMPAv7 is slightly better at precipitation event detection. GSMaP tends to overestimate precipitation events for most months, especially during October and the winter season (December, January, and February). However, the FBI of the TMPA and CMORPH products show little monthly variance.
There is little variation in FAR amongst the products, i.e., they all yields similar values, with the exception of September and October. Winter precipitation events display high FAR values (above 0.55). The POD (Hit Rate) displays a seasonal dependency. There are relatively high scores in April through August with the opposite holding true during the winter season. GSMaP displays higher POD values during winter than the other satellite products. However, this is because of the over-detection of GSMaP for winter precipitation events. ETS, an evaluation index excluding chance, shows the lowest performance of all satellite products in the winter. Quantitative verification indicates that all satellite-derived precipitation products demonstrate a seasonal dependence and display improved performance during the wet season and low performance during the dry season.

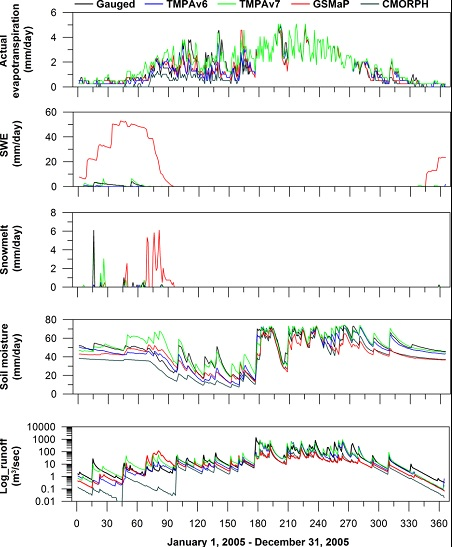
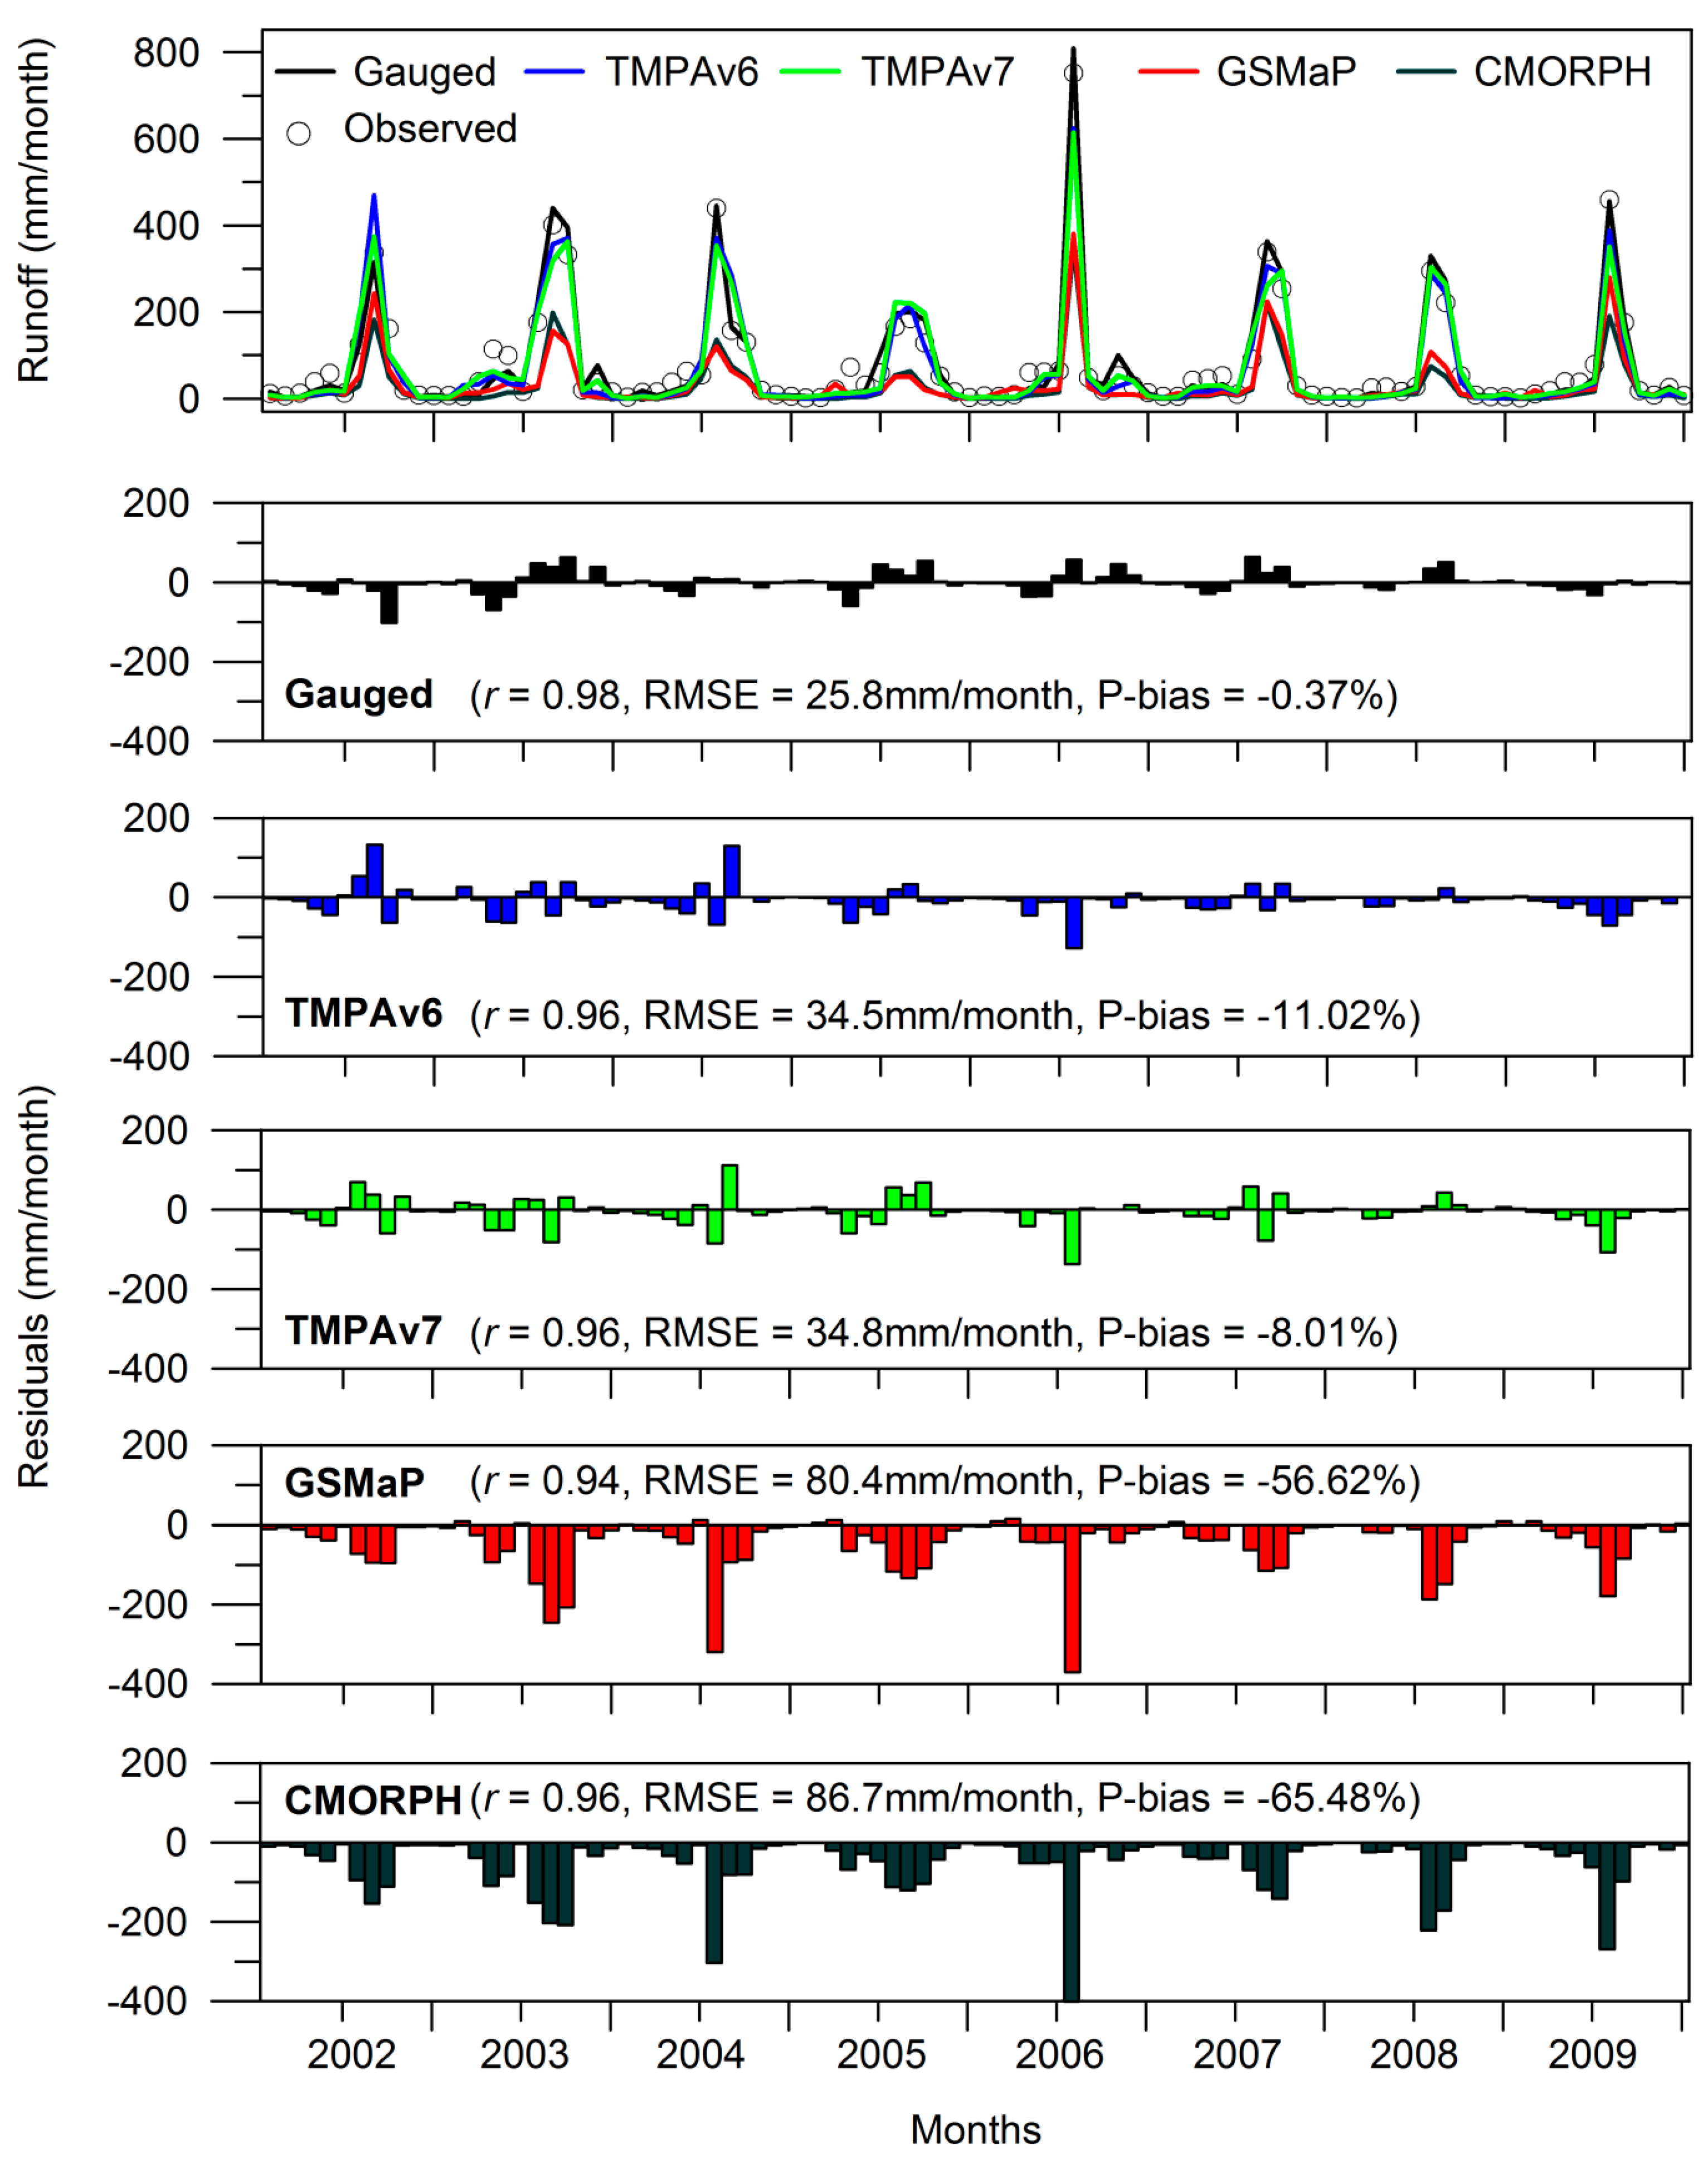
3.4. Evaluation of Streamflow Simulations

The PRMS model was calibrated using the gauged precipitation data as model input. The simulated streamflow was then compared to the observed values in the Soyang dam basin. The calibration was performed using the SCE-UA optimization method, from 2002 to 2005, from a maximization of the objective function (NSE). Table 2 presents the performance of the PRMS model using the calibrated parameters (Table 1) for the calibration and validation periods. All evaluation statistics for the calibration period display a good PRMS simulation performance. This indicates the calibrated parameters can reliably reproduce the observed streamflow. The statistics in Table 2 demonstrate that satellite simulations can exhibit varying skill in streamflow simulation, depending upon the product used. The TMPAv6 and TMPAv7 simulations showed relatively high skill as compared to those of GSMaP and CMORPH.
Figure 6 depicts the monthly simulated streamflow using the satellite-derived precipitation and ground-gauged precipitation for the period 2002 to 2009. Although this study did not calibrate the PRMS model using the TMPA products, the TMPA simulations show reasonable performance compared to the streamflow simulations that used gauged precipitation. In addition, the TMPA products showed lower residuals than the GSMaP and CMORPH products. P-bias increased from −38.7% in precipitation to −56.6% in streamflow for GSMaP. CMORPH displayed a similar trend. The P-bias in streamflow increased about 15% as compared to precipitation (−50.7% to −65.5%). This indicates that the initial systematic biases seen in the satellite precipitation products can be propagated to hydrologic model output.

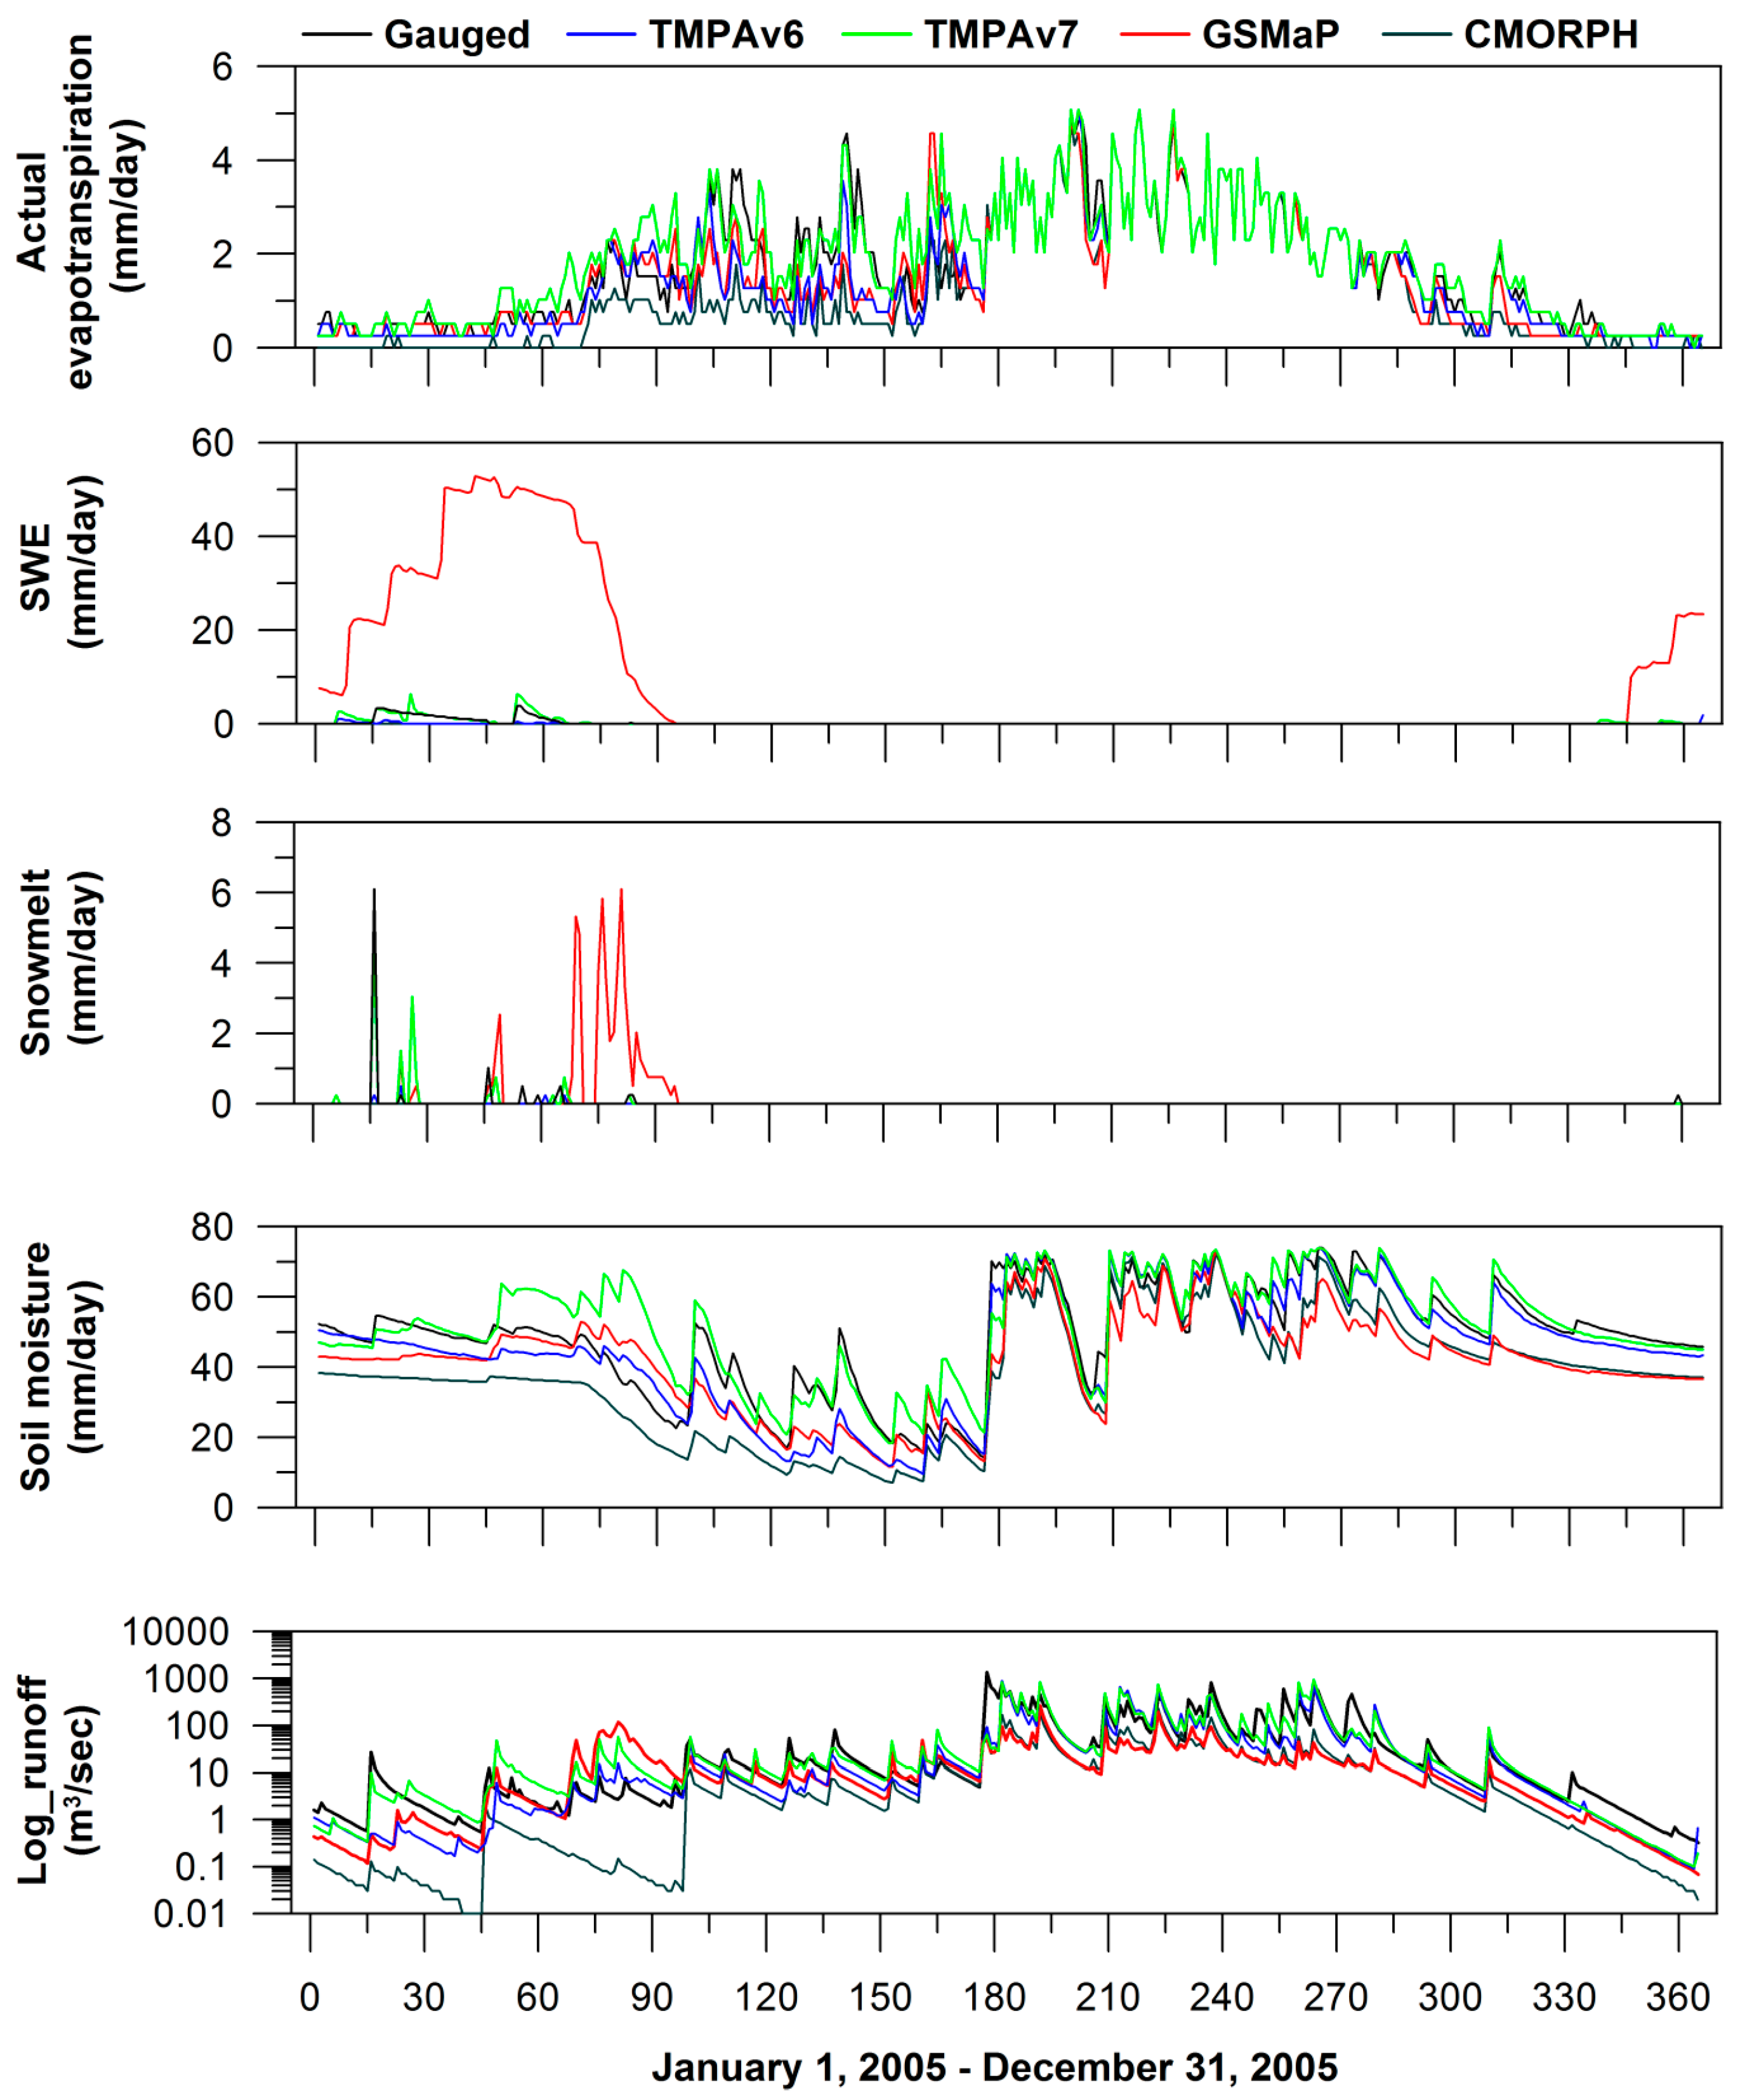
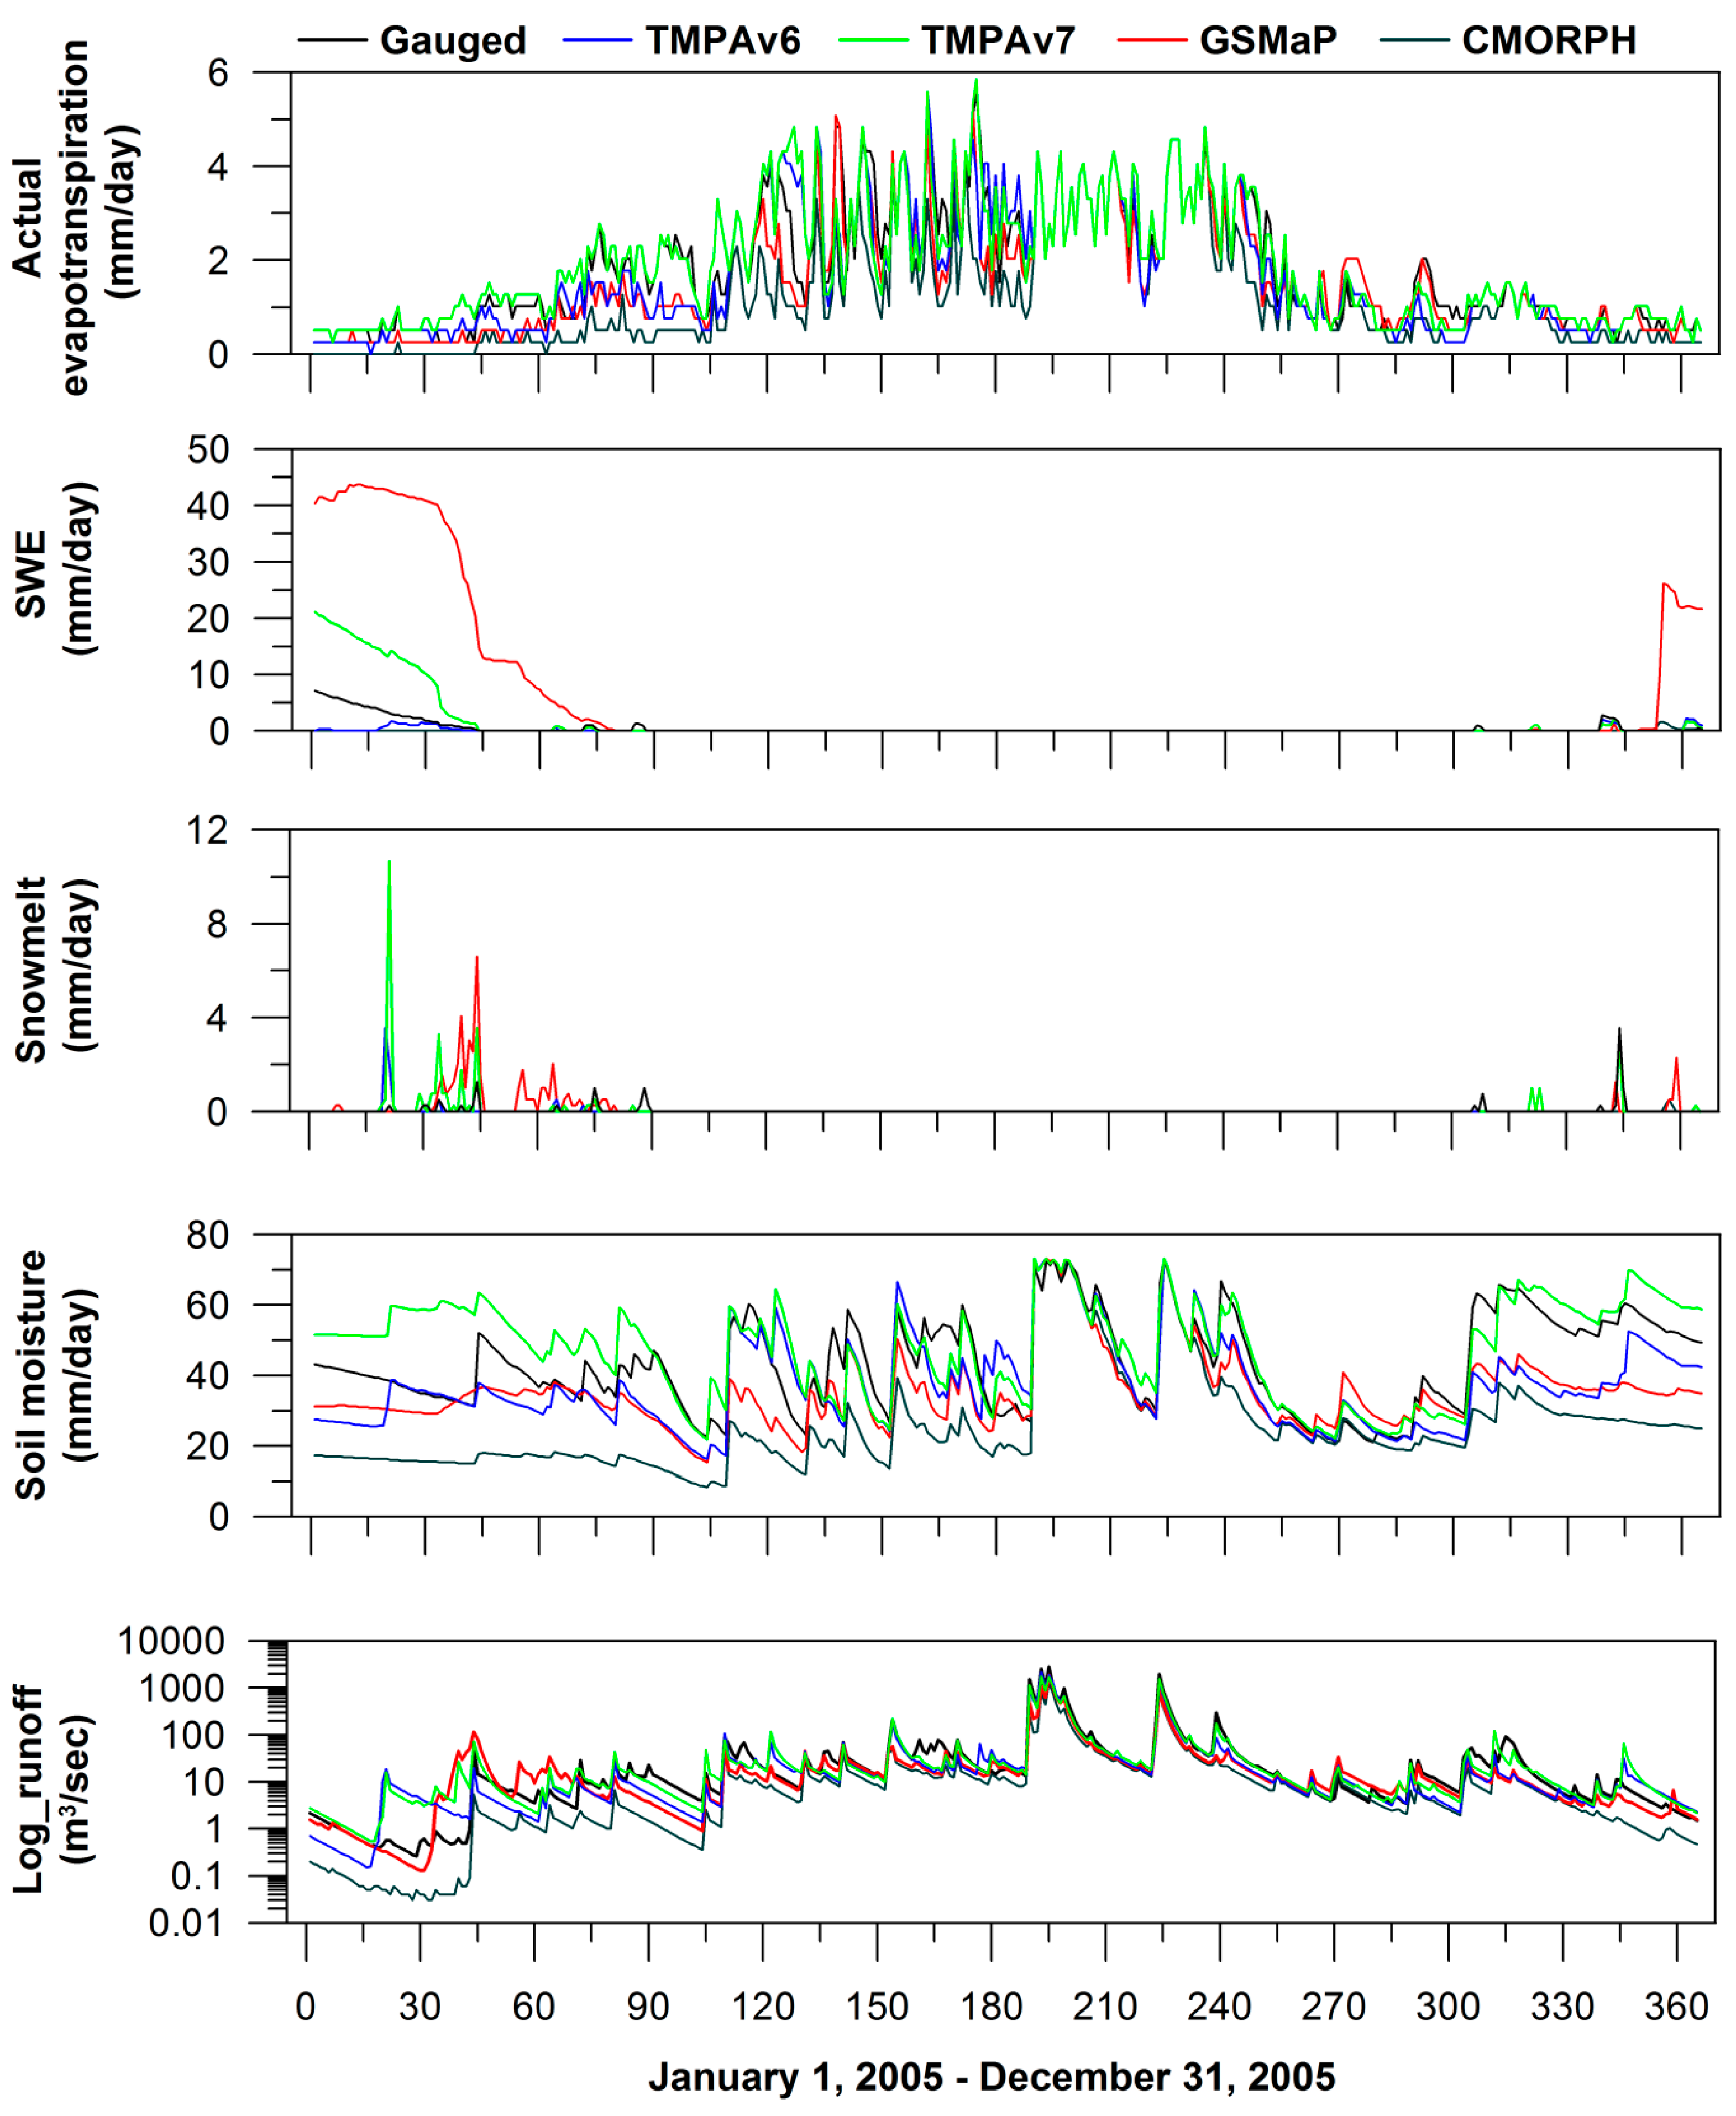
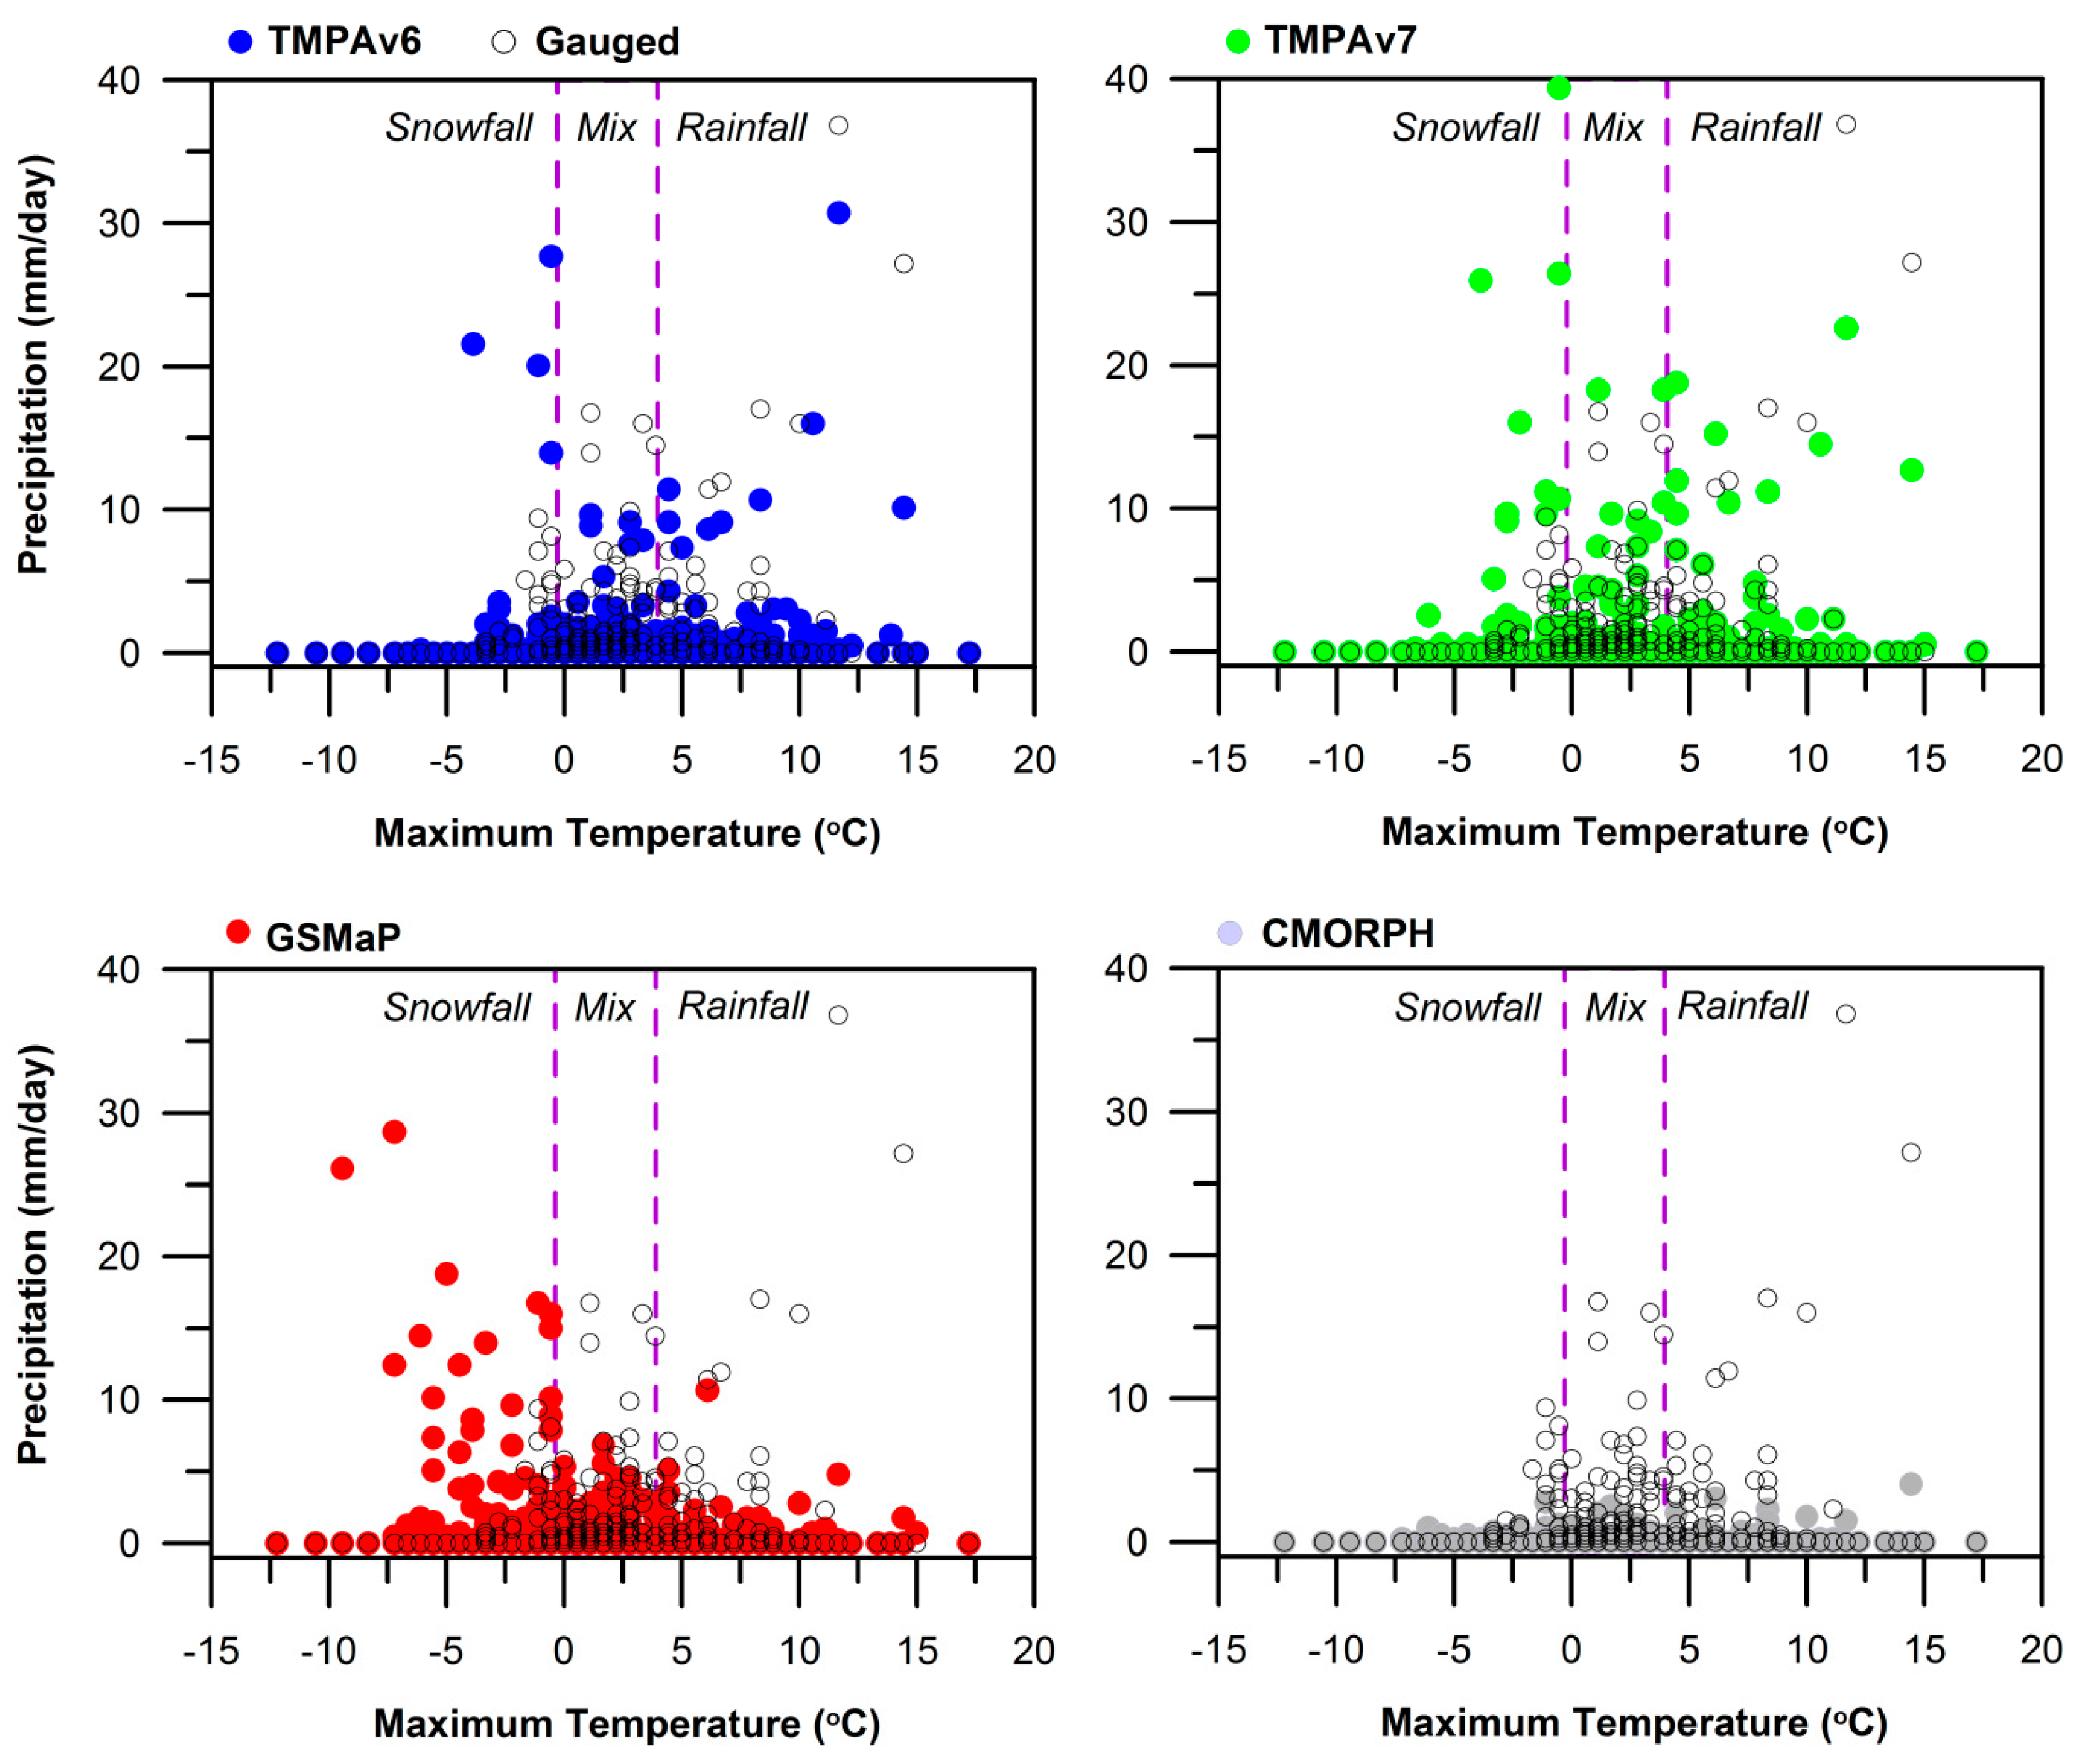
3.5. Cause of Uncertainties in Streamflow Simulations Using Satellite-Derived Precipitation

In Section 3.4, we showed that the systematic biases in satellite precipitation could propagate hydrologic uncertainties into the hydrologic application. Most of the uncertainties are attributed to the underestimation of rainfall during the wet season. This study also investigated other potential uncertainties during the dry season, most notably during the winter and spring season when snow accumulation and snowmelt are the dominant hydrological processes.
Figure 7 and Figure 8 compare simulations of several hydrological components using the gauged and satellite precipitation as input for dry (2004) and wet (2009) years. Actual evapotranspiration (AET) shows larger differences among precipitation products in the dry season than the wet season. AET in PRMS is dependent on potential evapotranspiration and water availability in the soil layers. As seen in the figures, more AET typically occurs under wet soil moisture conditions, because when soils are dry, AET is restricted by soil moisture content. This indicates that differing precipitation estimates induce distinct soil water conditions that result in variable evapotranspiration and streamflow simulations (log_runoff). In addition, SWE and snowmelt show large differences between precipitation products. These are especially present at high values from GSMaP and low values from CMORPH. The dissimilarity of SWE leads to differences in the amount and timing of snowmelt contributions to streamflow. This causes the variance in dry seasonal flow.
Figure 9 shows the relationship between daily precipitation and maximum temperature during the winter season. PRMS takes into account three forms of precipitation: rain, snow, and a rain/snow mix. When the daily maximum air temperature on an HRU is less than or equal to tmax_allsnow (Table 1), precipitation is all snow, whereas precipitation is all rain when the daily maximum air temperature is greater than or equal to tmax_allrain. This study determined the values of tmax_allsnow and tmax_allrain by the SCE-UA optimization routine using ground gauged precipitation as input. As seen in Figure 9, the TMPA products and GSMaP estimate larger amounts of snowfall than the gauged precipitation. In particular, GSMaP significantly overestimates snowfall, and results in larger snow accumulation and snowmelt than the other simulations. Conversely, CMORPH underestimates snowfall, which gives less snowmelt to the model.
In Korea, dry season flow is essential for paddy field irrigation during spring. Therefore, reliable low flow estimation during the dry season is a significant issue. Uncertainties associated with divergent snowfall quantities and snowmelt timing by the satellite precipitation products can lead to significant reliability issues during simulations of low flow. Furthermore, these uncertainties can be even larger in regions where the effects of snow play a larger role in the water budget.

4. Discussion

The performance and hydrologic utility of satellite precipitation products vary from region to region. This study showed that the TMPA products were better suited for hydrologic application in South Korea than GSMaP and CMORPH. However, the performance of GSMaP was comparable with TMPA 3B42, CMORPH, and PERSIANN and well-captured the spatial precipitation patterns. In other studies, it performed well in detecting summer precipitation over the contiguous United States [36]. CMORPH also showed good performance as compared to PERSIANN and TMPA 3B42 in the Gilgel Abay watershed of Ethiopia [14]. However, CMORPH overestimated the rainfall by almost 50% in the Zambezi River basin of Africa [52], while it displayed large underestimations in the Mishui Basin of South China [53] and areas in Northeast Italy [26]. These findings highlight the need for time-space performance evaluations of satellite-based precipitation products for regional hydrologic applications, which would serve as a useful guideline to regional water managers who need to make decisions about which satellite products to use.
Understanding error propagation from satellite precipitation to streamflow simulation is necessary for improving the utility of satellite products. This study showed that biases in the satellite products can increase the uncertainty in streamflow simulations. During the wet season, under- and overestimations of rainfall directly impacted on the size of the streamflow simulation errors. During the dry season, false snowfall estimations in the hydrological model induced differences in the amount and timing of snowmelt in the mountainous basin of South Korea. To overcome this issue, a systematic bias correction or error correction of satellite products should be a prerequisite prior to use. However, few studies to date have examined the potential value of implementing a bias correction scheme of satellite products in hydrological analyses [23,54]. In addition, improvements in snowfall detection algorithms are needed for the global precipitation measurement (GPM) mission. Enhanced time-space accuracy of rainfall and snowfall detection would represent a significant contribution to many diverse hydrological applications and water resource management [55,56,57].
This study used observed precipitation to initially calibrate all parameters. These values were used for all modeling scenarios to avoid further uncertainty [58]. A few previous studies tried to recalibrate the parameters of hydrological models using satellite products, instead of observed precipitation, to improve the accuracy of streamflow simulations [53,59,60,61]. However, such a recalibration is not always a good approach because disinformation, such as errors in the satellite data, can lead to biased inferences in the subsequent hydrological model calibration [49,58]. In hydrologic science, the measurement error of precipitation is assumed to be stochastic or aleatory in nature. Every residual (simulated flow minus observed flow) is informative in conditioning the model parameters and uncertainty. However, the errors in satellite precipitation data are a type of epistemic error. Therefore, calibration using satellite precipitation data can fail. Recent studies showed that recalibrated model parameter values could reside outside the physical ranges of the parameters [21,22].

5. Conclusions

We evaluated the hydrological utility and uncertainty stemming from the propagation of satellite-derived precipitation errors in a hydrologic model. The model was run at a mountainous basin in South Korea. The principal conclusions from this study are summarized below.
Four satellite precipitation products were statistically compared with a nearly decade-long (2002–2009) basin-averaged rain gauge dataset at daily and monthly time steps. Overall, TMPA products were closer to ground gauged precipitation than GSMaP and CMORPH in space and time. Regarding TMPAv6 and TMPAv7, the latter demonstrated a slightly better performance than the former in terms of precipitation detection and correlation with ground-observed precipitation. GSMaP and CMORPH consistently underestimated precipitation during most months; this underestimation increased during the wet season. The TMPA products and CMORPH showed an elevation-dependent performance; high correlation and low bias were seen at low elevation whereas low correlations and large biases were seen at high elevations.
TMPAv6 and TMPAv7 were able to well-reproduce streamflow as compared to the gauge-based simulations. This contrasts with GSMaP and CMORPH, which resulted in large underestimations. Moreover, GSMaP and CMORPH displayed an increased magnitude of bias, by approximately 15%, through the hydrological model simulations. Our results indicate the need for an initial bias correction or adjustment of GSMaP and CMORPH prior to use in hydrological applications.
Using a physically based, semi-distributed model, we examined how precipitation error in satellite products effected simulations of individual components such as actual evapotranspiration (AET), snowmelt, soil moisture and streamflow. In winter, the over- or underestimation of satellite-derived precipitation led to differences in snowfall and snowmelt. The differences in the quantity and timing of snowmelt led to differences in soil moisture condition and AET estimations. Finally, the propagation amplified the differences in modeled and actual streamflow. Based on these results, we further argue that studies that advance the current snowfall detection algorithms are necessary for the new GPM mission. Enhancing the hydrologic utility of satellite products in mountainous regions where snowmelt is a factor is crucial for water resource management.
Overall, this study highlighted that further studies in hydrological utility and uncertainty analysis is important in diverse basins that have distinct physiographic and hydroclimatic conditions. Furthermore, improved understanding of why certain satellite precipitation products show consistent under- or overestimation in particular regions is needed. This could allow for improvements in overall accuracy, as well as the development of new retrieval algorithms.

Acknowledgments

This research was supported by the APEC Climate Center and a grant (14AWMP-B082564-01) from Advanced Water Management Research Program funded by Ministry of Land, Infrastructure and Transport of Korean government. We appreciate three anonymous reviewers for their valuable comments on the earlier drafts of this article.

Author Contributions

J.P.K. and I.W.J. designed and conducted the experiments, and wrote the paper. K.W.P., S.K.Y., and D.L. provided technical support for the retrieval of satellite precipitation products. All authors discussed the results and made critical contributions to the work.

Conflicts of Interest

The authors declare no conflict of interest.

References

  1. Hsu, K.L.; Gao, X.G.; Sorooshian, S.; Gupta, H.V. Precipitation estimation from remotely sensed information using artificial neural networks. J. Appl. Meteorol. 1997, 36, 1176–1190. [Google Scholar] [CrossRef]
  2. Sorooshian, S.; Hsu, K.L.; Gao, X.; Gupta, H.V.; Imam, B.; Braithwaite, D. Evaluation of PERSIANN system satellite-based estimates of tropical rainfall. Bull. Am. Meteorol. Soc. 2000, 81, 2035–2046. [Google Scholar] [CrossRef]
  3. Huffman, G.J.; Adler, R.F.; Bolvin, D.T.; Gu, G.; Nelkin, E.J.; Bowman, K.P.; Hong, Y.; Stocker, E.F.; Wolff, D.B. The TRMM Multisatellite Precipitation Analysis (TMPA): Quasi-global, multiyear, combined-sensor precipitation estimates at fine scales. J. Hydrometeorol. 2007, 8, 38–55. [Google Scholar] [CrossRef]
  4. Joyce, R.J.; Janowiak, J.E.; Arkin, P.A.; Xie, P. CMORPH: A method that produces global precipitation estimates from passive microwave and infrared data at high spatial and temporal resolution. J. Hydrometeorol. 2004, 5, 487–503. [Google Scholar] [CrossRef]
  5. Ushio, T.; Kubota, T.; Shige, S.; Okamoto, K.; Aonashi, K.; Inouge, T.; Takahashi, N.; Iguchi, T.; Kachi, M.; Oki, R.; et al. A Kalman filter approach to the Global Satellite Mapping of Precipitation (GSMaP) from combined passive microwave and infrared radiometric data. J. Meteorol. Soc. Jpn. 2009, 87A, 137–151. [Google Scholar] [CrossRef]
  6. Sun, W.C.; Ishidaira, H.; Bastola, S. Towards improving river discharge estimation in ungauged basins: Calibration of rainfall-runoff models based on satellite observations of river flow width at basin outlet. Hydrol. Earth Syst. Sci. 2010, 14, 2011–2022. [Google Scholar] [CrossRef]
  7. Samaniego, L.; Kumar, R.; Jackisch, C. Predictions in a data-sparse region using a regionalized grid-based hydrologic model driven by remotely sensed data. Hydrol. Res. 2011, 42, 338–355. [Google Scholar] [CrossRef]
  8. Khan, S.I.; Hong, Y.; Vergara, H.J.; Gourley, J.J.; Brakenridge, G.R.; De Groeve, T.; Flamig, Z.L.; Policelli, F.; Yong, B. Microwave satellite data for hydrologic modeling in ungauged basins. IEEE Geosci. Remote Sens. 2012, 9, 663–667. [Google Scholar] [CrossRef]
  9. Xue, X.; Hong, Y.; Limaye, A.S.; Gourley, J.J.; Huffman, G.J.; Khan, S.I.; Dorji, C.; Chen, S. Statistical and hydrological evaluation of TRMM-based multi-satellite precipitation analysis over the Wangchu basin of Bhutan: Are the latest satellite precipitation products 3B42V7 ready for use in ungauged basins? J. Hydrol. 2013, 499, 91–99. [Google Scholar] [CrossRef]
  10. Hong, Y.; Adler, R.; Huffman, G. Applications of TRMM-based multi-satellite precipitation estimation for global runoff simulation: Prototyping a global flood monitoring system. In Satellite Rainfall Applications for Surface Hydrology, 1st ed.; Gebremichael, M., Hossain, F., Eds.; Springer: Dordrecht, The Netherlands, 2010; pp. 245–265. [Google Scholar]
  11. Khan, S.I.; Hong, Y.; Wang, J.; Yilmaz, K.K.; Gourley, J.J.; Adler, R.F.; Brankenridge, G.R.; Policelli, F.; Habib, S.; Irwin, D. Satellite remote sensing and hydrologic modeling for flood inundation mapping in Lake Victoria basin: Implications for hydrologic prediction in ungauged basins. IEEE Trans. Geosci. Remote Sens. 2011, 49, 85–95. [Google Scholar] [CrossRef]
  12. Wu, H.; Adler, R.F.; Hong, Y.; Tian, Y.; Policelli, F. Evaluation of global flood detection using satellite-based rainfall and a hydrologic model. J. Hydrometeorol. 2012, 13, 1268–1284. [Google Scholar] [CrossRef]
  13. Vernimmen, R.R.E.; Hooijer, A.; Mamenun; Aldrian, E. Evaluation and bias correction of satellite rainfall data for drought monitoring in Indonesia. Hydrol. Earth Syst. Sci. 2011, 8, 5969–5997. [Google Scholar] [CrossRef]
  14. Bitew, M.M.; Gebremichael, M. Evaluation of satellite rainfall products through hydrologic simulation in a fully distributed hydrologic model. Water Resour. Res. 2011, 47, W06526. [Google Scholar] [CrossRef]
  15. Sohn, B.J.; Han, H.J.; Seo, E.K. Validation of satellite-based high-resolution rainfall products over the Korean Peninsula using data from a dense rain gauge network. J. Appl. Meteorol. Clim. 2010, 49, 701–714. [Google Scholar] [CrossRef]
  16. Su, F.; Hong, Y.; Lettenmaier, D.P. Evaluation of TRMM Multisatellite Precipitation Analysis (TMPA) and its utility in hydrologic prediction in the La Plata basin. J. Hydrometeorol. 2008, 9, 622–640. [Google Scholar] [CrossRef]
  17. Yong, B.; Ren, L.-L.; Hong, Y.; Wang, J.-H.; Gourley, J.J.; Jiang, S.-H.; Chen, X.; Wang, W. Hydrologic evaluation of Multisatellite Precipitation Analysis standard precipitation products in basins beyond its inclined latitude band: A case study in Laohahe basin, China. Water Resour. Res. 2010, 46, W07542. [Google Scholar] [CrossRef]
  18. Behrangi, A.; Khakbaz, B.; Jaw, T.C.; AghaKouchak, A.; Hsu, K.; Sorooshian, S. Hydrologic evaluation of satellite precipitation products over a mid-size basin. J. Hydrol. 2011, 397, 225–237. [Google Scholar] [CrossRef]
  19. Ward, E.; Buytaert, W.; Peaver, L.; Wheater, H. Evaluation of precipitation products over complex mountainous terrain: A water resources perspective. Adv. Water Resour. 2011, 34, 1222–1231. [Google Scholar] [CrossRef]
  20. Kim, J.P.; Park, K.W.; Jung, I.W.; Han, K.S.; Kim, G. Application of high resolution multi-satellite precipitation products and a distributed hydrological modeling for daily runoff simulation. Korean J. Remote Sens. 2013, 29, 263–274. (In Korean) [Google Scholar] [CrossRef]
  21. Yong, B.; Hong, Y.; Ren, L.-L.; Gourley, J.J.; Huffman, G.J.; Chen, X.; Wang, W.; Khan, S.I. Assessment of evolving TRMM-based multisatellite real-time precipitation estimation methods and their impacts on hydrologic prediction in a high latitude basin. J. Geophys. Res.-Atmos. 2012, 117. [Google Scholar] [CrossRef]
  22. Nikolopoulos, E.I.; Anagnostou, E.N.; Borga, M. Using High-resolution Satellite Rainfall Products to Simulate a Major Flash Flood Event in Northern Italy. J. Hydrometeorol. 2013, 14, 171–185. [Google Scholar] [CrossRef]
  23. Thiemig, V.; Rojas, R.; Zambrano-Bigiarini, M.; De Roo, A. Hydrological evaluation of satellite-based rainfall estimates over the Volta and Baro-Akobo Basin. J. Hydrol. 2013, 499, 324–338. [Google Scholar] [CrossRef]
  24. Tong, K.; Su, F.; Yang, D.; Hao, Z. Evaluation of satellite precipitation retrievals and their potential utilities in hydrologic modeling over the Tibetan Plateau. J. Hydrol. 2014, 519, 423–437. [Google Scholar] [CrossRef]
  25. Zulkafli, Z.; Buytaert, W.; Onof, C.; Manz, B.; Tarnavsky, E.; Lavado, W.; Guyot, J.-L. A comparative performance analysis of TRMM 3B42 (TMPA) versions 6 and 7 for hydrological applications over Andean–Amazon river basins. J. Hydrometeorol. 2014, 15, 581–592. [Google Scholar] [CrossRef]
  26. Mei, Y.; Nikolopoulos, E.I.; Anagnostou, E.N.; Borga, M. Evaluating Satellite Precipitation Error Propagation in Runoff Simulations of Mountainous Basins. J. Hydrometeorol. 2015. [Google Scholar] [CrossRef]
  27. Bae, D.H.; Jung, I.W.; Lettenmaier, D.P. Hydrologic uncertainties in climate change from IPCC AR4 GCM simulations of the Chungju Basin, Korea. J. Hydrol. 2011, 401, 90–105. [Google Scholar] [CrossRef]
  28. Water Management Information System (WAMIS). Available online: http://www.wamis.go.kr (accessed on 27 April 2016).
  29. Bae, D.H.; Jung, I.W.; Chang, H. Long-term trend of precipitation and runoff in Korean river basins. Hydrol. Process. 2008, 22, 2644–2656. [Google Scholar] [CrossRef]
  30. Jung, I.W.; Bae, D.H.; Lee, B.J. Possible change in Korean streamflow seasonality based on multi-model climate projections. Hydrol. Process. 2013, 27, 1033–1045. [Google Scholar] [CrossRef]
  31. Thiessen, A.H. Precipitation averages for large areas. Mon. Weather Rev. 1911, 39, 1082–1084. [Google Scholar] [CrossRef]
  32. Korean Meteorological Administration (KMA). Available online: http://www.kma.go.kr (accessed on 27 April 2016).
  33. TMPAv6 and TMPAv7. Goddard Space Flight Center. Available online: http://trmm.gsfc.nasa.gov (accessed on 27 April 2016).
  34. CMORPH. Climate Prediction Center. Available online: http://www.cpc.ncep.noaa.gov/products/janowiak/cmorph.shtml (accessed on 27 April 2016).
  35. GSMaP. Earth Observation Research Center. Available online: http://sharaku.eorc.jaxa.jp/GSMaP_crest/ (accessed on 27 April 2016).
  36. Tian, Y.; Peters-Lidard, C.D.; Adler, R.F.; Kubota, T.; Ushio, T. Evaluation of GSMaP Precipitation Estimates over the Contiguous United States. J. Hydrometeorol. 2010, 11, 566–574. [Google Scholar] [CrossRef]
  37. Wilks, D.S. Statistical Methods in the Atmospheric Science, 2nd ed.; Academic Press: San Diego, CA, USA, 1995. [Google Scholar]
  38. Ebert, E.E. Fuzzy verification of high resolution gridded forecasts: A review and proposed framework. Meteorol. Appl. 2008, 15, 51–64. [Google Scholar] [CrossRef]
  39. Leavesley, G.H.; Lichty, R.W.; Troutman, B.M.; Saindon, L.G. Precipitation runoff modeling system: User’s manual. In U.S. Geological Survey Water Resources Investigation Report 83-4238; U.S. Geological Survey: Denver, CO, USA, 1983; p. 207. [Google Scholar]
  40. Chang, H.; Jung, I.W. Spatial and temporal changes in runoff caused by climate change in a complex large river basin in Oregon. J. Hydrol. 2010, 388, 186–207. [Google Scholar] [CrossRef]
  41. Risley, J.; Moradkhani, H.; Hay, L.; Markstrom, S. Statistical Comparisons of Watershed-Scale Response to Climate Change in Selected Basins across the United States. Earth Interact. 2011, 15, 1–26. [Google Scholar] [CrossRef]
  42. Jung, I.W.; Moradkhani, H.; Chang, H. Uncertainty assessment of climate change impacts for hydrologically distinct river basins. J. Hydrol. 2012, 466, 73–87. [Google Scholar] [CrossRef]
  43. Markstrom, S.L.; Niswonger, R.G.; Regan, R.S.; Prudic, D.E.; Barlow, P.M. GSFLOW: Coupled ground-water and surface-water flow model based on the integration of the Precipitation-Runoff Modeling System (PRMS) and the Modular Ground-Water Flow Model (MODFLOW-2005). In U.S. Geological Survey Techniques and Methods 6–D1; USGS: Reston, VA, USA, 2008. [Google Scholar]
  44. PRMS. United States Geological Survey. Available online: http://wwwbrr.cr.usgs.gov/projects/SW_MoWS/PRMS.html (accessed on 27 April 2016).
  45. Steele, M.O. Effects of HRU Size on PRMS Performance in 30 Western U.S. Basins. Master’s Thesis, Portland State University, Portland, OR, USA, 18 April 2013. [Google Scholar]
  46. Allen, R.G.; Pereira, L.S.; Raes, D.; Smith, M. Crop Evapotranspiration: Guidelines for Computing Crop Water Requirements; Irrigation and Drainage Paper No. 56; Food and Agriculture Organization of the United Nations: Rome, Italy, 1998. [Google Scholar]
  47. Hay, L.E.; Leavesley, G.H.; Clark, M.P.; Markstrom, S.L.; Viger, R.J.; Umemoto, M. Step-wise, multiple-objective calibration of a hydrologic model for a snowmelt-dominated basin. J. Am. Water Resour. 2006, 42, 877–890. [Google Scholar] [CrossRef]
  48. Duan, Q.; Sorooshian, S.; Gupta, V.K. Effective and efficient global optimization for conceptual rainfall-runoff models. Water Resour. Res. 1992, 28, 1015–1031. [Google Scholar] [CrossRef]
  49. Westerberg, I.K.; Guerrero, J.L.; Younger, P.M.; Beven, K.J.; Seibert, J.; Halldin, S.; Freer, J.E.; Xu, C.Y. Calibration of hydrological models using flow-duration curves. Hydrol. Earth Syst. Sci. 2011, 15, 2205–2227. [Google Scholar] [CrossRef] [Green Version]
  50. Gupta, H.V.; Kling, H.; Yilmaz, K.K.; Martinez, G.F. Decomposition of the mean squared error and NSE performance criteria: Implications for improving hydrological modelling. J. Hydrol. 2009, 337, 80–91. [Google Scholar] [CrossRef]
  51. Willmott, C.J. On the validation of models. Phys. Geogr. 1981, 2, 184–194. [Google Scholar]
  52. Cohen Liechti, T.; Matos, J.P.; Boillat, J.-L.; Schleiss, A.J. Comparison and evaluation of satellite derived precipitation products for hydrological modeling of the Zambezi River Basin. Hydrol. Earth Syst. Sci. 2012, 16, 489–500. [Google Scholar] [CrossRef]
  53. Jiang, S.; Ren, L.; Hong, Y.; Yong, B.; Yang, X.; Yuan, F.; Ma, M. Comprehensive evaluation of multi-satellite precipitation products with a dense rain gauge network and optimally merging their simulated hydrological flows using the Bayesian model averaging method. J. Hydrol. 2012, 452, 213–225. [Google Scholar] [CrossRef]
  54. Falck, A.S.; Maggioni, V.; Tomasella, J.; Vila, D.A.; Diniz, F.L. Propagation of satellite precipitation uncertainties through a distributed hydrologic model: A case study in the Tocantins-Araguaia basin in Brazil. J. Hydrol. 2015, 527, 943–957. [Google Scholar] [CrossRef]
  55. Laviola, S.; Dong, J.; Kongoli, C.; Meng, H.; Ferraro, R.; Levizzani, V. An intercomparison of two passive microwave algorithms for snowfall detection over Europe. In Proceedings of the Geoscience and Remote Sensing Symposium (IGARSS), Milan, Italy, 26–31 July 2015; pp. 886–889.
  56. Kucera, P.A.; Lapeta, B. Leading Efforts to Improve Global Quantitative Precipitation Estimation. Bull. Am. Meteorol. Soc. 2014, 95, ES26–ES29. [Google Scholar] [CrossRef]
  57. Hou, A.Y.; Kakar, R.K.; Neeck, S.; Azarbarzin, A.A.; Kummerow, C.D.; Kojima, M.; Oki, R.; Nakamura, K.; Iguchi, T. The global precipitation measurement mission. Bull. Am. Meteorol. Soc. 2014, 95, 701–722. [Google Scholar] [CrossRef]
  58. Beven, K.; Westerberg, I. On red herrings and real herrings: Disinformation and information in hydrological inference. Hydrol. Process. 2011, 25, 1676–1680. [Google Scholar] [CrossRef]
  59. Stisen, S.; Sandholt, I. Evaluation of remote-sensing-based rainfall products through predictive capability in hydrological runoff modelling. Hydrol. Process. 2010, 24, 879–891. [Google Scholar] [CrossRef]
  60. Artan, G.; Gadain, H.; Smith, J.L.; Asante, K.; Bandaragoda, C.J.; Verdin, J.P. Adequacy of satellite derived rainfall data for stream flow modeling. Nat. Hazards 2007, 43, 167–185. [Google Scholar] [CrossRef]
  61. Yilmaz, K.K.; Hogue, T.S.; Hsu, K.; Sorooshian, S.; Gupta, H.V.; Wagener, T. Intercomparison of rain gauge, radar, and satellite-based precipitation estimates with emphasis on hydrologic forecasting. J. Hydrometeorol. 2005, 6, 497–517. [Google Scholar] [CrossRef]
Figure 1. Location, elevation, and hydrologic response unit (HRU) boundaries of the Soyang dam basin with locations of the 19 weather stations displayed on the left. The spatial resolution of the tropical rainfall measuring mission (TRMM) multi-satellite precipitation analysis (TMPA), global satellite mapping of precipitation (GSMaP), and climate prediction center (CPC) morphing technique (CMORPH) precipitation products over the Soyang dam basin are displayed on the right.
Remotesensing 08 00608 g001
Figure 2. Yearly correlation and root-mean-square error (RMSE) values between basin-averaged precipitation from TMPA version 6 (TMPAv6), TMPA version 7 (TMPAv7), GSMaP, CMORPH and gauged estimates over the Soyang dam basin (x axis). Each bar represents annual basin-averaged precipitation from 19 weather stations (y axis).
Remotesensing 08 00608 g002
Figure 3. Monthly mean correlations, RMSE, and p-bias over 2002–2009 between basin-averaged precipitation from TMPAv6, TMPAv7, GSMaP, CMORPH and gauged estimates over the Soyang dam basin. (a) r; (b) RMSE and (c) P-bias.
Remotesensing 08 00608 g003
Figure 4. Spatial variability of correlations averaged over 2002–2009 between basin-averaged precipitation from TMPAv6, TMPAv7, GSMaP, CMORPH and gauged estimates over the Soyang dam basin.
Remotesensing 08 00608 g004
Figure 5. Frequency bias index (FBI), false alarm ratio (FAR), probability of detection (POD), and equitable threat score (ETS) averaged over 2002–2009 for each satellite-derived precipitation product on a monthly scale.
Remotesensing 08 00608 g005
Figure 6. Comparison of monthly dam inflow observations and simulations from use of the satellite-derived precipitation products (top panel) and the respective residuals (lower panels) calculated as the monthly observation minus the simulated value.
Remotesensing 08 00608 g006
Figure 7. Estimated AET, SWE, snowmelt, soil moisture, and runoff by the PRMS hydrologic model using gauged precipitation and four satellite-derived precipitation products in 2005.
Remotesensing 08 00608 g007
Figure 8. Estimated AET, SWE, snowmelt, soil moisture, and runoff by the PRMS hydrologic model using gauged precipitation and four satellite-derived precipitation products in 2009.
Remotesensing 08 00608 g008
Figure 9. Scattergrams of daily basin-averaged precipitation and maximum temperature during winter (December, January, and February). The dashed line indicates the utilized temperature thresholds for snowfall (0.39 °C, tmax_allsnow) and rainfall (3.9 °C, tmax_allrain) within the PRMS hydrologic model.
Remotesensing 08 00608 g009
Table 1. Calibrated PRMS parameters used in the present study, including physical ranges.
Parameter NameDescriptionRangeUnits
adjmix_rainMonthly factor to adjust rain proportion in a mixed rain/snow event0.0001–3.0decimal fraction
cecn_coefMonthly convection condensation energy coefficient0.0001–20.0calories per degree
emis_nopptAverage emissivity of air on days without precipitation0.757–1.0decimal fraction
freeh2o_capFree-water holding capacity of snowpack0.01–0.2decimal fraction
potet_sublimFraction of potential evapotranspiration that is sublimated from snow in the canopy and snowpack0.1–0.75decimal fraction
tmax_allrainMonthly maximum air temperature when precipitation is assumed to be rain20.0–50.0degrees Fahrenheit
tmax_allsnowMonthly maximum air temperature when precipitation is assumed to be snow20.0–40.0degrees Fahrenheit
snowinfil_maxMaximum snow infiltration per day1.0~20.0inches/day
soil_moist_maxMaximum available water holding capacity3.0–10.0inches
soil2gw_maxMaximum amount of the capillary reservoir excess0.0001–5.0inches
sat_thresholdWater holding capacity of the gravity and preferential flow reservoirs1.0–20.0inches
smidx_coefFraction percolating from upper to lower zone free water storage0.0001–1.0decimal fraction
smidx_expExponent in non-linear contributing area0.2~0.81/inch
fastcoef_linDegree-day factor0.0001–1.0fraction/day
fastcoef_sqTemperature criteria at which snow begins to melt0.0001–1.0-
slowcoef_linLinear coefficient in equation to route preferential flow storage0.0001–1.0fraction/day
slowcoef_sqNon-linear coefficient in equation to route gravity reservoir storage0.0001–1.0-
ssr2gw_expNon-linear coefficient in equation used to route water from the gravity reservoir to the groundwater reservoir 0.8–1.2-
ssr2gw_rateLinear coefficient in equation used to route water from the gravity reservoir to the groundwater reservoir 0.0001–1.0fraction/day
pref_flow_denFraction of the soil zone in which preferential flow occurs0.1–1.00.1~1.0
gwflow_coefLinear coefficient in the equation to compute groundwater discharge0.0001–1.00.0001~1.0
Table 2. Performance statistics of the PRMS model for the calibration and validation periods.
PeriodCalibration (2002–2005)Validation (2006–2009)
Goodness of FitCorrKGEdP-biasCorrKGEdP-bias
Gauged0.930.930.972.220.860.820.92−3.13
TMPAv60.890.760.94−17.220.710.690.83−5.40
TMPAv70.900.750.94−12.780.740.730.85−3.68
GSMaP0.86−0.310.84−50.910.74−1.240.67−62.73
CMORPH0.84−0.960.80−62.990.77−1.750.65−67.95

