Article

Distributed-Temperature-Sensing Using Optical Methods: A First Application in the Offshore Area of Campi Flegrei Caldera (Southern Italy) for Volcano Monitoring

1
Istituto Nazionale di Geofisica e Vulcanologia (INGV), Sezione di Napoli Osservatorio Vesuviano, Via Diocleziano 328, 80124 Napoli, Italy
2
Optosensing S.r.L., Via Olivetti 1, Pozzuoli, 80079 Napoli, Italy
3
Istituto per l’Ambiente Marino Costiero (IAMC), CNR, Calata p.ta di Massa, 80133 Napoli, Italy
4
Dipartimento di Ingegneria Industriale e dell’Informazione, Seconda Università di Napoli, Via Roma 29, 80134 Aversa, Italy
5
Department of Geophysics and Space Science, Eötvös Loránd University, Pázmány Péter Sétány 1/C, 1117 Budapest, Hungary
*
Author to whom correspondence should be addressed.
Submission received: 16 May 2016 / Revised: 12 August 2016 / Accepted: 15 August 2016 / Published: 19 August 2016

Abstract

:
A temperature profile 2400 m along the off-shore active caldera of Campi Flegrei (Gulf of Pozzuoli) was obtained by the installation of a permanent fiber-optic monitoring system within the framework of the Innovative Monitoring for Coastal and Marine Environment (MON.I.C.A) project. The system consists of a submerged, reinforced, multi-fiber cable containing six single-mode telecom grade optical fibers that, exploiting the stimulated Brillouin scattering, provide distributed temperature sensing (DTS) with 1 m of spatial resolution. The obtained data show that the offshore caldera, at least along the monitored profile, has many points of heat discharge associated with fluid emission. A loose association between the temperature profile and the main structural features of the offshore caldera was also evidenced by comparing DTS data with a high-resolution reflection seismic survey. This represents an important advancement in the monitoring of this high-risk volcanic area, since temperature variations are among the precursors of magma migration towards the surface and are also crucial data in the study of caldera dynamics. The adopted system can also be applied to many other calderas which are often partially or largely submerged and hence difficult to monitor.

Graphical Abstract

1. Introduction

The measurement of surface temperature and its temporal variation in active volcanic areas provides critical information to improve the understanding of physical processes occurring at depth. Quiescent and active volcanism is almost always accompanied by heat and fluid output [1], and thus, thermal data are essential to assess the amount of energy being released and the mass transport within the shallow crust [2,3]. The thermal state of volcanoes and the temperature records are also important in correlating the areas of higher heat discharge with the main tectonics and structural features of volcanic edifices. Furthermore, thermal variation may be one of the precursors of an impending eruption, and it is crucial for eruption forecasting [4]. Among the different volcanic edifices, calderas are associated with the highest heat discharges at the surface as well as geothermal gradients [5]. This is typically related to large magma sources located at depth below the calderas, which activate heat convection of fluids in the shallow and highly fractured crust and form long-lived geothermal systems [6]. Many calderas, which are formed as a consequence of large roof collapse after voluminous magma withdrawal from a deep chamber [7], are difficult to monitor because they are frequently partially-submerged by the sea or lakes (e.g., Santorini, Greece; Taupo volcano, New Zeland; Taal, Philippines; Crater Lake, Oregon). A well-known example is the active caldera of Campi Flegrei, which is one of the highest volcanic risk areas worldwide and one of the most studied [8,9,10]. It is characterized by recurrent periods of unrest since at least since Roman times. Such unrests involve large and fast ground uplift (with rates of up to 1 m/year), shallow earthquakes (maximum depth around 3–4 km), and degassing and heat discharge at the surface [8]. The central part of the caldera (Solfatara) is affected by vigorous hydrothermal circulation, large CO2 diffuse degassing, and high thermal energy flux [11].
In recent times (at least since the onshore caldera has been monitored by geophysical and geochemical networks), the climax of unrest was attained during the 1970–1984 period when the center of caldera upraised by more than 3.5 m, and the uplift was accompanied by thousands of earthquakes and an increase of both gas discharge and temperature at the surface [12,13]. At the present, due to a slow but persistent uplift started in 2005, the alert level for the caldera has moved from “quiescent” (ordinary activity of volcano) to “attention” status. There are different interpretations of the mechanism for the Campi Flegrei caldera unrest, mostly related to the magmatic gas and thermal input, which perturbs shallow geothermal fluids [9,14]. The heating of the rocks caused by such uprising magmatic fluids can also be a central factor in triggering unrest [15]. Models for magma intrusion at shallower levels were also proposed [9,16,17].
Thus, thermal monitoring of calderas, jointly interpreted with other geophysical and geochemical signals, is crucial to understanding the risk related to impending eruptions. For this purpose, for the first time, an extended temperature profile of the offshore Campi Flegrei caldera (Bay of Pozzuoli) was recorded by the framework of the MON.I.C.A project (Innovative Monitoring of Coastal and Marine Environment) by using a permanent fiber-optic cable that is 2.4 km long and exploiting the stimulated Brillouin scattering method for distributed temperature sensing (DTS) [18]. Fiber-optic technology has experienced tremendous growth since the introduction in the 1990s of the first mass-produced fiber-optic sensors that are used to support industrial applications. Recently, the DTS method has been deployed in the field of geology and volcanology [19,20], although its use in this field is still rare.
The DTS data obtained in the Bay of Pozzuoli show the occurrence of many points of heat discharge along the offshore part of the caldera. The temperature profile has also been related to the main structural and volcanological features of this are which were obtained by high-resolution seismic reflection data. A general, fair agreement is obtained by comparing thermal and structural data. The submarine monitoring system is also equipped with three seismic stations (MEMS) and three high sensitive hydrometers in order to enhance the detection and location of earthquakes and, in the future, to measure the ground movements of the sea floor.
The MON.I.C.A project was planned and developed by the Istituto Nazionale di Geofisica e Vulcanologia—Osservatorio Vesuviano (INGV-OV), located in Naples, in cooperation with the National Research Council of Italy (CNR) and some private companies (HP System-Optosensing, Vitrociset, Deep Sea Technology, and Geomarine). The installation of this innovative monitoring system represents an important step to improve the knowledge of the caldera dynamics. In fact, although the onshore caldera is intensively monitored by geophysical and geochemical networks of INGV-OV, the offshore zone (which includes more than 50% of the caldera area) has only started to be monitored very recently. Furthermore, several models of ground deformation at Campi Flegrei, as well as models of the Bouguer gravity anomalies, show that the maximum displacement area is expected to occur in the Bay of Pozzuoli [21,22]. In addition, many important structures associated with the Campi Flegrei caldera collapse and resurgence area propagate offshore, close to the coastline [23,24]. An improvement of the offshore geophysical monitoring will provide new data acquisition, which is crucial to obtain a more complete picture of caldera unrest mechanisms and of the caldera’s extension in the submarine area.
Finally, we highlight that fiber-optic sensing could potentially be the solution for the increasing demand to have reliable multi-parametric sensors (such as strain and temperature) since it provides remote sensing and high networking capabilities in the volcanic environment.

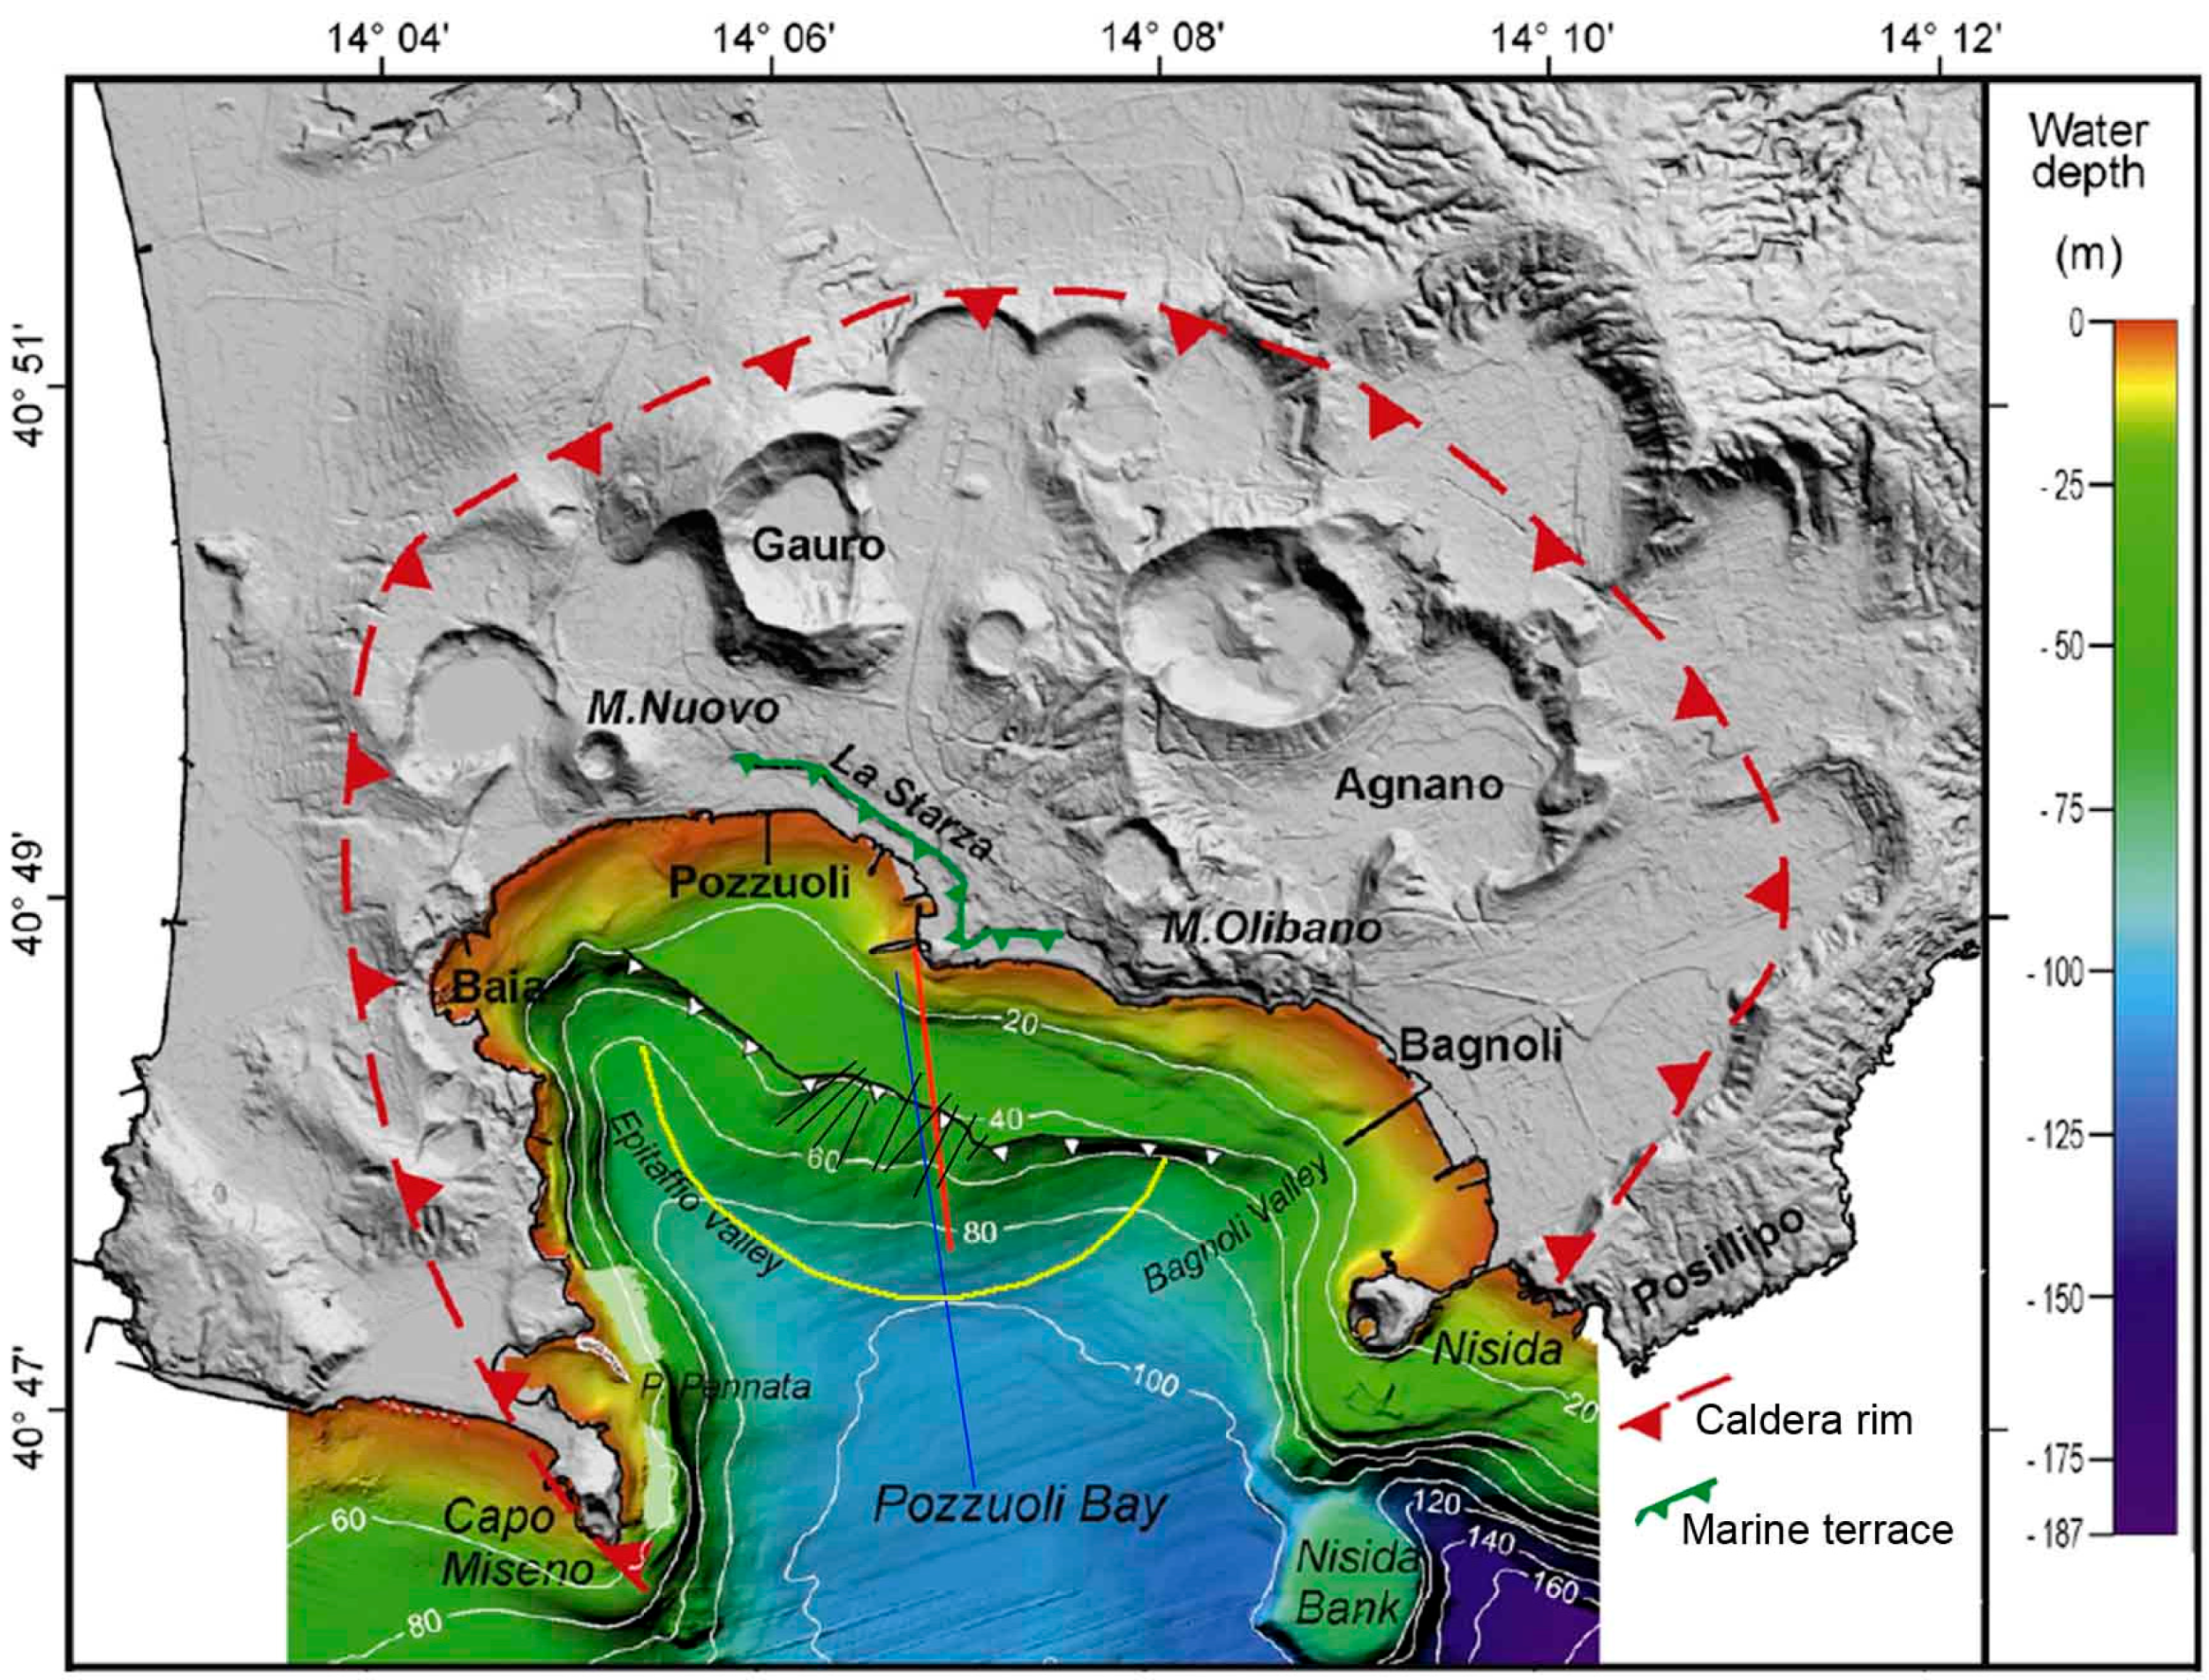
2. Geological Setting and Heat Discharge

The Campi Flegrei caldera is roughly 12 km wide and is centered in the Bay of Pozzuoli, about 15 km to the west of Naples (Figure 1). The current caldera shape is the result of two collapses related to the Campanian Ignimbrite eruption (CI; 150–200 km3 dense rock equivalent (DRE); age, 39 ky BP) and possibly to a minor subsidence associated with the Neapolitan Yellow Tuff eruption (NYT; 40 km3 DRE; age, 12–15.6 ky BP) [21,22,23,24,25]. The caldera is underlain by a primary zone of magma storage that is 1.2 km to 1.5 km thick, and which has a top at about 7.5 km below the surface [26]; there is also a quenched relict of an ancient magma source at a depth of about 4 km [9,16,17], which has possibly been intruded into by new magma during recent unrests [9,16,17].
Since Roman times, the caldera area has been characterized by slow aseismic subsidence [27,28], which has been interrupted by recurring phases of rapid uplift. Several phases of uplift have occurred since the Middle Ages, including the Monte Nuovo eruption (AD 1538; 0.02 km3 DRE) and, in recent times, during 1970–1972 and 1982–1984 when the town of Pozzuoli was raised by 1.7 and 1.8 m, respectively [29,30,31]. At the present, a slight uplift of the caldera has been recorded since 2005, with an uplift rate of a few millimeters per month and minor seismic swarm occurrences. The most deformed zone during the last unrest phase has a radius of about 2 km from the maximum uplift center (Pozzuoli harbor), while the deformation trend decreases rapidly away from the center due to the shallowness of the source (3–4 km) and possibly to the structural control of the ring faults. The extension of the structural boundary of the caldera is still debated due to poor knowledge about the offshore area, which extends into the Bay of Pozzuoli. This bay represents a minor inlet of the Gulf of Naples and is characterized by a central depression with maximum water depth of about 110 m b.s.l. (below see level) [24]. The Bay of Pozzuoli is characterized by the typical shelf/slope/basin morphology, with different terrace surfaces related to the ground movements of the caldera floor, coupled with sea level variations and erosional processes. Sacchi et al., (2014) [24] also show that a dome structure, correlated to the resurgence of the caldera, is centered in the Bay of Pozzuoli about 1.7 km south of Pozzuoli Harbor. This sector is marked by the presence of minor, normal faults that subsided the apical dome possibly by diffuse pore fluid circulation along the higher permeability zones [24,25,26,27,28,29,30,31,32]. As regards the thermal state of the caldera, there is surface evidence of the presence of a high temperature geothermal system, which is mainly developed in the central part of the caldera at Solfatara crater [6,7,8,9,10,11]. This roughly corresponds to the zone of major collapse filled by volcano-clastic deposits of post-caldera volcanic activity, as testified by gravity anomalies and seismic and geological surveys [33,34]. This zone extends offshore to Pozzuoli Harbor. The relative high permeability of the inner caldera filling [35] enhances the heat transport by fluid advections, allowing for the escape of fluids at the surface and producing a general increase of temperature towards the inner caldera [6]. Widespread surface temperatures above 30–40 °C can be recorded inside the caldera, while the maximum of about 70 °C to more than 100 °C occurs in the western and central-eastern sectors, respectively (Mofete and Solfatara-Agnano zones) [6,7,8,9,10,11,12,13,14,15,16,17,18,19,20,21,22,23,24,25,26,27,28,29,30,31,32,33,34,35,36]. The temperature records in the deep boreholes have also shown very high geothermal gradients (~150–200 °C·km−1) in the central-northern and western part of caldera, despite the minor occurrence of surface manifestations in respect to the Solfatara area. In this case, the high gradient recorded in the boreholes can be ascribed to geothermal fluid circulation along the main tectonic structures (faults and fractures) bounding the caldera which represent higher fracture-permeability zones [36]. During the period of quiescence, the central part of the caldera (Solfatara) typically releases about 1500 t·d−1 of hydrothermal CO2 through soil diffuse degassing and a total thermal energy flux of 1.19 × 10¹³ J·d−1 (138 MW) [11].

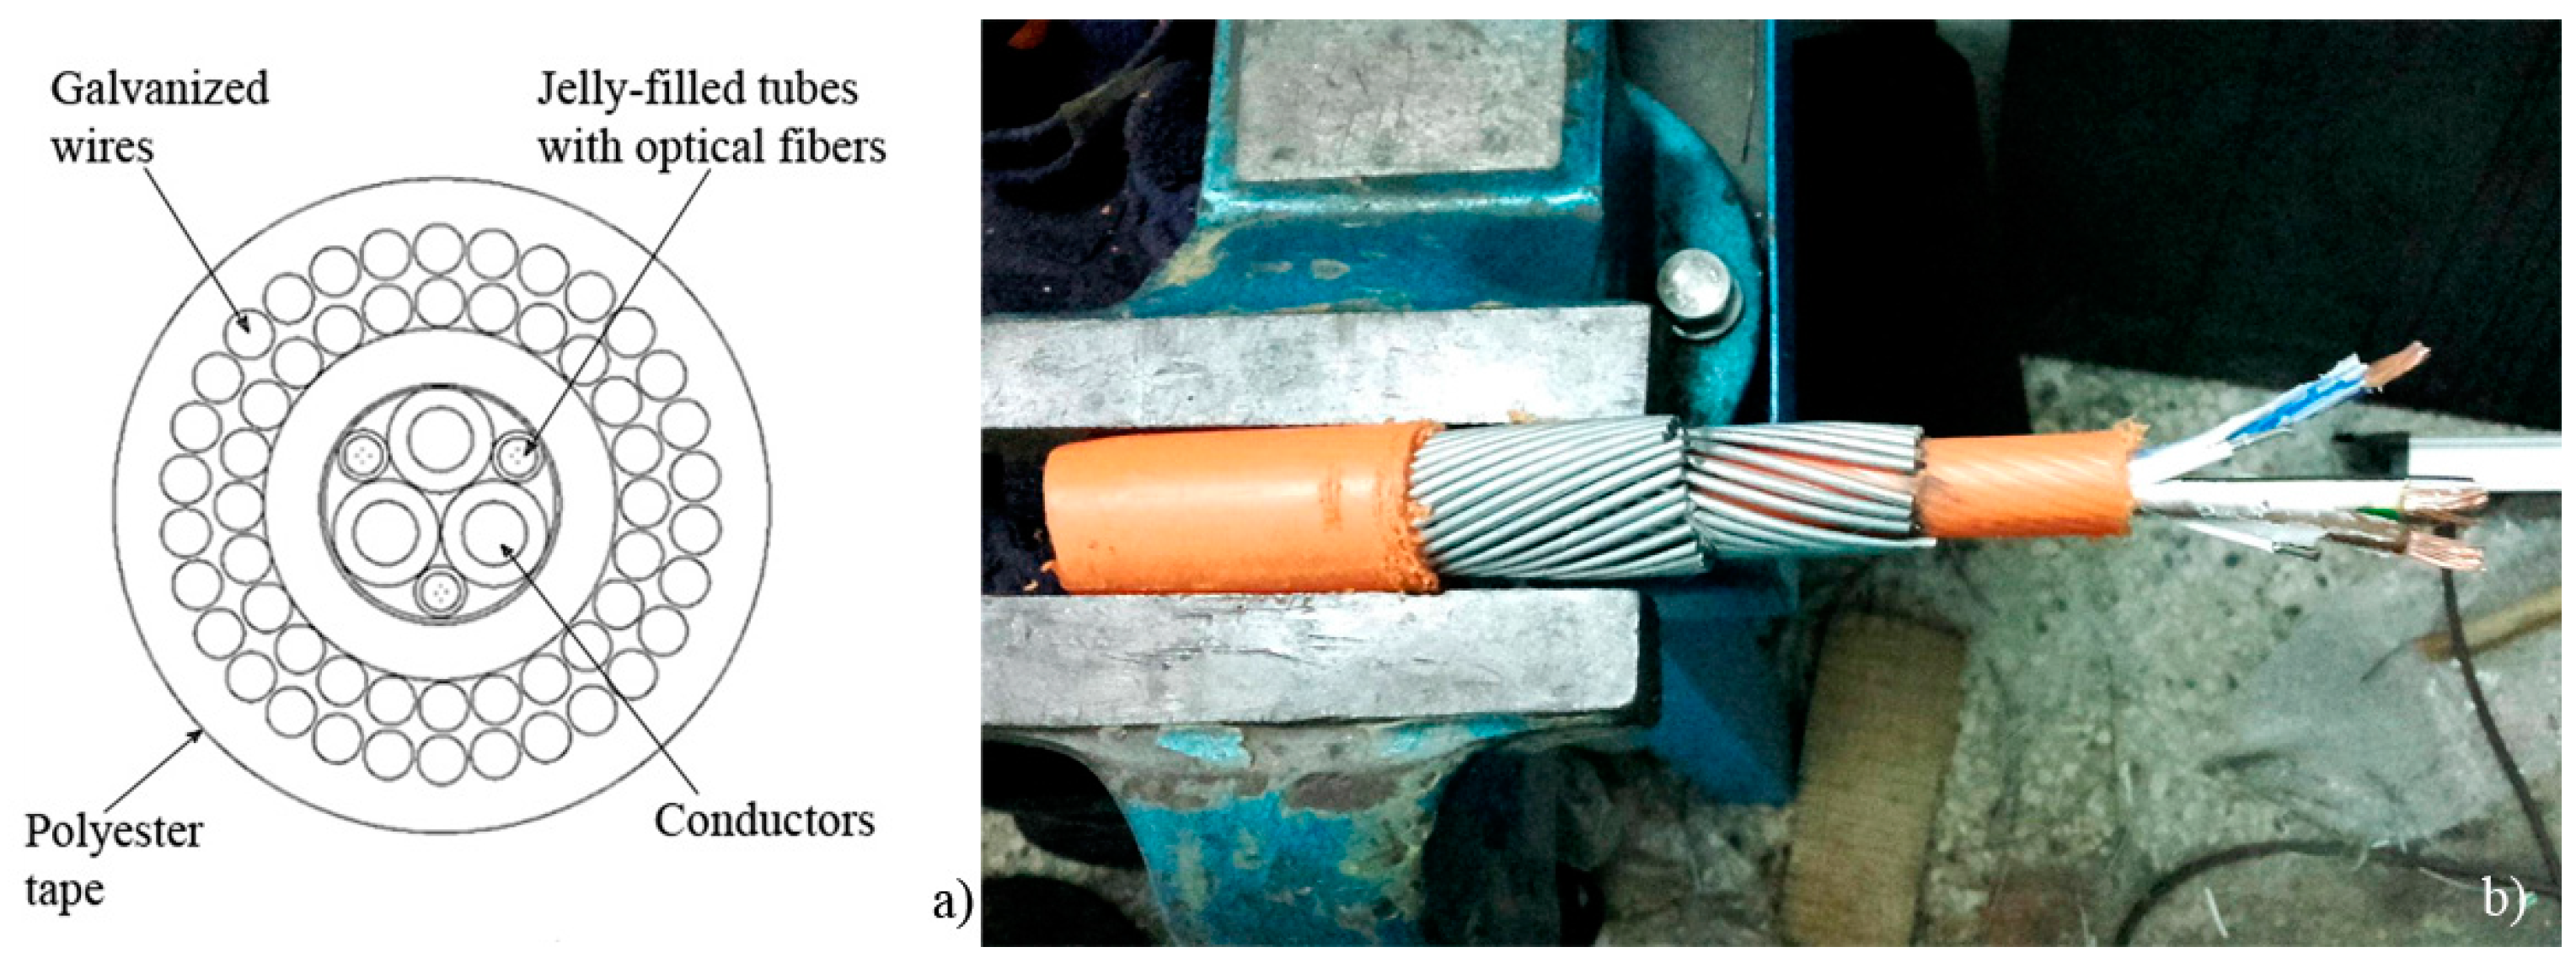
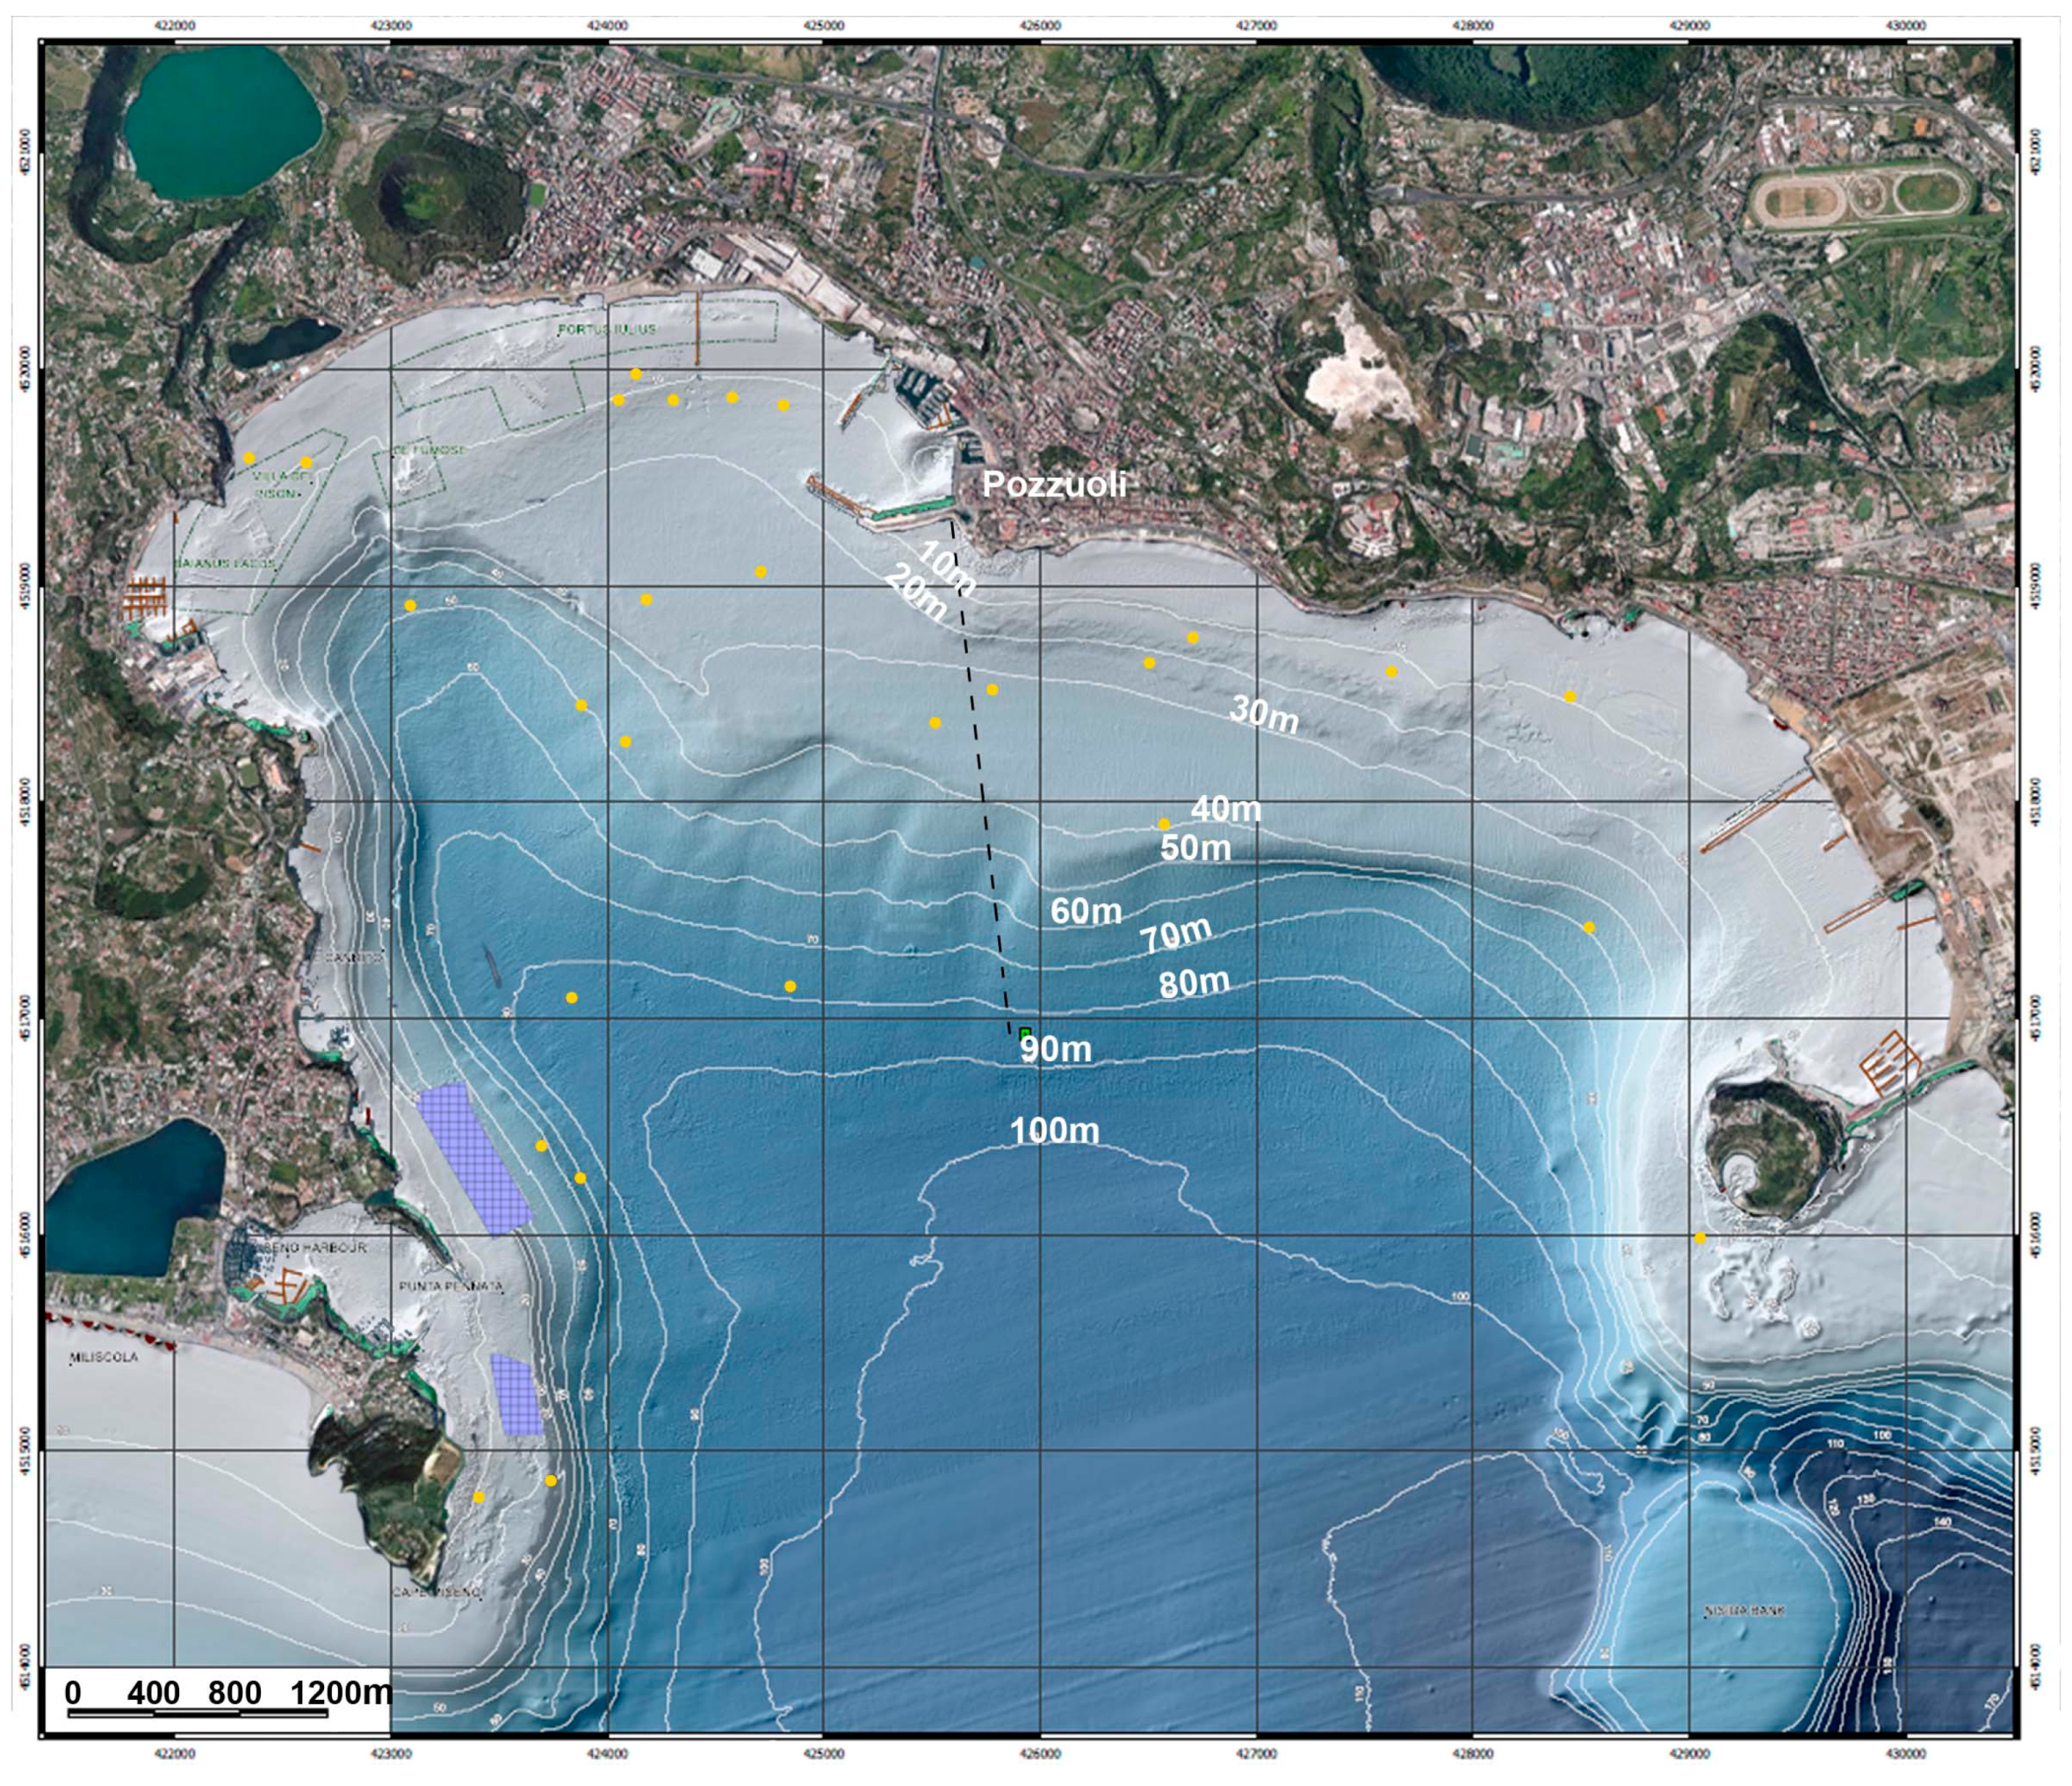
3. Network Configuration and Measurement Method

3.1. Configuration

The innovative monitoring system of the temperature at the bottom of sea floor in the Bay of Pozzuoli was installed between 2015 and 2016 by using a fiber-optic cable deployed on the sea floor and exploiting the stimulated Brillouin scattering [18]. The sensing device consists of a reinforced multi-fiber cable containing six single-mode telecom grade optical fibers. The cable has a nominal overall diameter of 30.7 mm, and is externally protected by polyester tape. The armoring is composed of contra-helical preformed galvanized wires with a diameter of 2.30 mm and a high-density polyethylene outer sheet (overall nominal thickness of 1 mm). The inner sheath is a low-density polyethylene with a nominal diameter of 16.5 mm and a nominal thickness of 2.8 mm (Figure 2a,b). The cable carries three bare copper conductors with an area of 6 mm2, cross-linked polyethylene insulation (elements laid up together with silicone water-blocking compound), and three jelly-filled stainless steel tubes, each one including four single-mode optical fibers 9/125 μ.
The cable was calibrated prior to installation by placing a 10 m piece of it into a climate chamber (Memmert HPP 110) with control of temperature (setting accuracy: ±1 °C) and relative humidity (setting accuracy: ±0.5% RH). Varying the temperature from 20 °C to 70 °C, while keeping the humidity at RH = 50%, the following parameters were derived: Brillouin Frequency Shift (BFS)/temperature transduction factor of 0.99 MHz·°C−1, and an intercept of 10,840 MHz (i.e., BFS = 10,840 MHz at T = 0 °C). For the temperature profile acquisition, two fibers were spliced together at the furthest end of the cable to form a loop, as required by the measurement method, while the remaining free ends were equipped with FC/APC connectors and positioned inside a rack on the Pozzuoli wharf. The rack was equipped with a suitable power supply and hosted the measurement unit. The total length of the cable is 2.4 km starting from the Pozzuoli Harbor and extending in a roughly N-S direction in the bay. It was buried, subsequently, in a narrow, excavated channel 1 m deep, within geological strata formed by sands, near the coast, with volcano-clastic sediments progressively decreasing in grain-size towards the offshore zone. Before the excavation and installation of the cable, a detailed geophysical survey of the sea bottom had been performed. This consisted of a high-resolution morpho-bathymetry of the Bay of Pozzuoli (see [37] for details) (Figure 3) and a sub bottom profiler along a strip 2.6 km long and 200 m wide, which provided information about the possible presence of buried bodies. The maximum depth of the optical cable is 85 m at the distance of ~2.4 km from the harbor, while the average depth of the monitored profile is about 50 m. At these depths the sea temperature is fairly constant during the different seasons [38] and considering the depth of buried cable, the environment steady-temperature does not affect the measurement on a short timescale (Figure 4).

3.2. Method

In our measurement system, the Brillouin frequency shift variation is soley due to temperature changes. The assumption of strain-free operation of the fiber is justified by the following facts: (1) the cable is a gel-filled, armored loose tube cable, with the inner fibers mechanically isolated from the outer environment; (2) the cable was deployed inside a trench excavated on the sea floor, and it was built into the soil in such a way that no mechanical stress was acting on it; (3) the junction boxes, used for connecting the submerged cable to the patch-cords transporting the optical signals to the reading unit, were submerged themselves; (4) the installation was performed by using a traction-power controller to avoid stress on the fiber-optic cable. Furthermore, as we will show in the following section, the maximum caldera uplift that occurred during our measurement was about 2.5 cm that, over a length of roughly 2.4 km, corresponds to a strain lower than 10−5. This cannot be detected by the Scattering Brillouin method whose resolution is ≥10−5. The DTS profiles reported in this paper were measured exploiting stimulated Brillouin scattering [18] in standard single mode telecom grade optical fibers. In brief, two counter-propagating light waves exchange energy along the fiber, in a measure depending on their frequency offset. If the difference falls within a specific range, the radiation at higher frequency (pump wave) transfers energy to that at lower frequency (Stokes wave). The sensing principle is based on the fact that the frequency difference at which maximum amplification of the Stokes wave occurs, known as Brillouin frequency shift (BFS), varies depending on the mechanical and thermal state of the fiber. In particular, the BFS increases with both temperature and strain. Spatial resolution, i.e., the ability to measure deformation and temperature changes in a distributed way, can be achieved through the use of a pulsed pump beam; in this way, the interaction takes place along successive sections of the fiber as the pump pulse propagates down the sensing cable. By recording the intensity of the Stokes radiation as a function of time, the Brillouin gain can be traced in each section. The measurement of the Brillouin gain as a function of time and frequency allows the entire profile of Brillouin shift along the fiber to be obtained, which in turn can be converted in terms of deformation or temperature by means of appropriate calibration coefficients [39].
The experimental set-up implementing the Brillouin optical time domain analysis (BOTDA) is shown in Figure 5. This system (OSD-1) is provided by the Optosensing Company. A distributed feedback diode laser operating at 1550 nm wavelength is used as the source for both pump and probe beams. The probe wave is obtained by a double sideband baseband suppressed carrier (DSB-SC) modulation. The pump pulse is generated by an intensity modulator IM2 driven by an electrical pulse generator. A polarization scrambler (SCRMB) is employed to average out the polarization-related Brillouin gain fluctuations. Pump and probe waves are optically amplified and sent to the opposite ends of the sensing fiber. The Brillouin signal is acquired and digitized by using a data acquisition system (DAQ), for each scanned pump-probe frequency shift. Finally, the waveforms are processed in order to retrieve the distributed Brillouin shift profile along the sensing fiber.

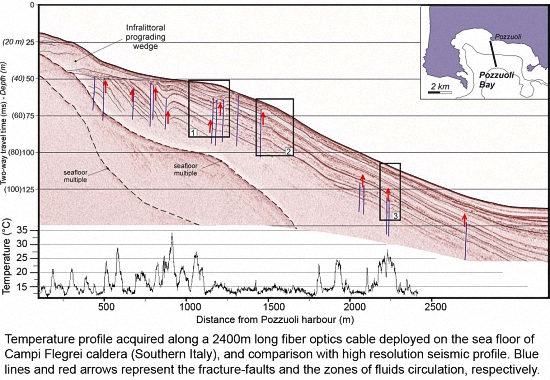
4. Results and Comparison with Main Volcano-Tectonic Features of off-Shore Caldera

The temperature profiles acquired along the 2.4 km long fiber-optic cable and deployed on the sea floor, at 2 m spatial resolution, are shown in Figure 6. The basal average temperature is about 13–14 °C according to that reported in literature for the Gulf of Naples [38]. The measures reported in this paper were performed between January and April 2016. The different temperature profiles were quite stable and show the presence of many peaks of temperature up to ~33 °C, with a maximum difference in respect to the basal temperature of about 20–21 °C. The hotter points can be correlated to the emission of hot fluids (degassing activity and/or hot springs) showing important hydrothermal activity in the offshore caldera. The wavelength of the observed thermal anomalies varies from 50 m to about 200 m. Very slight differences of temperature among the various acquired profiles were recorded; the larger differences were observed between the measurements performed in January and April 2016, as reported in Figure 6 and Figure 7. These differences can be associated to the actual temporal variations of the heat discharge, since they are above the error range (±1 °C). Therefore, an increase of temperature during the studied period is reasonable because the caldera has undergone a slow but continuous uplift for about 10 years (Figure 8a,b), a process that is also correlated to the upward migration of geothermal fluids [14]. Similar and also larger temperature variations were recorded at the Pisciarelli site (on shore caldera, east to Solfatara crater), since 2001 (Figure 9) [15]. Looking at the temperature profile (Figure 6), two main zones seem to have a significant thermal activity, the first one from about 150 m to 1200 m (at maximum depth of ~40 m), the second one from 1700 m to 2250 m (at a maximum depth of ~85 m). Between 1200 m and 1700 m a slight increase of temperature was also observed, along a line, which was previously characterized by ambient temperature (about 12 °C).

Comparison with Volcano-Tectonic Features

In order to evaluate the possible correlation with the main volcano-tectonic features of the off-shore caldera, the temperature profile was compared with the reflection seismic data provided by previous geophysical surveys (Figure 10a–d). This was obtained by very high-resolution single channel (uniboom) reflection profiles acquired using the IKB-Seistec profiler. The source emits useful frequencies in the range 1–20 kHz and, because of this wide frequency band, allows resolution of reflectors spaced 20 cm apart. This method was specifically designed for collecting very high-resolution data in shallow-water environments but can also be used in water depths >200 m [40,41]. Seismic data were recorded with a PreSeis digital acquisition system with 16 bits per sample, a sampling frequency of 100 kHz, and a recording length of 60–100 ms.
The time resolution and the fixed source–receiver geometry of the Seistec profiling system, together with its high sub-bottom penetration, allow for a quantitative analysis of the different seismic-signature shapes, geometries, and signal amplitudes.
The interpretation of the Seistec survey coupled with previous high-resolution reflection seismic surveys acquired in the Pozzuoli Bay provides new insights into the shallow structure and the latest Quaternary stratigraphic architecture of the submerged sector of the Campi Flegrei caldera. Major structural elements recognized offshore (from inner to outer sectors of the caldera) include: (a) an inner caldera resurgent dome; (b) a ring-fault system; (c) the structural rim of the caldera (see Figure 1). The caldera resurgent dome is circa 5 km in diameter and it is bounded by a system of normal faults dipping towards the center of the structure. The style of deformation of the dome is characterized by a broad antiformal folding of strata accompanied by subordinate faulting, mostly concentrated in a restricted area at the crest of the resurgent structure and subordinately along its flanks. Seismic records clearly show the presence of blanketing zones of reflections within the profiles which indicate the frequent occurrence of pore fluids within the sediments (Figure 10b) [42]. Seismic interpretation also suggests that individual fault zones likely represent preferential paths for fluids ascending through the shallower sediment layers. The ring fault is composed of a 1–2 km wide system of inward-dipping normal faults that are also characterized by diffuse migration of fluids to shallow, stratigraphic levels and local sub-surficial magmatic intrusions. The structural rim of the caldera is morphologically represented by the footwall of the ring fault zone where mostly older volcanic units occur at shallow depth beneath the seafloor. According with structural and seismic data, the temperature profile shows a loose association between few inferred zones of fracturing-faulting and fluid circulation and the temperature trend (Figure 10a). The comparison was performed to attain a general assessment in the correlation between the zones of thermal anomalies and the main geological features. In fact, the main fractures potentially represent the larger permeability zones, which allow the upward fluid migration. Otherwise, these fractures do not cut the surface, but are buried under a few meters of recent sediment. This possibly produces a diffusion of fluids into the soil at the interface between the top of fracture-faults and the top of soft sediment beds, so that the discharge points at the surface (sea bottom) might not necessary correspond to the alignment of the tectonic structures [36]. This process can be observed in Figure 10b, where fluids are identified in a zone along the sediments strata overlying the fractures.

5. Discussion

The data from the temperature monitoring system recorded in the off-shore zone of Campi Flegrei caldera (Gulf of Pozzuoli) indicate that this area, which was never extensively thermally monitored before, is characterized, at least along the 2400 m long profile, by a diffuse heat discharge associated with hot fumaroles and/or thermal springs. Previous data acquired from geophysical and geochemical marine surveys show the presence of active fluid vents, for which there are no temperature measurements, mainly aligned along the coastline [37] (Figure 3). Our data highlight that the geothermal system extends into the off-shore section of the caldera (Figure 10a–d) in accordance with the possible location of the magmatic source, as inferred from inversion geodetic and fluid-dynamic modeling related to recent unrests (1970–1972, 1982–1984, 2005 to present time) [14,19,20,21,22,23,24,25,26,27,28,29,30,31]. Particularly, two main sections far away from the coastline, from 150 m to 1200 m (at maximum depth of ~40 m) and from 1700 m to 2250 m (at a maximum depth of ~85 m), have shown quite-stable thermal activity with various temperature peaks, up to a maximum of about 33 °C and a difference of about 20 °C with respect to the background temperature. A maximum increase of about 5 °C was recorded, along different points of the thermal profile, between January and April 2016. During the same period, a maximum uplift of about 1 cm was recorded by the GPS network, at Pozzuoli center (Figure 8). This uplift trend, which has occurred since 2006 with a similar rate, can be associated to the fluid migration from the magmatic source to the surface [11,14,15]. This process is characterized by a large mass fluid transport that provides a relatively rapid increase of temperature at the surface due to convection [43,44]. Thus, extensive surface temperature measurements of the caldera, joined with others geophysical and geochemical data, provide further constraints in understanding the extension of the thermal anomaly and its temporal variation.
A loose association was observed between the main tectonic and geological features (inferred from a seismic profile lying along the same direction of the fiber-optical cable) and the temperature variation. The tectonic structures (fractures and faults) accommodating the uplift of the caldera were mainly identified along the apical doming zone of the caldera (Figure 1). This zone is characterized by hot fluid outflow along different vertical patterns, which in several cases corresponded to the zones of temperature increase. The spatial scale length of larger temperature variations is on the same order as the distance between the main tectonic structures inferred from the interpretation of the seismic profile.

6. Conclusions

An innovative underwater DTS monitoring system was installed in the active caldera of Campi Flegrei by using a fiber-optic cable deployed on the sea floor and exploiting the stimulated Brillouin scattering [18]. This lets us test the usefulness and the reliability of this method when applied to a submarine volcanic environment and measure the temperature over a long profile and compare the measurements with others geological data of the Campi Flegrei caldera. Thus, the installed temperature measurement system represents an important step in the monitoring of this high-risk volcanic area, since temperature changes are among the most robust precursors of gas and magma migration towards the surface, possibly forecasting impending eruptions. Furthermore, the caldera of Campi Flegrei is characterized by a deformation pattern, with transient behavior, that can be explained by the overlapping of short time pulses, that are caused by injection of magmatic fluids into the hydrothermal system and a longer time process of heating the rock [9,10,11,12,13,14,15]. Thus, the thermal monitoring system here presented can be used to better understand the driving processes related to transient phenomena and to mitigate potential hazards. It can also be applied to other hazardous calderas which are often partially or largely submerged and are difficult to monitor, such as Santorini (Greece), Taupo volcano (New Zeland), Taal (Philippines), Crater Lake (Oregon), and others (see [45] for details).
Furthermore, DTS is, potentially, a powerful and reliable method in the field of volcanology, and can be applied where the environmental conditions are adverse for the use of standard temperature sensors (e.g., areas with very high temperature gradients; fluid saturated volcanic rocks with high content of saline fluids; very high temperature-pressure environment such as geothermal zones with supercritical conditions). The robustness and versatility of the optical fibers in DTS applications make it possible to use them along excavations, deep boreholes, and in any type of harsh environments, with a broad perspective in geophysical monitoring. A further improvement of the adopted method can be obtained by using the optical fiber as a distributed or punctual strain sensor which [46,47] and, coupled with the temperature monitoring, provides a multi-parametric system that can be used virtually everywhere. A coupled measurement of temperature and strain will also provide a robust system that, together with an independent measurement technology for temperature, will be able to provide very reliable data. In conclusion, the advancements in the field of opto-electronics improved some important characteristics in distributed sensing such as durability, compactness, and resistance; these intrinsic characteristics make fiber optical sensing very attractive if applied to the monitoring of active volcanoes [46,47].

Acknowledgments

This work was supported by PON-MON.I.C.A project (Innovative Monitoring for Coastal and Marine Environment) (01.001. PON01-0). Temperature data can be requested from [email protected]. We are grateful to the Port Authority of Pozzuoli, the Regione Campania Authority and the Municipality of Pozzuoli for their support during the installation of the marine cable. We thank the Academic Editor and the three anonymous Referees for their helpful comments that greatly improved the quality of the paper.

Author Contributions

Stefano Carlino, Maurizio Mirabile, Luigi Zeni and Aldo Minardo conceived and designed the experiments; Stefano Carlino, Maurizio Miraile and Luigi Zeni performed the experiments; Maurizio Mirabile and Luigi Zeni analyzed the data; Stefano Carlino, Marco Sacchi, Mauro Caccavale, Claudia Troise, Virág Darányi and Giuseppe De Natale contributed analysis tools and provided seismic data; Stefano Carlino wrote the paper.

Conflicts of Interest

The authors declare no conflict of interest. The founding sponsors had no role in the design of the study, in the collection, analyses, or interpretation of data, nor in the writing of the manuscript, and in the decision to publish the results.

References

  1. Rothery, D.A.; Oppenheimer, C.; Bonneville, A. Infrared thermal monitoring. In Monitoring Active Volcanoes; McGuire, B., Kilburn, C.R.J., Murray, J., Eds.; UCL Press: London, UK, 1995; pp. 184–216. [Google Scholar]
  2. Brown, G.C.; Rymer, H.; Stevenson, D. Volcano monitoring by microgravity and energy budget analysis. J. Geol. Soc. Lond. 1991, 148, 589–593. [Google Scholar] [CrossRef]
  3. Hardee, H. Permeable convection above magma bodies. Tectonophysics 1982, 84, 179–195. [Google Scholar] [CrossRef]
  4. Bonneville, A.; Gouze, P. Thermal survey of Mount Etna volcano from space. Geophys. Res. Lett. 1992, 19, 725–728. [Google Scholar] [CrossRef]
  5. Hochstein, M.P.; Browne, P.R. Surface manifestations of geothermal system with volcanic heat sources. In Encyclopedia of Volcanoes; Sigurdsson, H., Houghton, B., McNutt, S.R., Rymer, H., Stix, J., Eds.; Academic Press: Cambridge, UK, 2000; pp. 835–855. [Google Scholar]
  6. Carlino, S.; Somma, R.; Troise, C.; De Natale, G. The geothermal exploration of Campanian volcanoes: Historical review and future development. Renew. Sustain. Energy Rev. 2012, 16, 1004–1030. [Google Scholar] [CrossRef]
  7. Lipman, P.W. Subsidence of ash-flow calderas: Relation to caldera size and magma-chamber geometry. Bull. Volcanol. 1997, 59, 198–218. [Google Scholar] [CrossRef]
  8. De Natale, G.; Troise, C.; Pingue, F.; Mastrolorenzo, G.; Pappalardo, L.; Boschi, E. The Campi Flegrei Caldera: Unrest mechanisms and hazards. In Mechanisms of Activity and Unrest at Large Calderas; Troise, C., de Natale, G., Kilburn, C.R.J., Eds.; Geological Society of London: London, UK, 2006; Volume 269, pp. 25–45. [Google Scholar]
  9. Carlino, S.; Somma, R. Eruptive versus non-eruptive behaviour of large calderas: the example of Campi Flegrei caldera (Southern Italy). Bull. Volcanol. 2010, 72, 871–886. [Google Scholar] [CrossRef]
  10. Acocella, V.; Di Lorenzo, R.; Newhall, C.; Scandone, R. An overview of recent (1988 to 2014) caldera unrest: Knowledge and perspectives. Rev. Geophys. 2015, 53, 896–955. [Google Scholar] [CrossRef]
  11. Chiodini, G.; Frondini, F.; Cardellini, C.; Granieri, D.; Marini, L.; Ventura, G. CO2 degassing and energy release at Solfatara volcano, Campi Flegrei, Italy. J. Geophys. Res. 2001, 106, 16213–16221. [Google Scholar] [CrossRef]
  12. Troise, C.; De Natale, G.; Pingue, F.; Obrizzo, F.; De Martino, P.; Tammaro, U.; Boschi, E. Renewed ground uplift at Campi Flegrei caldera (Italy): New insight on magmatic processes and forecast. Geophys. Res. Lett. 2007, 34. [Google Scholar] [CrossRef] [Green Version]
  13. Del Gaudio, C.; Aquino, I.; Ricciardi, G.P.; Ricco, C.; Scandone, R. Unrest episodes at Campi Flegrei: A reconstruction of vertical ground movements during 1905–2009. J. Volcanol. Geotherm. 2010, 195, 48–56. [Google Scholar] [CrossRef]
  14. Troiano, A.; Di Giuseppe, M.G.; Petrillo, Z.; Troise, C.; De Natale, G. Ground deformation at calderas driven by fluid injection: Modeling unrest episodes at Campi Flegrei (Italy). Geophys. J. Int. 2011, 187, 833–847. [Google Scholar] [CrossRef]
  15. Chiodini, G.; Vandemeulebrouck, J.; Caliro, S.; D’Auria, L.; De Martino, P.; Mangiacapra, A.; Petrillo, Z. Evidence of thermal-driven processes triggering the 2005–2014 unrest at Campi Flegrei caldera. Earth Planet. Sci. Lett. 2015, 414, 58–67. [Google Scholar] [CrossRef]
  16. Bianchi, R.; Coradini, A.; Federico, C.; Giberti, G.; Lanciano, P.; Pozzi, J.-P.; Sartoris, G.; Scandone, R. Modelling of surface ground deformation in volcanic areas: The 1970–1972 and 1982–1984 crises of Campi Flegrei, Italy. J. Geophys. Res. 1987, 92, 14139–14150. [Google Scholar] [CrossRef]
  17. Woo, J.Y.L.; Kilburn, C.R.J. Intrusion and deformation at Campi Flegrei, south-ern Italy: Sills, dikes, and regional extension. J. Geophys. Res. 2010, 115. [Google Scholar] [CrossRef]
  18. Kobyakov, A.; Sauer, M.; Chowdhury, D. Stimulated Brillouin scattering in optical fibers. Adv. Opt. Photon. 2010, 2, 1–59. [Google Scholar] [CrossRef]
  19. Curtis, A.; Kyle, P. Geothermal point sources identified in a fumarolic ice cave on Erebus volcano, Antarctica using fiber optic distributed temperature sensing. Geophys. Res. Lett. 2011, 38, L-16802. [Google Scholar] [CrossRef]
  20. Briggs, M.A.; Lautz, L.K.; McKenzie, J.M. A comparison of fibre-optic distributed temperature sensing to traditional methods of evaluating groundwater inflow to streams. Hydrol. Process. 2012, 26, 1277–1290. [Google Scholar] [CrossRef]
  21. Rosi, M.; Sbrana, A. Phlegrean fields. Consig Quadermi de la Ricerra Scientifica 1987, 114, 1–175. [Google Scholar]
  22. Beauducel, F.; De Natale, G.; Obrizzo, F.; Pingue, F. 3-D Modelling of Campi Flegrei Ground Deformations: Role of Caldera Boundary Discontinuities. In Geodetic and Geophysical Effects Associated with Seismic and Volcanic Hazards; Fernández, J., Ed.; Birkhäuser Basel: Basel, Switzerland, 2004; Volume 161, pp. 1329–1344. [Google Scholar]
  23. Sacchi, M.; Alessio, G.; Aquino, I.; Esposito, E.; Molisso, F.; Nappi, R.; Porfido, S.; Violante, C. Risultati preliminari della campagna oceanografica CAFE_07—Leg 3 nei Golfi di Napoli e Pozzuoli, Mar Tirreno Orientale. Quad. Geofis. 2009, 64, 3–26. [Google Scholar]
  24. Sacchi, M.; Pepe, F.; Corradino, M.; Insinga, D.D.; Molisso, F.; Lubritto, C. The Neapolitan Yellow Tuff caldera offshore the Campi Flegrei: Stratal architecture and kinematic reconstruction during the last 15 ky. Mar. Geol. 2014, 354, 15–33. [Google Scholar] [CrossRef] [Green Version]
  25. Deino, A.L.; Orsi, G.; de Vita, S.; Piochi, M. The age of the Neapolitan Yellow Tuff caldera-forming eruption (Campi Flegrei caldera, Italy) assessed by 40Ar/39Ar dating method. J. Volcanol. Geotherm. Res. 2004, 133, 157–170. [Google Scholar] [CrossRef]
  26. Zollo, A.; Maercklin, N.; Vassallo, M.; Dello Iacono, D.; Virieux, J.; Gasparini, P. Seismic reflections reveal a massive melt layer feeding Campi Flegrei caldera. Geophys. Res. Lett. 2008, 35. [Google Scholar] [CrossRef] [Green Version]
  27. Dvorak, J.J.; Mastrolorenzo, G. The mechanism of recent vertical crustal movements in Campi Flegrei caldera, southern Italy. Geol. Soc. Am. Spec. Pap. 1991, 263, 1–48. [Google Scholar]
  28. Bellucci, F.; Woo, J.; Kilburn, C.R.J.; Rolandi, G. Ground deformation at Campi Flegrei, Italy: implications for hazard assessment. In Mechanisms of Activity and Unrest at Large Calderas; Troise, C., De Natale, G., Kilburn, C.R.J., Eds.; Geological Society of London: London, UK, 2006; Volume 269, pp. 141–157. [Google Scholar]
  29. Morhange, C.; Bourciern, M.; Laborel, J.; Gialannella, C.; Goiran, J.P.; Crimaco, L.; Vecchi, L. New data on historical relative sea level movements in Pozzuoli Phlaegrean Fields, southern Italy. Phys. Chem. Earth 1999, A24, 349–354. [Google Scholar] [CrossRef]
  30. Morhange, C.; Marriner, N.; Laborel, J.; Todesco, M.; Oberlin, C. Rapid sea-level movements and non-eruptive crustal deformations in the Phlaegrean Fields caldera, Italy. Geology 2006, 34, 93–96. [Google Scholar] [CrossRef]
  31. Lirer, L.; Rolandi, G.; Di Vito, M.A.; Mastrolorenzo, G. L’eruzione del Monte Nuovo (1538) nei Campi Flegrei. Boll. Soc. Geol. Ital. 1987, 106, 447–460. [Google Scholar]
  32. Acocella, V. Evaluating fracture patterns within a resurgent caldera: Campi Flegrei, Italy. Bull. Volcanol. 2010, 72, 623–638. [Google Scholar] [CrossRef]
  33. Berrino, G.; Corrado, G.; Luongo, G.; Toro, B. Ground deformation and gravity changes accompainying the 1982 Pozzuoli uplift. Bull. Volcanol. 1984, 47, 187–200. [Google Scholar] [CrossRef]
  34. Scandone, R.; Bellucci, F.; Lirer, L.; Rolandi, G. The structure of the Campanian Plain and the activity of the Neapolitan volcanoes (Italy). J. Volcanol. Geotherm. Res. 1991, 48, 1–31. [Google Scholar] [CrossRef]
  35. Heap, M.J.; Baud, P.; Meredith, P.G.; Vinciguerra, S.; Reuschlé, T. The permeability and elastic moduli of tuff from Campi Flegrei, Italy: Implications for ground deformation modelling. Solid Earth 2014, 5, 25–44. [Google Scholar] [CrossRef]
  36. AGIP. Geologia e Geofisica del Sistema Geotermico dei Campi Flegrei; Technical Report; Settore Esplor e Ric Geoterm-Metodol per l’Esplor Geotermica; AGIP: Milan, Italy, 1897; pp. 1–23. [Google Scholar]
  37. Somma, R.; Iuliano, S.; Matano, F.; Molisso, F.; Passaro, S.; Sacchi, M.; Troise, C.; De Natale, G. High-resolution morpho-bathymetry of Pozzuoli Bay, southern Italy. J. Maps 2015. [Google Scholar] [CrossRef]
  38. Ribera D’alcalà, M.; Conversano, F.; Corato, F.; Licandro, P.; Mangoni, O.; Marino, D.; Mazzocchi, M.G.; Modigh, M.; Montresor, M.; Nardella, M.; et al. Seasonal patterns in plankton communities in a pluriannual time series at a coastal Mediterranean site (Gulf of Naples): An attempt to discern recurrences and trends. Sci. Mar. 2002, 68, 65–83. [Google Scholar] [CrossRef]
  39. Minardo, A.; Bernini, R.; Zeni, L. Stimulated Brillouin scattering modeling for high-resolution, time-domain distributed sensing. Opt. Express 2007, 15, 10397–10407. [Google Scholar] [CrossRef] [PubMed]
  40. Simpkin, P.G.; Davis, A. For seismic profiling in very shallow water, a novel receiver. Sea Technol. 1993, 34, 9. [Google Scholar]
  41. Mosher, D.C.; Simpkin, P.G.; Peter, G. Environmental Marine Geoscience 1. Status and Trends of Marine High-Resolution Seismic Reflection Profiling: Data Acquistion. Geosci. Can. 1999, 26, 174–188. [Google Scholar]
  42. Fleischer, P.; Orsi, T.H.; Richardson, M.D.; Anderson, A.L. Distribution of free gas in marine sediments: A global overview. Geo-Mar. Lett. 2001, 21, 103–122. [Google Scholar]
  43. Jaupart, C.; Mareschal, J.C. Heat Generation and Transport in the Earth; Cambridge University Press: Cambridge, UK, 2010. [Google Scholar]
  44. Carlino, S.; Troiano, A.; Di Giuseppe, M.G.; Tramelli, A.; Troise, C.; Somma, R.; De Natale, G. Exploitation of geothermal energy in active volcanic areas: A numerical modelling applied to high temperature Mofete geothermal field, at Campi Flegrei caldera (Southern Italy). Renew. Energy 2016, 87, 54–66. [Google Scholar] [CrossRef]
  45. Newhall, C.A.; Dzurisin, D. Historical Unrest at Large Calderas of the World; United States Geological Survey: Reston, VA, USA, 1988. [Google Scholar]
  46. Ferraro, P.; De Natale, G. On the possible use of optical fiber Bragg gratings as strain sensors for geodynamical monitoring. Opt. Lasers Eng. 2002, 37, 115–130. [Google Scholar] [CrossRef]
  47. Gagliardi, G.; Salza, M.; Ferraro, P.; De Natale, P.; Di Maio, A.; Carlino, S.; De Natale, G.; Boschi, E. Design and test of a laser-based optical-fiber Bragg-grating accelerometer for seismic applications. Meas. Sci. Technol. 2008, 19, 085306. [Google Scholar] [CrossRef]
Figure 1. Main structures and morphological features of the onshore and offshore caldera of Campi Flegeri (after [24]). The solid red and yellow lines in the offshore area represent the trace of the fiber-optic cable and the southern limit of the doming zone, respectively. The blue line is the section of the seismic profile. Black lines in the offshore area represent the faulting zones of the apical dome (see text for details).
Remotesensing 08 00674 g001
Figure 2. (a) Sketch of the cable section and (b) split of cable with external galvanized wires and internal optical cables and conductors.
Remotesensing 08 00674 g002
Figure 3. High resolution morpho-bathymetry of Pozzuoli Bay (modified after [37]). The dotted line is the trace of the optical fiber cable. Yellow circles are the fluid emissions inferred from the high-resolution survey.
Remotesensing 08 00674 g003
Figure 4. Average seasonal temperature variation (y-axis in Celsius degrees) of sea water in the Gulf of Naples between 10 m and 70 m of depth (modified after [38]).
Remotesensing 08 00674 g004
Figure 5. Schematic view of the Brillouin optical time domain analysis (BOTDA) setup. DFB-LD: distributed feedback diode laser; RF: radio frequency generator; SCRMB: polarization scrambler; SMC: single mode coupler; EDFA: erbium doped fiber amplifier; IS: optical isolator; IM: intensity modulators; DAQ: data acquisition system; FUT: fiber under test; TH and NF-DET: photodetectors; CIRC: circulators; FBG: fiber Bragg grating (modified after [39]).
Remotesensing 08 00674 g005
Figure 6. Distributed temperature sensing (DTS) profiles of the off-shore caldera measured by the optical fiber system during 15 January 2016 and 28 April 2016 along a roughly N-S direction. The differences in temperature between the two profiles, above the instrumental error (±1 °C), can be correlated to the temporal variation of heat discharge, which is generally recorded in the onshore area (e.g., Solfatara-Pisciarelli geothermal system).
Remotesensing 08 00674 g006
Figure 7. Temperature difference along the fiber-optic cable, recorded between January and April 2016.
Remotesensing 08 00674 g007
Figure 8. (a) Caldera uplift recorded by GPS station, since 2016, at Pozzuoli center (database Istituto Nazionale di Geofisica e Vulcanologia—Osservatorio Vesuviano (INGV-OV)). The red bar is the time during which temperature measurements were performed between the end of January (baseline) and April 2016; (b) Variation of temperature vs. time recorded during the measurements. The temperature trend refers to two fixed points (at 200 m and 1900 m) where significant variation has been observed (see also Figure 5 and Figure 6); the line between 1200 m and 1700 m along which a slight increase of temperature has been observed with respect to the initial ambient temperature (see Figure 5). The variation along this line is calculated by averaging the temperature values.
Remotesensing 08 00674 g008
Figure 9. Time series of discharge temperature at Pisciarelli fumarole, eastern to the crater rim of Solfatara (Pozzuoli) (modified after [15]). Data show that temperature variations of tens of degrees can occur at different temporal scales.
Remotesensing 08 00674 g009
Figure 10. (a) Temperature profile, acquired along a 2400 m long fiber cable deployed on the sea floor, and comparison with high resolution seismic profile (see text for details). The latter is parallel to the optical fiber cable and runs at few meters from it (see black line on the box). The profile shows a number of hot discharge points, from about 150 m to 1200 m (at maximum depth of ~40 m) from the Pozzuoli harbor, and from 1700 m to 2250 m (at a depth of ~85 m). The seismic profile shows a number of small-scale tectonic features such as faults (blue lines) and folds, and also highlights the possible occurrence of fluids discharges (red arrows) along the fractured shallow crust. A loose association can be inferred between geological features and temperature variations (see text for details); (bd) Zoom of boxes 1, 2 and 3 of Figure 10a. They show the particulars of the zones with main fluid circulation inferred from the interpretation of the seismic profile. The numbers on the vertical scale refer to the two-way travel time and depth, as showed in Figure 10a.
Remotesensing 08 00674 g010aRemotesensing 08 00674 g010b

