Article

The Sensitivity of AOD Retrieval to Aerosol Type and Vertical Distribution over Land with MODIS Data

1
Department of Geoscience and Remote Sensing (GRS), Delft University of Technology (TUDelft), Stevinweg 1, 2628 CN Delft, The Netherlands
2
Royal Netherlands Meteorological Institute (KNMI), Utrechtseweg 297, 3731 GA De Bilt, The Netherlands
*
Author to whom correspondence should be addressed.
Submission received: 26 July 2016 / Revised: 10 September 2016 / Accepted: 13 September 2016 / Published: 17 September 2016

Abstract

:
This study is to evaluate the sensitivity of Aerosol Optical Depth (AOD τ) to aerosol vertical profile and type, using the Moderate Resolution Imaging Spectroradiometer (MODIS) collection 6 algorithm over land. Four experiments were performed, using different aerosol properties including 3 possible non-dust aerosol models and 14 vertical distributions. The algorithm intrinsic uncertainty was investigated as well as the interplay effect of aerosol vertical profile and type on the retrieval. The results show that the AOD retrieval is highly sensitive to aerosol vertical profile and type. With 4 aerosol vertical distributions, the algorithm with a fixed vertical distribution gives about 5% error in the AOD retrieval with aerosol loading τ 0 . 5 . With pure aerosols (smoke and dust), the retrieval of AOD shows errors ranging from 2% to 30% for a series of vertical distributions. Errors in aerosol type assumption in the algorithm can lead to errors of up to 8% in the AOD retrieval. The interplay effect can give the AOD retrieval errors by over 6%. In addition, intrinsic algorithm errors were found, with a value of >3% when τ> 3.0. This is due to the incorrect estimation of the surface reflectance. The results suggest that the MODIS algorithm can be improved by considering a realistic aerosol model and its vertical profile, and even further improved by reducing the algorithm intrinsic errors.

Graphical Abstract

1. Introduction

Aerosol Optical Depth (AOD) retrieved from satellite data is of importance for a number of studies including climate change, air quality, and human health due to the advantage of large spatial and temporal coverage. Many AOD products from different algorithms/instruments have been developed and extensively validated with the data collected by the Aerosol Robotic Network (AERONET). Experienced after several generations of developments [1,2,3,4], the MODerate Resolution Imaging Spectroradiometer (MODIS) AOD product has been proven to be a mature product and widely applied for determining aerosol climatology, such as for long-term trend analysis of aerosol e.g., [5,6,7], for monitoring air quality due to fine particulate matter e.g., [8,9,10,11], for data assimilation studies e.g., [6,12,13,14], and for estimating aerosol radiative forcing e.g., [15,16,17].
Currently, the operational MODIS AOD product from collection 6 dark target (C6_DT) has an Expected Error (EE) of ±(0.05 + 15%), with 69% AOD falling within the EE over land [4]. However, the current accuracy of the MODIS AOD over land is still low. This means that the MODIS AOD cannot be used to well monitor its long-term trend [5], to accurately estimate aerosol radiative forcing [18], and to well serve for data assimilation studies [14,19].
It is well known that the satellite AOD uncertainty is attributed to many factors, such as surface effects e.g., [20,21,22], cloud mask e.g., [4,23] and aerosol properties e.g., [3,24,25]. This is well summarized and documented in [5,26]. For the MODIS AOD product, however, more efforts should be made on the aerosol properties, because the assumptions of the fixed aerosol type (non-dust) and its vertical profile applied in the algorithm is generally inconsistent with real cases and could lead to some serious errors in the retrieval.
Specifically, the assumption of a non-dust model could cause some problems when some unusual aerosol source occurs (e.g., forest fires) or aerosol absorption varies significantly during a period (month or season) since the non-dust model is predefined. For example, the effect of smoke by a forest fire that appears in North America (Canada) [27] and in South Africa [28], would be wrongly accounted by the algorithm. Due to the fixed single scattering albedo applied for the smoke, a significant bias of the AOD retrieval was found over the biomass-burning area in South Africa [28,29].
In addition, with the assumption of the fixed aerosol vertical profile, the MODIS algorithm would give a significant bias in the AOD retrieval in the presence of the dynamic profile especially for the elevated aerosol layers. ±2 km uncertainty in the layer height can introduce 25% errors in the AOD retrieval using the blue band (0.41 μ m) [30]. Through the global evaluation of the MODIS algorithm, Levy et al. [31] found that over heavy dust regions there was a significant negative bias in the AOD product.
To understand the impact of the aerosol properties on the AOD retrieval and further help to improve the retrieval, a sensitivity test is designed in this study that investigates the variation of the retrieval due to the dynamic aerosol vertical profiles and different types with the MODIS C6_DT algorithm. In the test, synthetic data are simulated for the Top Of Atmosphere reflectance, using an off-line method with LookUp Tables (LUT). Section 2 presents background on the MODIS aerosol retrieval, including the MODIS retrieval algorithm [3,4], and some climatological aerosol. Three non-dust models and one dust model from [3] are briefly introduced, as well as many kinds of aerosol vertical profiles. Section 3 gives the data and method applied in the sensitivity test. Four experiments are performed in the test with extensive aerosol properties. The experiment results and discussions are illustrated in Section 4. Conclusions and recommendations are drawn in Section 5.

2. Background on the MODIS Aerosol Retrieval

2.1. Basic Theory of the Aerosol Retrieval Algorithm

Assuming a surface having isotropic reflection, the TOA reflectance ρ * at a particular wavelength λ can be approximated as the sum of atmospheric path reflectance ρ λ a and surface contribution (the second term on the right side of the Equation (1)) [32]:
ρ λ * ( θ 0 , θ , ϕ ) = ρ λ a ( θ 0 , θ , ϕ ) + F d λ ( θ 0 ) T λ ( θ ) ρ λ s 1 - s λ ρ λ s ,
where θ 0 , θ, ϕ are the solar zenith angle, the viewing zenith angle and the relative azimuth angle between solar azimuth and viewing azimuth angle, respectively, F d λ and T λ are the downward and upward transmission, respectively, and s λ is the atmospheric backscattering ratio. Except for surface reflectance ρ s , the four parameters ρ a , F d , T and s are a function of the aerosol properties in the atmosphere and stored in the LookUp Table (LUT).
To consider the mixture of fine and coarse aerosols, the algorithm assumes that the fine and coarse aerosols independently contribute to the TOA reflectance. Thus, the total spectral reflectance at the TOA can be written as:
ρ λ t o t * = η ρ λ f * + ( 1 - η ) ρ λ c * ,
where the superscript f and c indicate fine and coarse mode, respectively, η is the fine ratio proposed in [1]. This method for the calculation of the total reflectance at TOA is also called Standard Linear Mixing method (SLM), which is applied to the dark surface with the 2.11 μ m surface reflectance of 0 < ρ 2 . 11 s < 0 . 25 (Procedure A in C6_DT) [2].
The AOD retrieval is achieved by fitting the simulated TOA reflectance with the measured one in three channels (0.466, 0.644 and 2.11 μ m), yielding AOD τ, fine ratio η and the 2.11 μ m surface reflectance ρ 2 . 11 s . In this process, there is a fitting error ϵ, which is used to indicate the quality of the retrieval.

2.2. Aerosol Properties

2.2.1. Aerosol Type

In the C6_DT algorithm, applied to the dark surface, it considers four aerosol models (3 non-dust and one dust) [3,4]. The aerosol models are defined by the bi-lognormal size distributions and refractive indices, given in Table 1. For more details about the size distribution please refer to Appendix A.
The size distribution and refractive indices uniquely determine the aerosol optical properties, such as single scattering albedo ω 0 , effective radius r eff , and the phase function P. These optical properties describe the efficiency of aerosols scattering and absorption in the radiative transfer process. The optical properties of the four models are shown in Table 2 ( ω 0 and r eff ), and in Figure 1 (P).
From Table 2, we note that the smoke absorbs radiation strongly with ω 0 = 0.87, while the other two fine models are less absorbing. The dust model has a larger particle size ( r eff = 0 . 68 ) as compared to the non-dust models ( r eff < 0 . 261 ). The volume size of these models is given in Figure 1a.
Figure 1b shows the phase function of the four models. We can see that the dust phase function shows a peak at the scattering angle of 0 , giving a much larger value than the non-dust models.
It is possible that for some regions the predefined aerosol model is wrong. The errors from this possible wrong assumption is investigated in this study.

2.2.2. Aerosol Vertical Distribution

Generally, aerosol vertical distribution is controlled by the aerosol layer shape and the altitude of the layer lower or upper boundary, which can be modeled using an exponential, power, Gaussian and random function.
Varying the scale height h, exponentially-distributed aerosols tends to change more the layer shape and less the layer height. Thus, to clearly show the effect of the layer shape on the AOD retrieval, an exponential distribution is selected, which can be written as:
τ λ , z i = τ λ ( e - z i / h - e - z i + 1 / h ) ,
where z is the altitude in the atmosphere ( z i starts from 0 km, i.e., the surface), τ λ is spectrally dependent, hereafter we use τ for 0.55 μ m specially unless specified otherwise.
Figure 2 shows the exponential distribution varying with the scale height h, ranging from 1 to 6 in steps of 1. With the increase of scale height, the profile becomes more homogeneous, since the aerosol are distributed more evenly over the column. ExpH1 indicates the exponential distribution with the scale height of 1, other ExpH series follow the same rule. Note that one of ExpH series i.e., the ExpH2 distribution was applied in the MODIS C6_DT algorithm over land.
To demonstrate the effect of the layer height on the retrieval, two continuous aerosol layers (each layer is 1 km thick) in the atmosphere are assumed:
τ λ , z i = τ λ ( e / ( 1 + e ) ) τ λ , z i + 1 = τ λ ( 1 / ( 1 + e ) )
The two-layer distributions are called Exp2L series, varying the bottom layer height from the surface to the altitude of 7 km. In the series, Exp2L0 means aerosols distributed from the altitude of the surface to 2 km, other Exp2L series follow the same rule.
Combining these two series (ExpH and Exp2L), we get 14 possible aerosol vertical distributions in total, where 6 distributions are from ExpH series and 8 distributions from Exp2L series.

3. Data and Method

Several studies demonstrated that there are some intrinsic uncertainties in the MODIS algorithm (C5_DT over land) [2,26]. To better understand how the AOD retrieval is affected by the source errors of aerosol properties, the intrinsic uncertainty needs to be fully evaluated and discussed before our sensitivity test. In addition, regarding the real case, we need to consider the uncertainty of both aerosol type and its vertical profile in the retrieval. Thus, we designed a test for the sensitivity of the AOD retrieval to aerosol type and vertical distribution by performing four experiments: (1) simulation of the “ideal” condition that the algorithm assumptions are exactly valid on the choice of aerosol models and vertical profile; (2) simulation of the possible aerosol vertical profiles that are different from the algorithm assumption (static profile); (3) simulation of the possible aerosol types that are different from the algorithm assumption (predefined aerosol type); and (4) simulation of both possible aerosol vertical profiles and types that are different from the algorithm assumption on the choice of aerosol model and vertical profile.
The MODIS C6 DT algorithm over land (Procedure A) was used for the experiments. Note that Experiment 1 is designed to test the algorithm intrinsic errors, and Experiment 4 is used to test the interplay effect of aerosol vertical distribution and type on the retrieval. The set up of the experiments is given bellow.

Experiment Set up

With the four parameters ( ρ a , F d , T and s) in LUT, the TOA reflectance was simulated for 3 aerosol mixtures (weakly-absorbing, moderately-absorbing and absorbing aerosols mixed with dust). 7 aerosol loadings (0.0, 0.25, 0.5, 1.0, 2.0, 3.0 and 5.0) and 5 fine ratios (0, 0.2, 0.5, 0.8 and 1) were used for the mixtures. The experiment was done with 1520 geometrical combinations ( 0 ϕ 180 , θ 60 , θ 0 48 ). For the experiment, we assumed that the surface reflectance at 2.11 μ m ρ 2 . 11 s is 0.15 with the ratios for visible bands (0.466 and 0.644 μ m) versus 2.12 μ m (i.e., ρ 0 . 644 s = 0 . 5 ρ 2 . 11 s and ρ 0 . 466 s = 0 . 25 ρ 2 . 11 s ).
To perform Experiments 2 and 4, we need to create the corresponding LUTs with the different aerosol vertical distributions (14 in total). As for Experiments 3 and 4, aerosol models applied in the simulation are different from that in the retrieval.
In the experiments, the relative difference δ ( τ ) of the AOD retrieval is defined as:
δ ( τ ) = τ - τ r e f τ r e f
where the subscript r e f means the reference value of τ. The results of the experiments are summarized by averaging 1520 geometrical combinations unless specified otherwise.

4. Experiment Results and Discussions

4.1. Experiment 1

4.1.1. Result

Figure 3 presents the results with a moderately absorbing aerosol model (generic). In this figure, we note that the AOD is always overestimated while the surface reflectance is underestimated. The errors on the four parameters become large with the mixing degree between fine and coarse aerosol, and larger as aerosol loading increases. The largest relative error (7%) was found when the fine ratio η is 0.5 under extreme heavy loading ( τ = 5 . 0 ). Under aerosol loading τ 0 . 5 , the errors are smaller than 0.2%. The results with other aerosol models show a similar uncertainty (not shown here).

4.1.2. Discussion

To check the intrinsic error source and its potential effects on the sensitivity test, we recoded the C6_DT standalone algorithm with the complete understanding of the procedure implemented in the algorithm. We found that the intrinsic errors are attributed to the underestimation/overestimation of the 2.11 μ m surface reflectance ρ 2 . 11 s , shown as two issues:
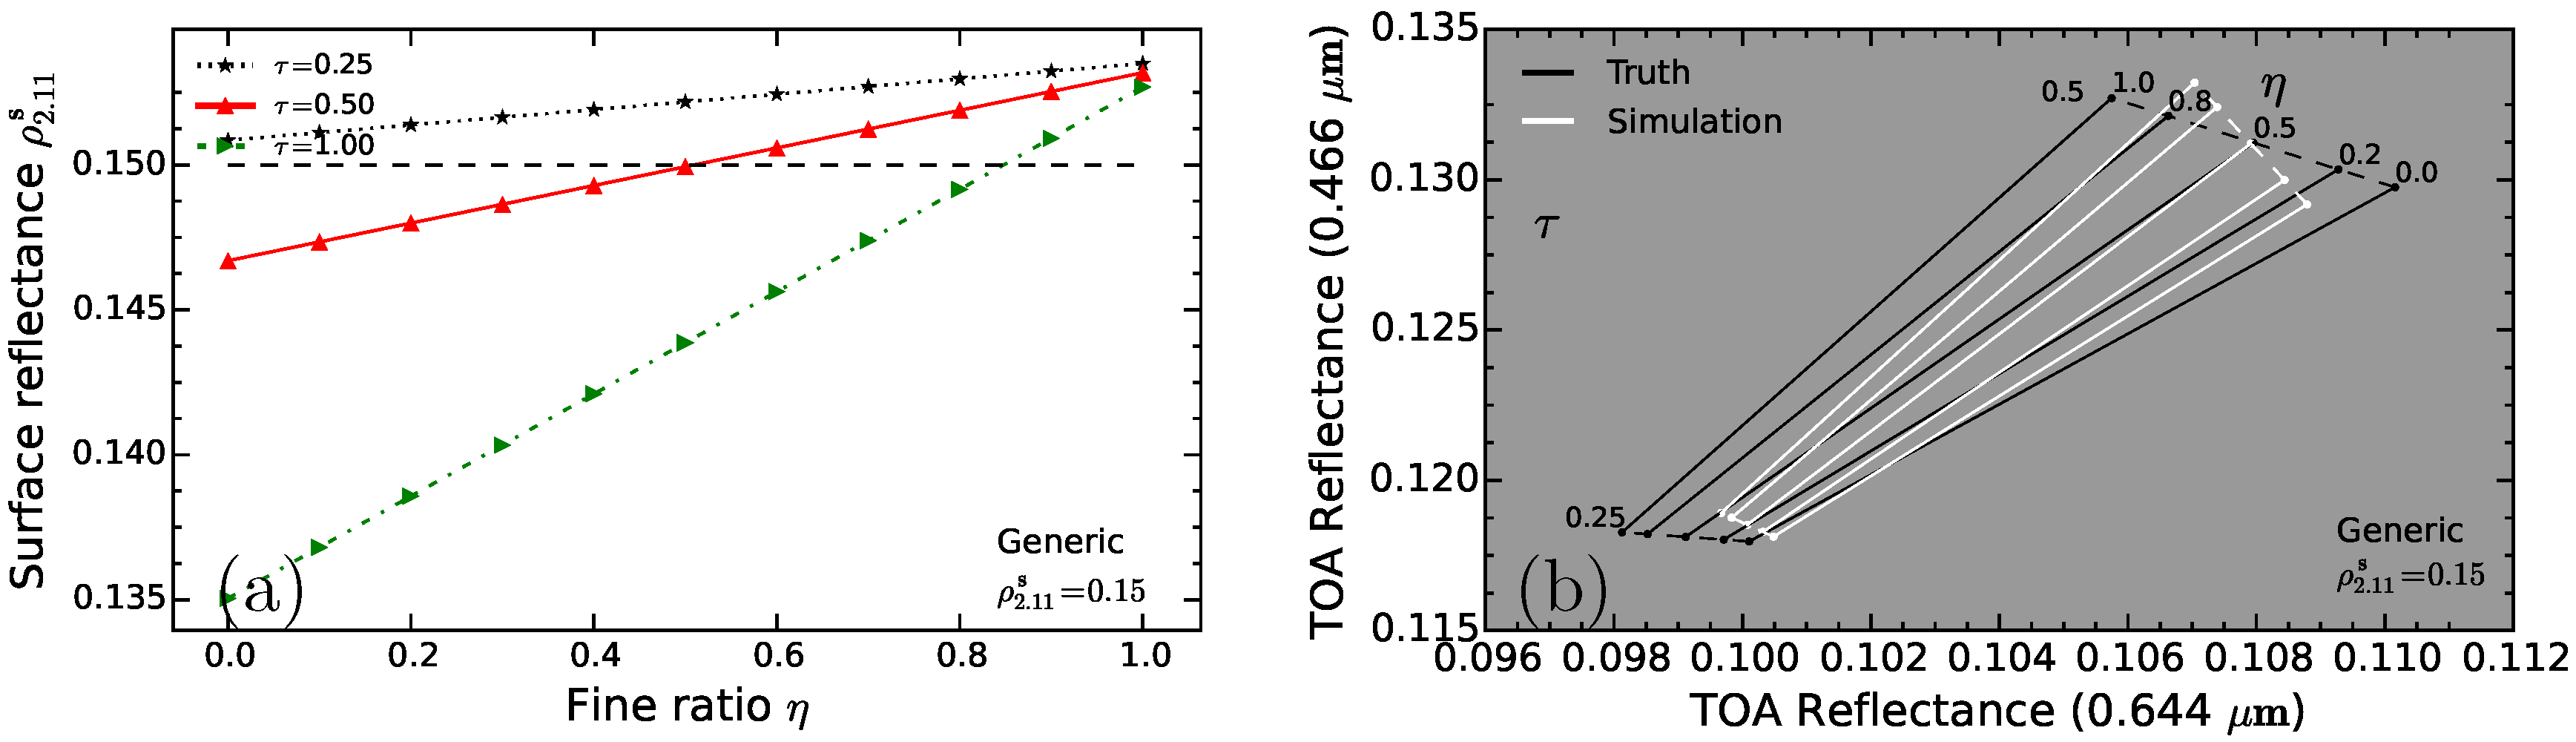
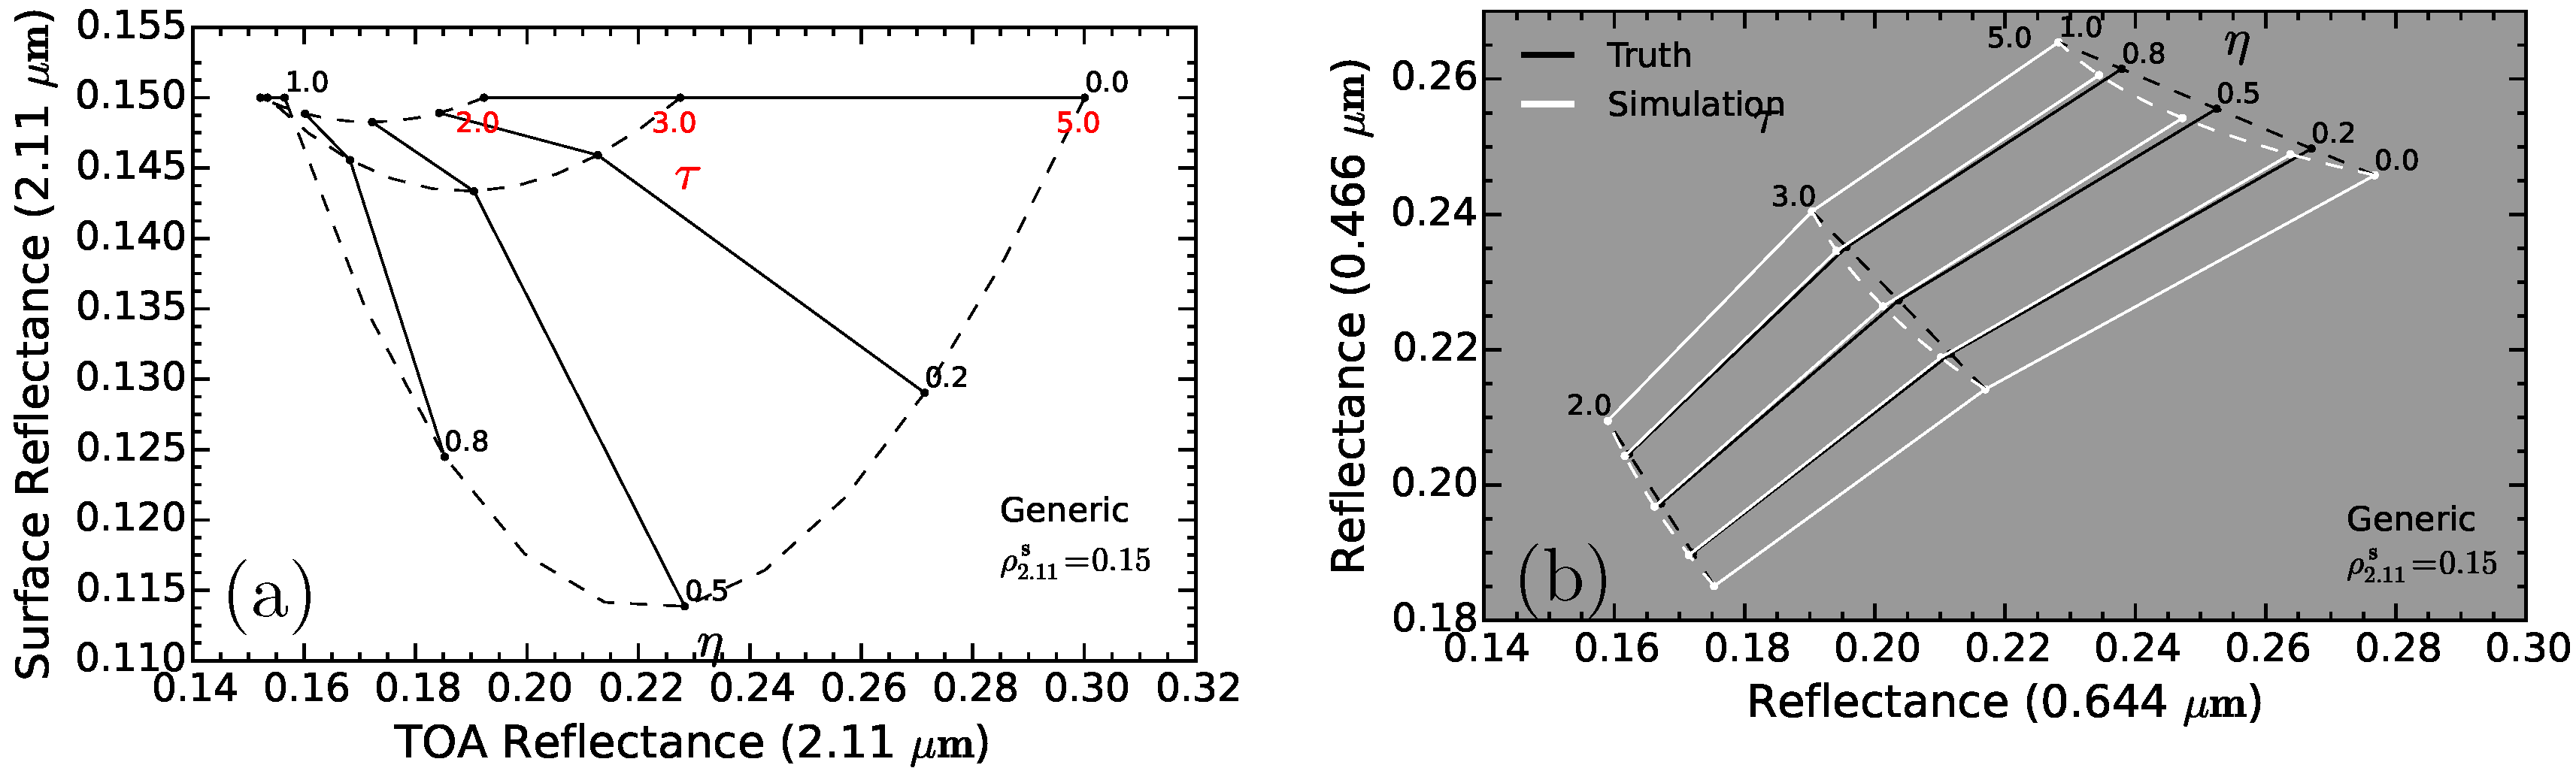
  • Issue 1: the MODIS algorithm assumes that the ρ 2 . 11 s can vary with the atmospheric condition in the retrieval. Obviously, this assumption is inconsistent with the fact that the surface reflectance is invariant with the atmospheric condition.
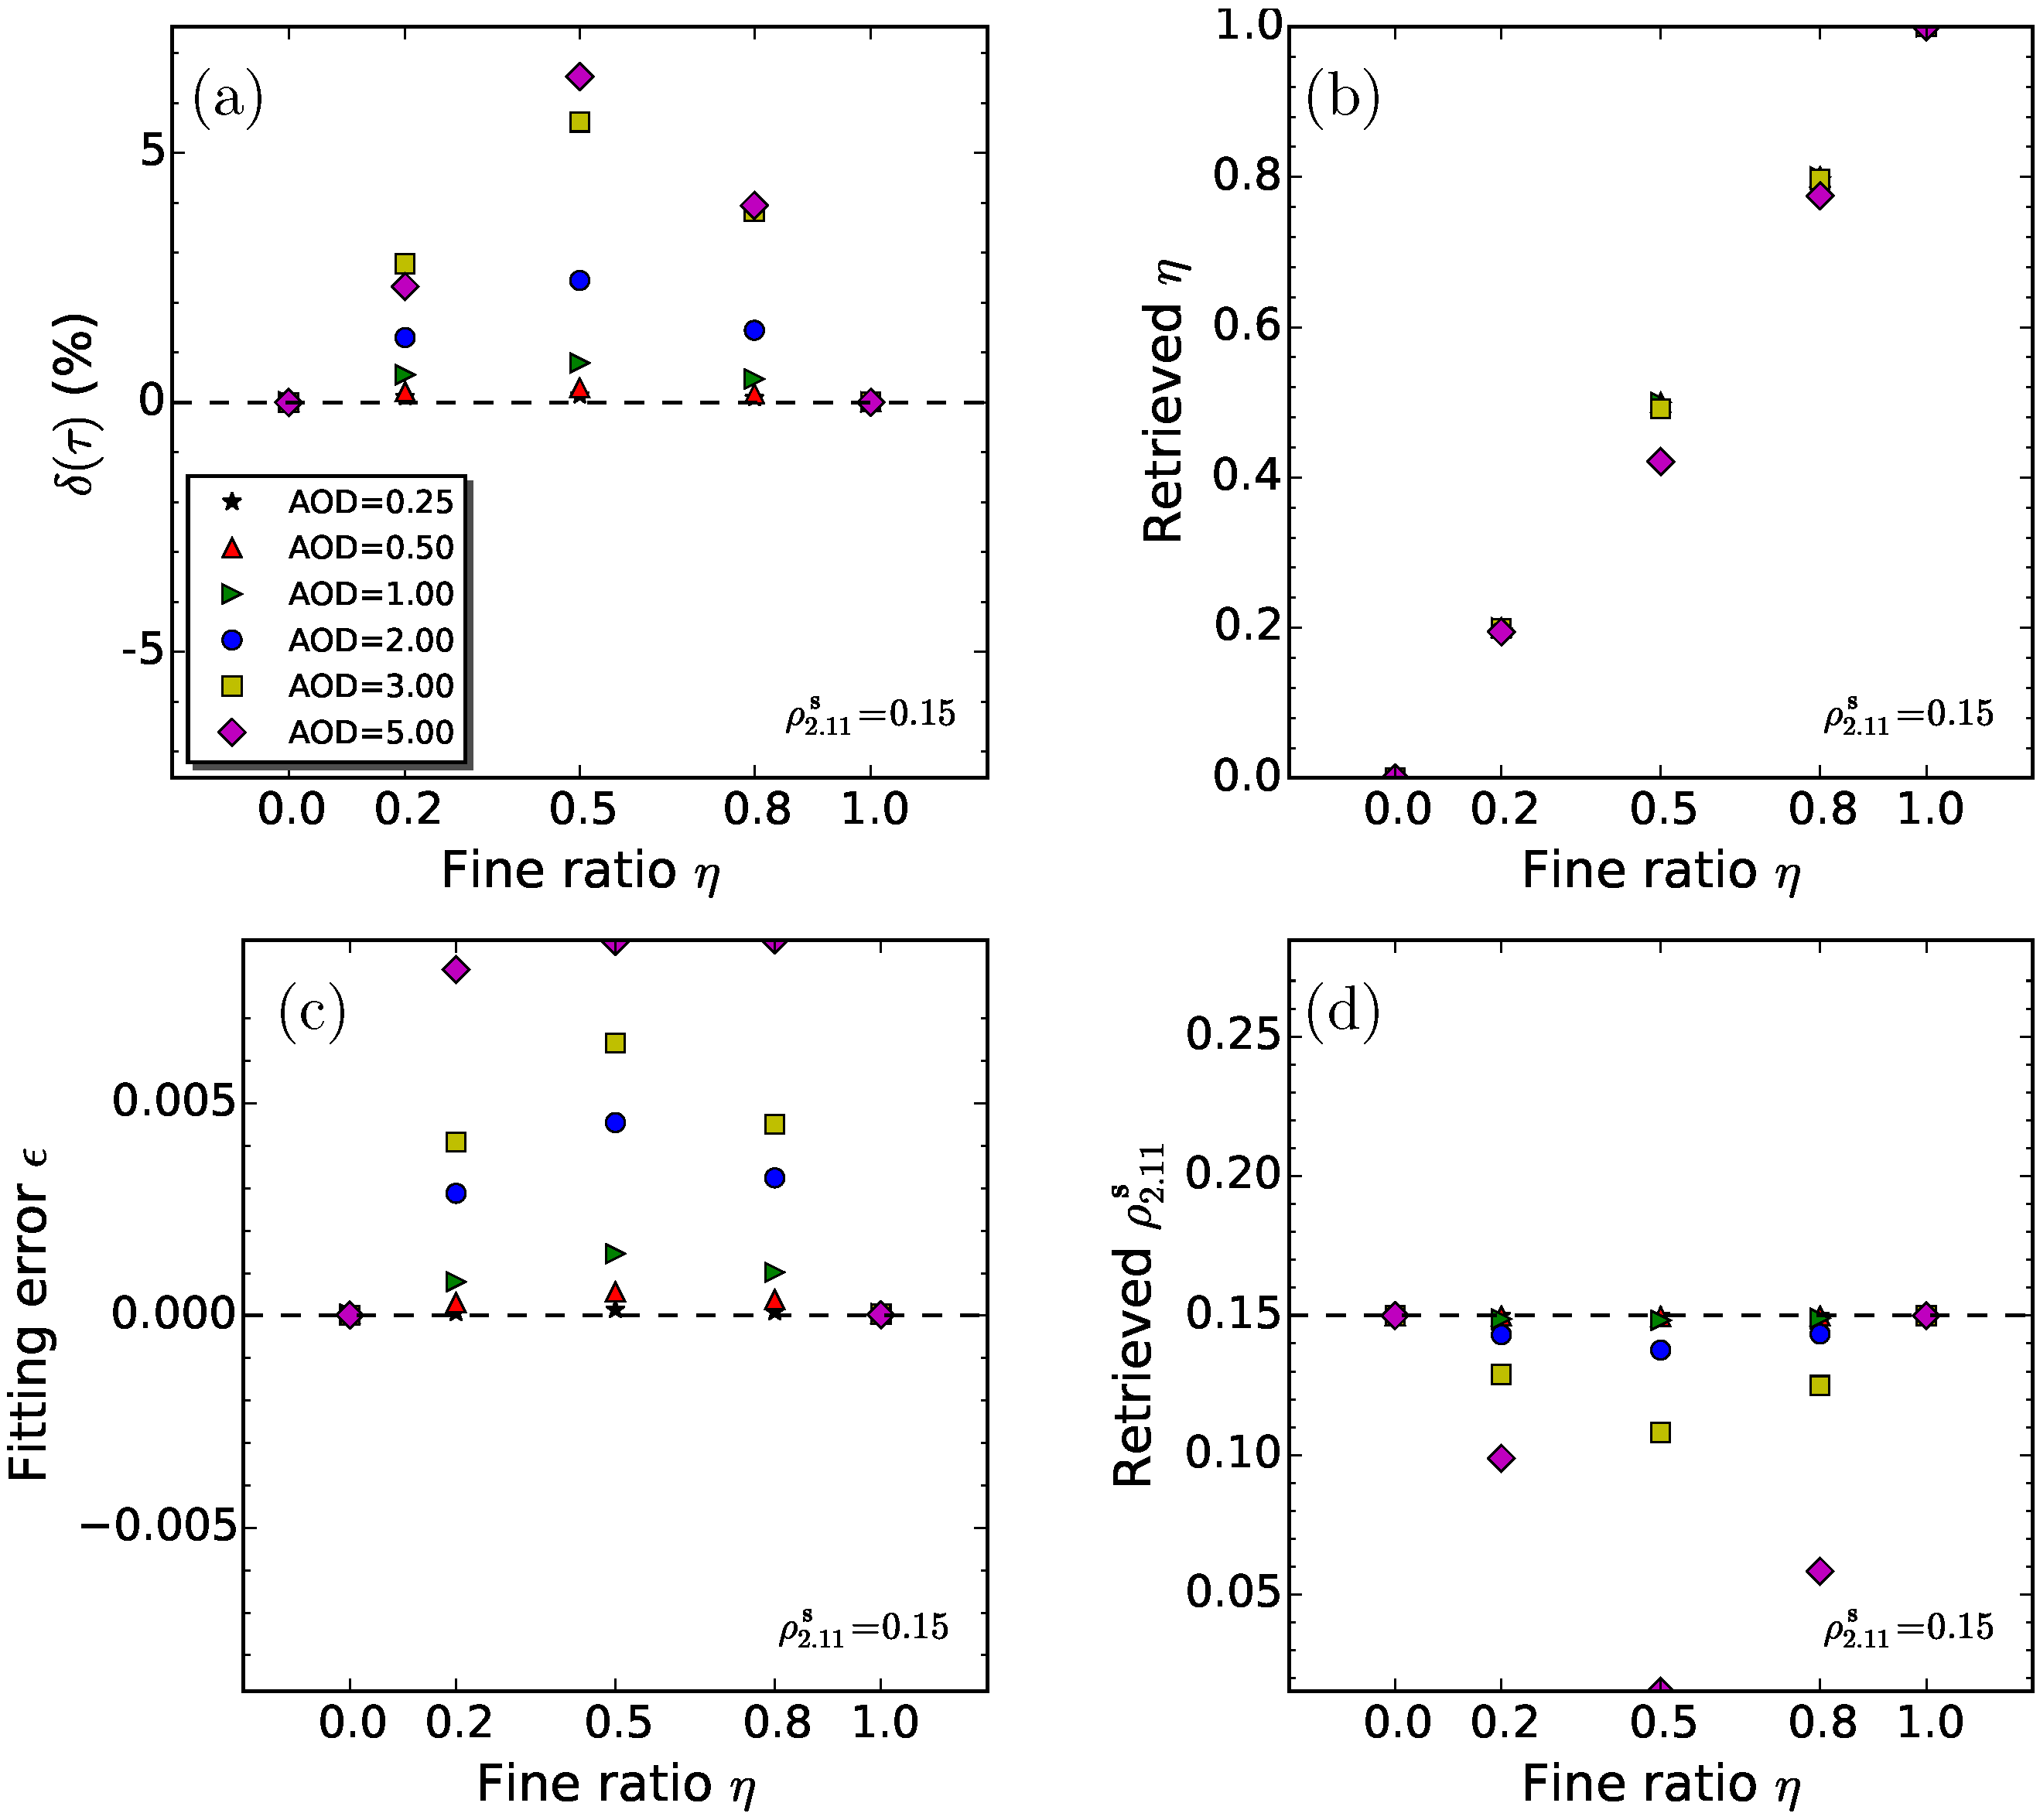
  • Issue 2: to find the possible ρ 2 . 11 s with the rearranged Equation (2), the MODIS measurement is expected to be divided into two parts: one part is the reflectance from fine-mode dominated atmosphere, and the one from coarse-mode dominated atmosphere, while the algorithm assumes the measurement to be identical to each part. By doing this, it can give a large uncertainty of the retrieval with heavy aerosol loading. Nevertheless, the uncertainty is expected to be small with low aerosol loading since the TOA reflectance is dominated by the surface contribution and little affected by the atmospheric aerosol.
Figure 4 illustrates Issue 1 in the algorithm. In this figure, we selected a simulation with generic mixture ( η = 0 . 5 and τ = 0 . 5 ) under a given geometry (nadir view and θ 0 = 24 ). From Figure 4b, we can clearly see that the simulation significantly deviates from the truth, showing clock-wise twist around the point (located at η = 0 . 5 and τ = 0 . 5 ).
Figure 5 presents Issue 2 in the algorithm. In this figure, we chose similar synthetic data as in Figure 4 (the effect of Issue 1). Note that the data are generated with heavy aerosol loading ( τ 2.0). Meanwhile, to remove the effect of Issue 1, the aerosol loading and fine ratio are assumed as known in the retrieval. From Figure 5b, we note that the simulation is always lower than the truth, and this become significant for the extreme heavy aerosol mixture ( τ = 5 . 0 and η = 0 . 5 ). This would cause the overestimation of the AOD retrieval.
The intrinsic errors in the AOD retrieval are attributed to the wrong estimation of the surface reflectance (the net effect of Issues 1 and 2). These errors could introduce the extra uncertainty in the sensitivity test (Experiment 2 to 4), since a distorted (twist and compact) simulation space is created in the retrieval due to the incorrect estimation of the surface reflectance. Nevertheless, the test still can reveal the retrieval errors of the algorithm when the aerosol properties are not properly defined.

4.2. Experiment 2

4.2.1. Result

Figure 6 presents the AOD errors with the four simulations (ExpH2, ExpH3, Exp2L0 and Exp2L3), where the ExpH2 LUT is applied in the retrieval process. The result with the smoke model is given in the Figure. The results with other models are not shown due to the relatively small errors in the experiment. We can see that the errors are substantially related to the aerosol vertical distributions in this figure. Concretely, the simulation with a higher aerosol layer (e.g., ExpH3 and Exp2L3) causes the underestimation of the AOD retrieval. In contrast, the simulation with a lower aerosol layer (e.g., Exp2L0) causes the overestimation. And this become more significant with the absorbing (smoke) or large size aerosols (dust) as increasing the aerosol loading. Normally, the errors with the smoke and dust ( η = 0 in Figure 6) range from 5% to 15%, whereas showing smaller values ( <5%–8%) with urbanIndustrial and generic model.
To further clarify the sensitivity of the AOD retrieval to the vertical distribution, we performed the retrieval with the simulations which were created with 14 distributions (6 “ExpH” and 8 “Exp2L”). Pure smoke and dust were selected with τ = 0.5. To check whether the sensitivity is dependent on the illumination/viewing geometry, we perform the result with five angles, which are described as: solar zenith angles of 0 , 12 , 24 , 36 and 48 under nadir view. We change the reference AOD in the evaluation, where the AOD is achieved with the “ideal” simulation with ExpH2 and Exp2L0 was selected as “reference” for “ExpH” and “Exp2L” series, respectively.
Figure 7 presents the AOD errors with “ExpH” and “Exp2L” series distributions, where the smoke model is given. It seems that the retrieval is more sensitive to the “Exp2L” series than to the “ExpH” series. The errors δ ( τ ) are from 5% to 10% with “ExpH” simulations, whereas they are from 3% to over 20% with “Exp2L” simulations. The errors are strongly dependent on the angles, showing an increase with the decrease of the solar zenith angle (or with the increase of the scattering angle). Focusing on the Exp2L4 simulations, we can see the error δ ( τ ) is 10% at the angle θ 0 = 0 , and increasingly large (25%) at the angle θ 0 = 48 .
Generally, the large difference between the vertical distributions would give a significant error δ ( τ ) . Specifically, the AOD difference increases linearly with the layer height (“Exp2L ”series) in Figure 7. For example, given with nadir view and solar zenith angle θ 0 = 24 , we can see that there is a linear increase of the δ ( τ ) between Exp2L1, Exp2L4 and Exp2L7, with the AOD errors by 5%, 15% and 20%, respectively.

4.2.2. Discussion

For the case of an elevated aerosol layer (e.g., Exp2L3 relates to Exp2L0), the TOA reflectance presents lower values due to less isotropic scattering reflected by the Rayleigh layer under the aerosol layer. With the increase of the aerosol-mixture layer height, the TOA reflectance decreases at short wavelength (e.g., 0.466 μ m), which leads to a reduction of AOD retrieval.
Figure 8 presents the Exp2L simulation series (7 points) falling within the Exp2L0 simulation space. The result is shown with the smoke model. From this figure, we can see that the 0.466 μ m reflectance at TOA is significantly decreasing with the increase of the layer height (Exp2L0 → Exp2L7). The reflectance with ExpH series also shows a similar trend, where the mean of layer height is determined by the scale height (not shown).
With a given aerosol vertical distribution related to the “reference” one, the effect is different for different aerosol models, where the magnitude of the effect is mainly dependent on their single scattering albedo ω 0 (see Table 2). The Rayleigh scattering under the aerosol layer is more absorbed by the strongly-absorbing aerosol layer, leading to much less TOA reflectance. Therefore, the effect becomes larger with strongly-absorbing aerosols. This is the main reason that the largest difference δ ( τ ) (30%) is found with the smoke model since the model has the lowest single scattering albedo ( ω 0 = 0.869).
The impact of illumination and viewing geometry on the sensitivity to aerosol vertical distribution depends on the optical properties, especially on the phase function of the aerosol mixture. The atmospheric scattering is attenuated with increasing the scattering angle (see Figure 8) due to the shorter atmospheric path. However, it is not the case for the dust-dominated atmosphere, in which the atmospheric scattering is still strong at a large scattering angle due to the peak forward scattering of the dust (see phase function in Figure 1b).
In addition, the discrepancy of the TOA reflectance caused by the vertical distributions does not change too much with different scattering angles. As a result, the AOD errors due to the vertical distribution strongly depends on the scattering angle.

4.3. Experiment 3

4.3.1. Result

Figure 9 presents the AOD errors of a wrong assumption of aerosol model, where the generic and smoke model were selected for the simulation but using the urbanIndustrial LUT in the retrieval. Some abbreviations of aerosol models are used (G: Generic, S: Smoke, U: UrbanIndustrial). Averaging over 1520 geometrical combinations, the error δ ( τ ) is roughly <8% under τ 1 . 0 , and increases under the heavy aerosol loading ( τ 2 . 0 ) with the value >8%. Obviously, the improper selection of the pure aerosol ( η = 1 . 0 ) gives the largest errors compared to the case with the other aerosol mixtures.
The sensitivity of the retrieval to aerosol type is further evaluated, using pure aerosols. Similar to Experiment 2, the simulation is with τ = 0.5, at 5 angles. The result is shown in Figure 10, giving comparable errors by <8%. This means that the retrieval presents a medium sensitivity to the aerosol type. And with different angles, the sensitivity does not vary too much with the discrepancy <5%. There is an approximate symmetry in the difference between the pairs such as S_U (smoke simulated but with urbanIndustrial in the retrieval, U_S, G_S and others are similar to S_U) and U_S, presenting an overestimation of AOD in S_U and underestimation in U_S with nearly the same degree.

4.3.2. Discussion

Due to a relatively small difference of the single scattering albedo between non-dust aerosols, the AOD retrieval does not change too much with a different aerosol model when aerosol loading is low (e.g., τ 0 . 5 ). As aerosol loading increases, the error of the AOD retrieval becomes significant especially for the large difference between the observed and simulated aerosol, such that the strongly absorbing aerosol (smoke, ω 0 = 0 . 869 ) is wrongly assumed as non-absorbing one (urbanIndustrial, ω 0 = 0 . 947 ), the error cloud be up >10%.
The sensitivity of the retrieval to aerosol type does not show a strong dependence on the angle as in Experiment 2. This is because the non-dust aerosol models are substantially similar in their phase function (see Figure 1).

4.4. Experiment 4

To show the interplay effect on the AOD retrieval by improper assumption of both the aerosol vertical distribution and type on the AOD retrieval, we selected two aerosol models (smoke and urbanIndustrial) and vertical distributions (ExpH2 and Exp2L3) in this experiment. Specifically, for the experiment, the simulation is created using the smoke aerosol with Exp2L3 distribution, but using the LUT of urbanIndustrial with ExpH2 distribution. The result is given below.
Figure 11 illustrates the AOD errors in this experiment. The result is roughly equivalent to the one that negatively biases the result in Figure 9b. In this figure, we can see that the AOD retrieval are significantly overestimated in this case, with the δ ( τ ) by > 6%. For example, when aerosol loading is 1.0, the error could be up to 15% in this case.

5. Conclusions & Recommendation

It is well-known that the aerosol properties are one of largest uncertainty sources in the MODIS algorithm since the assumption of the fixed aerosol properties remains in Collection 5 and 6. With the aid of the Cloud-Aerosol Lidar and Infrared Pathfinder Satellite Observation (CALIPSO) that can provide aerosol information about its type and vertical profile, we might put constraints on the aerosol properties to improve the retrieval. However, as the first step of the improvement, the retrieval uncertainty caused by the improper assumption should be quantified. In this study, we designed experiments to evaluate the sensitivity of the retrieval to aerosol vertical distribution and type. Four experiments were performed with the C6_DT algorithm over land, where the intrinsic uncertainty is also evaluated.
Due to the uncertainty in estimating the surface reflectance, it was found that there is intrinsic uncertainty in the algorithm, with the AOD retrieval error below 0.2% and >3% under low aerosol loading ( τ 0 . 5 ) and heavy aerosol loading ( τ > 3 . 0 ), respectively.
The algorithm shows high sensitivity to both aerosol vertical distribution and type of the retrieval.
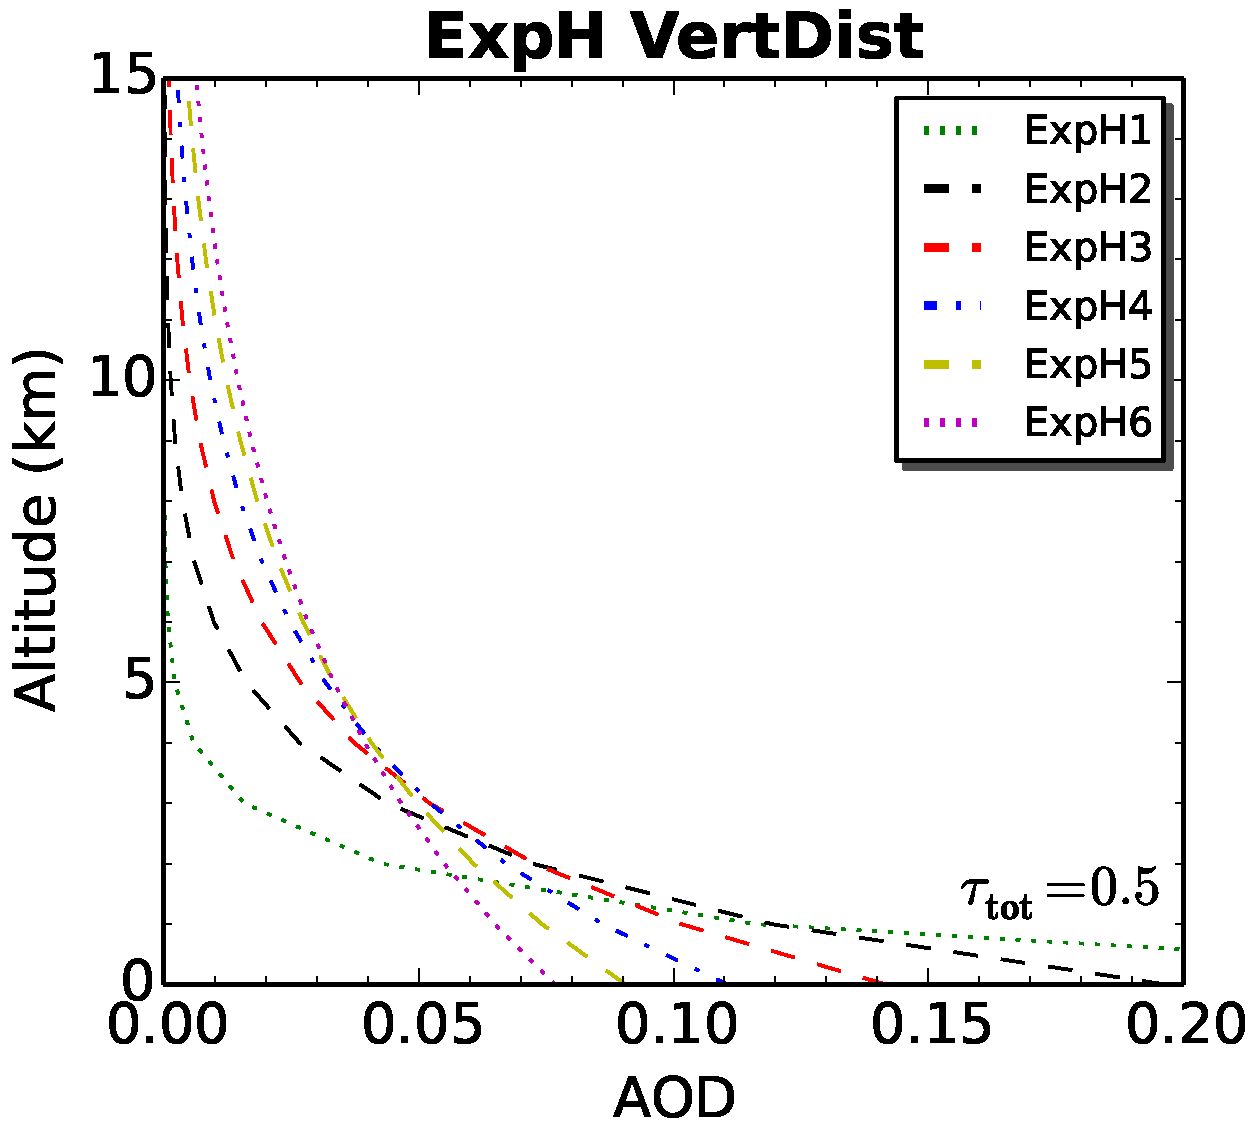
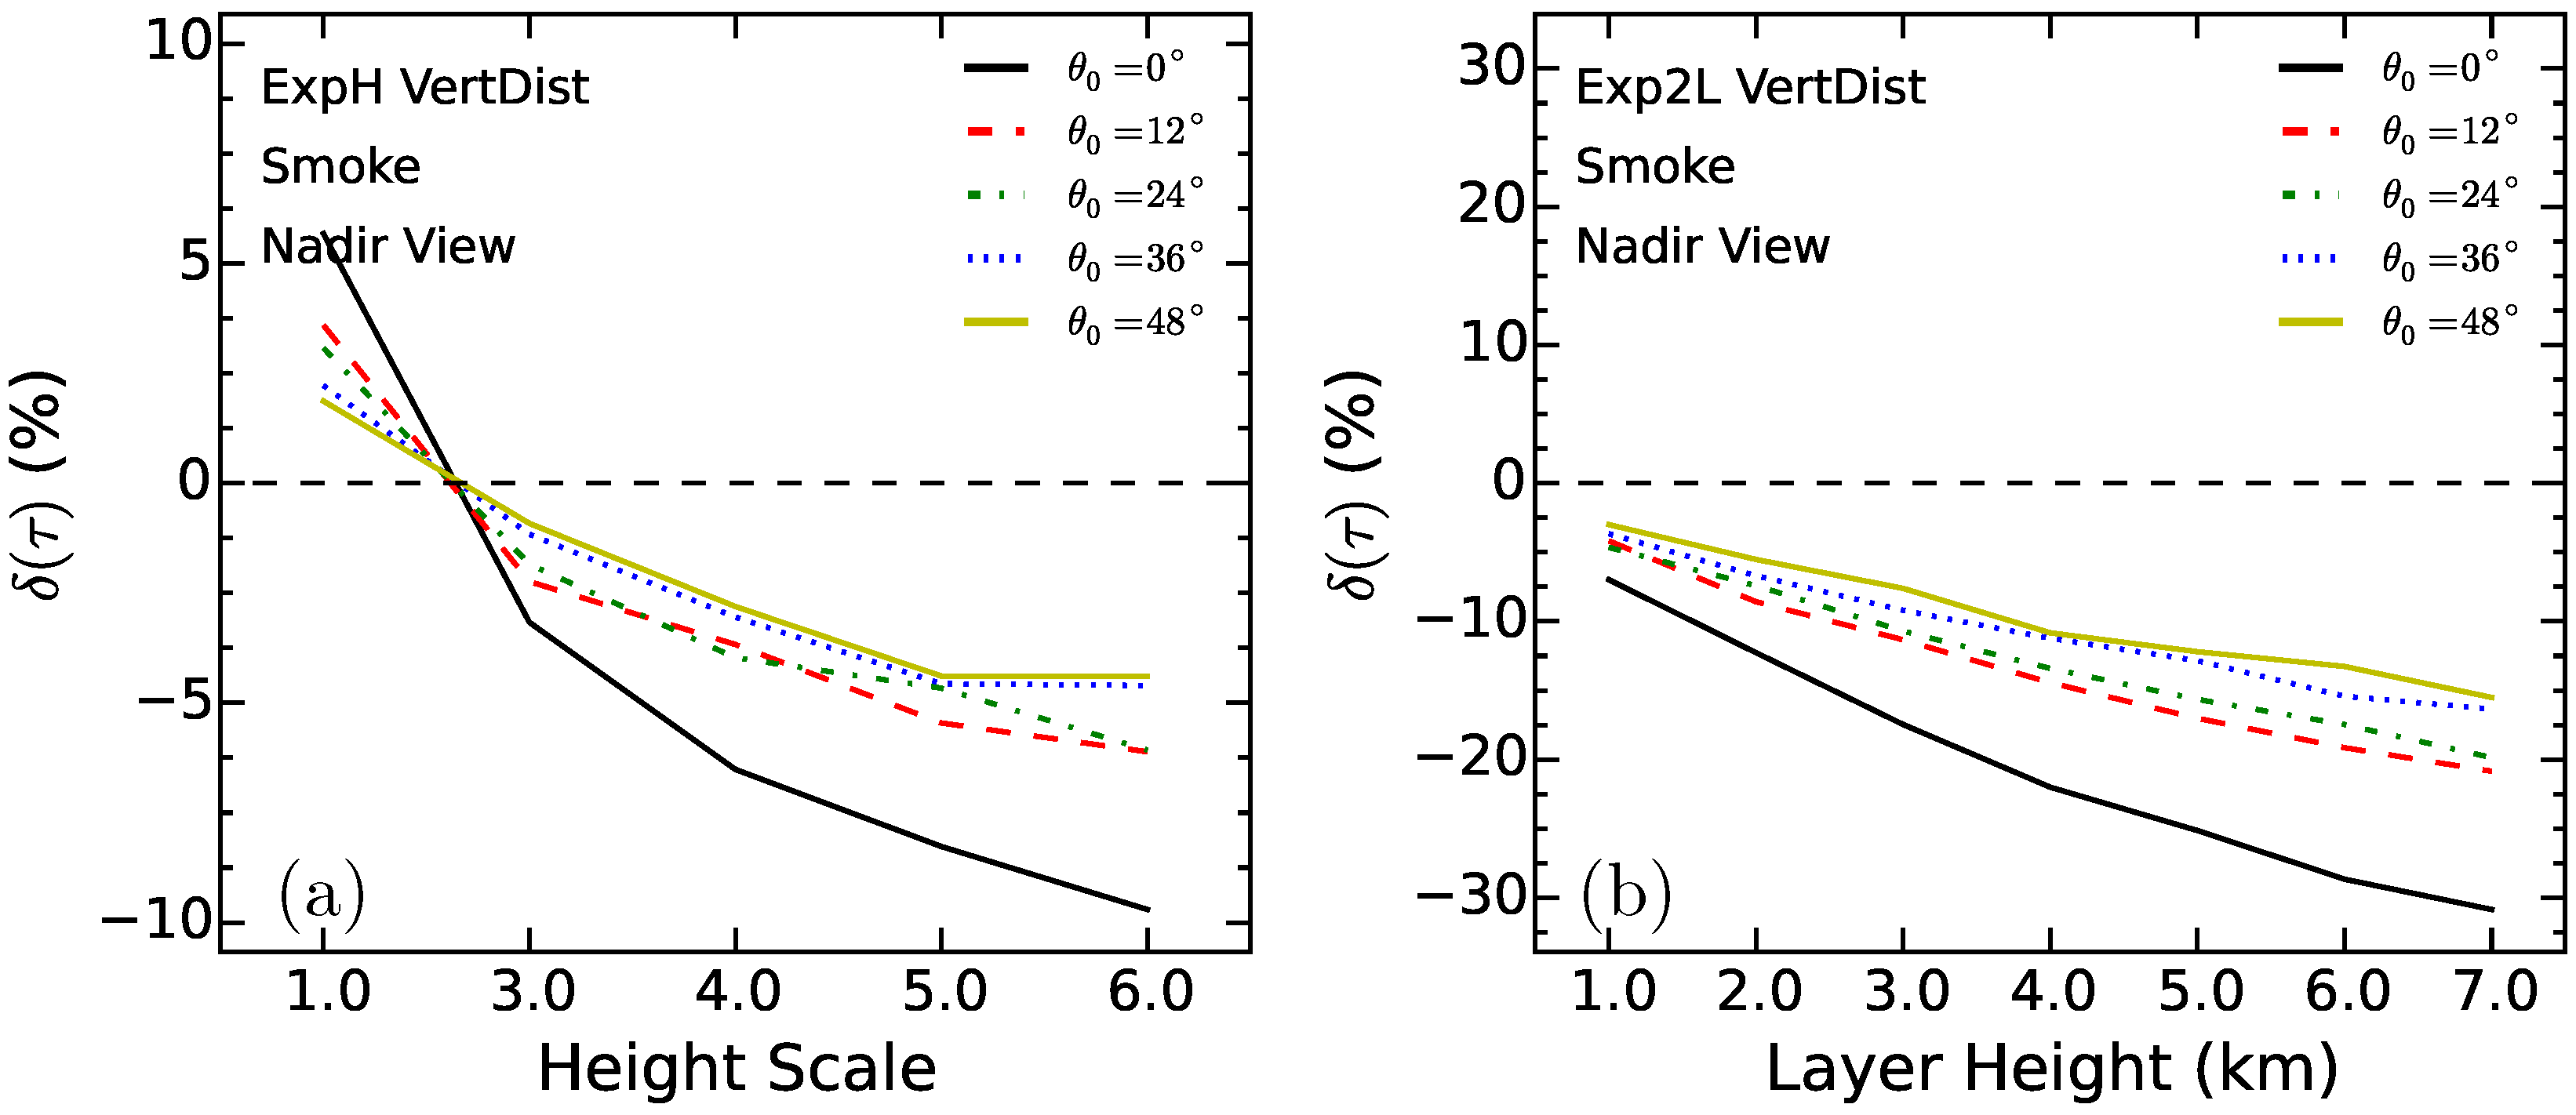
  • With the simulations varied with 4 vertical distributions (ExpH2, ExpH3, Exp2L0 and Exp2L3), about 5% errors can be found in the algorithm retrieval. Even larger errors of the retrieval are shown in ExpH and Exp2L simulation series, ranging from 2% to 30% when aerosol loading of 0.5 is assumed. In the vertical distribution, the aerosol layer height is the main variable that affects the retrieval, where the errors significantly increase as increasing the aerosol layer height.
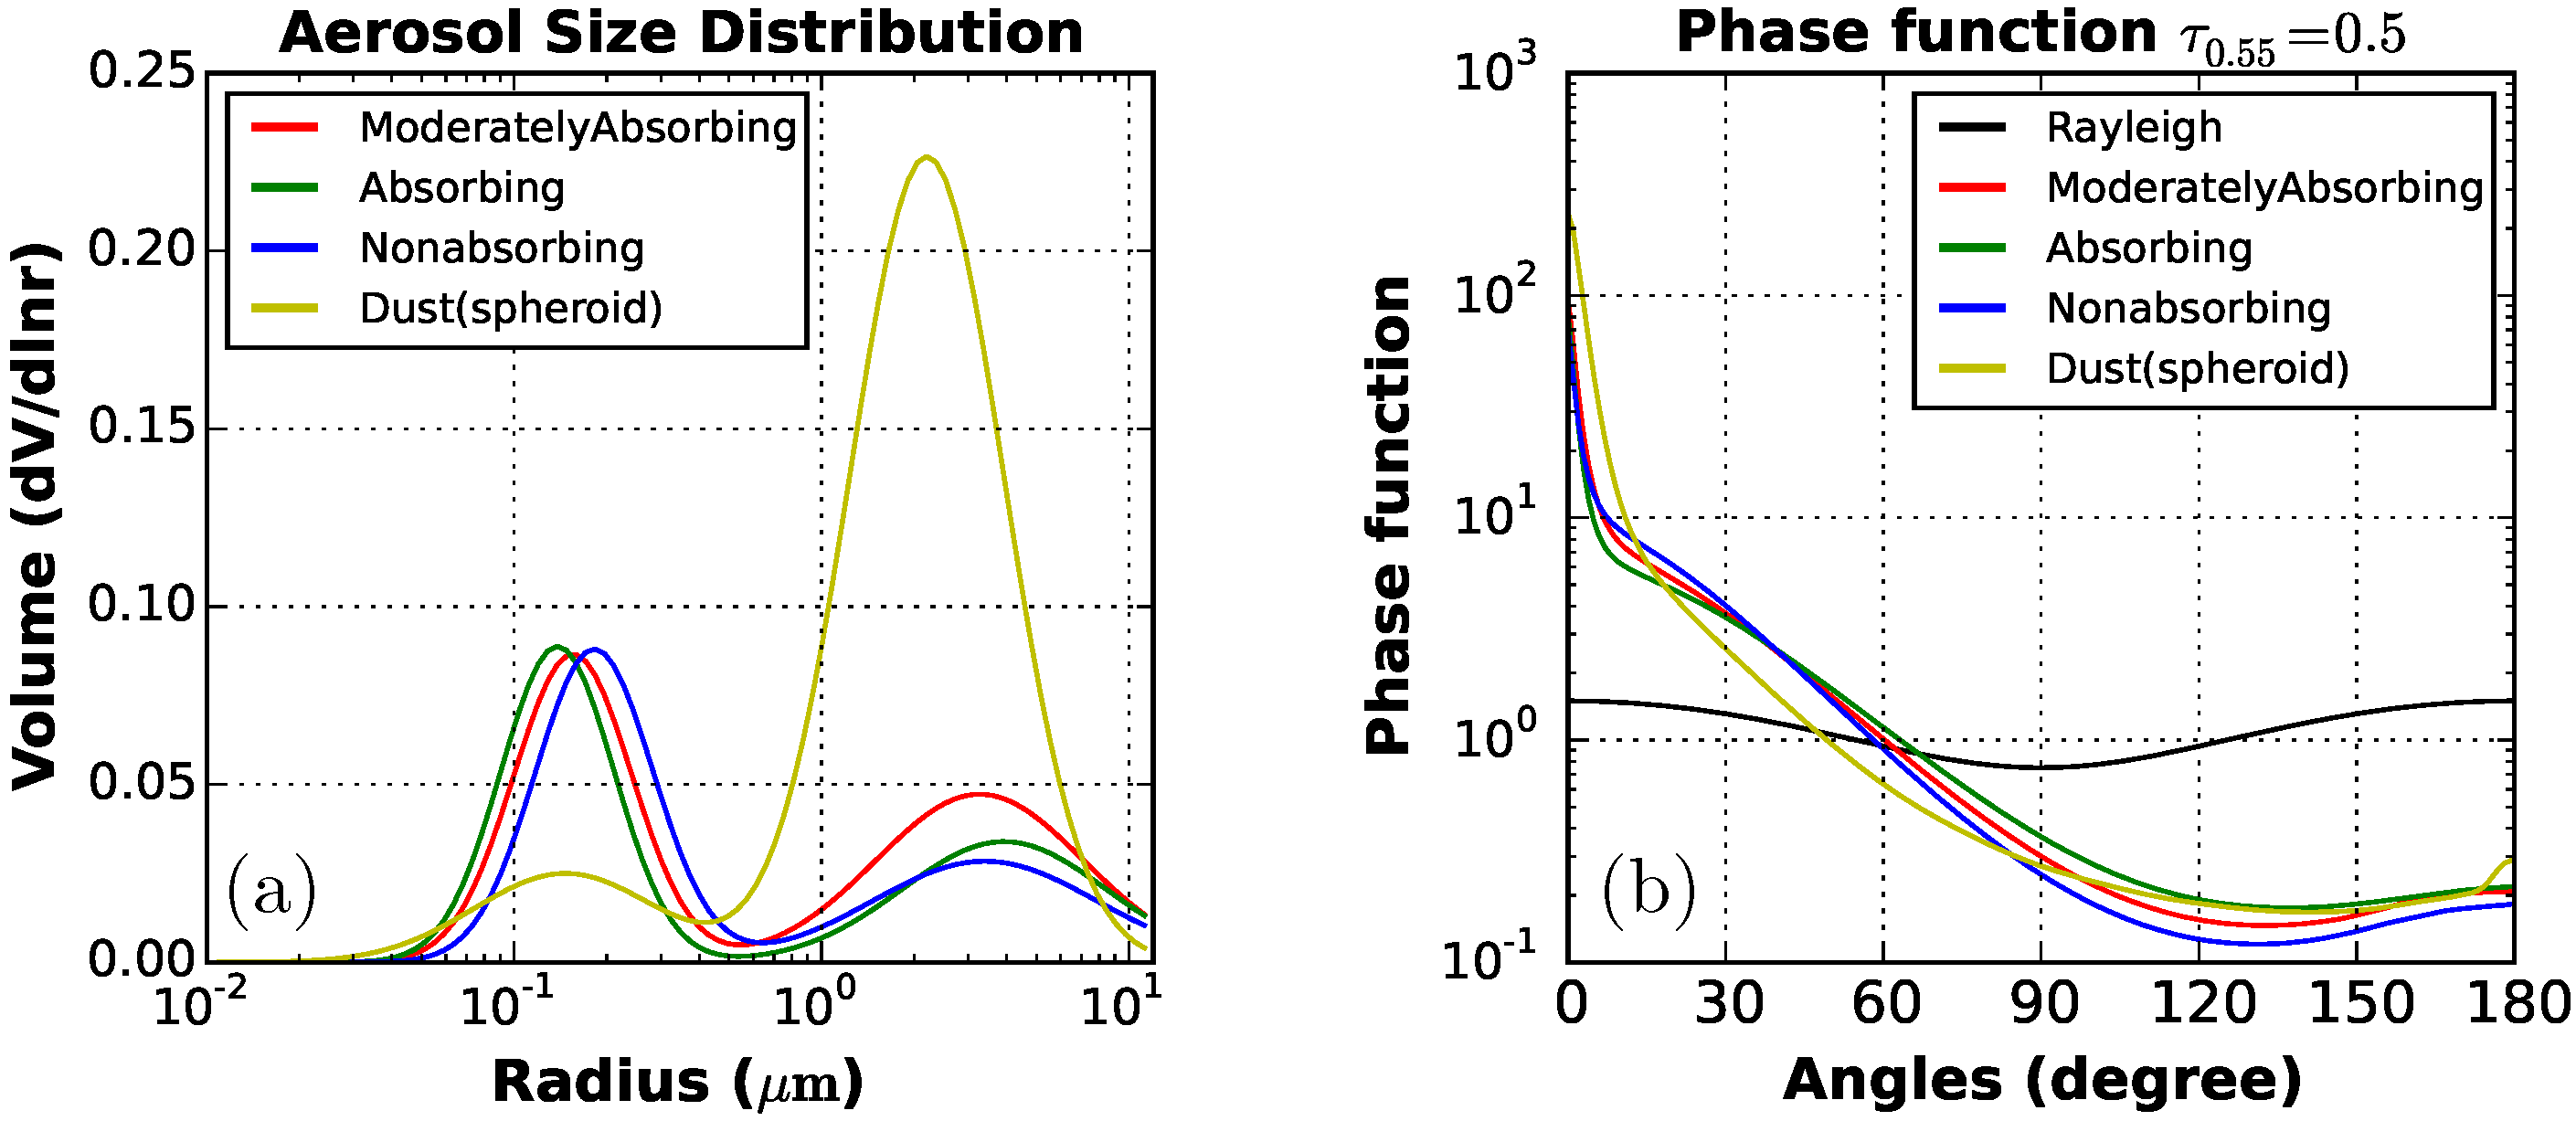
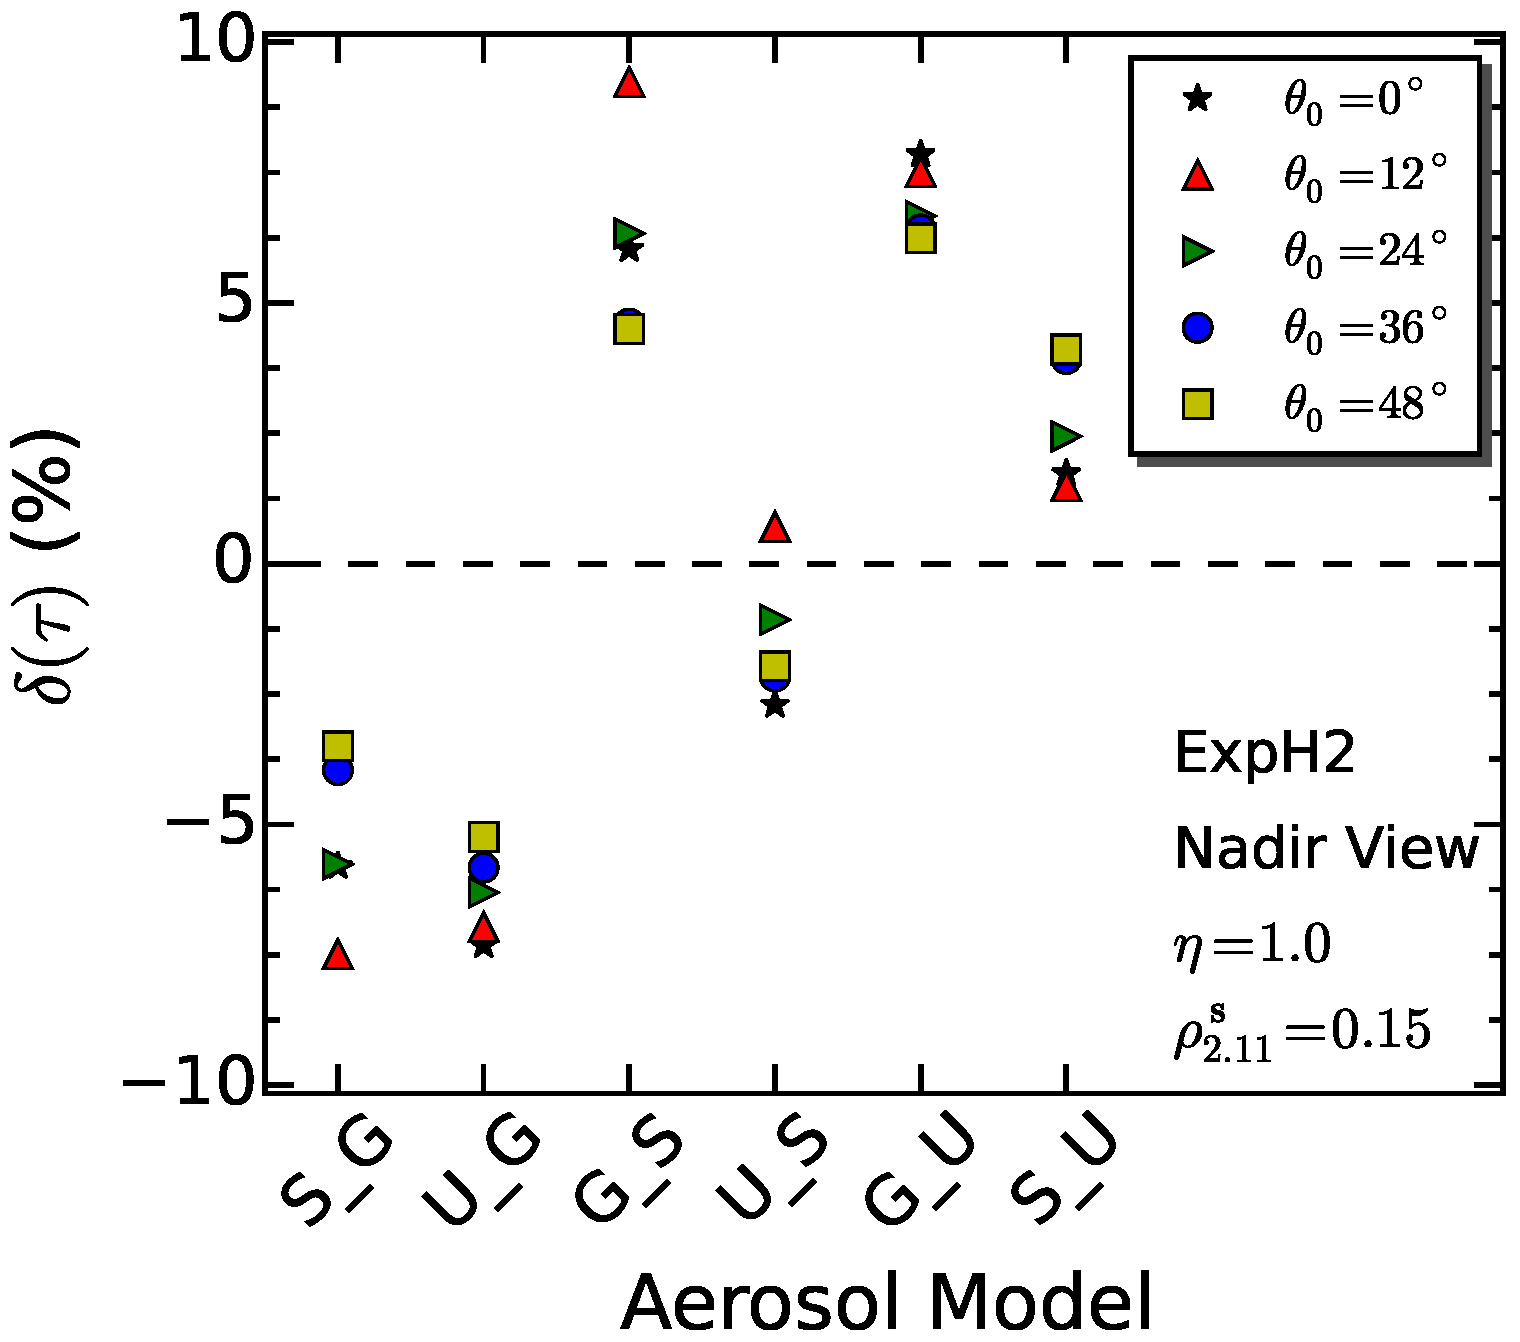
  • Furthermore, the errors caused by the layer height present a strong angular dependence due to the large discrepancy of the phase function between non-dust and dust aerosols.
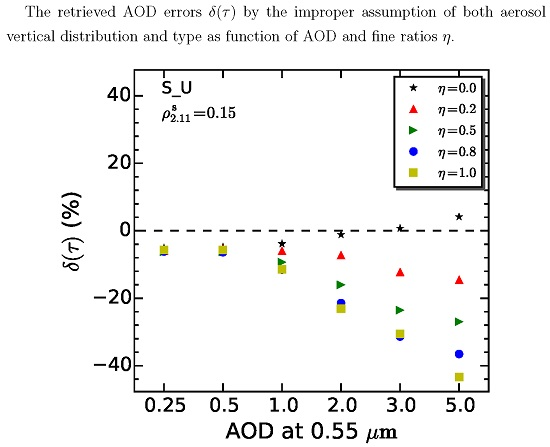
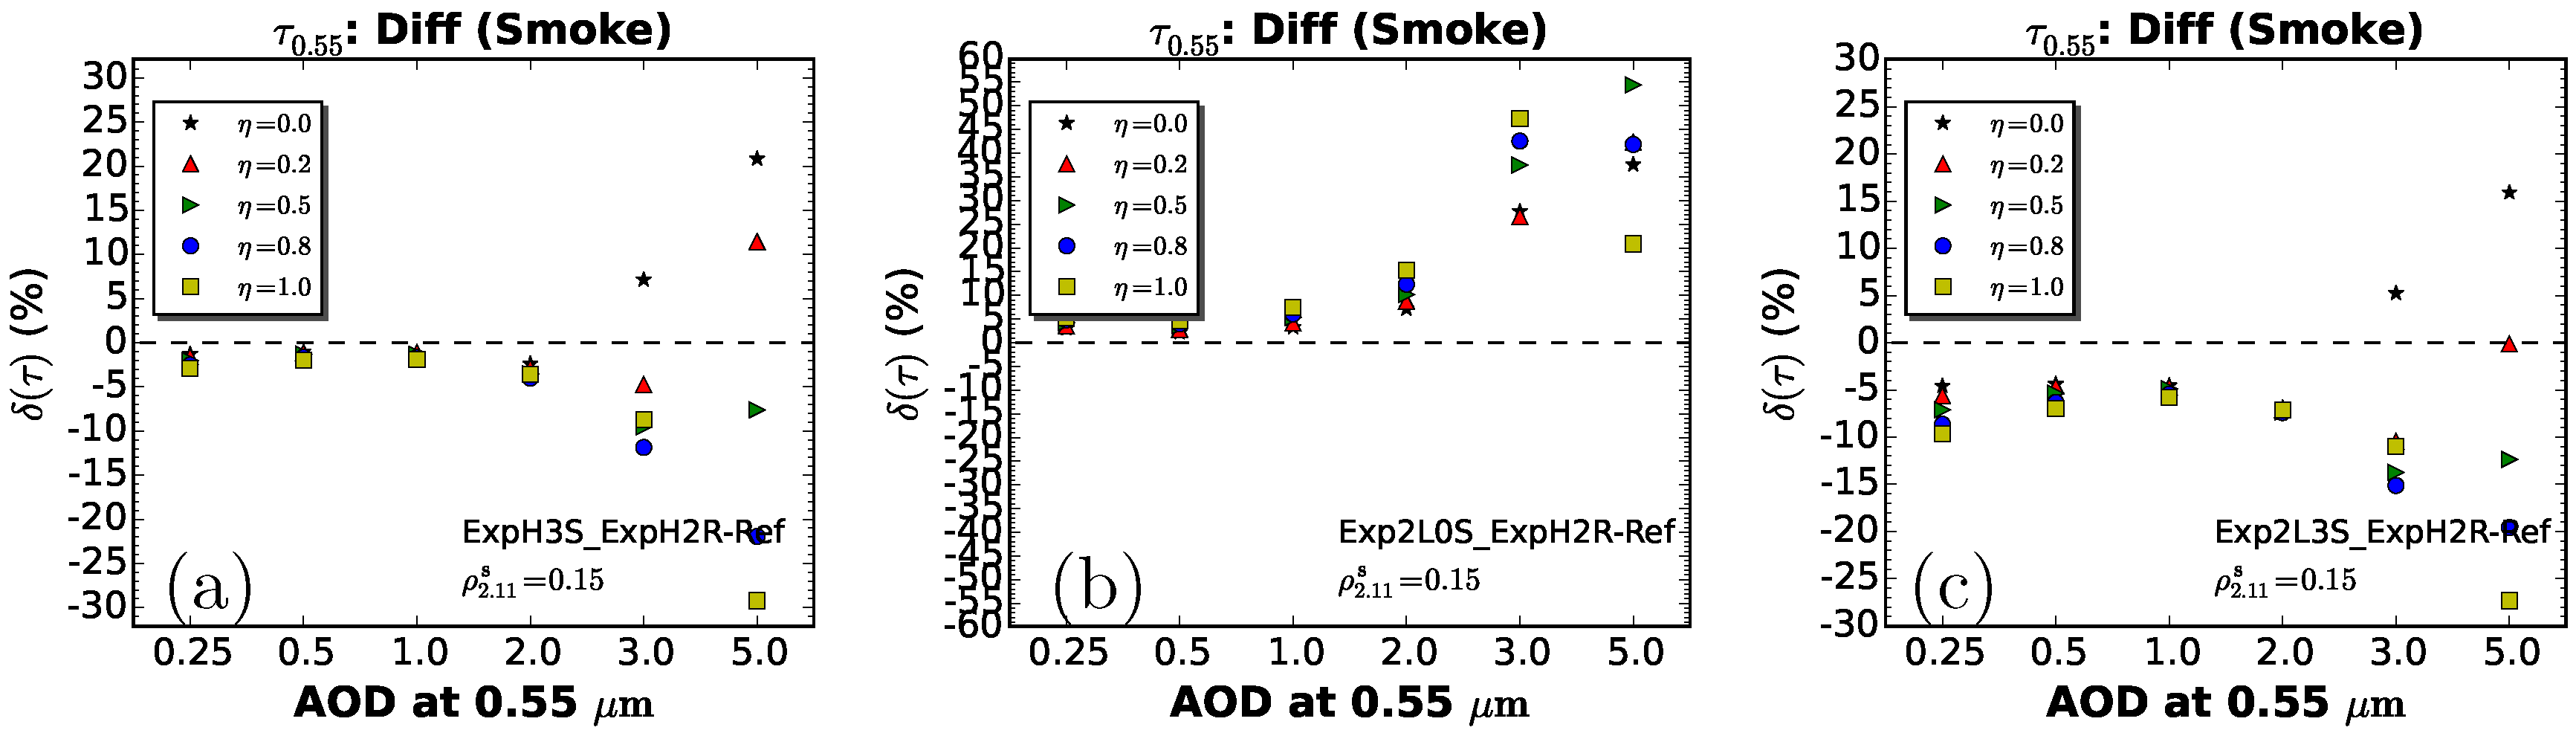
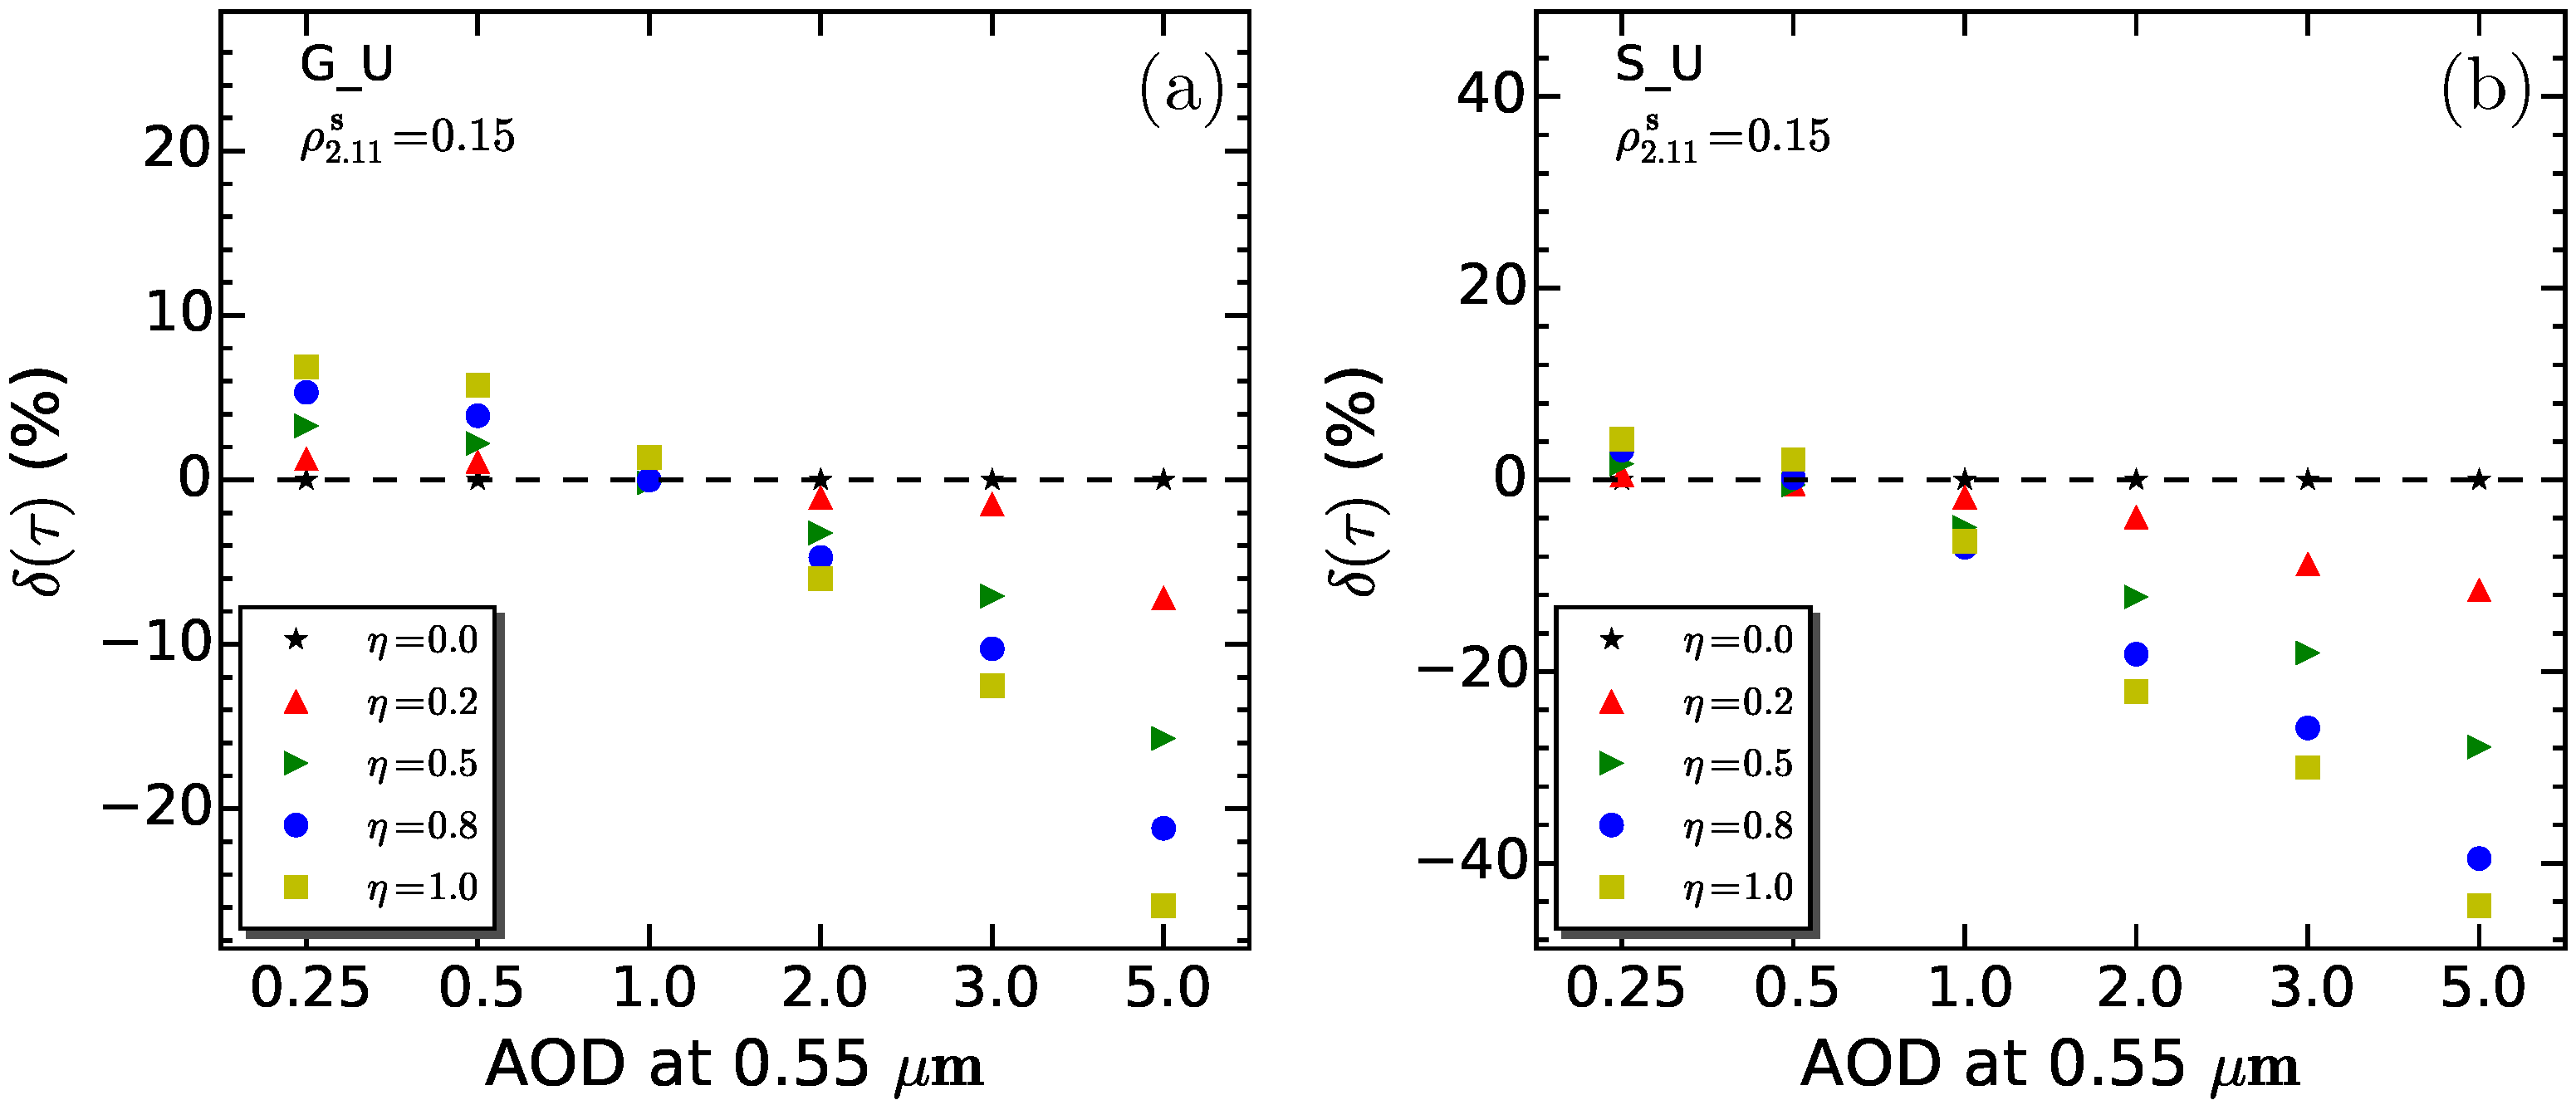
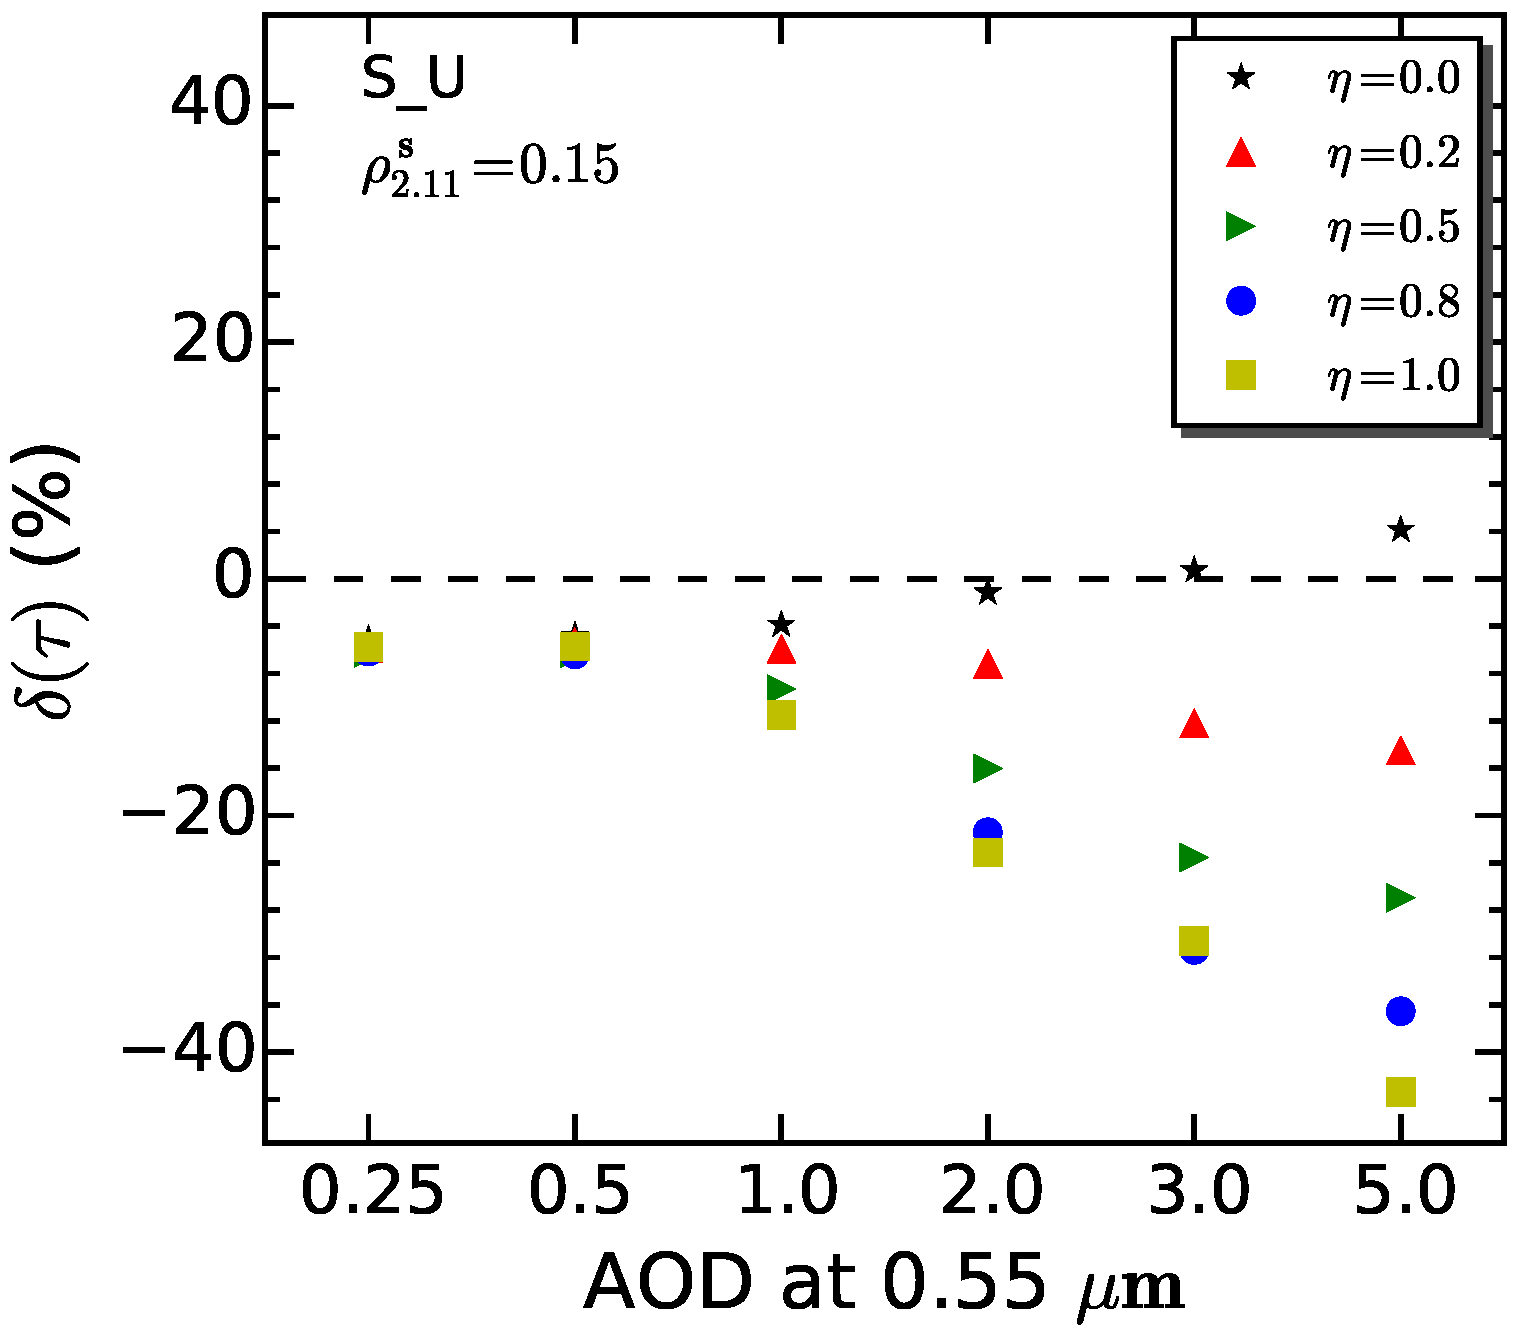
  • Generally ( τ 0 . 5 ), errors in aerosol type assumption can lead to uncertainty up to 8% in the AOD retrieval with the algorithm. By combining the uncertainty of the aerosol type (urbanIndustrial replaced with smoke) with its vertical profiles (ExpH2 replaced with Exp2L3), the AOD errors present a significant negative bias with the δ ( τ ) by >6%. The errors can be up to 15% when aerosol loading of 1.0 is observed.
In addition, sensitivity to the aerosol properties of the retrieval is insignificant for weakly- and non-absorbing aerosols (e.g., urban Industrial and generic) especially when low aerosol loading is observed. Thus to improve the retrieval, more attention should be paid to the cases of the air pollutions caused by forest fires or extreme dust events. These cases usually are consistent with a heavy and thick elevated aerosol layer, and have a strong impact on climate regionally and globally. We assume that for these cases the bias of the MODIS AOD retrieval can be reduced by 15% based on this study. We also note that the algorithm intrinsic uncertainty refers to the retrieval techniques. This uncertainty should be reduced to near zero by optimizing the retrieval techniques especially the estimation of the surface reflectance. This would help further improve the retrieval accuracy especially dealing with the condition of heavy aerosol loading.

Acknowledgments

We are grateful to Robert C. Levy for providing us with the source code of MODIS C6 algorithm (dark target over land) and the data of aerosol model parameters. This work was partially supported by China Scholarship Council (CSC) under the Grant CSC No. 201206040045.

Author Contributions

Yerong Wu designed the research, carried out the modeling and prepared the manuscript. All authors contributed to the scientific content, the interpretation of the results and manuscript revisions.

Conflicts of Interest

The authors declare no conflict of interest.

Abbreviations

The following abbreviations are used in this manuscript:
AOD
Aerosol Optical Depth
AERONET
Aerosol Robotic Network
MODIS
Moderate Resolution Imaging Spectroradiometer
CALIPSO
Cloud-Aerosol Lidar and Infrared Pathfinder Satellite Observation
LUT
LookUp Table
DT
Dark Target
C6_DT
Collection 6 Dark Target
EE
Expected Error
ExpH1
the exponential distribution with the scale height of 1, other ExpH series follow the same rule
Exp2L0
the 2-layer distribution with the bottom layer at the surface (altitude: 0), other Exp2L series follow the same rule

Appendix A. Aerosol Size Distribution

We give a brief review of the aerosol size distribution that applied in the MODIS AOD algorithm [3].
For any size distribution, the particles number N related to area A and volume V distributions are:
d N d ln r = 1 π r 2 d A d ln r = 3 4 π r 3 d V d ln r ,
where d N / d ln r is the number size distribution, with the radius r in μ m. In the MODIS C6_DT algorithm over land, the aerosol models are assumed with bi-lognormal distribution. For the size distribution, each lognormal mode has 3 free variables, including the median radius of the volume size distribution r v ( μ m in unit), the standard deviation of the radius σ, and the volume of particles per cross section of atmospheric column V 0 ( μ m 3 / μ m 2 in unit). Thus, for each single lognormal mode, the number size distribution is represented as:
d N d ln r = N 0 σ 2 π exp ( - ln ( r / r g ) 2 2 σ 2 ) ,
where r g and N 0 are the median radius and the amplitude of the number size distribution, respectively, defined as:
r g = r v exp ( - 3 σ 2 ) N 0 = d N d ln r d ln r = V 0 3 4 π r g 3 exp ( - 9 2 σ 2 )
The effective radius r eff in μ m of a lognormal mode is given as:
r eff = 0 r 3 d N d ln r d ln r 0 r 2 d N d ln r d ln r = r g exp ( 5 2 σ 2 )
For lognormal bimodal (1 and 2 for accumulative and coarse mode, respectively), the total number size distribution is:
d N d ln r = d N 1 d ln r + d N 2 d ln r ,
And the corresponding effective radius can be written as:
r eff = 0 r 3 d N 1 + d N 2 d ln r d ln r 0 r 2 d N 1 + d N 2 d ln r d ln r

References

  1. Remer, L.A.; Kaufman, Y.J.; Tanré, D.; Mattoo, S.; Chu, D.A.; Martins, J.V.; Li, R.R.; Ichoku, C.; Levy, R.C.; Kleidman, R.G.; et al. The MODIS aerosol algorithm, products, and validation. J. Atmos. Sci. 2005, 62, 947–973. [Google Scholar] [CrossRef]
  2. Levy, R.C.; Remer, L.A.; Mattoo, S.; Vermote, E.F.; Kaufman, Y.J. Second-generation operational algorithm: Retrieval of aerosol properties over land from inversion of Moderate Resolution Imaging Spectroradiometer spectral reflectance. J. Geophys. Res. Atmos. 2007, 112, D13211. [Google Scholar] [CrossRef]
  3. Levy, R.C.; Remer, L.A.; Dubovik, O. Global aerosol optical properties and application to Moderate Resolution Imaging Spectroradiometer aerosol retrieval over land. J. Geophys. Res. Atmos. 2007, 112, D13210. [Google Scholar] [CrossRef]
  4. Levy, R.C.; Mattoo, S.; Munchak, L.A.; Remer, L.A.; Sayer, A.M.; Patadia, F.; Hsu, N.C. The Collection 6 MODIS aerosol products over land and ocean. Atmos. Meas. Tech. 2013, 6, 2989–3034. [Google Scholar] [CrossRef]
  5. Li, Z.; Zhao, X.; Kahn, R.; Mishchenko, M.; Remer, L.; Lee, K.H.; Wang, M.; Laszlo, I.; Nakajima, T.; Maring, H. Uncertainties in satellite remote sensing of aerosols and impact on monitoring its long-term trend: A review and perspective. Ann. Geophys. 2009, 27, 2755–2770. [Google Scholar] [CrossRef]
  6. Zhang, J.; Reid, J.S. A decadal regional and global trend analysis of the aerosol optical depth using a data-assimilation grade over-water MODIS and Level 2 MISR aerosol products. Atmos. Chem. Phys. 2010, 10, 10949–10963. [Google Scholar] [CrossRef]
  7. Guo, J.P.; Zhang, X.Y.; Wu, Y.R.; Zhaxi, Y.; Che, H.Z.; La, B.; Wang, W.; Li, X.W. Spatio-temporal variation trends of satellite-based aerosol optical depth in China during 1980–2008. Atmos. Environ. 2011, 45, 6802–6811. [Google Scholar] [CrossRef]
  8. Chu, D.A.; Kaufman, Y.J.; Zibordi, G.; Chern, J.D.; Mao, J.; Li, C.; Holben, B.N. Global monitoring of air pollution over land from the Earth Observing System-Terra Moderate Resolution Imaging Spectroradiometer (MODIS). J. Geophys. Res. Atmos. 2003, 108, 4661. [Google Scholar] [CrossRef]
  9. Engel-Cox, J.A.; Holloman, C.H.; Coutant, B.W.; Hoff, R.M. Qualitative and quantitative evaluation of MODIS satellite sensor data for regional and urban scale air quality. Atmos. Environ. 2004, 38, 2495–2509. [Google Scholar] [CrossRef]
  10. Hoff, R.M.; Christopher, S.A. Remote sensing of particulate pollution from space: Have we reached the promised land? J. Air Waste Manag. Assoc. 2009, 59, 645–675. [Google Scholar] [PubMed]
  11. Wu, Y.; Guo, J.; Zhang, X.; Tian, X.; Zhang, J.; Wang, Y.; Duan, J.; Li, X. Synergy of satellite and ground based observations in estimation of particulate matter in eastern China. Sci. Total Environ. 2012, 433, 20–30. [Google Scholar] [CrossRef] [PubMed]
  12. Hyer, E.J.; Reid, J.S.; Zhang, J. An over-land aerosol optical depth data set for data assimilation by filtering, correction, and aggregation of MODIS Collection 5 optical depth retrievals. Atmos. Meas. Tech. 2011, 4, 379–408. [Google Scholar] [CrossRef]
  13. Liu, Z.; Liu, Q.; Lin, H.C.; Schwartz, C.S.; Lee, Y.H.; Wang, T. Three-dimensional variational assimilation of MODIS aerosol optical depth: Implementation and application to a dust storm over East Asia. J. Geophys. Res. Atmos. 2011, 116, D23206. [Google Scholar] [CrossRef]
  14. Schwartz, C.S.; Liu, Z.; Lin, H.C.; Cetola, J.D. Assimilating aerosol observations with a “hybrid” variational-ensemble data assimilation system. J. Geophys. Res. Atmos. 2014, 119, 4043–4069. [Google Scholar] [CrossRef]
  15. Yu, H.; Kaufman, Y.J.; Chin, M.; Feingold, G.; Remer, L.A.; Anderson, T.L.; Balkanski, Y.; Bellouin, N.; Boucher, O.; Christopher, S.; et al. A review of measurement-based assessments of the aerosol direct radiative effect and forcing. Atmos. Chem. Phys. 2006, 6, 613–666. [Google Scholar] [CrossRef]
  16. Bellouin, N.; Jones, A.; Haywood, J.; Christopher, S.A. Updated estimate of aerosol direct radiative forcing from satellite observations and comparison against the Hadley Centre climate model. J. Geophys. Res. Atmos. 2008, 113, D10205. [Google Scholar] [CrossRef]
  17. Myhre, G. Consistency between satellite-derived and modeled estimates of the direct aerosol effect. Science 2009, 325, 187–190. [Google Scholar] [CrossRef] [PubMed]
  18. McComiskey, A.; Schwartz, S.E.; Schmid, B.; Guan, H.; Lewis, E.R.; Ricchiazzi, P.; Ogren, J.A. Direct aerosol forcing: Calculation from observables and sensitivities to inputs. J. Geophys. Res. Atmos. 2008, 113, D09202. [Google Scholar] [CrossRef]
  19. Zhang, J.; Reid, J.S. MODIS aerosol product analysis for data assimilation: Assessment of over-ocean level 2 aerosol optical thickness retrievals. J. Geophys. Res. Atmos. 2006, 111, D22207. [Google Scholar] [CrossRef]
  20. Mielonen, T.; Levy, R.C.; Aaltonen, V.; Komppula, M.; de Leeuw, G.; Huttunen, J.; Lihavainen, H.; Kolmonen, P.; Lehtinen, K.E.J.; Arola, A. Evaluating the assumptions of surface reflectance and aerosol type selection within the MODIS aerosol retrieval over land: The problem of dust type selection. Atmos. Meas. Tech. 2011, 4, 201–214. [Google Scholar] [CrossRef] [Green Version]
  21. Wu, Y.; de Graaf, M.; Menenti, M. MODIS Aerosol Optical Depth retrieval over land considering surface BRDF effects. IEEE Trans. Geosci. Remote Sens. 2016. submitted. [Google Scholar]
  22. Wu, Y.; de Graaf, M.; Menenti, M. Improved MODIS Dark Target Aerosol Optical Depth algorithm over land: Angular effect Correction. Atmos. Meas. Tech. 2016. [Google Scholar] [CrossRef]
  23. Hsu, N.C.; Jeong, M.J.; Bettenhausen, C.; Sayer, A.M.; Hansell, R.; Seftor, C.S.; Huang, J.; Tsay, S.C. Enhanced Deep Blue aerosol retrieval algorithm: The second generation. J. Geophys. Res. Atmos. 2013, 118, 9296–9315. [Google Scholar] [CrossRef]
  24. Remer, L.A.; Kaufman, Y.J. Dynamic aerosol model: Urban/industrial aerosol. J. Geophys. Res. Atmos. 1998, 103, 13859–13871. [Google Scholar] [CrossRef]
  25. Remer, L.A.; Kaufman, Y.J.; Holben, B.N.; Thompson, A.M.; McNamara, D. Biomass burning aerosol size distribution and modeled optical properties. J. Geophys. Res. Atmos. 1998, 103, 31879–31891. [Google Scholar] [CrossRef]
  26. Kokhanovsky, A.A.; Deuzé, J.L.; Diner, D.J.; Dubovik, O.; Ducos, F.; Emde, C.; Garay, M.J.; Grainger, R.G.; Heckel, A.; Herman, M.; et al. The inter-comparison of major satellite aerosol retrieval algorithms using simulated intensity and polarization characteristics of reflected light. Atmos. Meas. Tech. 2010, 3, 909–932. [Google Scholar] [CrossRef]
  27. Lee, J.; Hsu, N.C.; Bettenhausen, C.; Sayer, A.M.; Seftor, C.J.; Jeong, M.J. Retrieving the height of smoke and dust aerosols by synergistic use of VIIRS, OMPS, and CALIOP observations. J. Geophys. Res. Atmos. 2015, 120, 2015JD023567. [Google Scholar] [CrossRef]
  28. Eck, T.F.; Holben, B.N.; Reid, J.S.; Mukelabai, M.M.; Piketh, S.J.; Torres, O.; Jethva, H.T.; Hyer, E.J.; Ward, D.E.; Dubovik, O.; et al. A seasonal trend of single scattering albedo in southern African biomass-burning particles: Implications for satellite products and estimates of emissions for the world’s largest biomass-burning source. J. Geophys. Res. Atmos. 2013, 118, 6414–6432. [Google Scholar] [CrossRef]
  29. Wu, Y.; de Graaf, M.; Menenti, M. Unpublished work. 2006.
  30. Hsu, N.C.; Tsay, S.C.; King, M.D.; Herman, J.R. Aerosol properties over bright-reflecting source regions. IEEE Trans. Geosci. Remote Sens. 2004, 42, 557–569. [Google Scholar] [CrossRef]
  31. Levy, R.C.; Remer, L.A.; Kleidman, R.G.; Mattoo, S.; Ichoku, C.; Kahn, R.; Eck, T.F. Global evaluation of the Collection 5 MODIS dark-target aerosol products over land. Atmos. Chem. Phys. 2010, 10, 10399–10420. [Google Scholar] [CrossRef] [Green Version]
  32. Kaufman, Y.J.; Tanré, D.; Remer, L.A.; Vermote, E.F.; Chu, A.; Holben, B.N. Operational remote sensing of tropospheric aerosol over land from EOS moderate resolution imaging spectroradiometer. J. Geophys. Res. 1997, 102, 17–51. [Google Scholar] [CrossRef]
Figure 1. Size distribution (a) and phase function (b) for the four aerosol models. For the comparison, the phase function of Rayleigh is added in the plot. The result is reproduced using the data from [3].
Remotesensing 08 00765 g001
Figure 2. Exponential distribution as a function of scale height, ranging from 1 to 6 by step of one (see ExpH1, ExpH2,...and ExpH6). The total AOD ( τ t o t ) is set as 0.5. The tail of the distribution beyond 15 km is vertically cut off since the AOD is significantly small in high space.
Remotesensing 08 00765 g002
Figure 3. The uncertainty of four retrieval parameters as function of fine ratio η in C6 algorithm. Note that the result is achieved by averaging the values of the parameters ( τ , η , ϵ , and ρ 2 . 11 s ) over 1520 geometrical combinations, assuming aerosol model as Moderately absorbing (Generic model in the figure) with the surface reflectance ρ 2 . 11 s = 0 . 15 in the retrieval. (a) shows the relatively difference of mean AOD between the retrieved and the expected one (reference) (e.g., when aerosol loading is set as 0.5, then the expected AOD should be 0.5 exactly); (bd) show the mean values of fine ratio η, fitting error ϵ and the surface reflectance ρ 2 . 11 s , respectively.
Remotesensing 08 00765 g003
Figure 4. The surface reflectance ρ 2 . 11 s and simulation in the retrieval (Issue 1). These parameters are produced by the C6_DT algorithm with a synthetic measurement. The mixture of generic + dust ( η = 0 . 5 and τ = 0 . 5 ) is selected to construct the synthetic data at the given geometrical angle (nadir view, θ 0 = 24 ). In the algorithm, the possible values of ρ 2 . 11 s are obtained (a), shown as a function of aerosol loading and the fine ratio. Note that the ρ 2 . 11 s was plotted out only with aerosol loading (0.25, 0.5 and 1.0), shown as “black *”, “red triangle” and “green triangle”, respectively. Other values with large aerosol loading were not shown. With the experimental relationship of surface reflectance for VISvs2.11, the possible ρ 2 . 11 s is further to generate the simulation for the TOA reflectance at two visible bands (0.466 and 0.644 μ m) at each node of aerosol loading (0.25 and 0.5) and fine ratio, given in (b). “White” line indicates the simulation, where “solid ”and “dash” line means the simulation varied with aerosol loading and fine ratio, respectively. To compare with the simulation, the corresponding “truth” value is also given, plotted as “black” line.
Remotesensing 08 00765 g004
Figure 5. The surface reflectance ρ 2 . 11 s and simulation in the retrieval (Issue 2). Selected was a similar synthetic data as in Figure 4, but with heavy aerosol loading ( τ 2 . 0 ). Note that that the aerosol loading and fine ratio are assumed as knowns for the simulation. The possible surface reflectance ρ 2 . 11 s varies with aerosol loading and fine ratio, given as “solid” and “dash” line, respectively in (a). The corresponding simulation of TOA reflectance is given in (b). Other symbols are similar to that in Figure 4.
Remotesensing 08 00765 g005
Figure 6. The AOD errors caused by different aerosol vertical distributions. The errors δ ( τ ) are calculated by averaging over 1520 geometrical combinations, shown as a function of aerosol loadings in (ac); In (a), the label of “ExpH3S_ExpH2R-Ref” indicate the AOD difference δ ( τ ) between “ExpH3_ExpH2R”and “Ref”, where “ExpH3S_ExpH2R” means the AOD is achieved with ExpH3 simulation, but using ExpH2 LUT in the retrieval. As for “Ref”, the AOD is achieved with ExpH2 simulation, using the LUT with the same distribution as in simulation. Other labels are similar too.
Remotesensing 08 00765 g006
Figure 7. The AOD errors caused by different aerosol vertical distributions. The AOD that achieved with the “ideal” simulation with ExpH2 and Exp2L0 was selected as “reference” in the comparison of the retrieval with “ExpH” and “Exp2L” series, respectively. The difference for “ExpH” and “Exp2L” are given in (a,b), respectively. Note the results are obtained with pure smoke aerosol at τ = 0 . 5 , under 5 angles (nadir view with 5 solar zenith angles θ 0 ). The 2.11 μ m surface reflectance is set as 0.15.
Remotesensing 08 00765 g007
Figure 8. The simulations with smoke model, under a given viewing geometry. (a,b) show the results with nadir view and solar zenith angle θ 0 = 0 and θ 0 = 48 , respectively. The Exp2L simulation series are created with τ = 0 . 5 , shown as 7 points in the figure. The 2.11 μ m TOA reflectance is not shown due to its near nonsensitivity to the aerosol vertical distribution. The ρ 2 . 11 s is set as 0.15.
Remotesensing 08 00765 g008
Figure 9. The AOD errors by wrongly assuming aerosol models. The mean errors δ ( τ ) are calculated by averaging over 1520 geometrical combinations, with ρ 2 . 11 s = 0 . 15 , shown as a function of aerosol loadings. The “reference” AOD is the one that is achieved in the algorithm by the correctly choosing aerosol model. Some abbreviations of aerosol models are used (G: Generic, S: Smoke, U: UrbanIndustrial). “G_U” in (a) means the relative difference between the result with that generic aerosol is observed while urbanIndustrial one is given in the retrieval and “reference”. Similarly, the result with “S_U” is shown in (b).
Remotesensing 08 00765 g009
Figure 10. The AOD errors by wrongly assuming aerosol models. Note the results are calculated with η = 1 . 0 and τ = 0 . 5 at five angles (nadir view with 5 solar zenith angles θ 0 ). The other symbols are the same as that in Figure 9.
Remotesensing 08 00765 g010
Figure 11. The AOD errors by wrongly assuming aerosol vertical distribution and type. The smoke aerosol with Exp2L3 distribution is used in the simulation, but using the LUT of UrbanIndustrial model with ExpH2 in the retrieval. Note the results are calculated with ρ 2 . 11 s = 0 . 15 . The other symbols are the same as that in Figure 9.
Remotesensing 08 00765 g011
Table 1. Aerosol physical parameters. Four aerosol models are presented with bi-lognormal modes (accumulative and coarse). For each mode, three parameters are listed, including the volume modal radius r v , the standard deviation of the volume distribution σ, and the total volume of the mode, V 0 . Note that the parameters are given at wavelength of 0.55 μ m and τ = 0.5. The symbol of “—” indicates the same value as the above row. More details are illustrated in [3].
Aerosol ModelMode r v ( μ m)σ V 0 ( μ m 3 / μ m 2 )Refracitve Index
ModeratelyAbsorbing/GenericAccum0.15520.442050.09601.455 − 0.009i
Coarse3.26890.77820.0922
Absorbing/SmokeAccum0.13830.42310.094231.51 − 0.02i
Coarse3.922350.763750.06499
NonAbsorbing/UrbanIndustrialAccum0.18210.440650.0972271.42 − 0.00625i
Coarse3.395750.84140.05996
Speriod/DustAccum0.14660.682380.042771.5017 − 0.002i
Coarse2.20.574290.32618
Table 2. The properties of aerosol models used in MODIS C6 algorithm. Single scattering albedo ω 0 and effective radius r eff for the aerosol models are presented. The parameters are given at the wavelength of 0.55 μ m with τ = 0 . 5 . The data is provided by [3].
Aerosol Model ω 0 r eff , μ m
ModeratelyAbsorbing/Generic0.9200.261
Absorbing/Smoke0.8690.208
NonAbsorbing/UrbanIndustrial0.9470.256
Speriod/Dust0.9530.680

