Article

Improved Detection of Human Respiration Using Data Fusion Basedon a Multistatic UWB Radar

Department of Medical Electronics, School of Biomedical Engineering, Fourth Military Medical University, Xi’an 710032, China
*
Author to whom correspondence should be addressed.
Submission received: 30 June 2016 / Revised: 24 August 2016 / Accepted: 13 September 2016 / Published: 20 September 2016

Abstract

:
This paper investigated the feasibility for improved detection of human respiration using data fusion based on a multistatic ultra-wideband (UWB) radar. UWB-radar-based respiration detection is an emerging technology that has great promise in practice. It can be applied to remotely sense the presence of a human target for through-wall surveillance, post-earthquake search and rescue, etc. In these applications, a human target’s position and posture are not known a priori. Uncertainty of the two factors results in a body orientation issue of UWB radar, namely the human target’s thorax is not always facing the radar. Thus, the radial component of the thorax motion due to respiration decreases and the respiratory motion response contained in UWB radar echoes is too weak to be detected. To cope with the issue, this paper used multisensory information provided by the multistatic UWB radar, which took the form of impulse radios and comprised one transmitting and four separated receiving antennas. An adaptive Kalman filtering algorithm was then designed to fuse the UWB echo data from all the receiving channels to detect the respiratory-motion response contained in those data. In the experiment, a volunteer’s respiration was correctly detected when he curled upon a camp bed behind a brick wall. Under the same scenario, the volunteer’s respiration was detected based on the radar’s single transmitting-receiving channels without data fusion using conventional algorithm, such as adaptive line enhancer and single-channel Kalman filtering. Moreover, performance of the data fusion algorithm was experimentally investigated with different channel combinations and antenna deployments. The experimental results show that the body orientation issue for human respiration detection via UWB radar can be dealt well with the multistatic UWB radar and the Kalman-filter-based data fusion, which can be applied to improve performance of UWB radar in real applications.

Graphical Abstract

1. Introduction

In recent years, remote sensing of human targets with ultra-wideband (UWB) radar has attracted increasing attention [1,2,3,4,5,6,7,8,9,10,11,12,13,14,15,16,17]. Since electromagnetic waves transmitted by UWB radar can penetrate through obstacles, such as clothes, walls, building ruins, etc., this technology can be applied in many areas, like medicine, public security, emergence rescue, and so on [1,2,3,4]. Especially, when a human target is motionless, the main feature detected by UWB radar is the thorax motion due to his/her respiration. Since the thorax motion is in order of millimeters, and severe attenuation may exist on the propagation path of the electromagnetic waves, detection of human respiration using UWB radar is a challenging task. To cope with this, many studies have been carried out and shown satisfactory results in the experiments [1,2,3,4,5,6,7,8,9,10,11,12]. However, one experimental condition was too simplified to accord with the reality in most of the studies. For example, the volunteer subjects were positioned facing toward the radar in [1,2,3,4,11,12], and the test person in [5,6] laid supine with their thorax directly towards the antennas. However, a human target’s position and posture cannot be limited in advance in real scenarios. One study has shown that, among multiple postures, such as backing towards the antennas, the narrowband radar detected respiration was strongest when the test person was facing toward the radar [18]. The result is consistent with radar detection principles, according to which the thorax motion in the radar’s radial direction mainly contributes to the detected respiration, and a human target’s postural variation might result in a decrease of the radial component of the thorax motion. Additionally, the human breathing cross-section of UWB radar varies with the position [7]. Thus, uncertainty of a human target’s posture and position leads to a key issue affecting the human respiration detected by UWB radar, namely the detected respiration depends closely on body orientation with respect to the radar. Since a human target’s body orientation cannot always be guaranteed to be facing toward the radar, the respiratory-motion response contained in UWB echoes is much weaker than expected. This will result in performance degradation of UWB radar when being applied in practice, especially for the applications of non-line-of-sight (NLOS) detection of human targets, such as through-wall surveillance or trapped victim search and rescue after an earthquake. According to the knowledge of the authors, only a few studies have considered this issue [8,9,10]. For example, a hidden Markov model was designed to infer the subject facing direction in [8], and a setup comprising multiple UWB transceivers was proposed to solve the issue by choosing the channel with the highest signal quality [9]. However, the two studies aimed at applying UWB radar in medicine, or, to be more specific, in sleep apnea monitoring. Their experiments were carried out in free space, in which detection of human respiration using UWB radar is relatively easy. Mainly for trapped victim detection in post-earthquake emergency rescue, the body orientation problem of UWB radar has been referred to, but not provided any solution [10].
Inspired by the multi-channel and multi-transceiving techniques in [11,12,13,14,15,16,17,19,20], this paper proposed a method to solve the body orientation issue based on a multistatic UWB radar. Compared with UWB monostatic radars, namely single transmitting and single receiving antenna that are collocated, various combinations of transmitting and receiving antennas in a multistatic UWB radar form a multisensory system that provides spatial diversity, redundancy information, multiplexing gain and so on [11,12,13,14,15,16,17,19,20]. However, for human target detection, multistatic UWB radars are mainly used for moving target location and tracking [13,14,15,16,17]. There is no study on improved detection of human respiration using this type of radar. In the paper, the multistatic UWB radar took the form of impulse radios and comprised of one transmitting and four separated receiving antennas. Then, an adaptive Kalman filter was designed to fuse the UWB echo data from all of the receiving channels to detect the weak respiration contained in those data. A Kalman filter is one of the most widely used data fusion methods that has performed well in applications, like maneuvering target navigation, biomedical signal processing and so on [21,22,23,24,25,26]. Especially for biomedical signal processing, a Kalman filter has often been applied to extract or predict physiological signals, such as respiration and ECG [24,25,26]. Compared with these signals, human respiration detected by UWB radar in NLOS applications has a much lower signal to noise ratio. So, to investigate the feasibility of the method, two types of targets were used in the experiment. One was a volunteer that curled upon a camp bed behind a brick wall. The other was an artificial breathing object that imitated the thorax motion due to respiration and moved perpendicularly to the radar’s radial direction. In the experiment, the radar detected the weak respiratory motion response for both the targets based on the Kalman-filter-based data fusion. Moreover, the radar’s performance was experimentally investigated based on its single transmitting-receiving channels, and the data fusion algorithm’s performance with different channel combinations and antenna deploys were experimentally investigated, too. The experimental results show that data fusion based on a multistatic UWB radar system is feasible to solve the weak respiration detection issue caused by the body orientation, and can be applied to improve the performance of UWB radar for human target sensing in real applications.
The paper is organized as follows: Section 2 presents detailed information about the method, mainly describing the multistatic UWB radar, the Kalman-filter-based data fusion algorithm, and the experiment setup; Section 3 illustrates the results from the experiment. Finally, discussion and concluding remarks are given in Section 4 and Section 5, respectively.

2. Materials and Methods

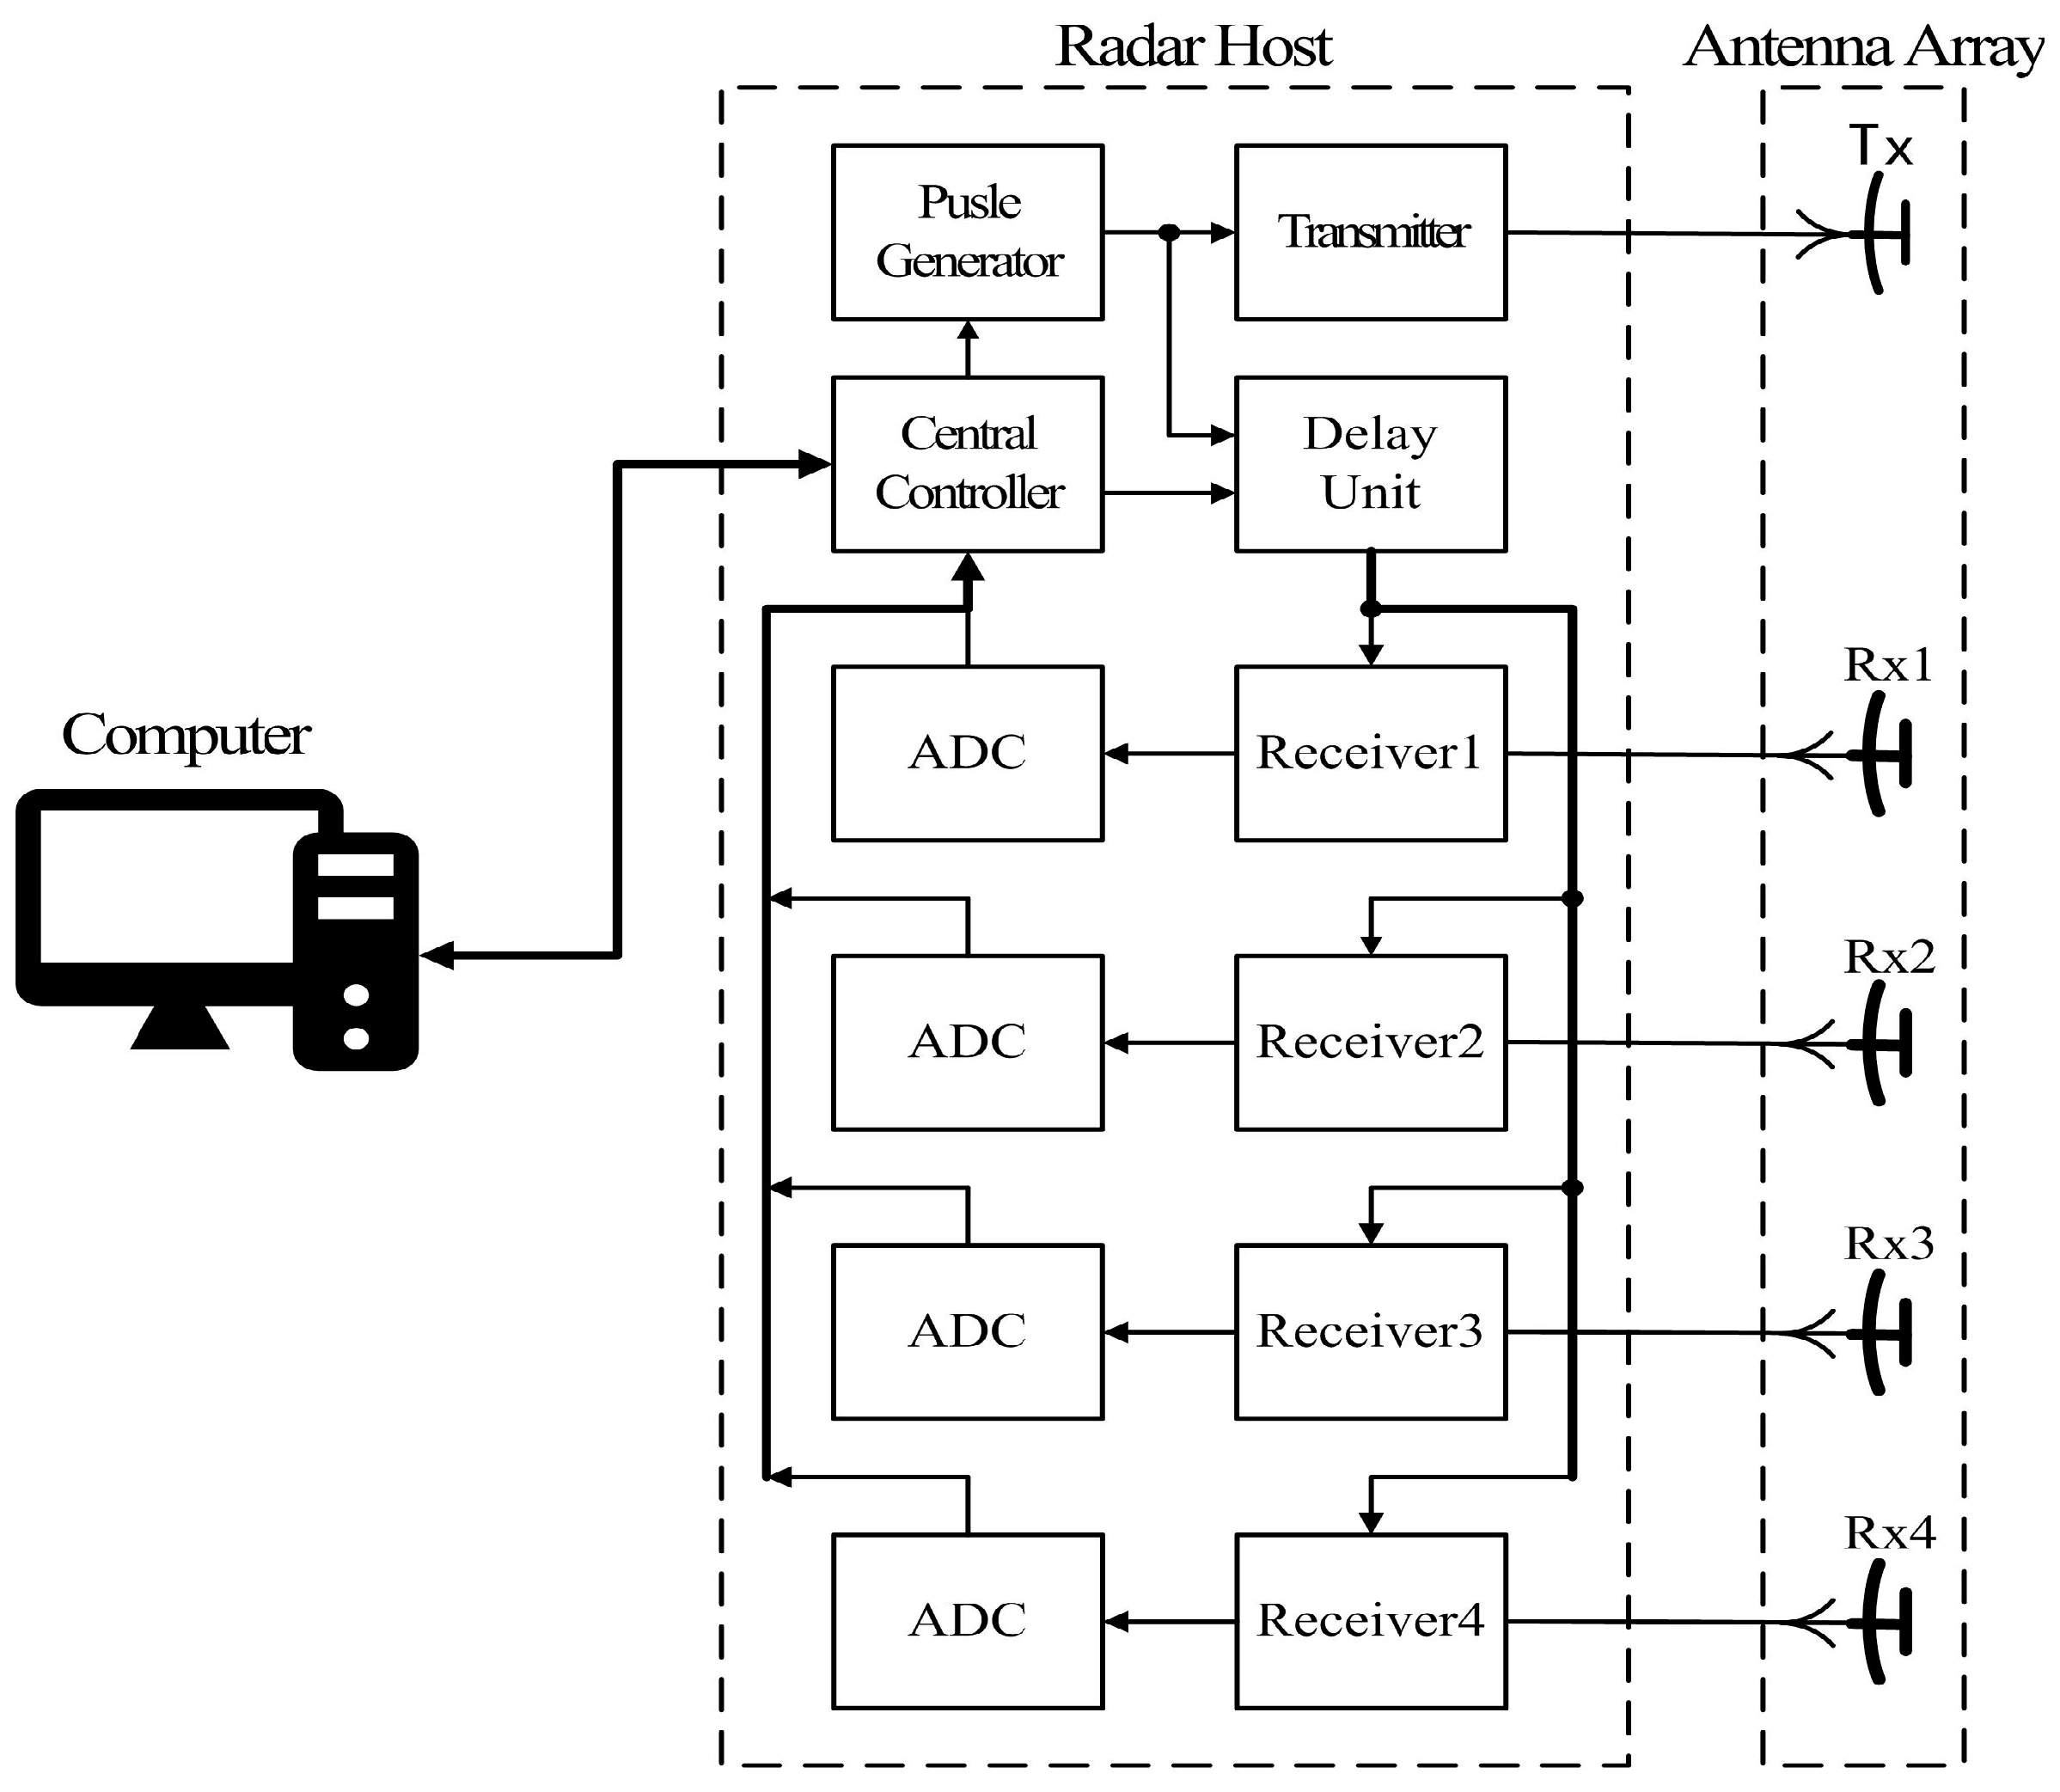
2.1. The Multistatic UWB Radar

The systematic diagram of the multistatic UWB radar is shown in Figure 1. The radar was custom-made by the Fourth Military Medical University originally for multi-target human sensing or location [11]. In this paper, it was used for the improved detection of human respiration. The system can be divided into three functional sections: computer, radar host, and antenna array. The computer is mainly used for parameter setting, data recording, and processing. The radar host is devoted to pulse generation, transmission, receiving, sampling, etc. The pulse generator periodically produces uniform pulses, which are shaped in the transmitter and then sent to the transmitting antenna. At the same time, the pulses generated by the transmitter are sent to the delay unit to produce a range gate that triggers the receivers to receive echoes at selective ranges. Therefore, UWB echoes are 2D ones with range delay (hereafter referred to as range) and measuring time (hereafter referred to as time) information. The delay unit is designed based on a multi-channel, digitized, step-controlling technique. Each receiving antenna has its own receiver and analog-to-digital converter (ADC), which forms an independent receiving or dada channel with the transmitting antenna. The UWB echoes are synchronously received and sampled in those channels. Power supply isolation is designed among the channels to mitigate coupling. The antenna array consists of five elements: one transmitting antenna and four receiving ones. They are all of bow-tie dipoles. The antennas are connected to the radar host via shielding coaxial cables, by which the position of the receiving antennas can be adjusted with respect to that of the transmitting antenna. Moreover, the computer and the radar host communicate through a USB cable. The UWB echo data from all receiving channels are restored and processed in the computer, which essentially plays the role of a central unit for the multistatic system. The computer has an Inter(R) Core(TM) i3-2120 CPU and 8 GB of memory.
The key parameters of the radar are listed in Table 1. The signal mode of the radar is impulse, which took the form of the second derivative of the Gaussian pulse with a width of 2 ns. The transmitted pulses’ peak power is approximately 0.26 W. With the pulse repetition frequency for transmission being 128 kHz, which led to a very low duty cycle, the transmitted pulses’ average power is about −14.9 dBm. Moreover, the radar’s operating frequency is about 250–750 MHz (−10 dB). So the power spectrum density (PSD) of the transmitted pulses can be estimated, namely −41.8 dBm/MHz. It roughly complies with the FCC frequency mask for UWB communication, which is −41.3 dBm/MHz for below 960 MHz. The receivers’ dynamic range is 80 dB and their noise efficiency is 3 dB. More significantly for human respiration detection, the minimum step of the receivers controlled by the delay unit could achieve 10 ps. By multiplying the propagation speed of electromagnetic waves, the value was less than the thorax motion due to respiration. Thus, human targets’ respiration can result in detectable range-variation in the IR-UWB echoes. No coherent integration of pulses is used in the receivers. Additionally, the ADC’s accuracy is 16 bits.

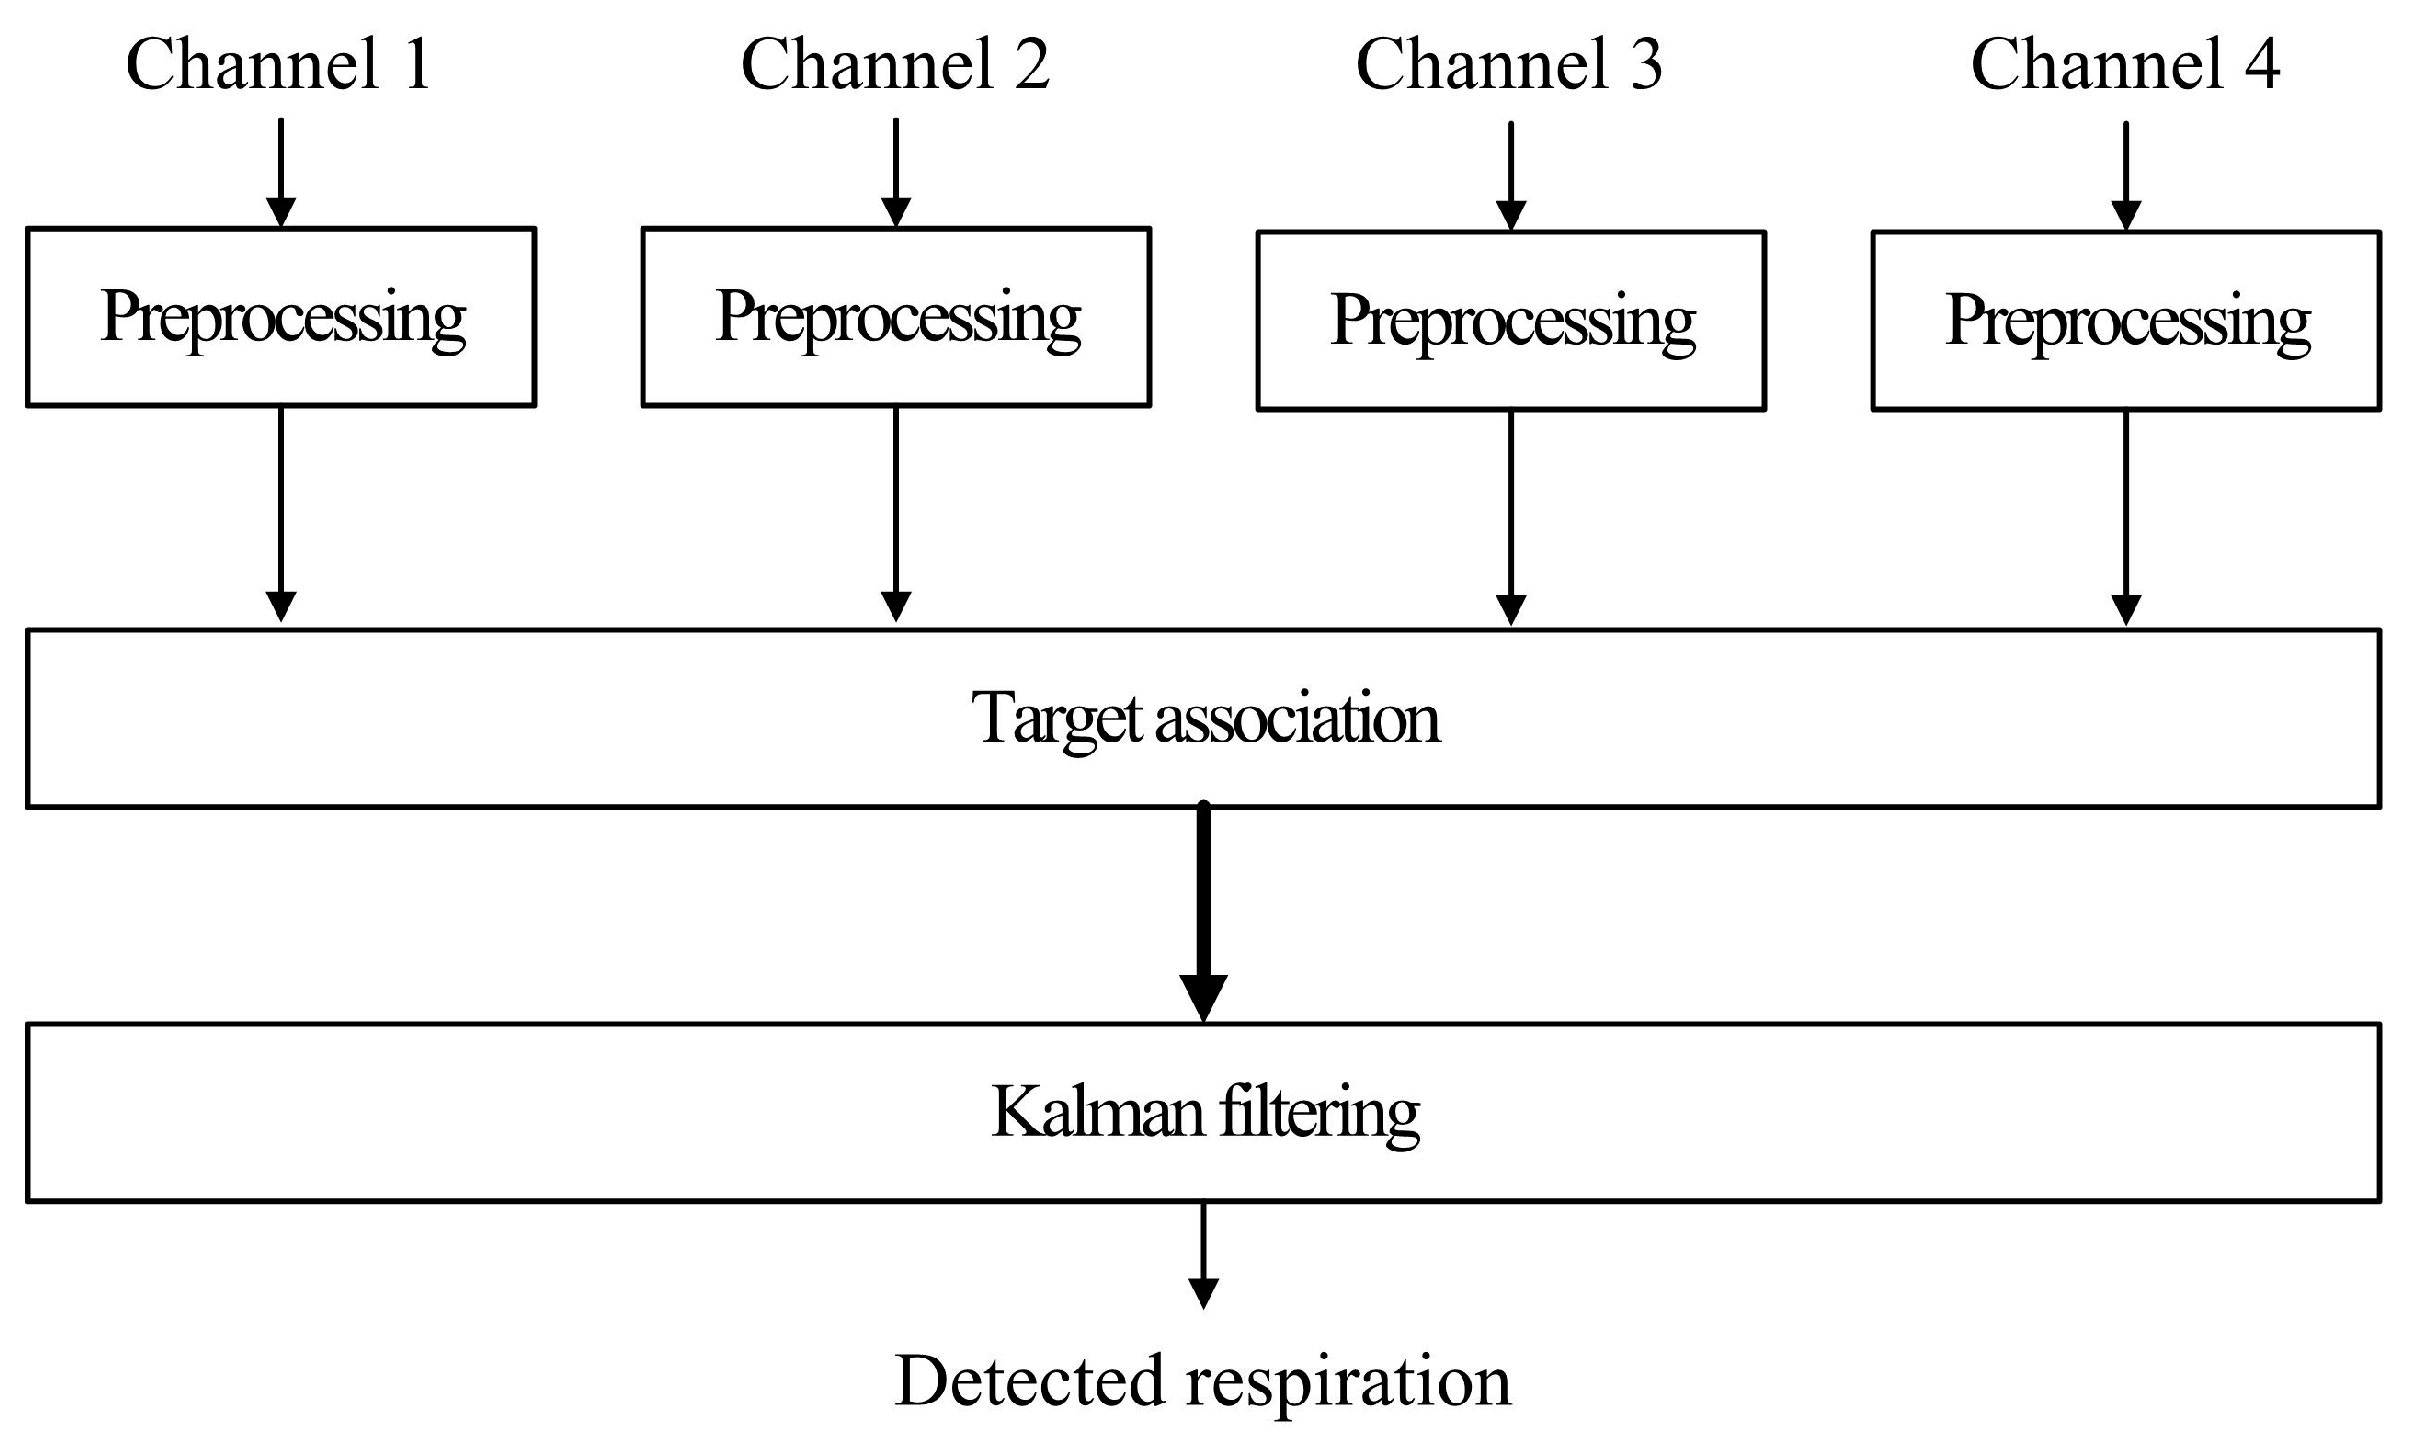
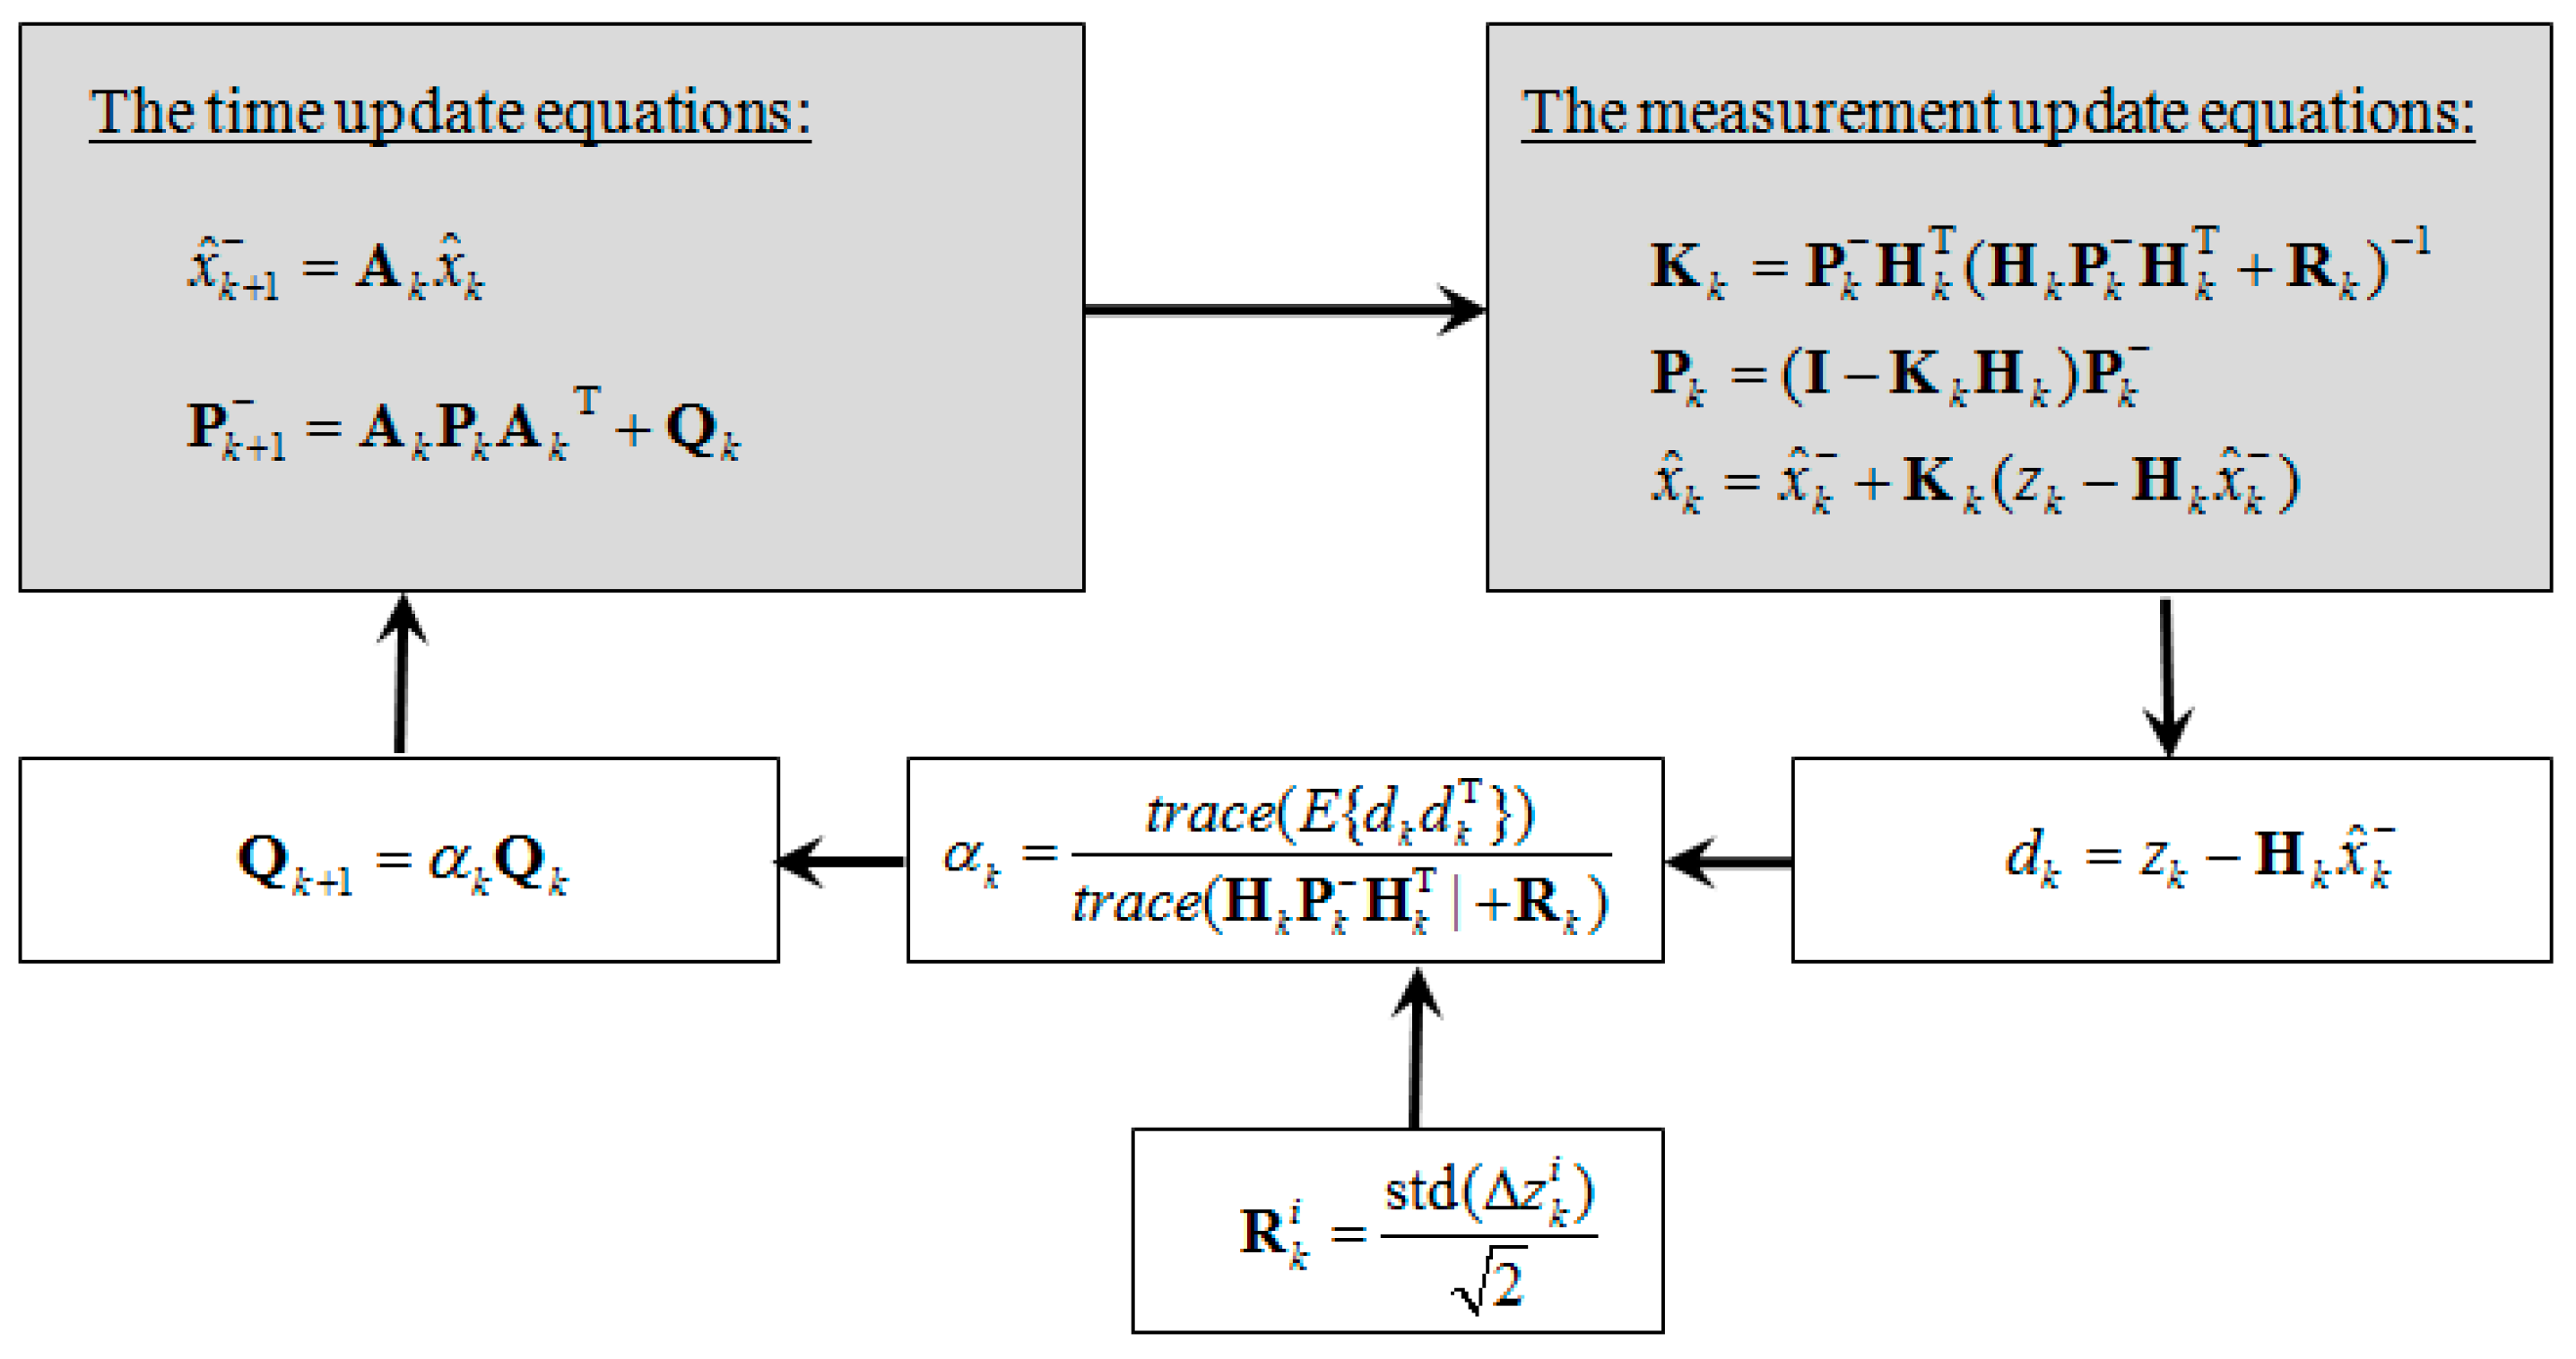
2.2. The Data Fusion Algorithm

The processing flow of the data fusion algorithm is shown in Figure 2. The algorithm involves the following main steps:
(1) Preprocessing. This step is performed inner each channel to eliminate clutters and noises for all of the receiving channels. Firstly, averaging and down-sampling is performed on the UWB echo data in its time and range dimension, which not only improves the signal-to-noise-and-clutter ratio (SNCR) of the data, but also reduces its size for computational efficiency [5,6]. Secondly, a motion filter, more exactly, a windowed mean subtraction along the time dimension of the data, is applied to remove those stationary background clutters caused by scattering of the obstacles and human body [6]. Thirdly, the time series at all ranges in the data are normalized in power, which compensates for the sensitivity unbalance among the receiving channels.
(2) Target association. This involves associating detected respiratory-motion responses from all of the receiving channels belonging to the same target. Target association is one of the most important issues for data fusion especially in the case of multi-target detection, which has been specifically examined in related works. Mainly considering single-target detection, the issue was not an emphasis in this paper and was realized according to the a priori range information of the target. By the way, the issue might be automatically realized based on confocal imaging of the human target via UWB radar [14]. After this step, four records of waveforms that belonged to the target are detected and then fused by Kalman filtering.
(3) Kalman filtering. Kalman filering is carried out based on the knowledge of the process model and stochastic model of a dynamic system or process. Typically, the process model takes the form of a linear state-space model as follows:
x k + 1 = A k x k + w k
z k = H k x k + v k
where x k denotes the state vector in time index k and z k denotes the measurement vector, and A k denotes the state transition matrix and H k the measurement matrix. These two equations are usually referred to, respectively, as the process equation and the measurement equation. So, w k and v k represent, respectively, the process and measurement noises with means and covariances:
E { w k } = E { v k } = 0
E { w i v j T } = 0
E { w i w j T } = { Q i ,   i = j 0 ,   i j
E { v i v j T } = { R i ,   i = j 0 ,   i j
where E { · } denotes the expectation and { · } T denotes the transpose. The Q i and R i are the covariance matrix of process noise and measurement noise, respectively. By minimizing the posteriori estimate error covariance E { e k e k T } in a least square sense, where e k = x k x ^ k is the error between x k and its optimum estimation x ^ k , the time update equations for Kalman filter can be derived as:
x ^ k + 1 = A k x ^ k
P k + 1 = A k P k A k T + Q k
where x ^ k denotes the a priori state estimate at time index k given knowledge of the process; x ^ k denotes the posterior state estimate at k given the measurements; P k = E { e k e k T } where e k = x k x ^ k , is the priori estimate error covariance; P k = E { e k e k T } where e k = x k x ^ k , is the posterior estimate error covariance. The Kalman measurement update equations are:
K k = P k H k T ( H k P k H k T + R k ) 1
x ^ k = x ^ k + K k ( z k H k x ^ k )
P k = ( I K k H k )   P k
where K k is the Kalman gain that determines the updating weight between new measurements and predictions from the dynamic model.
To apply the above equations for human respiration detection, a proper dynamic model should be first designed to describe the breathing process of human targets. Several models have been proposed for the purpose, i.e., the constant velocity (CV) model, the constant acceleration model (CA), and the interacting multiple model (IMM) [26]. Due to having no need of precisely predicting the respiratorymotion, the simple CV model was used in this paper. Thus, the state vector is defined as x k = { x k ,   v k } T where x k and v k denote the position and velocity of the moving thorax due to respiration, respectively. The state transition matrix A k is treated as a time-invariant matrix A , which is defined in the model as:
A = [ 1 Δ t 0 1 ]
where Δ t is the sampling interval of the detected waveforms after the target association. Based on the above definition, the CV model is given by:
[ x k + 1 v k + 1 ] = [ 1 Δ t 0 1 ] [ x k v k ] + [ 0 1 ] w k
In this way, the human respiration is modeled as a process of position varying at the constant velocity, and the noise on the velocity describes random acceleration/deceleration that allowed for the direction change of the position.
There have been two approaches for data fusion using Kalman filtering, namely measurement and state vector fusion [27,28]. The former one was used in this paper, where the detected waveforms (after the target association) from all receiving channels were directly integrated into an augmented measurement vector in a centralized scheme to achieve optimum performance [28]. In this way, the measurement vector is z k = { z k 1 ,   z k 2 ,   z k 3 ,   z k 4 } T where z k i , i = 1 ,   2 ,   3 ,   4 denotes the waveforms from channel 1, 2, 3, and 4, respectively. Then the data fusion is realized by expanding the measurement matrix H k to z k according to the measurement in Equation (1). In this paper, H k is also treated as a time invariant matrix H as follows:
H = [ 1 1 0 0 1 1 0 0 ]
Thus, the measurement noise covariance matrix becomes R k = d i a g [ R k 1 ,   R k 2 ,   R k 3 ,   R k 4 ] , where R k i , i = 1 ,   2 ,   3 ,   4   denotes the noise covariance of the detected waveforms from channel 1, 2, 3,and 4, respectively.
Another key issue of applying Kalman filter for data fusion is to identify the process and measurement noise covariance in the state space model. Incorrect identification of these two parameters would lead to performance suboptimality and divergence problems. For identification of the process noise covariance, the adaptive-fading-factor approach in [23] was used in this paper. The approach uses a factor α k to scale the process noise covariance Q k in (3), namely Q k + 1 = α k Q k . Based on the concept that the actual innovation covariance estimated from the measurements and the theoretical innovation covariance should be equal, α k is defined as follows:
α k = t r a c e ( E { d k d k T } ) t r a c e ( H k P k H k T + R k )
where t r a c e ( · ) denotes the trace of a matrix, d k = z k H k x ^ k denotes the actual innovation sequence and H k P k H k T + R k the theoretical innovation covariance. The identification of R k is usually easier than that of Q k . In this paper, the noise covariance of the detected signals from each channel R k i was updated by estimating the stand deviation (std) of differentiated short-time signal segment Δ z k i   [20]:
R k i = std ( Δ z k i ) 2
Based on the above description, the schematic diagram of the Kalman filtering is shown in Figure 3. The algorithm can be divided into two iterative modules: the time update equations and the measurement update equations. Below the two modules are the adaptive identification processes of the process and measurement noises, respectively.

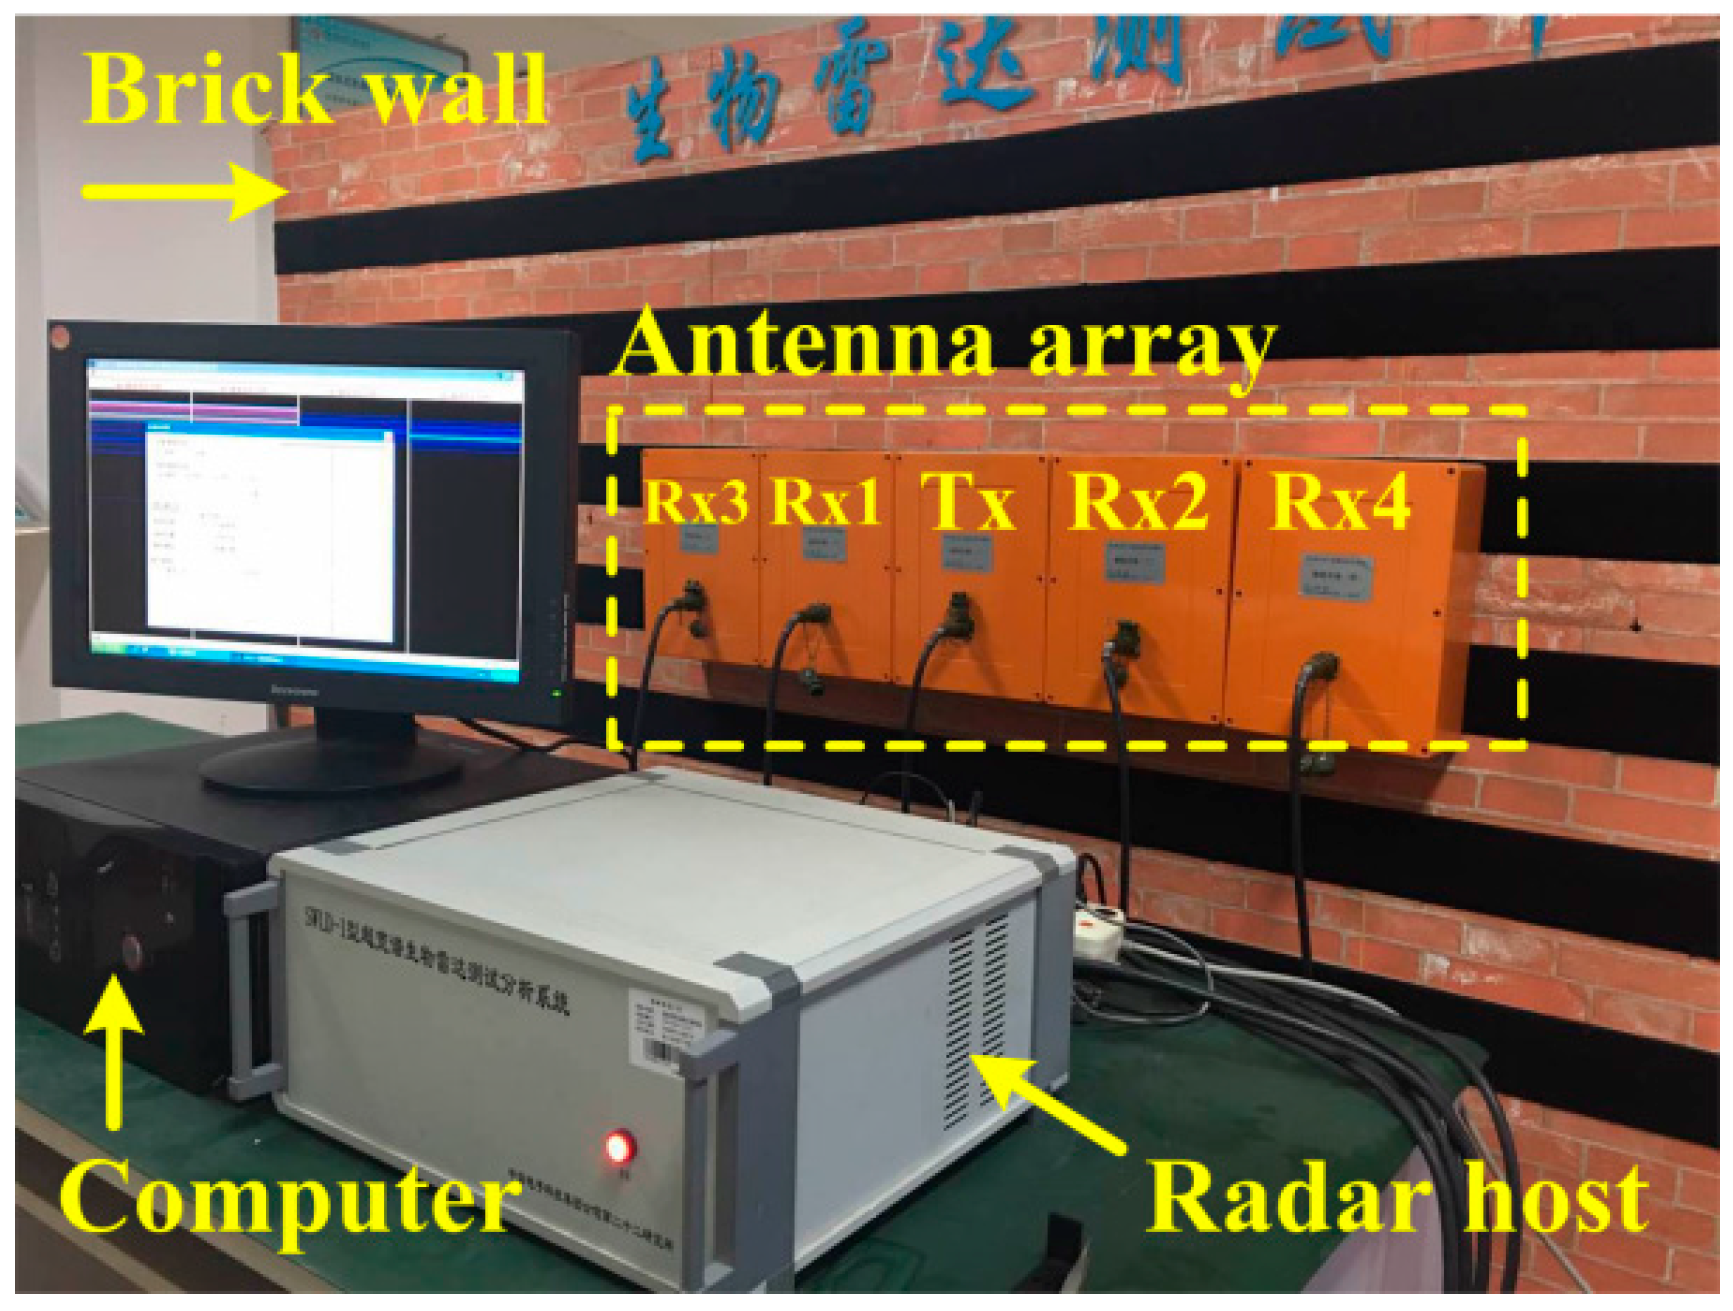
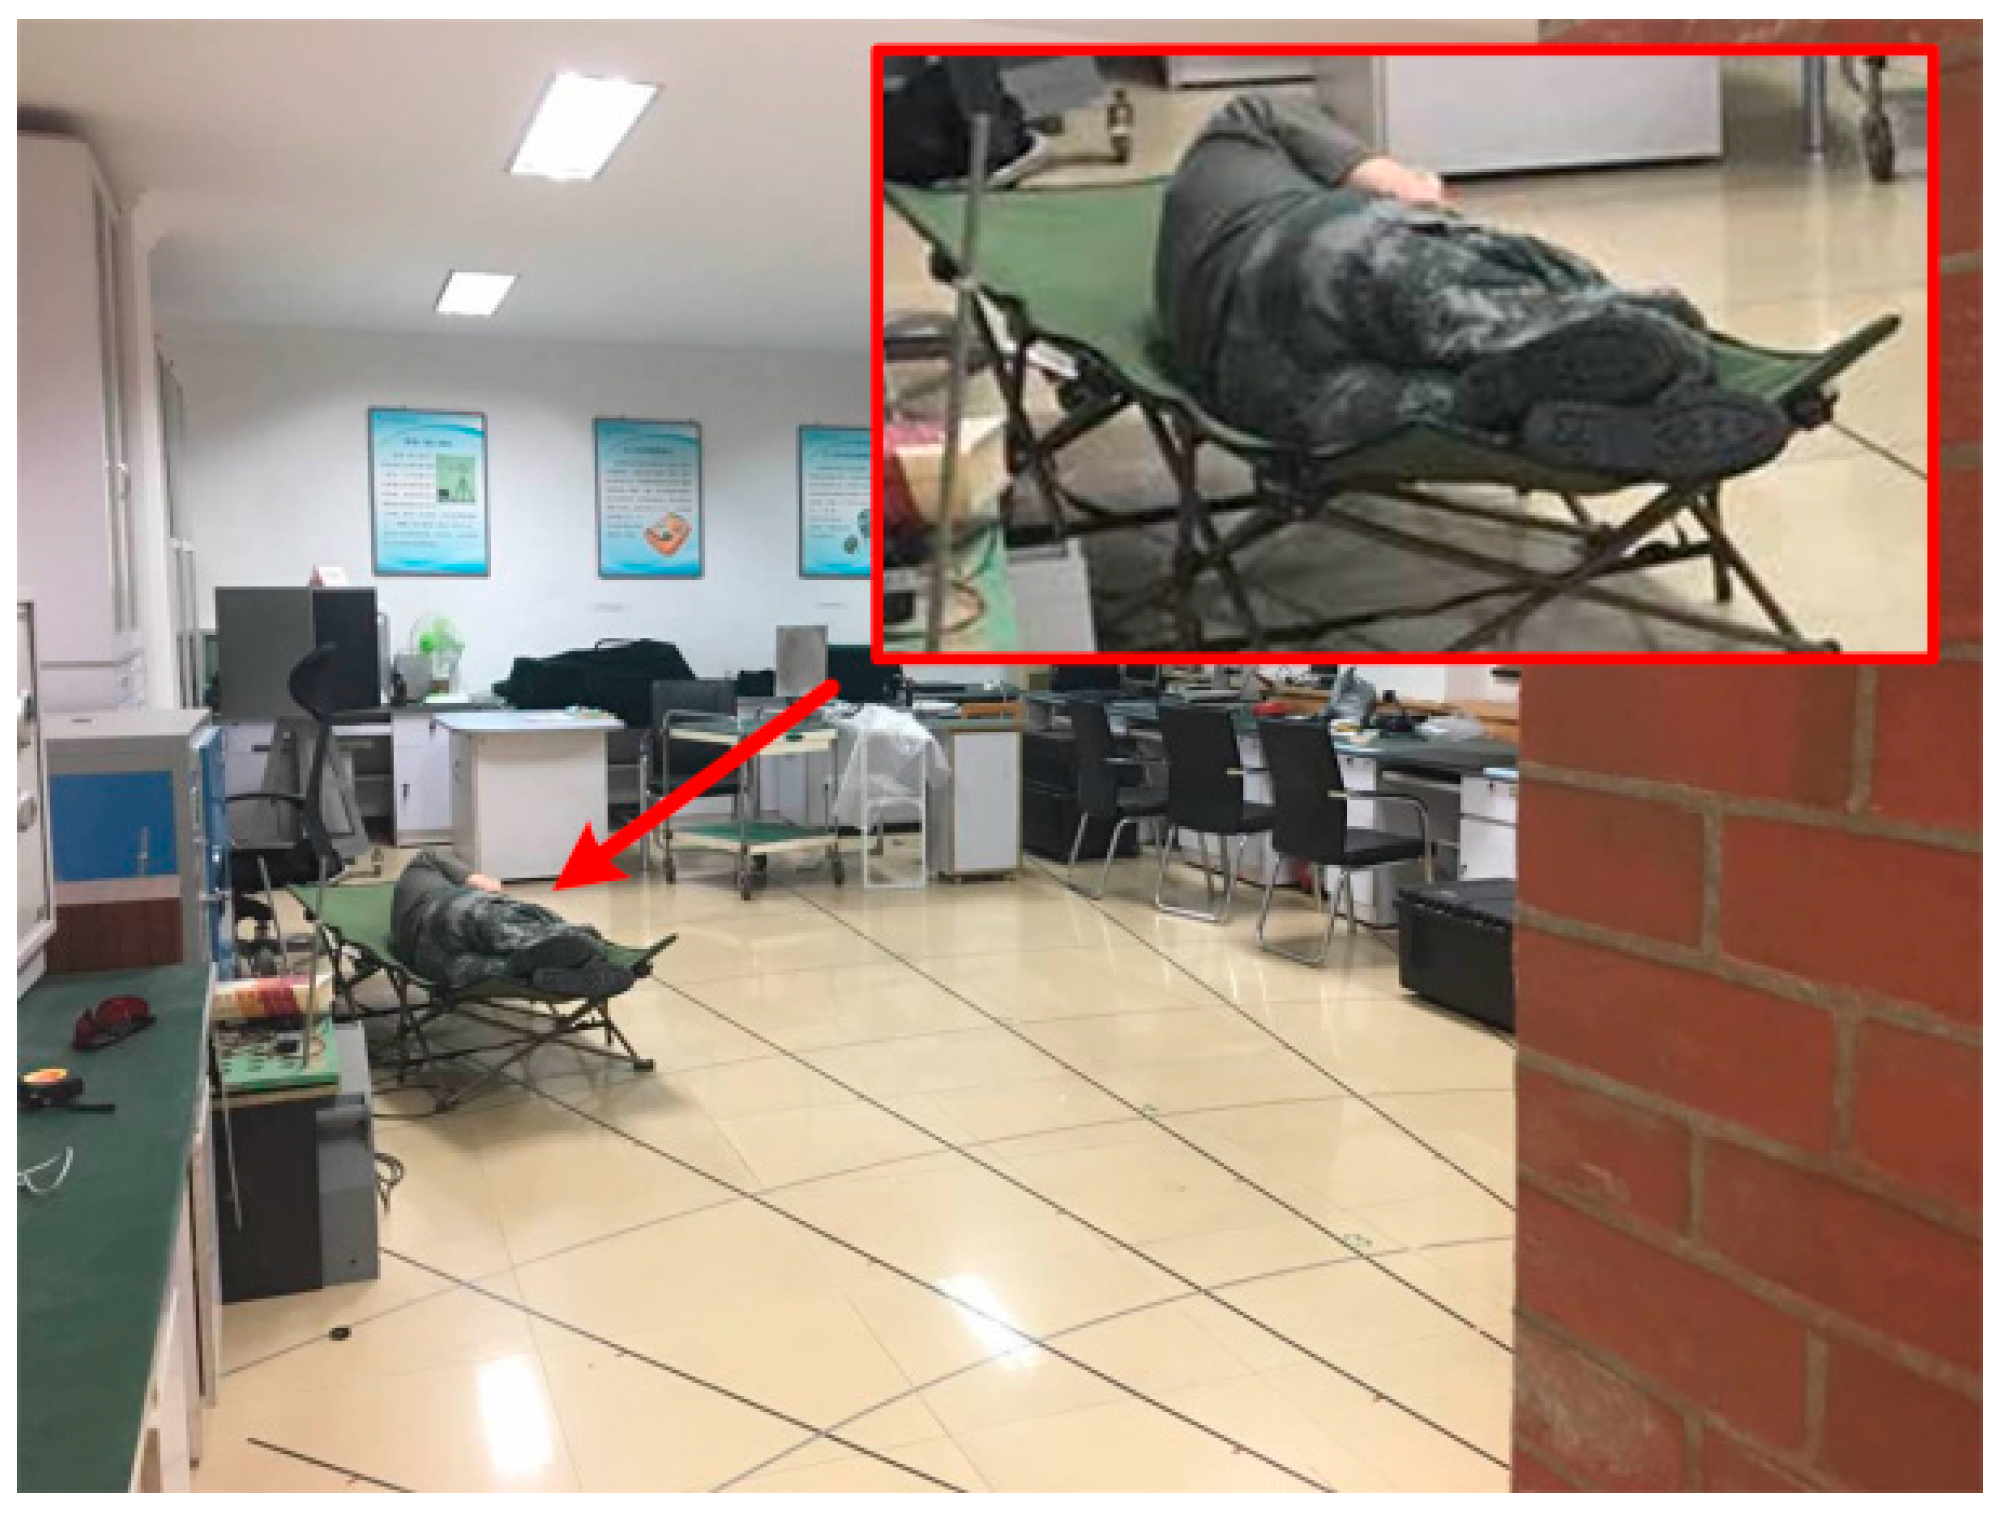
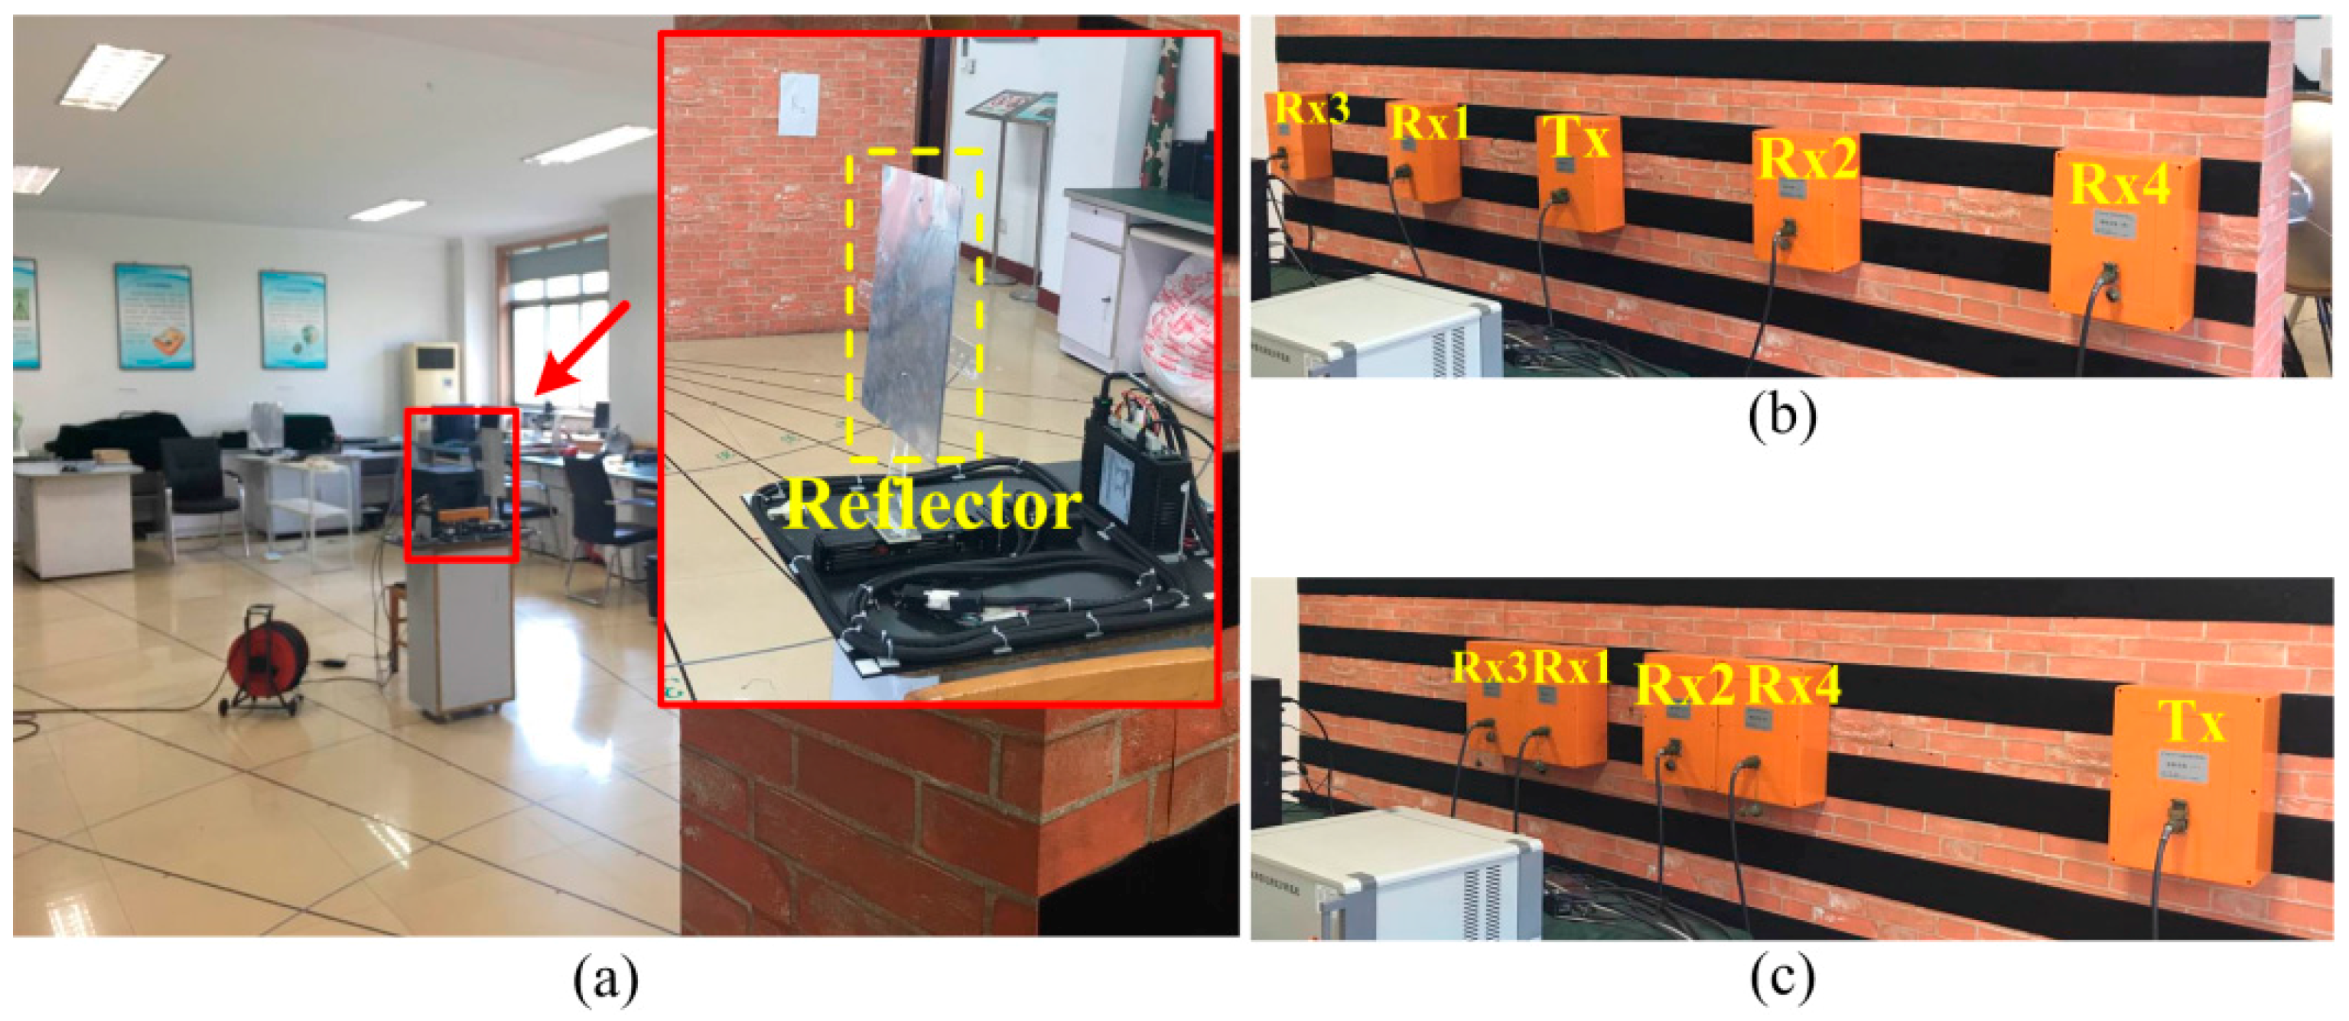
2.3. The Experiment Setup

The experimental setup is shown in Figure 4. The experiment was carried out through a brick wall of 28-cm thickness in the Bio-radar Laboratory, Fourth Military Medical University, Xi’an, China. On the floor behind the wall, there were coordinates of ranges and angles with the origin being the transmitting antenna.The antennas of the multistaticUWB radar were deployed as a line array in which the receiving antennas were placed close with the transmitting one. The antenna array was about 1.1 m above the floor. In the experiment, the time window of the multistatic UWB radar was set as 0–60 ns. The parameter, which corresponds to the range dimension in the 2D UWB data, determines the detection range of the radar. By multiplying the propagation speed of electromagnetic waves, the time window theoretically ranges from 0m to 9m in free space. Additionally, the sampling number in the range of the data was set as 2048. This means that the 0–60 ns range is quantified into 2048 points. The measuring speed in the time of the data was set as 64 Hz. For a measurement duration being about 80 s, this means that 64 × 80 records of data are measured. Given the sampling number, each record contains 2048 data points. The UWB raw data were stored and processed in the computer. All the processing algorithms were implemented in the MATLAB (Mathworkd Inc., Natick, MA, USA) environment.
Two types of measurement were performed by using different targets. In the first one, as shown in Figure 5, a healthy volunteer (25 years old, male) was measured by the radar. During the measurement, he curled upon a camp bed behind the wall and with his feet pointing to the transmitting antenna. By the posture, his body orientation was nearly parallel to the radar’s radial direction. Thus, the respiratory-motion response in the UWB echoes was theoretically much weaker than that when his thorax faced to the radar. Additionally, the volunteer was measured at three different positions, namely (4 m, 0°), (6 m, 0°), and (6 m, −20°) away from the transmitting antenna. Under the scenarios, performance of the multistatic UWB radar and the data fusion algorithm for improved detection of weak respiration was investigated. During the measurement, the volunteer kept motionless and breathed freely. At the same time, he the counted number of his breaths. The number was then used to figure out the respiration rate, which would provide a comparison for the results detected by the UWB radar.
The other measurement used an artificial breathing object, which was shown in Figure 6a. The breathing object used a servo motor to drive a precise gear-shaft module that can turn the motor’s rotation into linear displacement. Then the module brought a reflector (a rectangular metal plate) fixed above it in motion to imitate the thorax motion due to respiration. During the measurement, the object’s frequency was set to 0.2 Hz and its displacement was ±1 mm. Additionally, the object was placed to make its reflector move perpendicularly to the radar’s radial direction, or parallel to the line of the antenna array. In this way, the object can hardly be detected by a monostatic UWB radar, namely a transmitting-receiving pair in the multistatic system. Thus, the object was detected using the multistatic UWB radar with the antenna array deployed the same as in the first measurement. Since frequency and displacement of the object’s motion can be precisely controlled, another two deployments of the antenna array were also tested: (1) as shown in Figure 6b, the receiving antennas Rx1 and Rx2 were placed at a distance of about 0.75 m, and the receiving antennas Rx3 and Rx4 about 1.5 m away from the transmitting one; (2) as shown in Figure 6c, the transmitting antenna was moved about 1.5 m away from its original position. In the two antenna deployments, the object’s motion was expectedly easier to be detected by adjusting the receiving or transmitting angle of the multistatic UWB radar.

3. Experimental Results

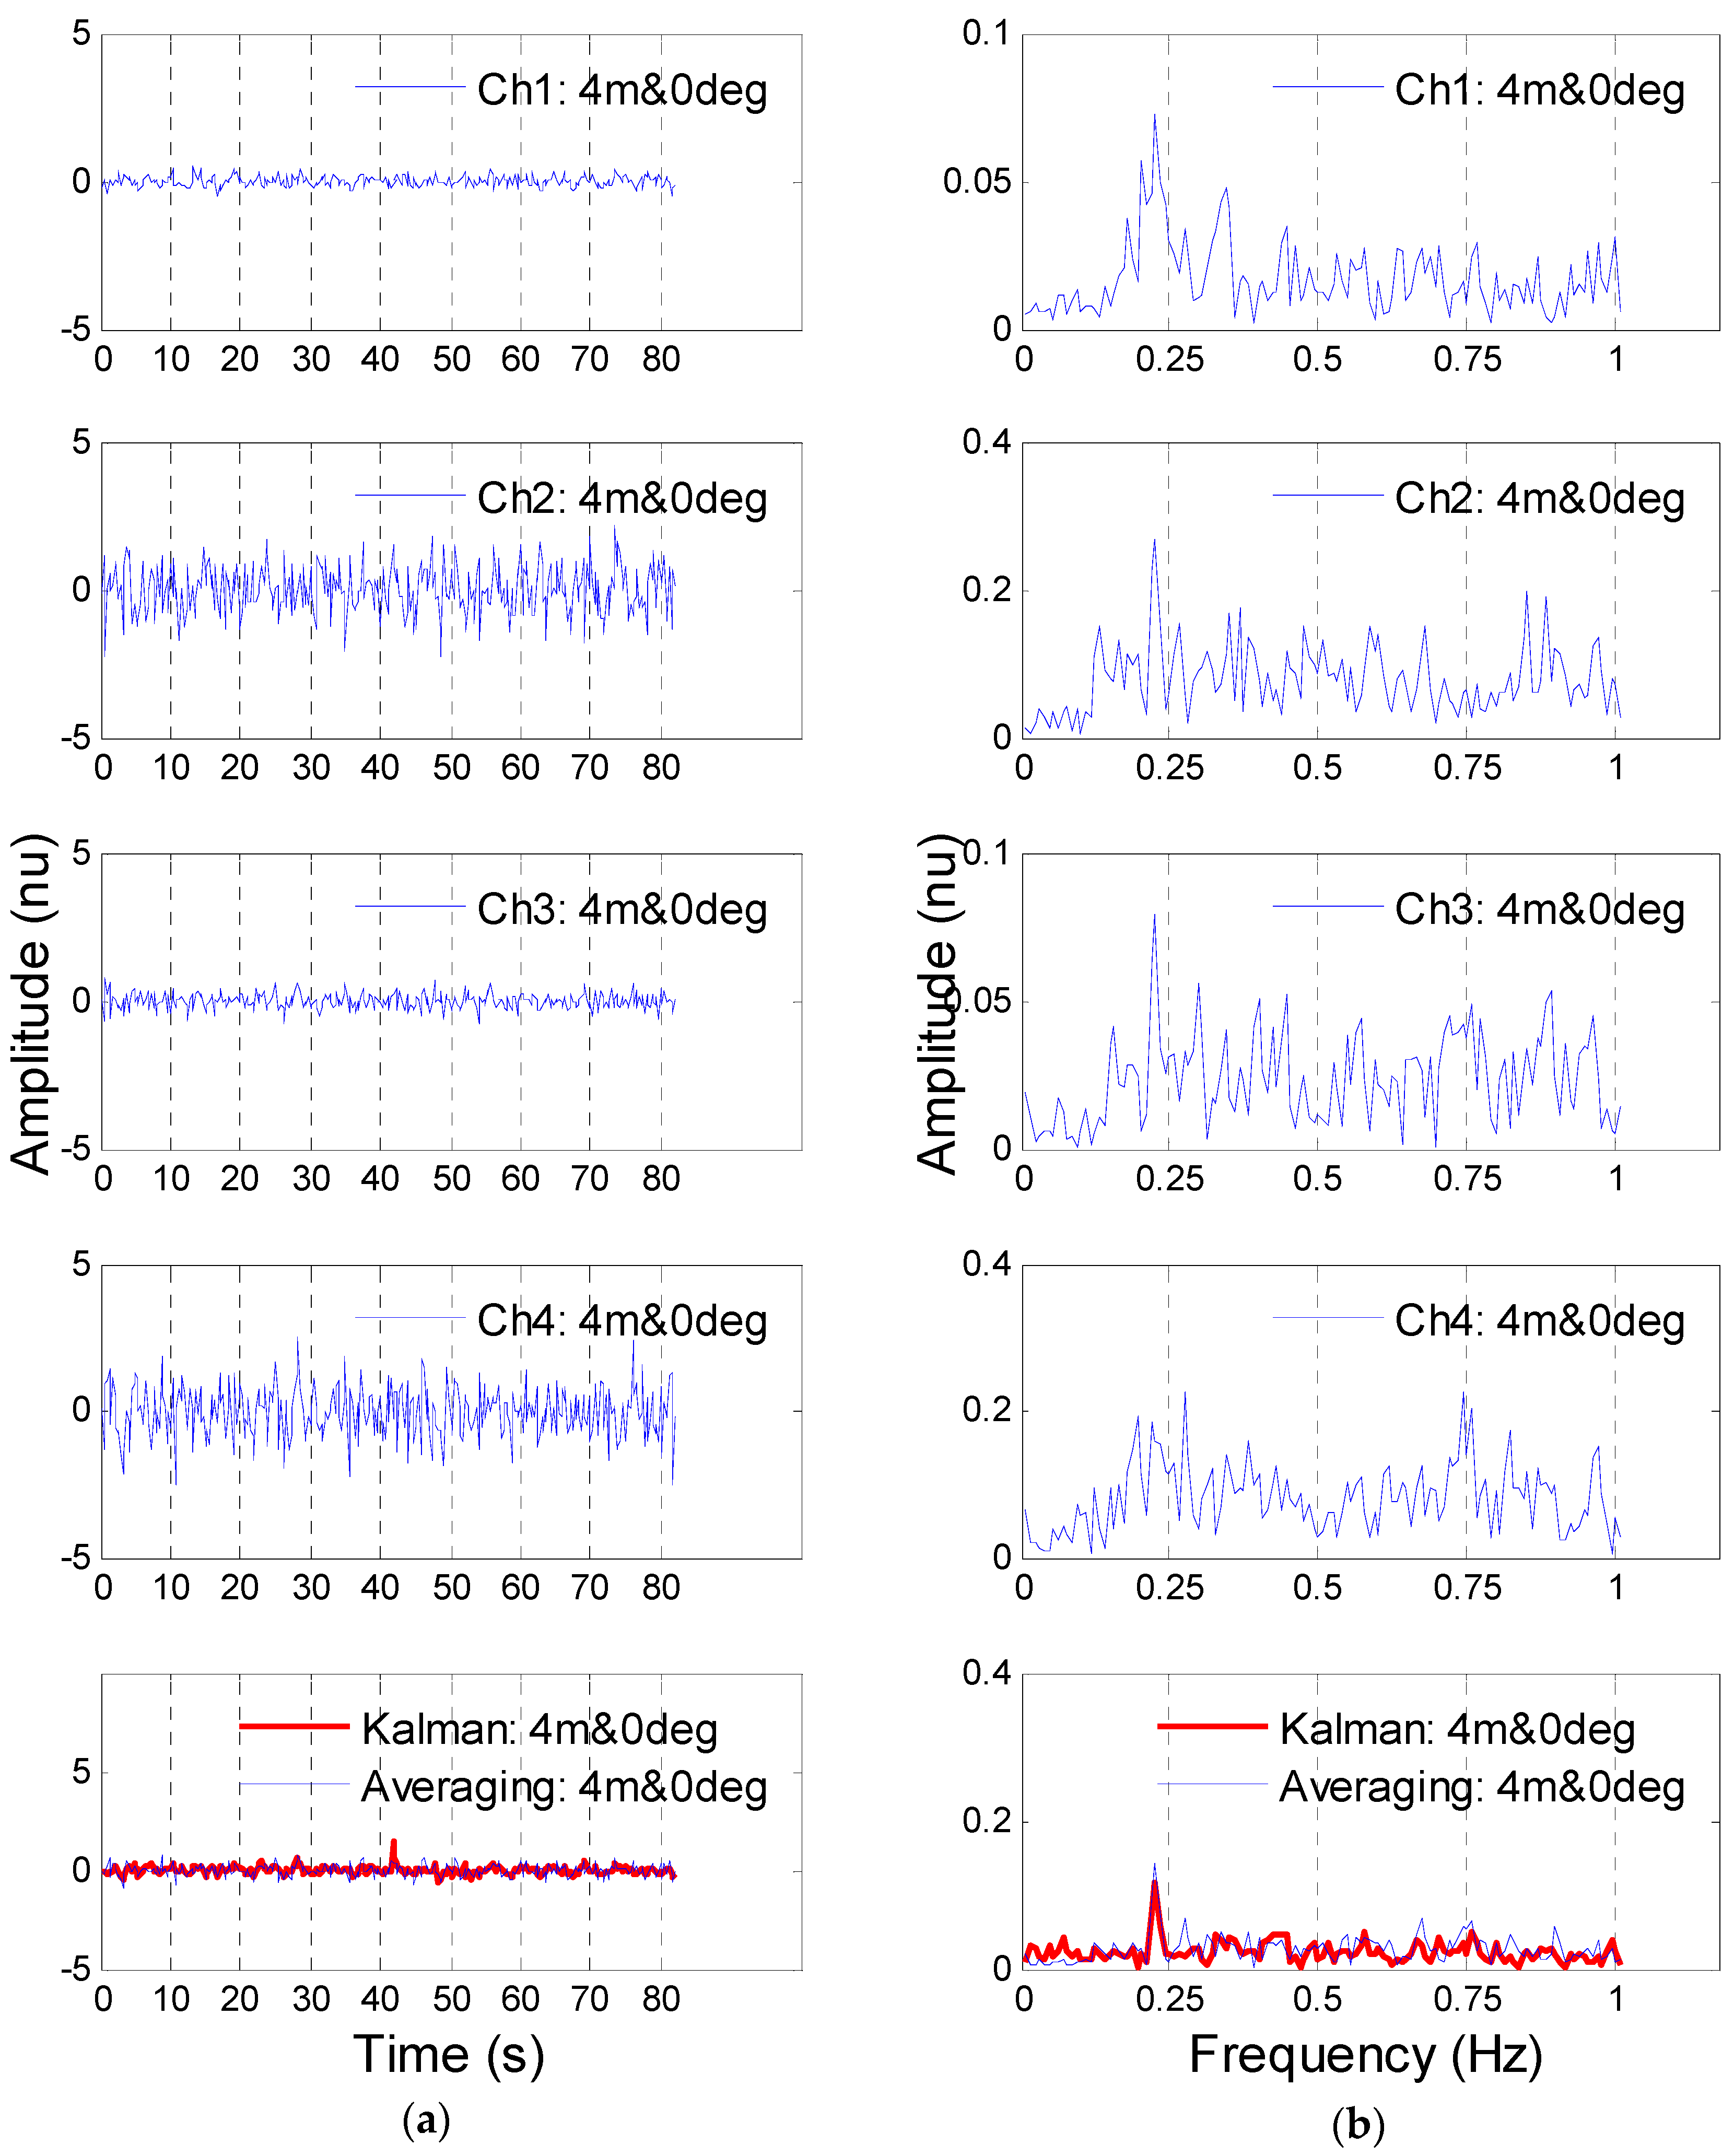
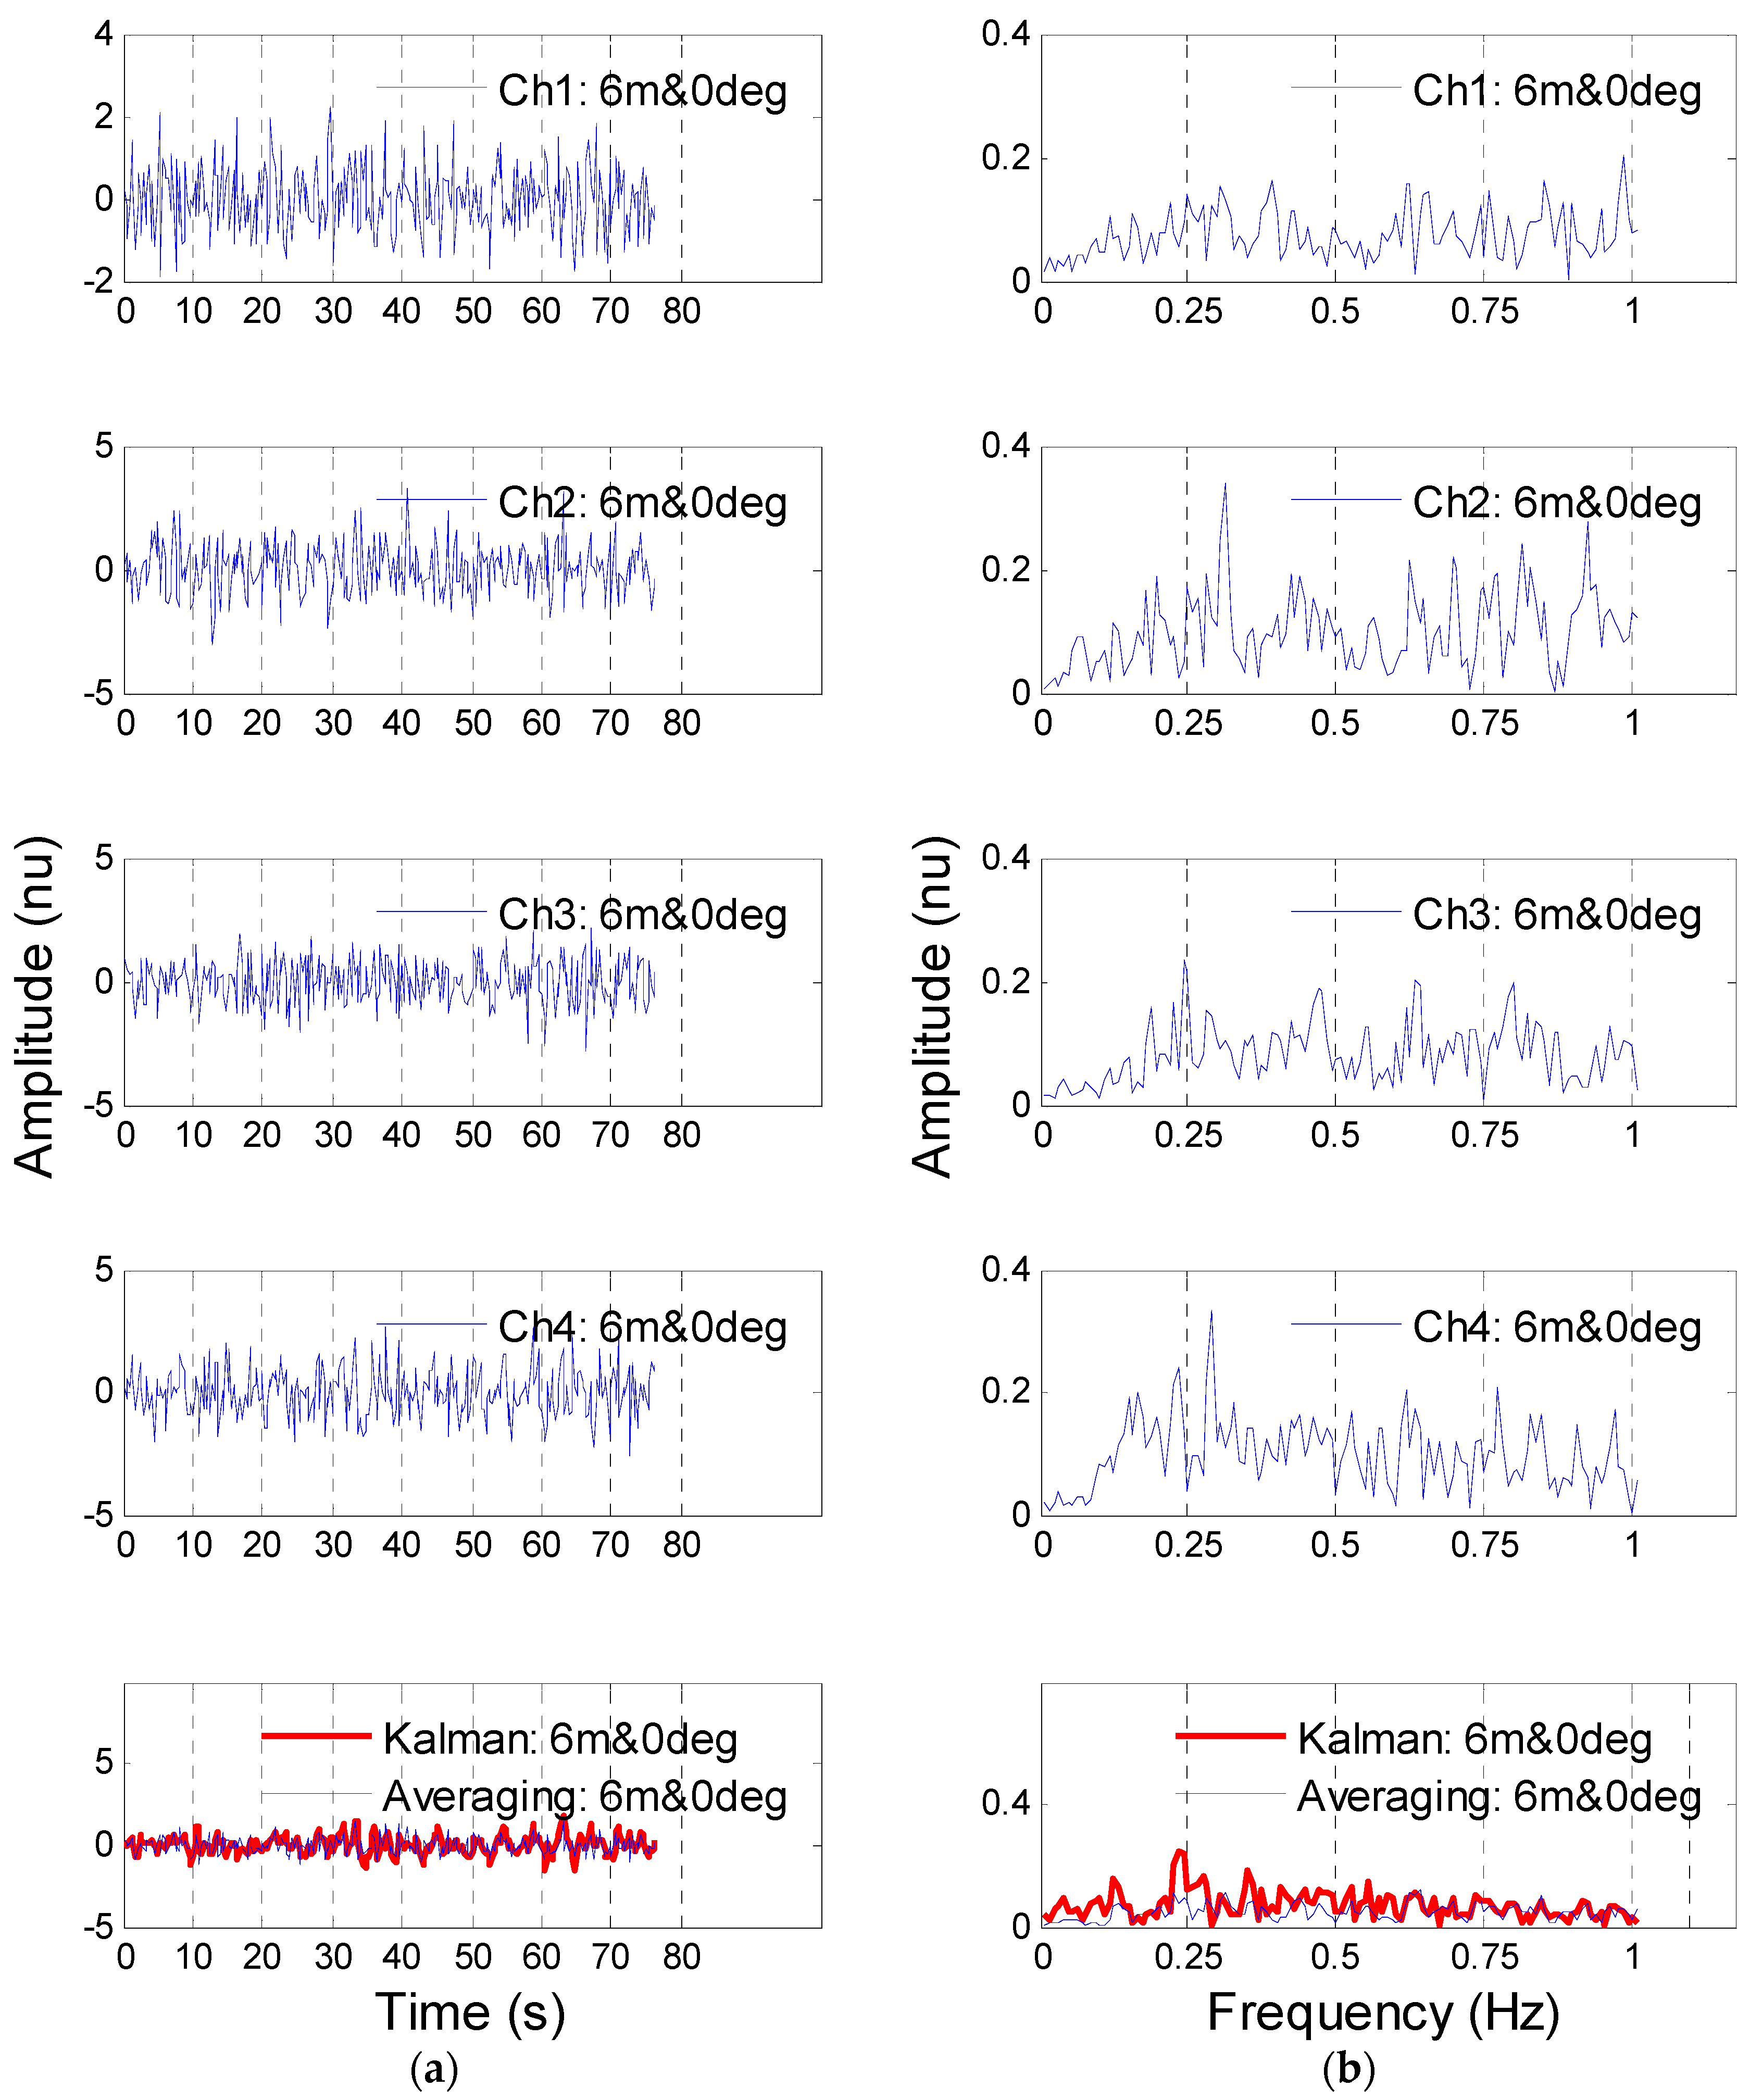
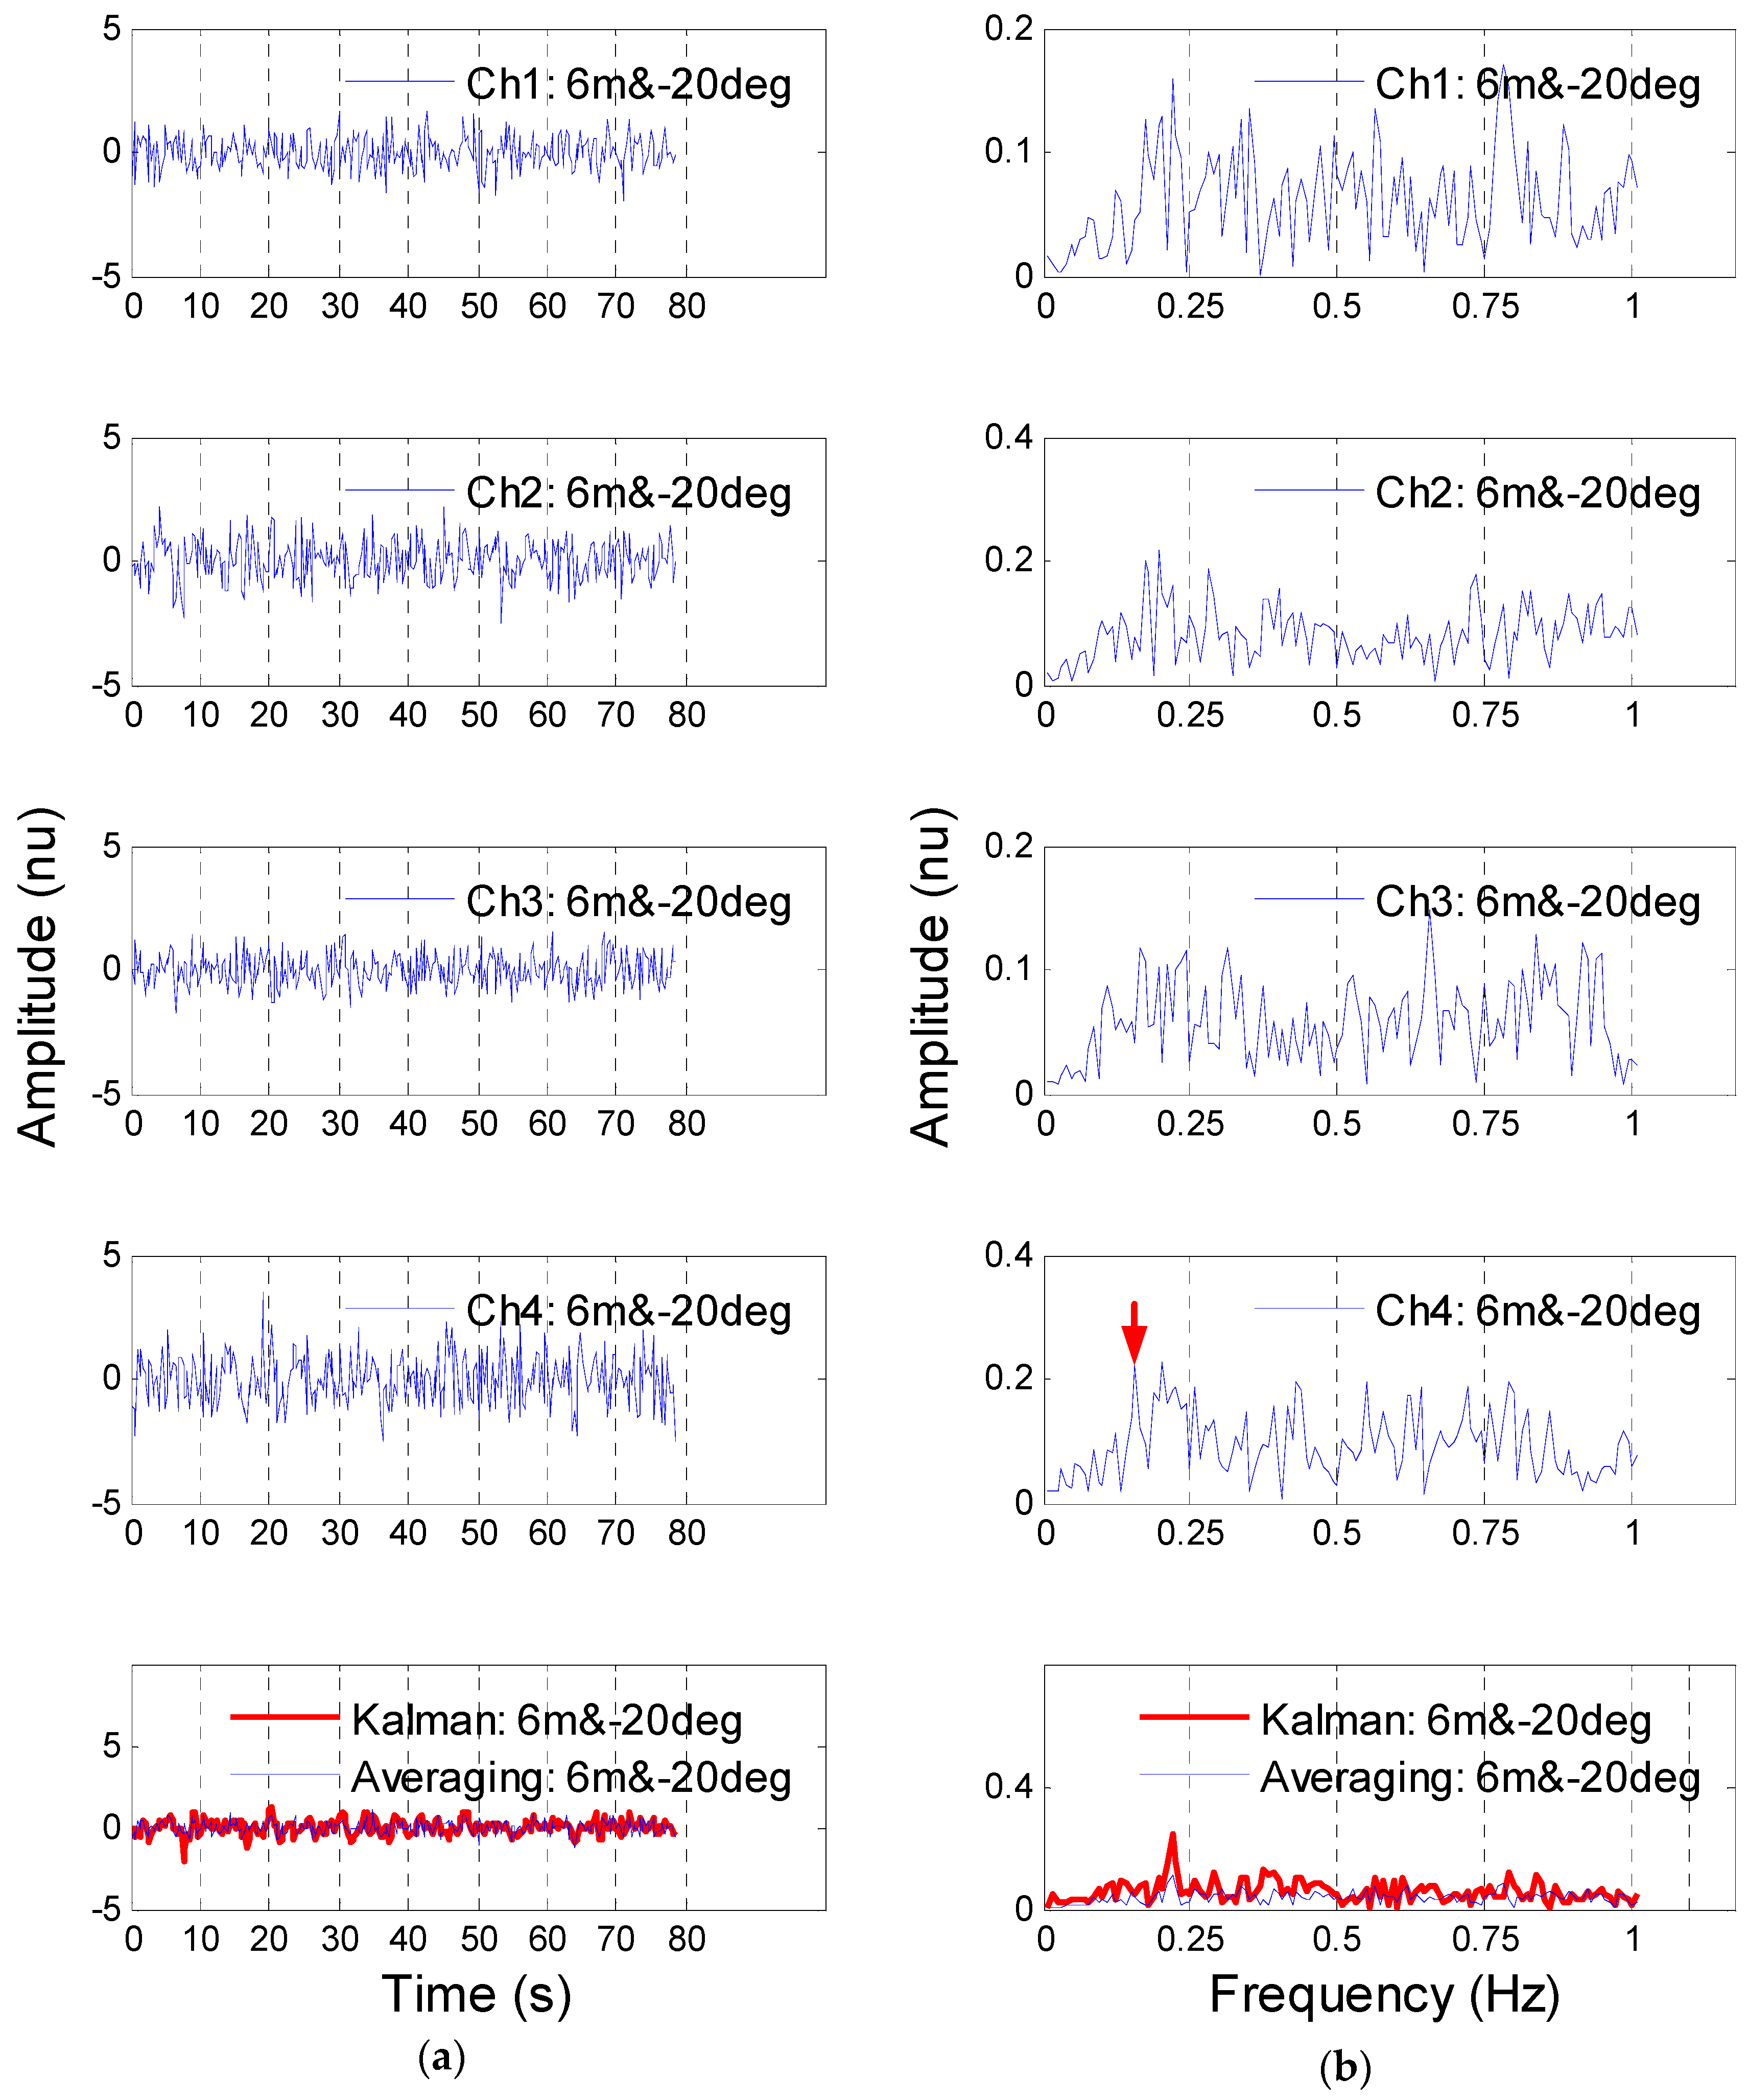
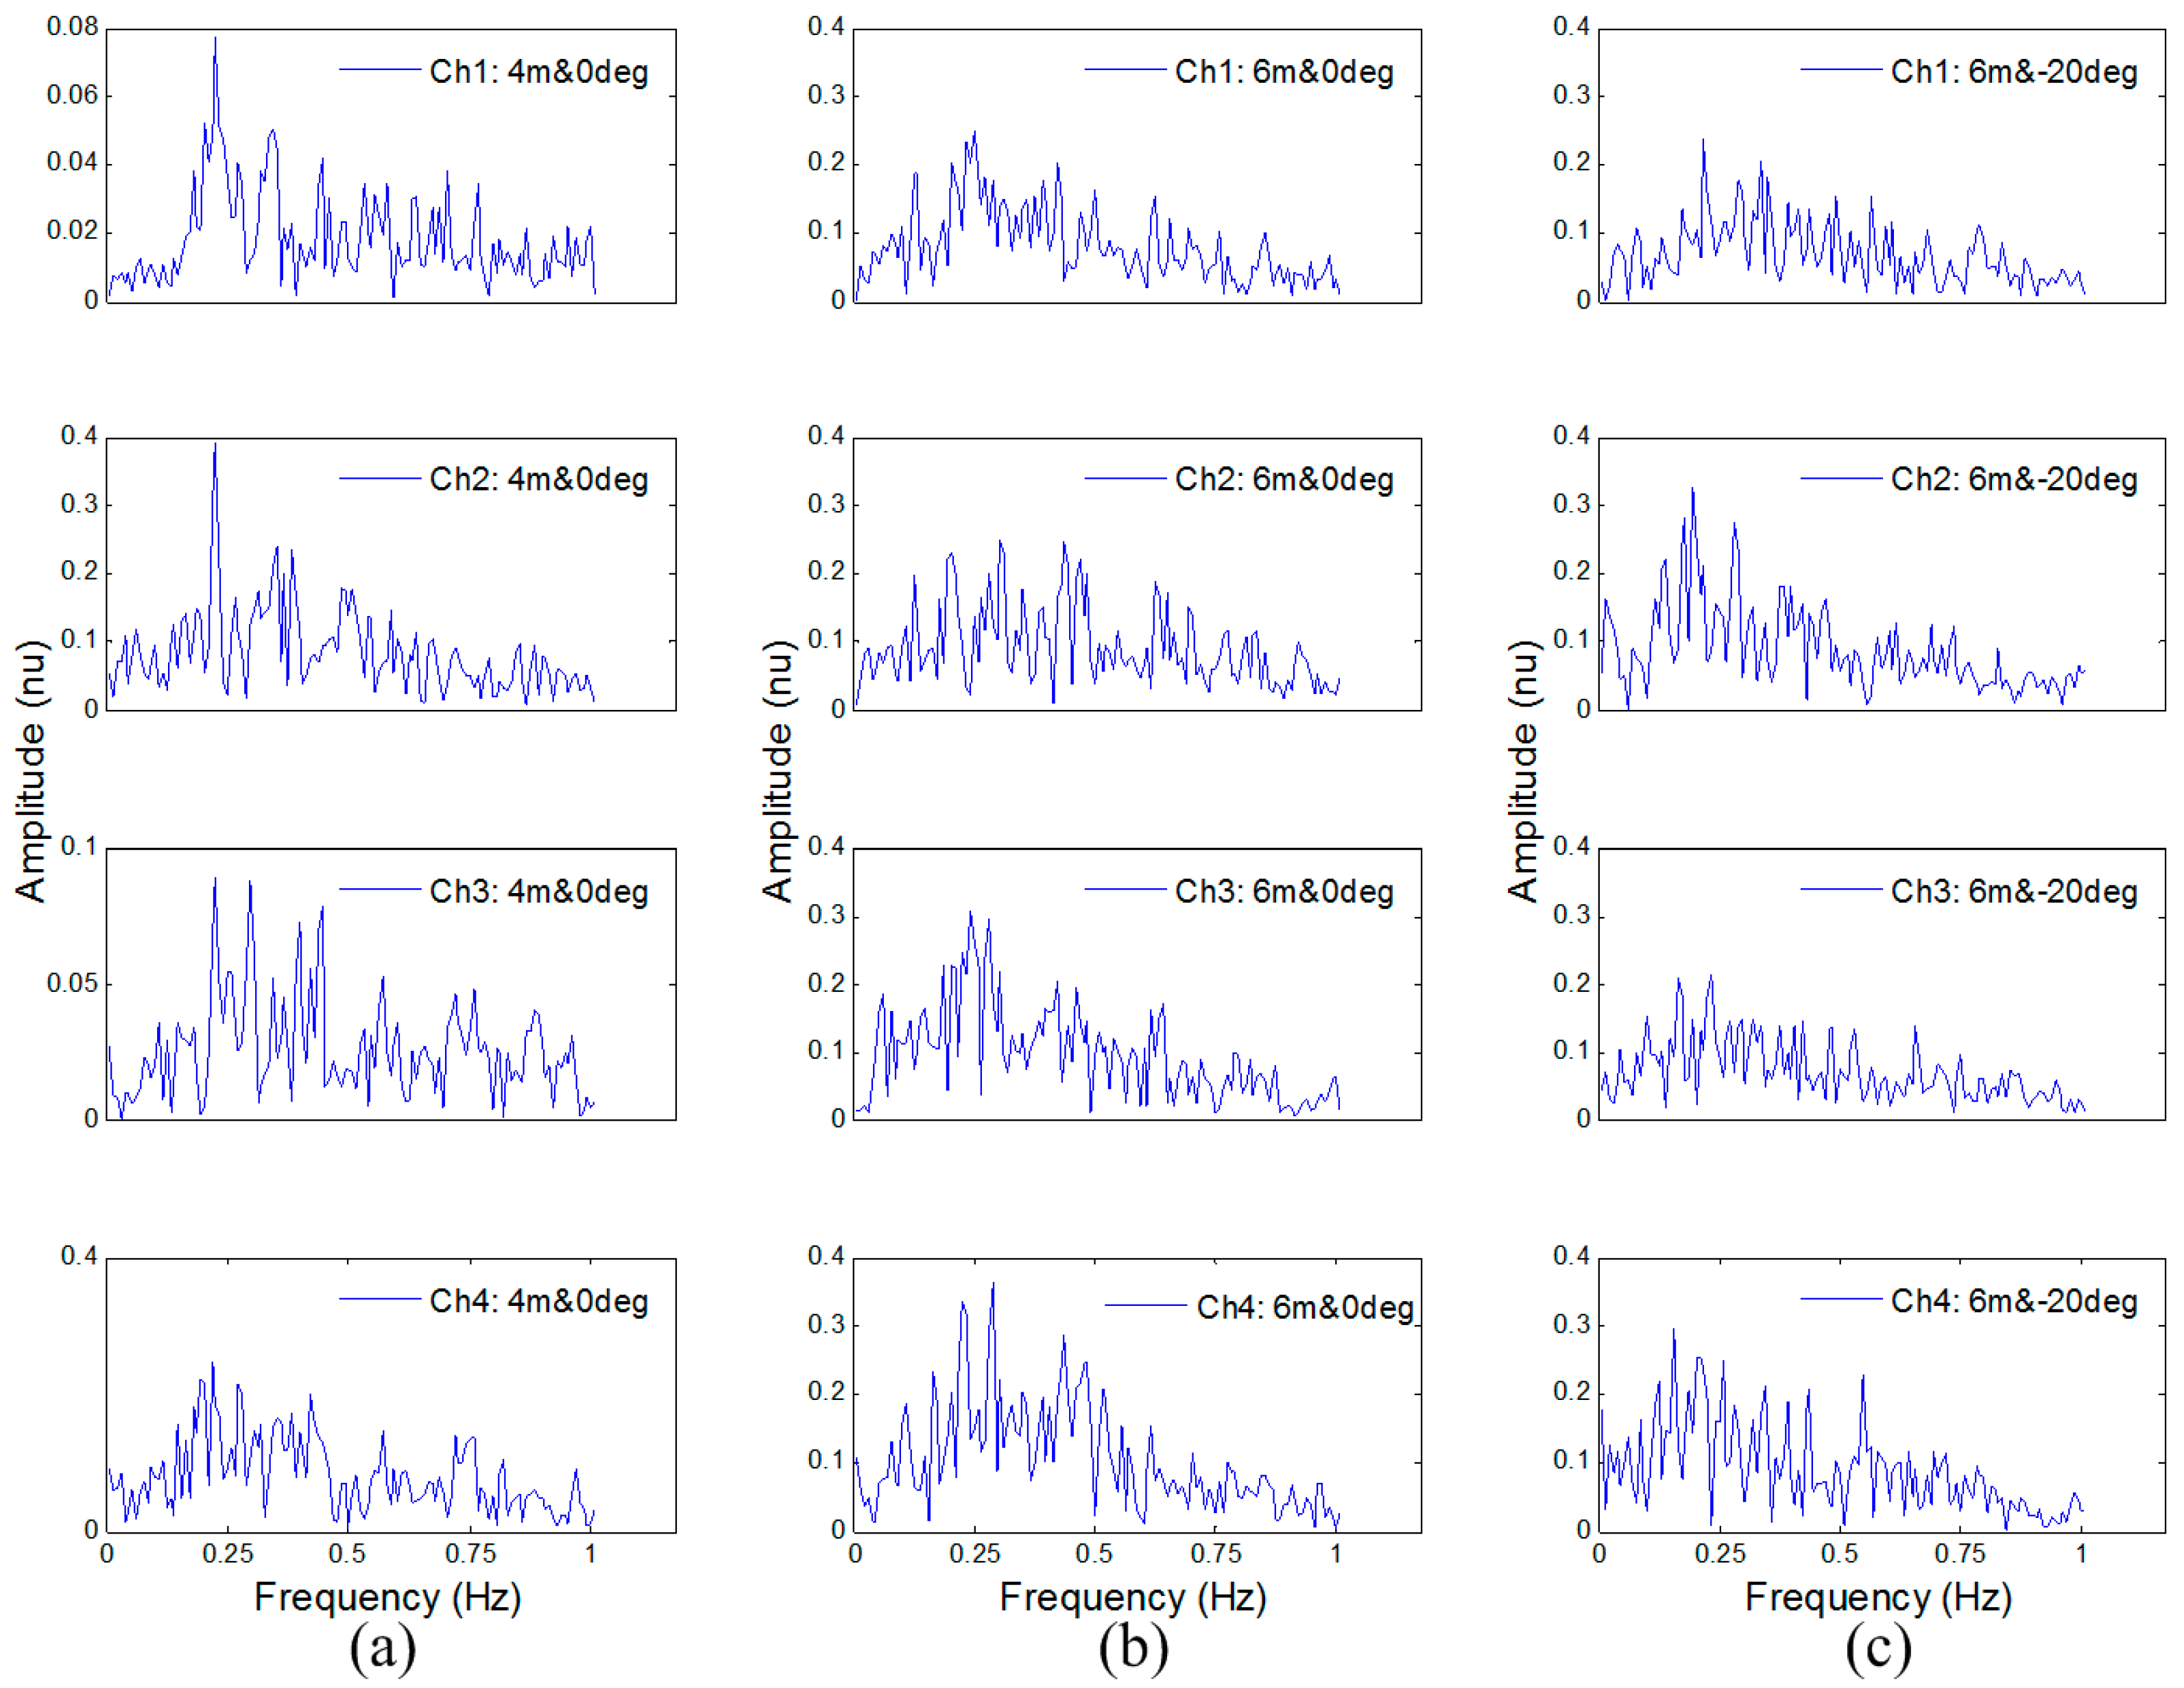
3.1. Detection Results of the Volunteer Target

The UWB echo data measured from the volunteer target are preprocessed and shown in Figure 7. The data corresponds to when the volunteer was positioned approximately (4 m, 0°) away from the transmitting antenna. In the figure, the preprocessed results are in grayscale color to present the amplitude of the data. As aforementioned, the data are 2D with range and time information. Thus, in the subfigures, the horizontalaxis denotes the time with the unit of second (s). After the preprocessing, the measuring speed of the data (in the horizontal direction) changes from 64 Hz to 4 Hz by down-sampling in time. This means that the sampling interval ∆t in Equation (5) is equal to 1/4 s, which still satisfies the Nyquist sampling theorem for respiration detection. The vertical axis denotes the range that corresponds to the time window of the radar. It should be noted that start point of the time window and the dielectric constant of the brick wall was not calibrated. Thus, the range takes the propagation time of the electromagnetic waves as the unit, i.e., nanosecond (ns). It is clear that only irregular clutters and noises can be observed in the subfigures since the respiratory-motion response contained in all data channels are too weak to be detected. Thus, the target association was manually realized according to the priori range information of the target. As indicated by the blue broken line in the figure, four time records of waveforms at the target’s ranges (29.4 ns in channels 1 and 2, and 28.8 ns in channels 3 and 4) were picked up for the data fusion.
Figure 8 presents the four time records of waveforms picked up from the data in Figure 7, and the detected respiration after the data fusion. The left column of Figure 8 presents the time-domain waveforms and the right column presents their power spectrum that was obtained by performing discrete fast Fourier transform (FFT) on the waveforms. The sign “nu” in the figure represents non-unit. The significant peaks due to the respiration can be observed from the power spectrum except for that which corresponds to channel 4 (subfigures denoted as Ch3: 4 m & 0 deg) in the figure. The detected respiration frequency is approximately 0.23 Hz. During the measurement, referring to the experiment setup, the volunteer breathed 18 times in about 85.1 s duration. It meant that his respiration frequency was approximately 0.21 Hz, which was essentially in agreement with the detected result. Thus, the volunteer’s respiration was correctly detected by some single channels (channels 1, 2 and 3) of the multistatic UWB radar, as well as the data fusion of multiple channels. It should be noted that the detected respiration by the latter appears to have a higher SNCR than those by the former. In the data fusion results (subfigures denoted as Kalman: 4 m & 0 deg, Averaging: 4 m & 0 deg), the Kalman method does not significantly outperform the simple averaging method. The latter was realized by averaging all the waveforms in time and then calculating the power spectrum of the averaging result. Figure 9 presents the time-domain waveforms (a) and their power spectrum (b) corresponding to the data when the volunteer was detected at the position (6 m, 0°). From top to bottom in the figure, the rows are, respectively, waveforms of channel 1, 2, 3, 4, and the data fusion result. In the lower right subfigure (denoted as Kalman: 6 m & 0 deg), a frequency peak appeared at 0.23 Hz by the Kalman data fusion method. This complies with the respiration frequency actually counted during the measurement. By the fusion method based on the waveform averaging, the respiration was not correctly detected (subfigures denoted as Averaging: 6 m & 0 deg). Additionally, the correct frequency peak corresponding to respiration can hardly be observed from any channel of the radar in the subfigures in the right column (denoted as Ch1: 6 m & 0 deg, Ch2: 6 m & 0 deg, Ch3: 6 m & 0 deg, Ch4: 6 m & 0 deg). This is due to the fact that the data in Figure 9 were measured when the volunteer was positioned further than that in Figure 8, which led to a decrease of the UWB echo’s SNCR. Figure 10 presents the results corresponding to the data when the volunteer was detected at the position (6 m, −20°). Compared with the position (6 m, 0°), the volunteer’s respiration was expectedly more difficult to be detected. However, as shown in the lower right subfigure (denoted as Kalman: 6 m & −20 deg), the respiration was detected by the Kalman filtering method. The detected respiration frequency is approximately 0.21 Hz. It should be noted that, although the correct frequency appeared in two subfigures in the right column of the figure (denoted Ch4: 6 m & −20 deg, Averaging: 6 m & −20 deg), the SNCR for these subfigures was too low to be determine the presence of respiration in practice (see the background noise peak around 0.1 Hz in Channel 4, denoted by the red arrow). As shown in Figure 10, the detected respiration based on the Kalman filtering (denoted as Kalman: 6 m & −20 deg) appears to have a much higher SNCR than that based on the simple averaging. It also presents better quality than the detected respiration based on the Kalman filtering in Figure 9 (subfigures denoted as Kalman: 6 m & 0 deg). This might be caused by the breathing variation even using the same volunteer as the detection target in the two measurements. This is the reason why the artificial breathing object was used to investigate the radar’s performance with different antenna deployments.
To investigate the performance of the radar, the respiration detection algorithm in [6] and a single-channel Kalman filtering were used as reference to process the above data. The former algorithm adds an adaptive line enhancer (ALE) and a low pass filter (LPF) to the waveforms in Figure 8, Figure 9, and Figure 10. The ALE utilized the narrowband and periodic characteristics of respiration and performed adaptive filtering on the waveforms to enhance the respiration. Then, the LPF with a cutoff frequency of 0.5 Hz was used to further enhance the ALE output. For the latter reference algorithm, the waveforms in the figures were processed by the adaptive Kalman filter independently, where the measurement vector is { z k i } , i = 1 ,   2 ,   3 ,   4 and the measurement matrix H k becomes [ 1   0 ] . The results corresponding to the former algorithm are presented in Figure 11. Since the respiratory characteristic in time domain is not significant in the above figures, only the power spectrum is presented in the figure. By the algorithm, the volunteer’s respiration was correctly detected from some channels (subfigures denoted as Ch1: 4 m & 0 deg, Ch2: 4 m & 0 deg, Ch3: 4 m & 0 deg) only when he was positioned at (4 m, 0°). However, the detected respiration from these channels appears to have a much lower SNCR than that detected by the Kalman filtering (subfigures denoted as Kalman: 4 m, 0° in Figure 8). The results of the single-channel Kalman filtering were shown in Figure 12. As shown in the figure, only when the volunteer was at (4 m, 0°), his respiration was correctly detected from each single channel. For the waveforms when the volunteer was at (6 m, 0°) and (6 m, −20°), the respiration can hardly be detected even by the adaptive Kalman filtering in those single channels.
Moreover, the Kalman filtering performance was evaluated with different channel combinations. To evaluate the performance of data fusion using these channel combinations, a band relative intensity ratio (BRIR) was defined as:
BRIR = i = i max 1 i = i max + 1 | P [ i ] | / i = 1 i = N FFT / 2 + 1 | P [ i ] | 100 %
where | P [ i ] | denotes the power spectrum obtained using discrete FFT. i max denotes the peak index in the power spectrum; N FFT denotes the point number of the discrete FFT. Taking the data measured at (4 m, 0°), for example, i max = 29 and N FFT = 512 . Since i max corresponds to the frequency peak that was caused by respiration, the BRIR could roughly quantify the SNCR for the detected respiration. The band is expanded by i max 1 and i max + 1 , considering the resolution limit of the discrete FFT. According to the definition, BRIR for data fusion results with different channel combination were calculated and listed in Table 2, Table 3 and Table 4. As listed in Table 2, namely for the data measured at (4 m, 0°), the maximum value of BRIR achieves 5.76% when channels 1, 3, and 4 were fused together. In the case of the result fused from all the channels, the BRIR is 4.51%. For the two cases, the power spectrum of the detected respiration is shown in Figure 13. The band expansion in the BRIR is denoted by the rectangular shadow in the figure. It is clear that the detected respiration fused from channels 1, 3 and 4 (the blue line) appears to have a greater SNCR than that fused from all of the channels (the red line). Thus, the former has a higher BRIR. In table 3, the BRIR is 2.61% when the four channels were fused together. This is much lower than the maximum value, which achieves 6.63% in the case of fusing channels 1 and 4. Additionally, in Table 4, the BRIR achieves a maximum, namely 5.83%when channels 2, 3, and 4 were fused together, rather than in the case of fusing all of the channels. This means that the fusion result in the latter case was not optimal for the three sets of data.

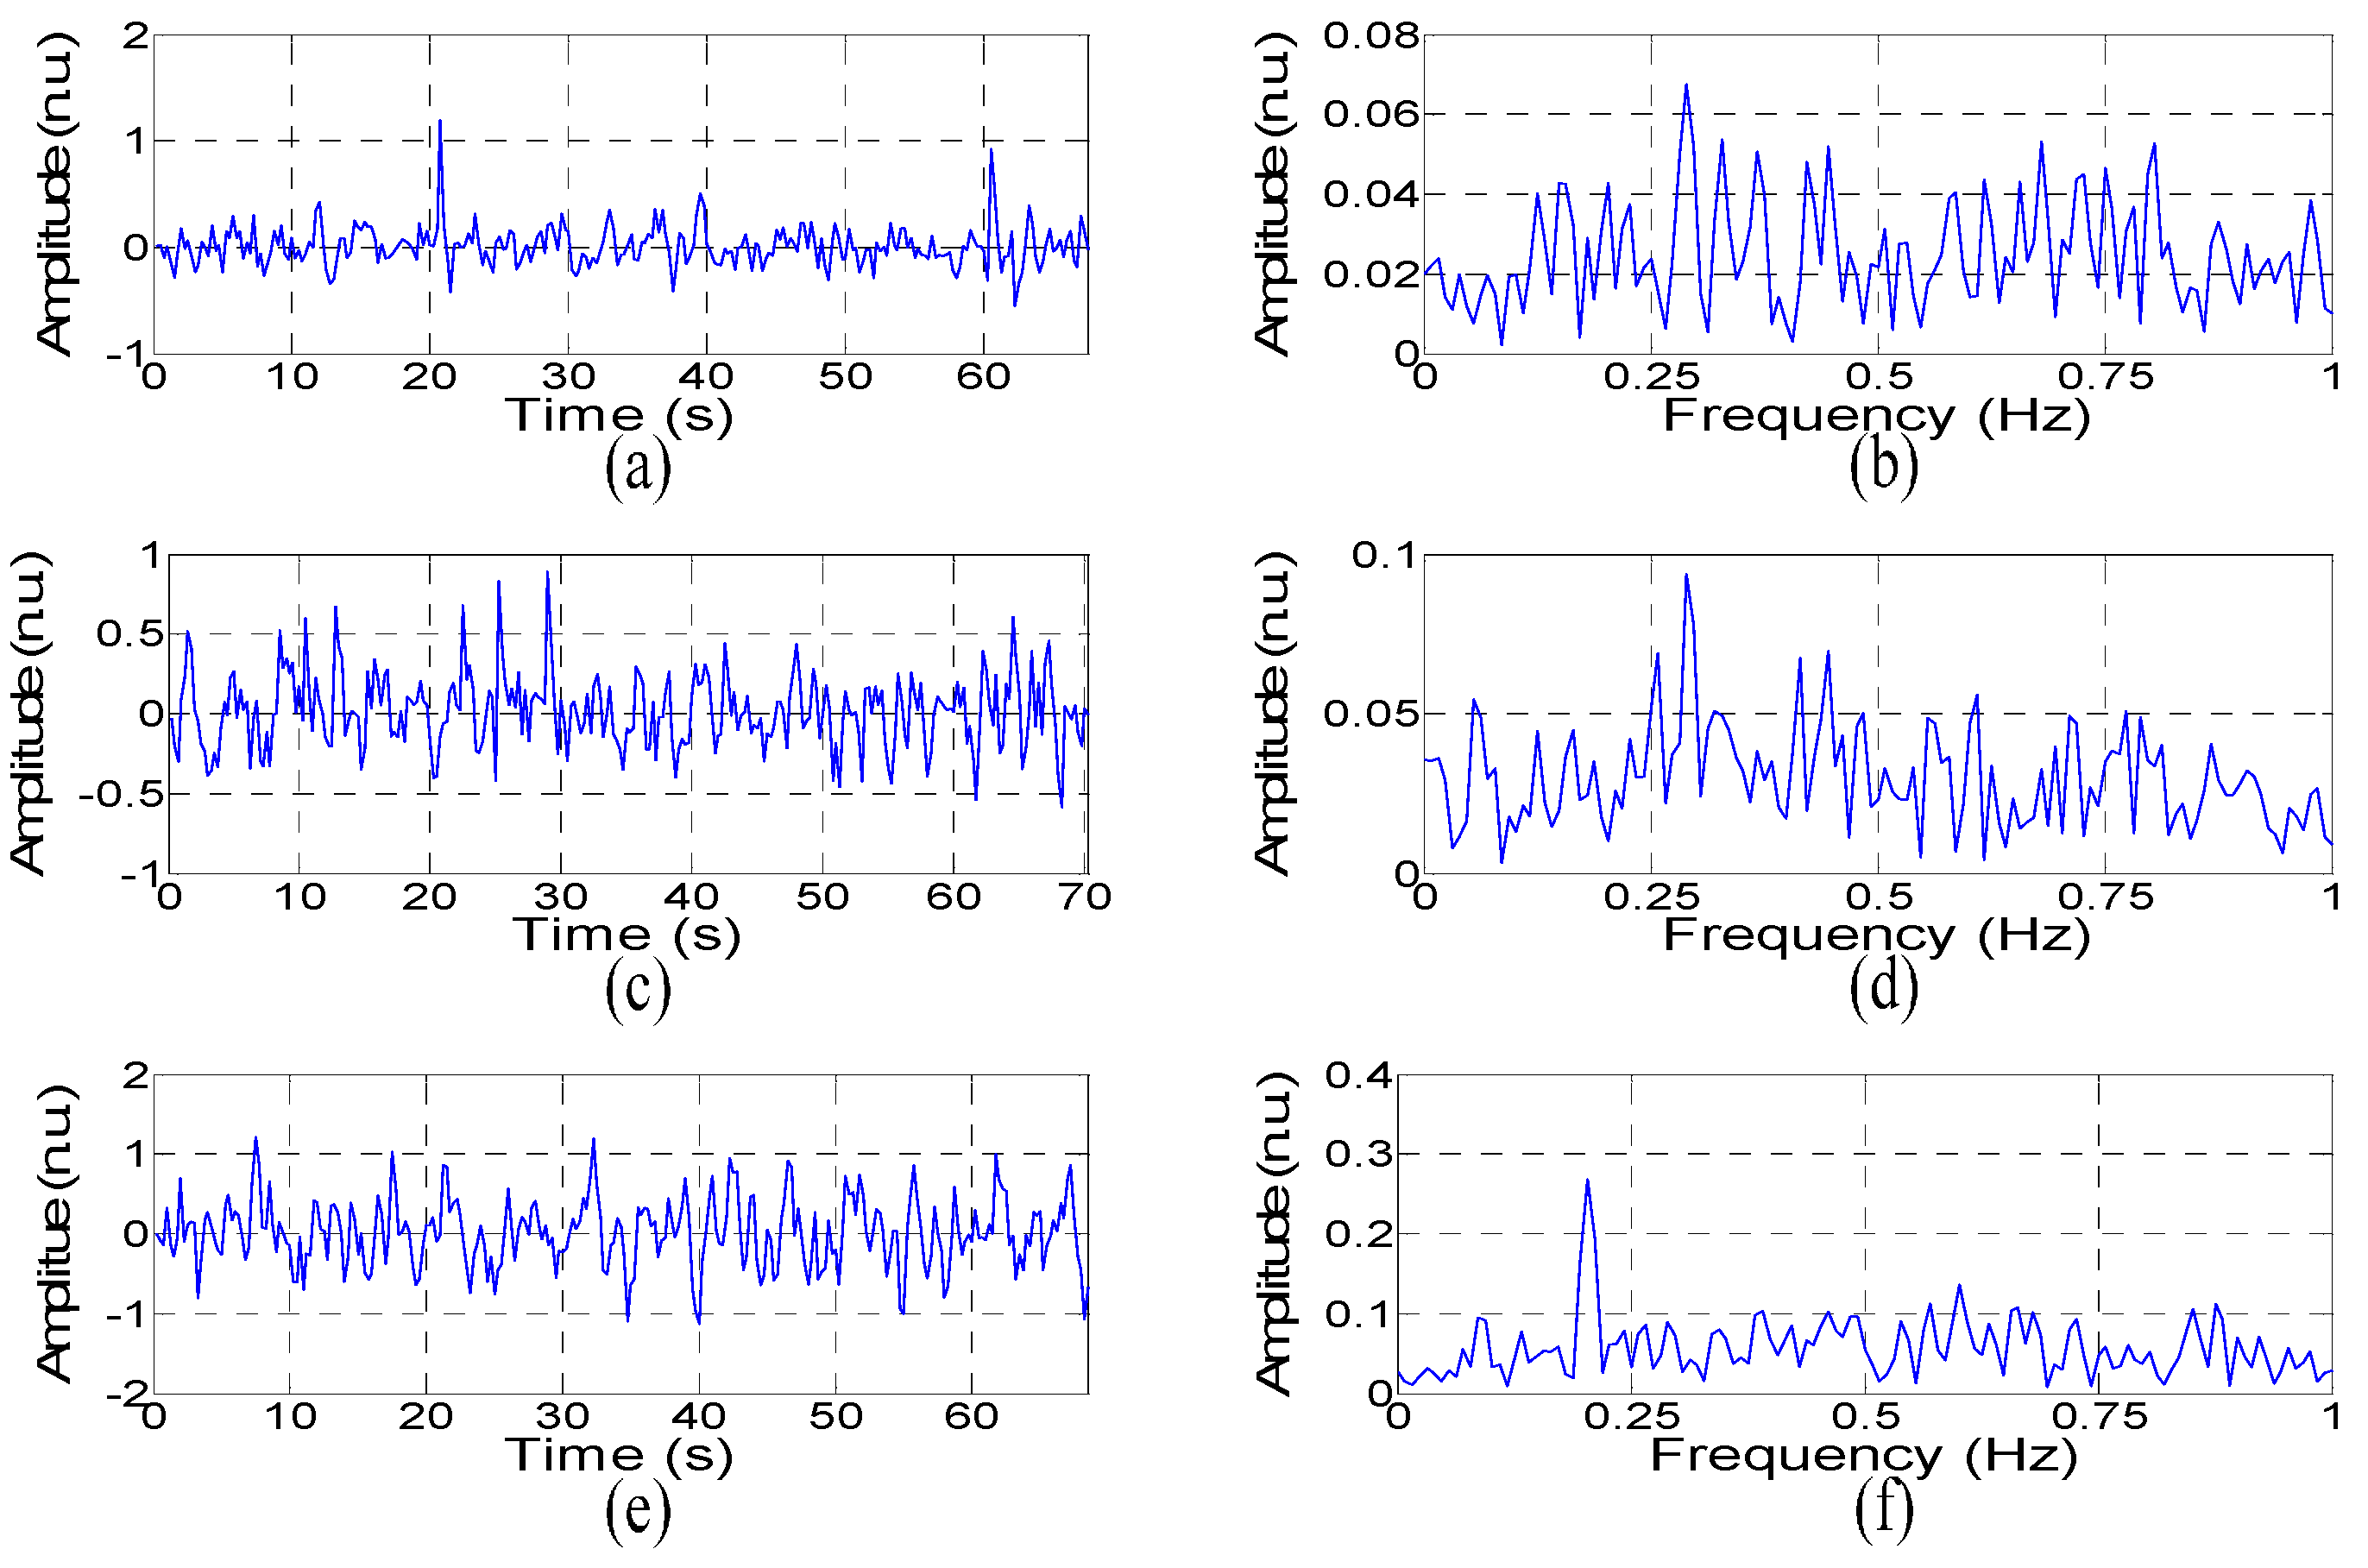
3.2. Detection Results of the Artificial Object

Detected results of the artificial breathing object are shown in Figure 14. The rows from top to bottom correspond to the results detected by those antenna deploys described in Section 2.3. In this extreme case, namely the reflector’s moving orientation perpendicular to the radar’s radial direction, only subfigures e and f present the motion’s characteristics correctly. The detected respiration rate is 0.2 Hz, which accords with the frequency setting of the artificial object. The subfigures corresponds to the antenna deploy that the transmitting antenna was moved away from the receiving ones. With this deployment, the radar’s illumination angle was changed by adjusting the transmitting antenna from its original position. Thus, the effective component of the object’s motion, as well as the cross-section of the object, might increase to benefit for the detection.

4. Discussion

In the experiment, the volunteer’s respiration was detected by the multistatic UWB radar when he curled behind a brick wall at three positions. When he was poisoned at (4 m, 0°), his respiration was correctly detected by the Kalman fusion method. Based on the same experimental data, the volunteer’s respiration detected from the radar’s single transmitting-receiving channel appeared lower SNCR, even using the ALE and single-channel Kalman filtering algorithms. Then the volunteer was positioned further from the radar, namely at (6 m, 0°), which led to a weaker respiratory component in the UWB echo data. In this case, the Kalman fusion method outperformed any single channel significantly since the latter failed to detect the respiration correctly. When the volunteer was more further positioned at (6 m, −20°), the respiration detected by the Kalman fusion still appeared better quality. This is due to the fact that the multisensory information is provided by the multistatic UWB radar about the volunteer’s respiration. By fusing the information, the radar’s performance was improved compared with the radar’s single transmitting-receiving channel. Additionally, based on the priori CV model to describe the respiratory process, the Kalman-based fusion performed better than the averaging-based fusion. In the experiment, the method was also investigated with different antenna deployments using the artificial breathing object that moved perpendicularly to the radar’s radial direction. The experimental results show that the object’s motion can also be correctly detected in this extreme case when the transmitting antenna of the radar was deployed away from the receiving antennas. This implies that the multistatic UWB radar’s performance can be further improved by adding transmitting antennas with different illumination angles. In this way, information from more data channels will be fused together. According to the data fusion results with different channel combinations, it might produce suboptimal detection result based on the fusion scheme in this paper. So, how to optimally combine the data channels, namely choosing representative observations under blind conditions, will become a key issue for data fusion [20]. Moreover, future work will be performed on detection of multiple human targets using the multistatic UWB radar. Under the scenario, the difficulty of target association will be greatly increased. The Kalman filtering based on the linear CV model might no longer be applicable, too. Thus, non-linear particle filtering might be used to cope with the issue [19].

5. Conclusions

This paper presented a method to deal with the UWB-radar-based human respiration detection problem caused by the human targets’ body orientation. The method used a multistatic UWB radar to provide multisensory information about the thorax motion due to respiration, and an adaptive Kalman filter to fuse those information together. The radar was based on impulse radios and had an antenna array comprising of one transmitting and four receiving antennas. The Kalman filter used the CV model to describe the breathing process of human targets, and the adaptive-fading-factor approach to identify the process noises of the model. The method’s feasibility was investigated experimentally, in which respiration of a volunteer that curled behind a brick wall and that of an artificial breathing object was correctly detected. Thus, the method can improve the performance of UWB radar in applications like through-wall surveillance and post-earthquake search and rescue.

Acknowledgments

This work was supported by National Natural Science Foundation of China (Grant No. 61327805) and Shaanxi Technology Committee (Grant No. 2016KJXX-03).

Author Contributions

The authors acknowledge the participants for helping with data acquisition. Thanks are given to Fugui Qi, Yang Zhang, Teng Jiao, Fulai Liang, Zhao Li, Jianqi Wang for the their contributions.

Conflicts of Interest

The authors declare no conflict of interest.

References

  1. Immoreev, I.; Samkov, S.; Tao, T.H. Short-distance ultra-wideband radars. IEEE Aerosp. Electron. Syst. Mag. 2005, 6, 9–14. [Google Scholar] [CrossRef]
  2. Yarovoy, A.; Ligthart, L.P.; Matuzas, J.; Levitas, B. UWB radar for human being detection. IEEE Aerosp. Electron. Syst. Mag. 2006, 21, 10–14. [Google Scholar] [CrossRef]
  3. Sachs, J.; Helbig, M.; Herrmann, R.; Kmec, M.; Schilling, K.; Zaikov, E. Remote vital sign detection for rescue, security, and medical care by ultra-wideband pseudo-noise radar. Ad. Hoc. Netw. 2014, 13, 42–53. [Google Scholar] [CrossRef]
  4. Baldi, M.; Cerri, G.; Chiaraluce, F.; Eusebi, L.; Russo, P. Non-invasive UWB sensing of astronauts’ breathing activity. Sensors 2014, 15, 565–591. [Google Scholar] [CrossRef] [PubMed]
  5. Nezirovic, A.; Yarovoy, A.G.; Ligthart, L.P. Signal processing for improved detection of trapped victims using UWB radar. IEEE Trans. Geosci. Remote Sens. 2010, 48, 2005–2014. [Google Scholar] [CrossRef]
  6. Lv, H.; Li, W.; Li, Z.; Zhang, Y.; Jiao, T.; Xue, H.; Liu, M.; Jing, X.; Wang, J. Characterization and Identification of IR-UWB Respiratory-Motion Response of Trapped Victims. IEEE Trans. Geosci. Remote Sens. 2014, 52, 7195–7204. [Google Scholar] [CrossRef]
  7. Nezirovic, A.; Tesfay, S.; Valavan, A.S.E.; Yarovoy, A. Experimental study on human breathing cross section using UWB impulse radar. In Proceedings of Radar Conference, Amsterdam, The Netherlands, 30–31 October 2008.
  8. Nijsure, Y.; Tay, W.P.; Gunawan, E.; Wen, F.; Yang, Z.; Guan, Y.L.; Chua, A.P. An impulse radio ultrawideband system for contactless noninvasive respiratory monitoring. IEEE Trans. Geosci. Remote Sens. 2013, 60, 1509–1517. [Google Scholar] [CrossRef] [PubMed]
  9. Lazaro, A.; Girbau, D.; Villarino, R. Techniques for clutter suppression in the presence of body movements during the detection of respiratory activity through UWB radars. Sensors 2014, 14, 2595–2618. [Google Scholar] [CrossRef] [PubMed]
  10. Liu, L.; Liu, S. Remote detection of human vital sign with stepped-frequency continuous wave radar. IEEE J. Sel. Top. Appl. Earth Obs. Remote Sens. 2014, 7, 775–782. [Google Scholar] [CrossRef]
  11. Lv, H.; Liu, M.; Jiao, T.; Zhang, Y.; Yu, X.; Li, S.; Jing, X.; Wang, J. Multi-target human sensing via UWB bio-radar based on multiple antennas. IEEE 2013. [Google Scholar] [CrossRef]
  12. Wu, S.; Yao, S.; Liu, W.; Tan, K.; Xia, Z.; Meng, S.; Chen, J.; Fang, G.; Yin, H. Study on a novel UWB Linear array human respiration model and detection method. IEEE J. Sel. Top. Appl. Earth Obs. Remote Sens. 2016, 9, 125–140. [Google Scholar] [CrossRef]
  13. Thiel, M.; Sarabandi, K. Ultra wideband multi-static scattering analysis of human movement within buildings for the purpose of stand-off detection and localization. IEEE Trans. Antennas Propag. 2011, 59, 1261–1268. [Google Scholar] [CrossRef]
  14. Salmi, J.; Molisch, A.F. Propagation parameter estimation, modeling and measurements for ultrawideband MIMO radar. IEEE Trans. Antennas Propag. 2011, 59, 4257–4267. [Google Scholar] [CrossRef]
  15. Kocur, D.; Švecová, M.; Rovňáková, J. Through-the-wall localization of a moving target by two independent ultra wideband (UWB) radar systems. Sensors 2013, 13, 11969–11997. [Google Scholar] [CrossRef] [PubMed]
  16. He, Y.; Aubry, P.; Le Chevalier, F.; Yarovoy, A. Decentralised tracking for human target in multistatic ultra-wideband radar. IET Radar Sonar Navig. 2014, 8, 1215–1223. [Google Scholar] [CrossRef]
  17. Nguyen, V.H.; Pyun, J.Y. Location detection and tracking of moving targets by a 2D IR-UWB radar system. Sensors 2015, 15, 6740–6762. [Google Scholar] [CrossRef] [PubMed]
  18. Li, C.; Xiao, Y.; Lin, J. Experiment and spectral analysis of a low-power-band heartbeat detector measuring from four sides of a human body. IEEE Trans. Microw. Theory Tech. 2006, 54, 4464–4471. [Google Scholar] [CrossRef]
  19. Chiani, B.; Paolini, E.; Giorgetti, A.; Mazzotti, M.; Chiani, M. Target Tracking for UWB Multistatic Radar Sensor Networks. IEEE J. Sel. Top. Signal Process. 2014, 8, 125–136. [Google Scholar]
  20. Conti, S.; Giorgetti, A.; Win, M.Z.; Conti, A. Blind Selection of representative observations for sensor radar networks. IEEE Trans. Veh. Technol. 2015, 64, 1388–1400. [Google Scholar]
  21. Gao, J.; Harris, C.J. Some remarks on Kalman filters for the multisensor fusion. Inf. Fusion 2002, 3, 191–201. [Google Scholar] [CrossRef]
  22. Khaleghi, B.; Khamis, A.; Karray, F.O.; Razavi, S.N. Multisensor data fusion: A review of the state-of-the-art. Inf. Fusion 2013, 14, 28–44. [Google Scholar] [CrossRef]
  23. Ding, W.; Wang, J.; Rizos, C.; Kinlyside, D. Improving adaptive Kalman estimation in GPS/INS integration. J. Navig. 2007, 60, 517–529. [Google Scholar] [CrossRef]
  24. Vullings, R.; De Vries, B.; Bergmans, J.W. An adaptive Kalman filter for ECG signal enhancement. IEEE Trans. Biomed. Eng. 2011, 58, 1094–1103. [Google Scholar] [CrossRef] [PubMed]
  25. Foussier, J.; Teichmann, D.; Jia, J.; Misgeld, B.; Leonhardt, S. An adaptive Kalman filter approach for cardiorespiratory signal extraction and fusion of non-contacting sensors. BMC Med. Inform. Decis. Mak. 2014. [Google Scholar] [CrossRef] [PubMed] [Green Version]
  26. Putra, D.; Haas, O.C.; Mills, J.A.; Burnham, K.J. A multiple model approach to respiratory motion prediction for real-time IGRT. Phys. Med. Biol. 2008, 53, 1651–1663. [Google Scholar] [CrossRef] [PubMed]
  27. Gan, Q.; Harris, C.J. Comparison of two measurement fusion methods for Kalman-filter-based multisensor data fusion. IEEE Trans. Aerosp. Electron. Syst. 2001, 37, 273–279. [Google Scholar] [CrossRef]
  28. Roecker, J.; McGillem, C. Comparison of two-sensor tracking methods based on state vector fusion and measurement fusion. IEEE Trans. Aerosp. Electron. Syst. 1988, 24, 447–449. [Google Scholar] [CrossRef]
Figure 1. Systematic diagram of the multistatic UWB radar.
Remotesensing 08 00773 g001
Figure 2. Processing flow of the data fusion algorithm based on Kalman filtering.
Remotesensing 08 00773 g002
Figure 3. Schematic diagram of the Kalman filtering.
Remotesensing 08 00773 g003
Figure 4. Experimental setup. The multistatic UWB radar’s antennas were deployed as a line array, in which the receiving antennas were placed close to the transmitting one.
Remotesensing 08 00773 g004
Figure 5. Measurement of the volunteer that curled upon a camp bed with his feet pointing to the transmitting antenna. In the figure, he was positioned approximately at (6 m, −20°) away from the origin, namely the transmitting antenna.
Remotesensing 08 00773 g005
Figure 6. Measurement of the artificial breathing object: (a) photo of the object; (b) the multistatic UWB radar’s receiving antennas were separated from the transmitting one; (c) the transmitting antenna was moved away from the receiving ones.
Remotesensing 08 00773 g006
Figure 7. UWB data after the preprocessing. The rows from top to bottom correspond to the data of channel 1, 2, 3 and 4, respectively. The blue broken line indicates the waveforms manually picked on the basis of the a priori range information of the target.
Remotesensing 08 00773 g007
Figure 8. Four waveforms detected by the target association and the data fusion result (a) and their corresponding power spectrum in the frequency domain (b) when the volunteer was measured at the position (4 m, 0°). The rows from top to bottom are the waveforms from channel 1, 2, 3, 4 and the detected respiration, respectively. The detected respiration was fused by two methods: one is the Kalman filtering proposed in this paper and the other is a simple method based on averaging all four waveforms.
Remotesensing 08 00773 g008
Figure 9. Four waveforms detected by the target association and the data fusion result (a) and their corresponding power spectrum in the frequency domain (b) when the volunteer was measured at the position (6 m, 0°). The rows from top to bottom are the waveforms from channel 1, 2, 3, 4 and the detected respiration, respectively. The detected respiration was fused by two methods: one is the Kalman filtering proposed in this paper and the other is a simple method based on averaging all four waveforms.
Remotesensing 08 00773 g009
Figure 10. Four waveforms detected by the target association and the data fusion result and (a) their corresponding power spectrum in the frequency domain (b) when the volunteer was measured at the position (6 m, −20°). The rows from top to bottom were the waveforms from channel 1, 2, 3, 4 and the detected respiration, respectively. The detected respiration was fused by two methods: one is the Kalman filtering proposed in this paper and the other is a simple method based on averaging all four waveforms.
Remotesensing 08 00773 g010
Figure 11. Results processed by the reference algorithm in [6]: the volunteer was at the position (4 m, 0°) (a); the volunteer was at the position (6 m, 0°) (b); and the volunteer was at the position (6 m, −20°) (c). The rows from top to bottom corresponds to channel 1, 2, 3 and 4, respectively.
Remotesensing 08 00773 g011
Figure 12. Results processed by the single-channel Kalman filtering: the volunteer was at the position (4 m, 0°) (a); the volunteer was at the position (6 m, 0°) (b); and the volunteer was at the position (6 m, −20°) (c). The rows from top to bottom corresponds to channel 1, 2, 3 and 4, respectively.
Remotesensing 08 00773 g012
Figure 13. Power spectrum of the detected respiration by fusing channels 1, 3 and 4 (the blue line) and fusing all the channels (the red line). The rectangular shadow denotes the band expansion in the BRIR. The data was measured when the volunteer was (4 m, 0°) away from the radar.
Remotesensing 08 00773 g013
Figure 14. Detection results of the artificial breathing object (left column) and their corresponding power spectrum (right column) with different antenna deployments: (a,b) the transmitting and receiving antennas were placed close together; (c,d) the transmitting and receiving antennas were placed separately; and (e,f) the transmitting antenna was moving away from the receiving ones.
Remotesensing 08 00773 g014
Table 1. Key parameters of the multistatic UWB radar.
ParameterValue
Signal modeimpulse
Transmission peak power0.26 W
Pulse repetition frequency128 kHz
Operating frequency250–750 MHz
Receiver dynamic range80 dB
Receiver sensitivity3 dB
ADC accuracy16 bits
Minimum step10 ps
Table 2. BRIR for data fusion results with different channel combination of the multistatic UWB radar. The data was measured when the volunteer was (4 m, 0°) away from the radar.
Channel CombinationsBRIR
2 channels1 and 21 and 31 and 42 and 32 and 43 and 4
5.18%5.55%5.23%3.88%5.02%4.59%
3 channels1, 2, and 31, 2, and 41, 3, and 42, 3, and 4
5.26%5.49%5.76%4.38%
4 channels4.51%
Table 3. BRIR for data fusion results with different channel combination of the multistatic UWB radar. The data was measured when the volunteer was (6 m, 0°) away from the radar.
Channel CombinationsBRIR
2 channels1 and 21 and 31 and 42 and 32 and 43 and 4
2.66%5.63%6.63%3.19%4.02%2.52%
3 channels1, 2, and 31, 2, and 41, 3, and 42, 3, and 4
4.04%5.31%6.11%2.21%
4 channels2.78%
Table 4. BRIR for data fusion results with different channel combination of the multistatic UWB radar. The data was measured when the volunteer was (6 m, −20°) away from the radar.
Channel CombinationsBRIR
2 channels1 and 21 and 31 and 42 and 32 and 43 and 4
4.03%3.62%4.73%3.99%5.54%5.22%
3 channels1, 2, and 31, 2, and 41, 3, and 42, 3, and 4
4.15%5.49%4.54%5.83%
4 channels5.33%

