Biodiversity Monitoring in Changing Tropical Forests: A Review of Approaches and New Opportunities


1
Laboratory of Geo-Information Science and Remote Sensing, Wageningen University, Droevendaalsesteeg 3, 6708 PB Wageningen, The Netherlands
2
GOFC-GOLD Land Cover Office, Droevendaalsesteeg 3, 6708 PB Wageningen, The Netherlands
*
Author to whom correspondence should be addressed.
Remote Sens. 2017, 9(10), 1059; https://0-doi-org.brum.beds.ac.uk/10.3390/rs9101059
Submission received: 26 June 2017
/
Revised: 9 October 2017
/
Accepted: 11 October 2017
/
Published: 17 October 2017
(This article belongs to the Section Forest Remote Sensing)
Abstract
:Tropical forests host at least two-thirds of the world’s flora and fauna diversity and store 25% of the terrestrial above and belowground carbon. However, biodiversity decline due to deforestation and forest degradation of tropical forest is increasing at an alarming rate. Biodiversity dynamics due to natural and anthropogenic disturbances are mainly monitored using established field survey approaches. However, such approaches appear to fall short at addressing complex disturbance factors and responses. We argue that the integration of state-of-the-art monitoring approaches can improve the detection of subtle biodiversity disturbances and responses in changing tropical forests, which are often data-poor. We assess the state-of-the-art technologies used to monitor biodiversity dynamics of changing tropical forests, and how their potential integration can increase the detail and accuracy of biodiversity monitoring. Moreover, the relevance of these biodiversity monitoring techniques in support of the UNCBD Aichi targets was explored using the Essential Biodiversity Variables (EBVs) as a framework. Our review indicates that although established field surveys were generally the dominant monitoring systems employed, the temporal trend of monitoring approaches indicates the increasing application of remote sensing and in -situ sensors in detecting disturbances related to agricultural activities, logging, hunting and infrastructure. The relevance of new technologies (i.e., remote sensing, in situ sensors, and DNA barcoding) in operationalising EBVs (especially towards the ecosystem structure, ecosystem function, and species population classes) and the Aichi targets has been assessed. Remote sensing application is limited for EBV classes such as genetic composition and species traits but was found most suitable for ecosystem structure class. The complementarity of remote sensing and emerging technologies were shown in relation to EBV candidates such as species distribution, net primary productivity, and habitat structure. We also developed a framework based on the primary biodiversity attributes, which indicated the potential of integration between monitoring approaches. In situ sensors are suitable to help measure biodiversity composition, while approaches based on remote sensing are powerful for addressing structural and functional biodiversity attributes. We conclude that, synergy between the recent biodiversity monitoring approaches is important and possible. However, testing the suitability of monitoring methods across scales, integrating heterogeneous monitoring technologies, setting up metadata standards, and making interpolation and/or extrapolation from observation at different scales is still required to design a robust biodiversity monitoring system that can contribute to effective conservation measures.
1. Introduction
Biodiversity decline due to habitat disturbance of tropical forests is increasing at an alarming rate [1] and has led to growing interest in assessing the changing trend of their biological diversity by, for example, implementing and monitoring conservation efforts [2]. The reason tropical forests are in the spotlight is that they host at least two-thirds of the world’s flora and fauna diversity [3] and store 25% of the terrestrial above and belowground carbon [4]. Moreover, their sustainable existence is threatened as a result of major anthropogenic and natural disturbances [5]. Yet the complexity of the biological diversity present and the variety of disturbance factors at work has made the monitoring process difficult. This situation is primarily attributable to the technological and resource limitations of tropical developing countries [6,7].
Loss of tropical forests due to deforestation, forest degradation and forest fragmentation alters the habitat of many flora and fauna species. These threats mainly originate from anthropogenic pressure, which ranges from small-scale agricultural activities and selective logging practices that introduce subtle disturbances, to large-scale commercial agriculture, plantations, logging and mining activities that result in large-scale habitat disturbance and forest fragmentation [8]. When their habitat is modified, some species manage to adapt, some become threatened, others migrate and a few go extinct [9]. Such resulting change in biological diversity is a complex process that is increasingly attracting research attention. This is due to the growing need to assess and report on the performance of policy regimes, such as those agreed in the Paris Climate Agreement and on efforts to reduce deforestation and forest degradation [2], and on the Aichi targets set by the Convention on Biological Diversity [10]. Accordingly, the United Nations (UN) Convention on Biological Diversity (CBD), the Intergovernmental Platform on Biodiversity and Ecosystem Services (IPBES), and the Group on Earth Observations and Biodiversity Observation Network (GEO BON) are among the international initiatives that are addressing the increasing threat to forest biodiversity. The UNCBD’s Aichi Biodiversity Targets (ABT) have 20 measurable components and are aimed at reducing the pressure on global biodiversity and halting it by the year 2020 [10]. Countries that ratified the CBD Convention (Article 6) [11], have since developed National Biodiversity Strategies and Action Plans (NBSAPs), while countries that have embraced the UN Sustainable Development Goals (SDG) (goal 15: Life on Land and goal 14: Life below water, notably) [12] have developed national SDGs, with the result that when planning and executing national activities the impacts on biodiversity and on environmental sustainability are taken into account [13]. In support of the ABT, GEO BON has defined the concept of Essential Biodiversity Variables (EBVs) [14] to globally standardise the monitoring of biodiversity change over time, across taxa and ecosystem types [14]. EBVs are a transposition of what Essential Climate Variables (ECVs) are for climate change. Such ECVs are defined by Global Climatic Observation System (GCOS). EBVs aim to address the demand of biodiversity observation communities for establishing consistent and harmonised studying, reporting and management of biodiversity change at a global level [14]. It contributes towards policy initiatives at national and global levels through platforms such as IPBES and UNCBD, as well as towards actual biodiversity change monitoring practices. The EBVs have six classes (namely: genetic composition, species populations, species traits, community composition, ecosystem function, and ecosystem structure), with a total of 22 EBV candidates under them. These classes address relevant dimensions of biodiversity change with measurable parameters at different spatial, temporal, and taxonomic scales. EBV data products are to be used for deriving suitable indicators, thus EBVs lie between raw data and indicators [15]. Currently, several efforts are being made to assess the suitability of existing and emerging technologies to produce EBV products, and thus of progress towards the Aichi targets [10].
Tropical countries have struggled to establish biodiversity monitoring systems and particularly for providing consistent time series for assessing trends and progress towards targets [7]. Hence the policy requirements for biodiversity data and monitoring systems are highlighting the need for consistent observations over time, both from on-the-ground observations and from satellite time series. This is to enable tracking and quantifying of ecosystem dynamics and the direct and indirect impacts of human activities (and related policy measures) that result change in biodiversity (i.e., from land use, climate change) [14,16]. While this need is becoming more pressing, a key question is how previous research experiences and evolving technologies can help to better characterise tropical forest changes and the associated relationships and impacts on biodiversity.
Countries mainly rely on national forest and biodiversity inventories to acquire information on changes and trends. These inventories mostly use established field survey approaches, such as counts, transects, trapping and diameter at breast height (DBH) measurements, which yield direct and generally accurate observations of species status and trends. Such approaches, however, are costly, laborious, invasive and time-consuming [17,18].
Remote sensing, in situ activity sensors and, more recently, Deoxyribonucleic Acid (DNA) barcoding techniques are seen as promising tools for designing a new generation of biodiversity monitoring systems [19,20,21]. They are assumed to be able to address data gaps and to allow scalable studies which complement established field survey approaches [22,23]. From the genomics domain, DNA barcoding presents a new opportunity for establishing a robust biodiversity monitoring system.
From the remote sensing domain, free access to satellite images, the availability of very high spatial, spectral, and temporal resolution satellite images and of open source analytical software, and the development of algorithms for analysing and interpreting complex datasets are providing good opportunities for the ecological community to detect and monitor forest and biodiversity changes through time [24,25]. Remote sensing based biodiversity monitoring provides an opportunity of extended spatial and temporal resolution to the existing biodiversity monitoring systems. This approach not only has the potential to map indirect indicators such as human induced habitat disturbances [16,26] and forest cover changes [27,28] but it can also be used to measure direct physical parameters, such as individual trees [29] and large mammals [30]. Moreover, Light Detection And Ranging (LiDAR) and Synthetic Aperture Radar (SAR) data have demonstrated capabilities for mapping detailed forest structure and estimating biomass [31]. Thanks to the ongoing advancement of remote sensing technology, new satellite images with even higher spatial, spectral and temporal resolutions are often available for free [22,32]. In addition, the availability of remote-sensing -derived datasets such as the Global Forest Watch [28] are used to derive indirect species occurrence indicators such as forest fragmentation [33,34].
The recent advances in in situ sensors such as bioacoustics, tags, and camera traps are providing non-destructive and semi-automated ground surveying opportunities [27,28]. In situ activity sensors are non-invasive surveying techniques that often provide opportunities for measuring biodiversity directly, thereby revealing the presence or absence of species, and their behaviour [35]. Recent technological advancements in this field have made possible real-time observation and rapid collection of biodiversity data [21].
DNA barcoding techniques are emerging as monitoring systems that are rapidly evolving to further facilitate biodiversity data collection and species identification. This DNA barcoding technology ranges from using standardised barcodes to identify individual specimens, to identifying multiple specimens from bulk samples (the latter process is called metabarcoding). Such technology makes rapid biodiversity assessment possible through bulk sampling, and with automated species identification processes [18,36]. Furthermore, Environmental DNA (eDNA) technique is being used to extract cellular and extracellular DNA from environmental samples (water, soil, faeces, etc.), enabling a rapid assessment of past and present biodiversity [18,37].
Many scholars argue that the recent technologies (i.e., remote sensing and in situ sensors) and emerging opportunities (i.e., DNA barcoding) have not been well exploited for ecological studies, regardless of their immense potential to inform on subtle changes and to indicate future directions of study [20,21,32,38]. This is with regards to the limited application of the state-of-the-art technologies towards biodiversity studies, as well as the existing gap in exploration of the potential integration of such technologies for detailed studies and conservation efforts.
Taking into account the increasing need for reliable data to inform international policy processes, the current status of biodiversity monitoring activities and research, and the potential of new technologies, this paper aims to:
- Give an overview of the state of the art and synthesise previous research on biodiversity monitoring in the context of changing tropical forests;
- Assess the potential of using evolving technologies and tools to further increase the detail and accuracy of biodiversity monitoring;
- Identify remaining gaps and opportunities on biodiversity monitoring approaches through evaluating their contribution to addressing the primary biodiversity attributes according to Noss [39];
- Assess how evolving technologies can help operationalise relevant EBVs for tropical forest environments.
We have deliberately focused on tropical forests and the issue of assessing changes and trends in biodiversity. Tropical areas are not only undergoing considerable forest changes of global relevance but are also particularly data-poor. In this context, we aim to help address these challenges by assessing new opportunities and to complement other review studies that have had a much broader scope [21,22,24,38].
2. Analytical Framework and Data Analysis
In this study, in order to categorise biodiversity groups and monitoring elements, we have adapted the CBD [40] definition of forest biological diversity: “Forest biological diversity is a broad term that refers to all life forms found within forested areas and the ecological roles they perform. As such, forest biological diversity encompasses not just trees, but the multitude of plants, animals and micro-organisms that inhabit forest areas and their associated genetic diversity.”
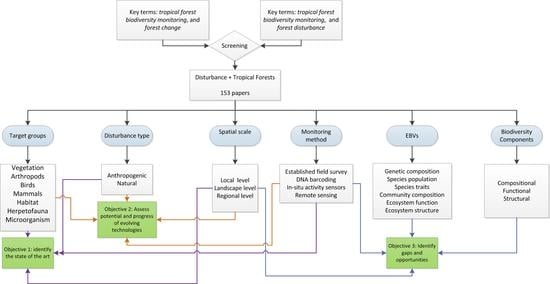
We performed a systematic search of the scientific literature on the Web of Science platform, using the paired search terms: tropical forest biodiversity monitoring—forest change; and tropical forest biodiversity monitoring—forest disturbance. Further screening was made by reading the abstract of the articles, to identify those that are focusing on disturbed tropical forests and provide detailed description of their biodiversity monitoring approaches. Based on these search criteria, we identified 153 scientific papers (Supplementary Materials) that are conducted across 38 tropical countries. Next, an analytical framework was developed to define systematic criteria for classifying and analysing monitoring details across essential biodiversity components. We considered six essential biodiversity monitoring components that align with our research objectives: (1) the spatial scale of the study (i.e., spatial extent of the study area); (2) the disturbance type reported (i.e., anthropogenic or natural sourced event that results alteration of natural tropical forest habitat); (3) the targeted groups studied (incl. taxa and their biotope); (4) the monitoring methods employed; (5) the relationship with EBV classes; and (6) the primary biodiversity attributes addressed (i.e., compositional biodiversity, functional biodiversity and structural biodiversity).
In regards to spatial scales of the study, we deemed studies of sites of <100 ha and transects 10 m to 20 m long as being local; those of 100 ha–500 ha and transects 200 m–500 m long as landscape; and those of >500 ha with transects >500 m long to be regional-scale studies [41]. Studies were also categorised according to their source of disturbance, anthropogenic and natural. The types of monitoring approaches employed were studied in relation to targeted biodiversity groups, and disturbance types reported. In addition, we used subset of the series of EBVs that are relevant to tropical forests to frame our review findings, in relation to the use of new monitoring technologies and emerging opportunities (Figure 1). Finally, we synchronise our findings with two reference studies: the one by of Noss [39], which identified the three primary attributes of biodiversity (i.e., compositional biodiversity, functional biodiversity and structural biodiversity). Noss [39] defined compositional diversity as ‘the identity and variety of elements in a collection’, while structural diversity encompasses ‘physical organisation and pattern of a system’, finally functional diversity involves ‘ecological and evolutionary processes’. Another reference study by Turner (2014), indicated on the role of upcoming technologies for biodiversity monitoring. These fundamental studies were used to explore and propose avenues of methodological complementarity and opportunities for integration.
3. Results
3.1. Spatial Scale
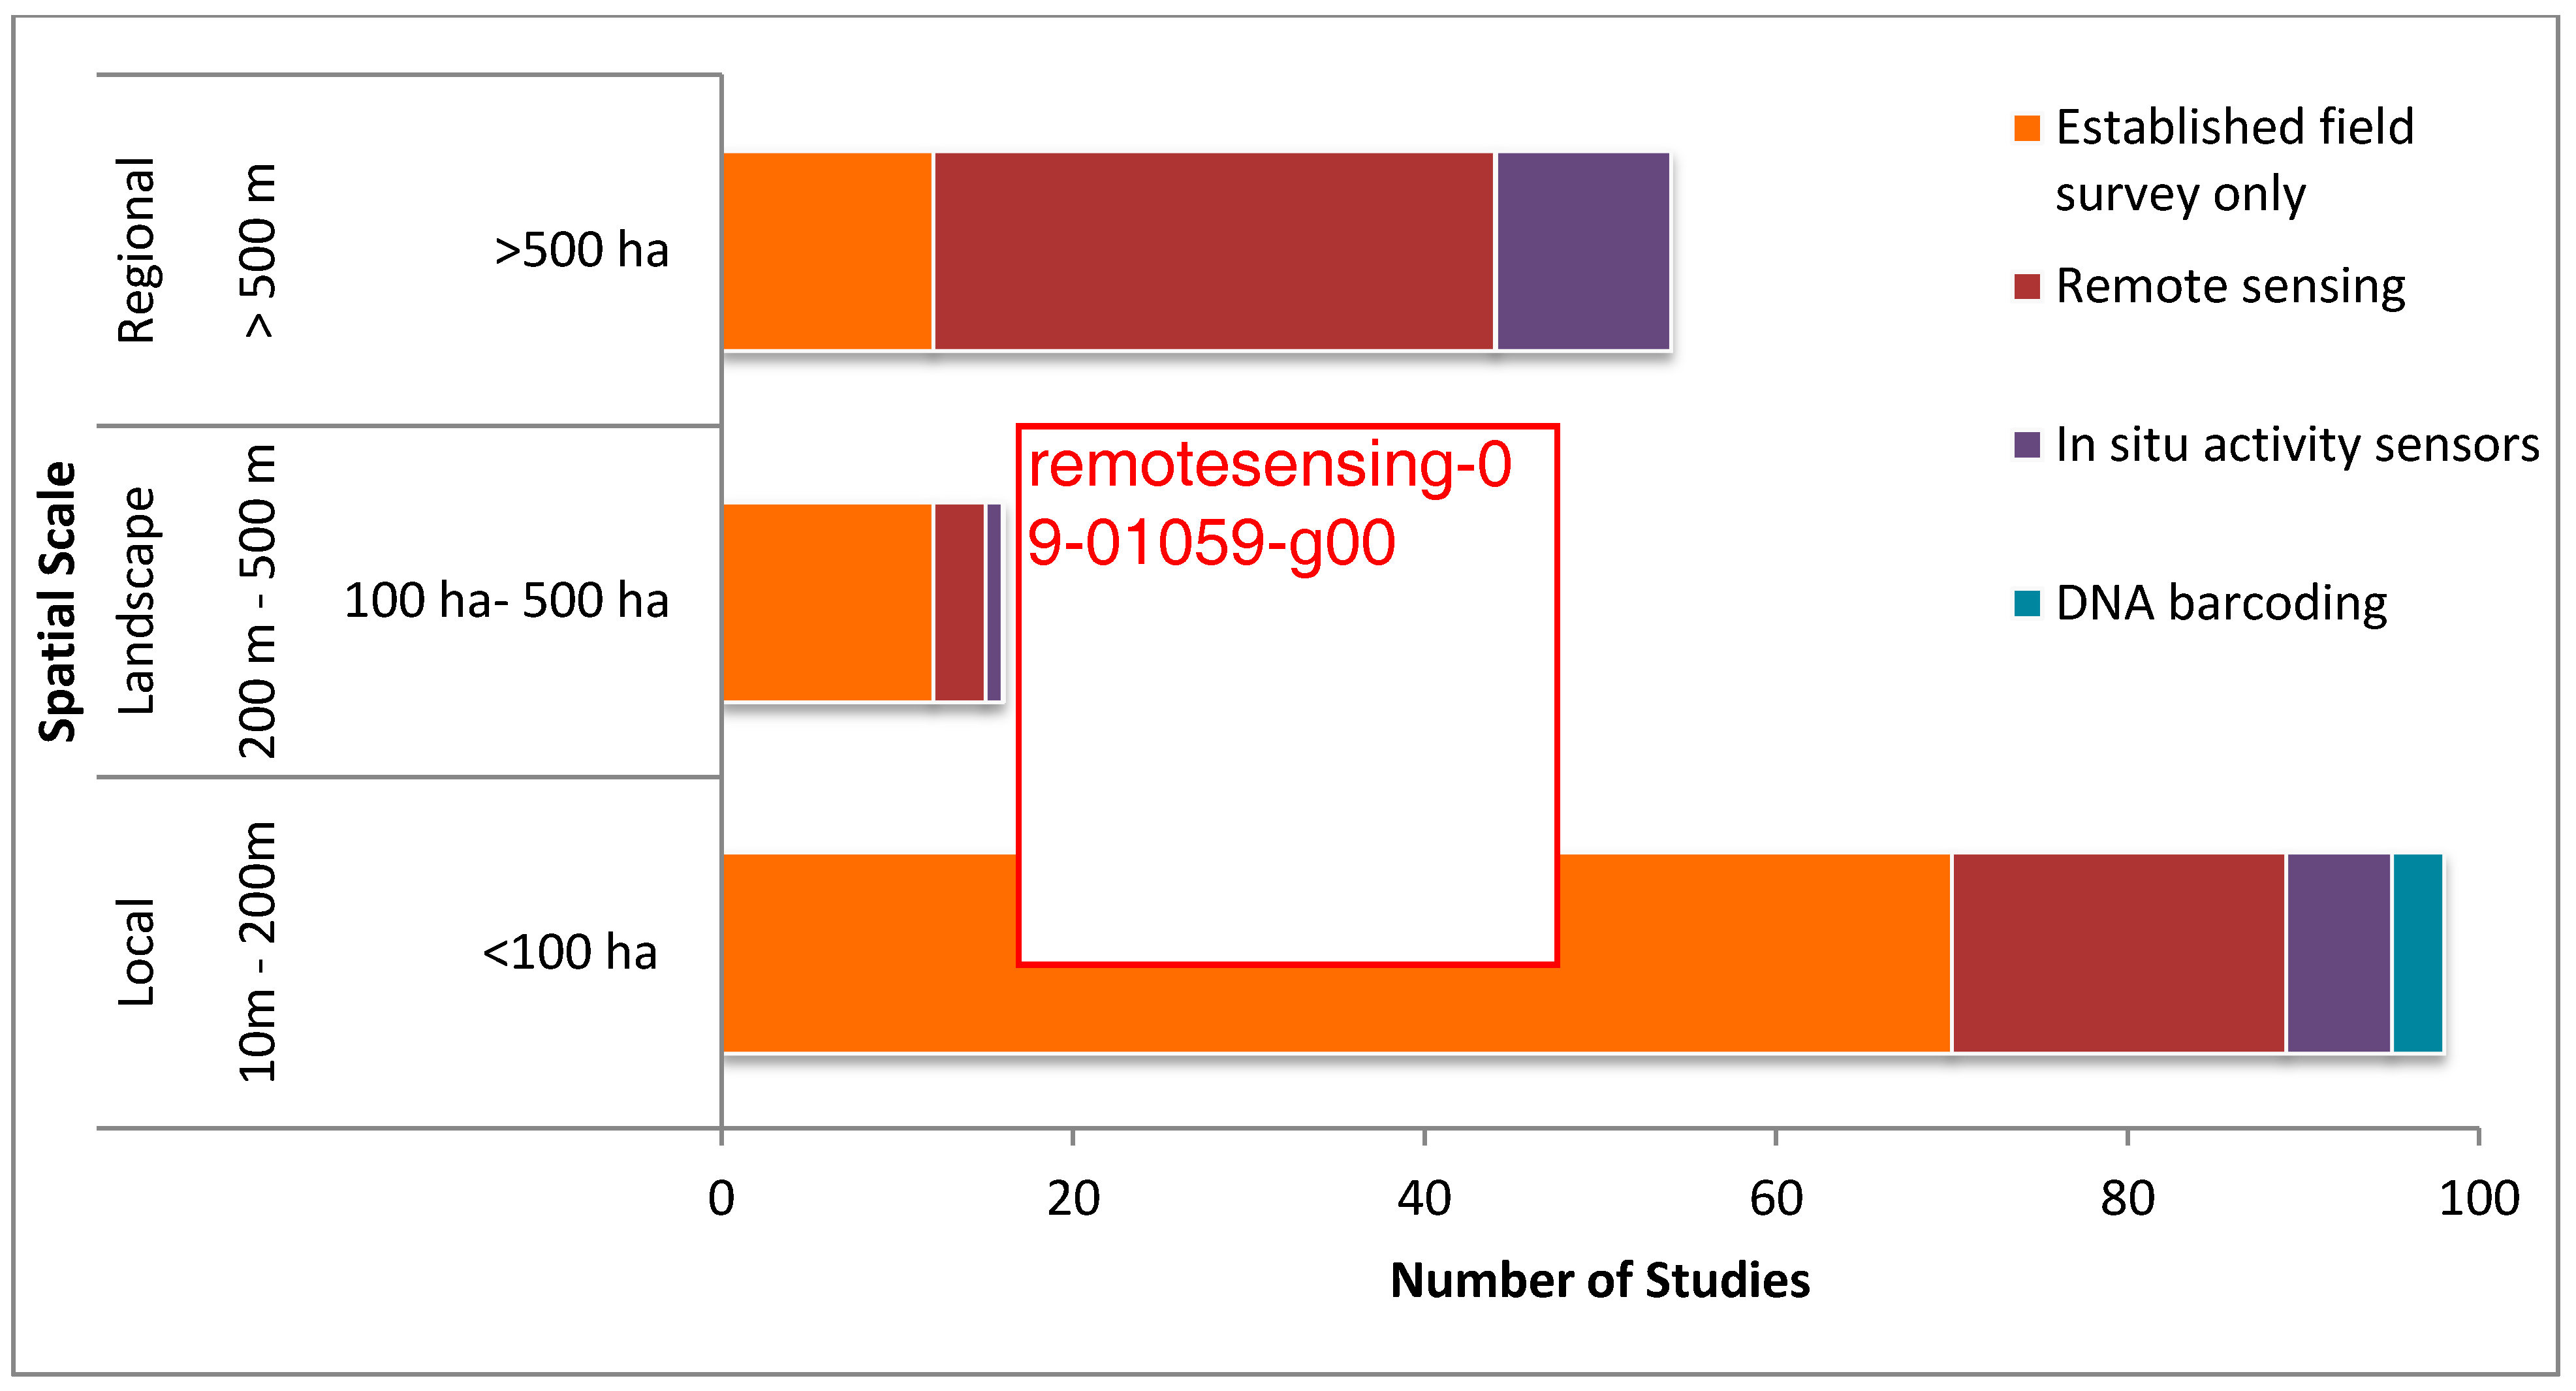
The weight of the spatial scale of study sites in determining the choice of an appropriate biodiversity monitoring approach was revealed by the review. Most of the studies (58%) had been done at a local scale, followed by regional studies (32%), and with only a few studies (10%) performed at the landscape scale (Figure 2). Established field surveys had higher application on local and landscape scales, while remote sensing was used at all scales but found higher applicability in regional-scale studies. In situ activity sensors had higher association with studies at a local and regional scale, while its use was limited at landscape scale studies. The use of DNA barcoding methods was only at a local spatial scale.
3.2. Disturbance Types
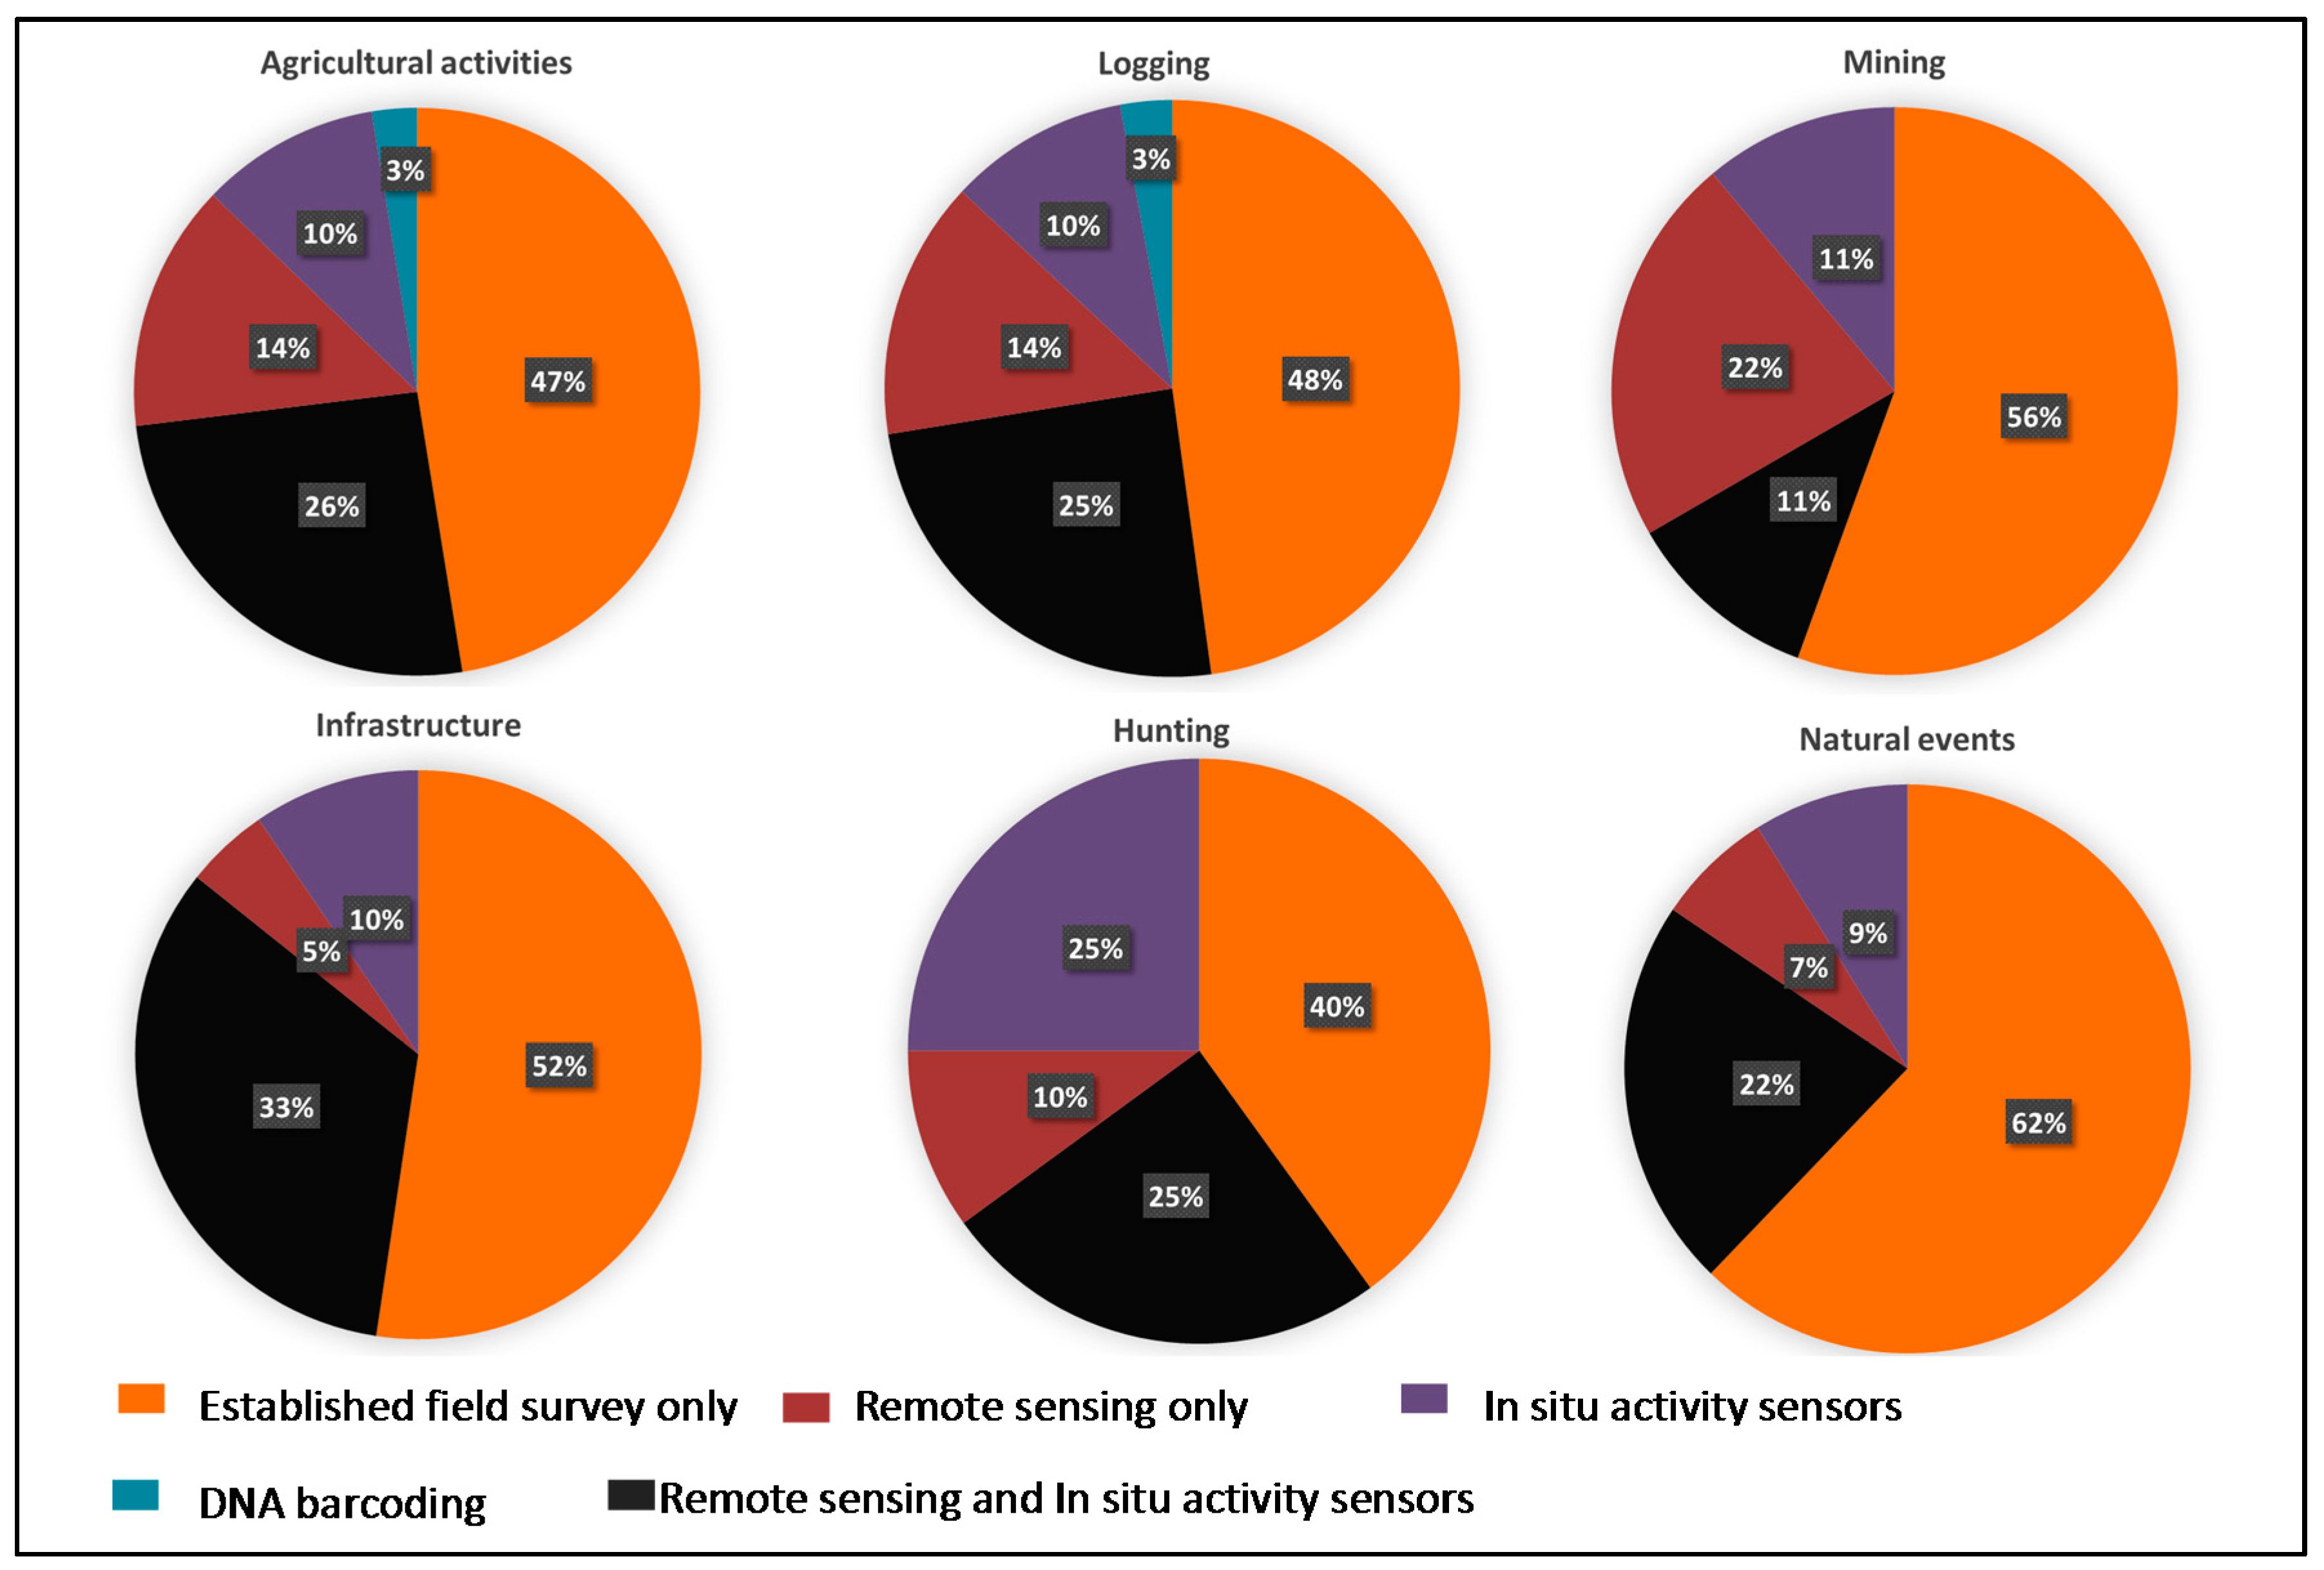
Anthropogenic factors accounted for 82% of disturbances related to biodiversity change, with the remaining 18% being accounted for natural events. Agricultural activities (32%) and logging (27%) were among the major anthropogenic drivers, followed by infrastructure (9%); hunting (7%) and mining (7%). Natural events included events like wildfire, disease outbreaks and extreme weather events. Established field surveys dominated the monitoring of all disturbance types, especially in the case of natural events, mining and infrastructure (Figure 3). In situ sensors were used in tandem with remote sensing, especially for detecting biodiversity changes in relation to infrastructure, agricultural activities, hunting and logging [42,43,44]. However, these approaches were also used independently, remote sensing contributed significantly to detect mining, while in situ sensors showed substantial capacity for tracking hunting activities. Finally, DNA barcoding was found to contribute to detecting changes related to agricultural activities and logging.
Disturbance Types per Country
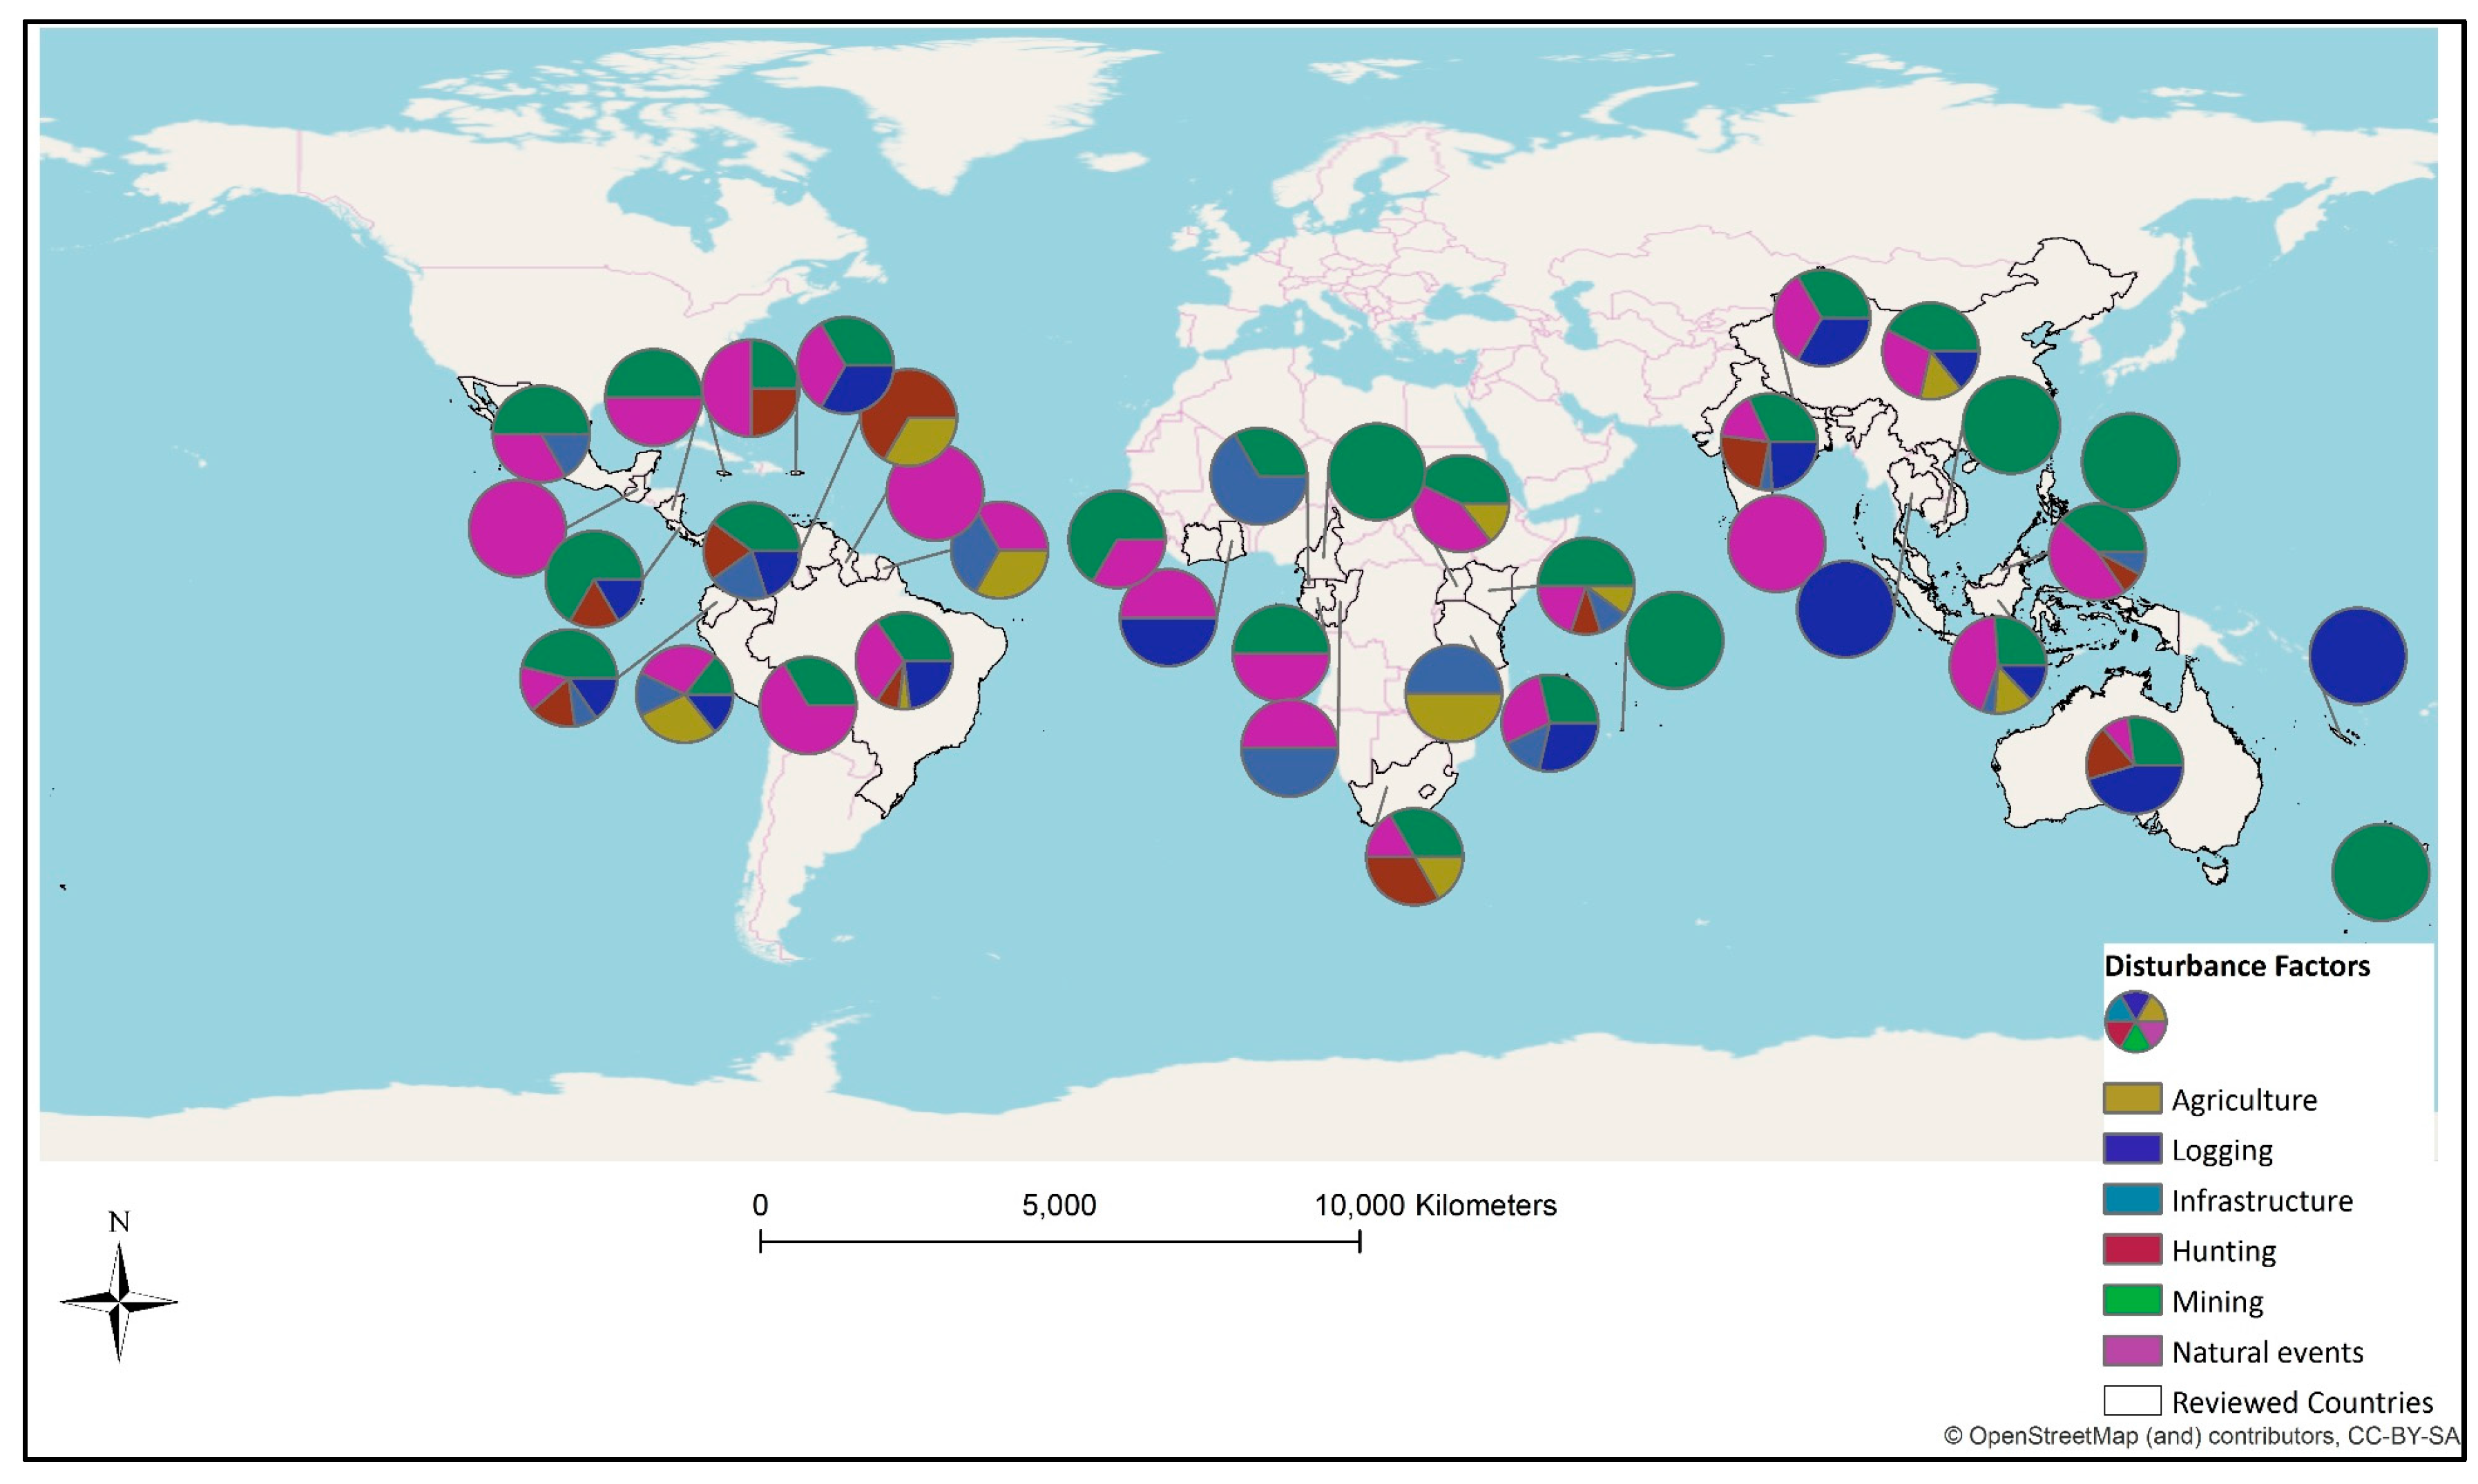
The disturbance types were further analysed to identify drivers of biodiversity loss at country and regional scales. The reviewed studies were carried out in 38 tropical countries, distributed across five regions. The contrast of disturbance factors across the regions can be observed where human induced land use changes such as agriculture and logging were highly represented in South America, South East Asia, and East Africa (Figure 4). Infrastructure-related disturbances had their peak in South America and South Asia, but showed small impact in East African countries. Other disturbance factors such as hunting and mining had varying occurrence across regions, where the former had considerable appearance in Africa and the later in South American countries. Finally, the impact of natural events appeared dominant over the other disturbance factors in Oceania countries.
3.3. Targeted Groups in Monitoring of Disturbed Tropical Forests
Vegetation and arthropods were the major targeted groups for monitoring in relation to changing tropical forests, and were also often used as surrogates for other biodiversity groups (Figure 5). Habitat condition, birds and mammals were studied much more often than herpetofauna and microorganisms.
Overall, established field surveys predominated over the other monitoring methods, except in the case of habitat monitoring, where remote sensing was applied the most (Figure 5). Similarly, remote sensing was employed appreciably to monitor vegetation, and to some extent for monitoring arthropods, birds, and mammals, but it was hardly used to monitor herpetofauna and microorganisms. Even though the overall application of in situ sensors to the different taxa was limited, they were employed in all groups except microorganisms. Finally, DNA barcoding was found to have been applied to only three taxa (i.e., vegetation, arthropods and microorganisms).
3.4. Monitoring Approaches over Time
The temporal trend of integration of new technologies into the biodiversity monitoring of disturbed tropical forests has been indicated on the targeted article pool (Figure 6). In all years except 2015 and 2016, the dominant method was established field surveys. However, the trends show the growing incorporation of state-of-the-art technologies in to the monitoring system. Remote sensing approaches are the most consistently employed after established field surveys, and their application even dominated over the rest in the recent years. In situ sensors and DNA barcoding approaches are recent additions to the monitoring system.
Monitoring Approaches vs. Biodiversity Estimation Significance Values
The accuracy results maintained from applying the different biodiversity monitoring approaches has been investigated looking into the statistical significance and accuracy values reported in the reviewed paper. These were used to compare the methods accuracy in terms of their estimation of biodiversity. Majority of the results from established field surveys (59%), and integrated approaches (i.e., established field surveys coupled with remote sensing) (71%) provide significant values (i.e., p = 0.01–p = 0.05, R2 = 0.5–R2 = 0.7, classification accuracy = 50–70%), while 26% of established field surveys, and 21% of integrated approaches had highly significant results (i.e., p < 0.01, R2 > 0.7, classification accuracy > 70%). Yet, established field surveys also had its high share (16%) of non-significant results (i.e., p > 0.05, R2 < 0.5, classification accuracy < 50%). Remote sensing approaches also had majority (35%) of their results as highly significant and significant (47%), but also with considerable (18%) non-significant values. Even though there are few studies that used in situ sensors, 25% of the studies had both non-significant and highly significant results, and 50% had significant results. Finally, all DNA barcoding studies resulted significant values.
3.5. Recent Technologies and New Opportunities for EBVs
Satellite remote sensing techniques were found to be dominantly employed for three of the EBV classes, namely species population, ecosystem function and ecosystem structures but its application was limited in the classes of species traits and community composition (Figure 7). Hyperspectral and LiDAR remote sensing were found to be appropriate for species population and ecosystem function classes, while LiDAR also contributed substantially to assessing ecosystem structure and community composition. Similarly, in situ sensors were applied to all EBV classes except for genetic composition, and notably applied for monitoring of the species population. Finally, DNA barcoding was found appropriate for addressing genetic composition, species population, ecosystem function and ecosystem structure classes.
4. Discussion
4.1. State of the Art
The monitoring of biodiversity changes is scale-sensitive: the biodiversity elements to be monitored, indicators to be used and monitoring methods employed appeared to be determined by the spatial scale of the study areas (i.e., geographical coverage of the study area), the temporal scale (i.e., availability of longitudinal biodiversity data), and the thematic scale (i.e., targeted groups for monitoring and disturbance types). Different observation scales provide varying insight into changes, at times yielding contrasting outlooks [45]. Even though established field surveys are assumed to be the most accurate sources of information on biodiversity data, ecological data acquired through this method are mostly collected at local spatial scale, which often makes it challenging to extrapolate results. In contrast, biodiversity indicators based on remote sensing have been demonstrated to be easily up-scalable by virtue of the nature of the data [20], which is why species distribution models are now using remote-sensing-based environmental datasets to scale up ground observations. Rocchini [46] and Pettorelli et al. [47] indicated that the use of remote sensing data has opened up new opportunities for predicting the effect of anthropogenic activities and environmental conditions on the spatial distribution of species. Moreover, apart from the role of remote sensing in monitoring forest cover-change related habitat disturbances and its indication on biodiversity dynamics [28,48], very high spatial resolution satellite images [49] and airborne remote sensing [50] are being used to estimate the occurrence and abundance of mammals, and large birds.
In situ activity sensors were found to have been used in multiple spatial scale studies (Figure 2) and across different taxa (Figure 5), allowing real-time observation. Such method allows insight into the spatial and temporal scales over which individuals and populations interact. It also allows a remote and non-invasive opportunity to survey on species, detect anthropogenic disturbances, assess social dynamics of species, and track responses to factors such as climate change and habitat disturbance [51]. The drawbacks of this method (e.g., signal recognition across taxa) are being resolved with the development of automated visual and sound identification software [52].
Finally, DNA barcoding was found to be suitable for studies at a local level, and in general it appears to have been used only in few studies for monitoring changing tropical forests. However, it has been increasingly incorporated and tested in biodiversity studies of other ecosystem types, such as subtropical forest [53], temperate woodland [54] and the Arctic [55]. Such a technology provides a unique opportunity for collecting and analysing mass biodiversity samples and rapid estimation of the total biodiversity. However, the use of this technology, especially in developing tropical countries, could be restricted due to high installation and processing costs as well as limited human resource. The drawbacks of this technology were reported to be high cost, contamination, errors during DNA amplification and a lack of high-quality taxonomic reference databases [18,37,56]. However, with the ongoing intensive research and technological advancements in the field, it seems likely to evolve into a valuable tool for measuring and monitoring of tropical biodiversity [19].
The temporal aspect of scale relates to the building and obtaining of longitudinal biodiversity monitoring datasets (Figure 6). This allows consistent estimation of changes in biodiversity and their drivers. Crucial for this is the availability of local, national, continental and global biodiversity data. In reality, such data are scarce due to inconsistency in monitoring approaches, data storage and sharing policies and shortcomings in the technical capacity of countries, as well as financial and human resource limitations [57]. Established field surveys have great potential to provide historical data (Figure 6), while Landsat missions (dating back 40 years), the Copernicus Sentinel constellations (recently launched), as well other commercial satellite data providers provide long term, free, and open access data. The potential of emerging technologies is also important to populate biodiversity observation data. There is, however, a need for researchers, institutions and countries to systematically archive and share such datasets. There have been several independent initiatives to build long-term time series of biodiversity data. Ji et al. [36] presented available databases for DNA sequence data, while GEO BON provides accessible datasets for EBVs through its portal (https://boninabox.geobon.org/) . Similarly, in the case of the in situ activity sensors, open databases are becoming available through the Tropical Ecology Assessment & Monitoring (TEAM) Network Education Portal [58], TRY plant trait database [59] and through the Bioacoustica online repository and analysis platform [60]. Overall, the temporal trend also shows the growing inclusion of tropical biodiversity studies towards new monitoring techniques.
The thematic aspect of scale relates to the complexity of disturbance types and targeted biodiversity groups for monitoring. Overall, the major sources of tropical forest disturbance with associated impact on biodiversity are anthropogenic pressures [61]. The two main sources of anthropogenic forest disturbance (i.e., agricultural activities and logging) produce features that can be detected by all monitoring methods examined in our review. While large-scale agricultural activities and mining show a clear signal of change with canopy cover loss, other disturbance types that often take place below canopy (e.g., selective logging, and surface fire) introduce subtle changes. The role of remote sensing and in situ sensors in monitoring such drivers of change is especially noteworthy. Large-scale changes that result from deforestation and forest fragmentation have been well picked up by Landsat and other medium to coarse spatial resolution satellite images [28,62,63]. However, when it comes to understory disturbances and those that do not have spatially quantifiable features (such as hunting), there is a data gap. Peres et al. [64] similarly described the nature of such disturbances in tropical forests and advised on the use of new technologies for identifying the ‘almost undetectable’ disturbance types such as hunting, selective logging, sub-canopy roads and invasive species. Newbold et al. [16] discussed how such habitat alteration influences local richness and total abundance of species, and hence affects ecosystem functions and services. Our review indicated that vegetation and arthropods are the groups most studied in disturbed environments, while herpetofauna and microorganisms are poorly investigated. Most importantly, vegetation and arthropods embrace sensitive species that can quickly respond to habitat alteration and environmental changes, thus making them good to be used as surrogates. Our review revealed that arthropods were the major surrogates for other biodiversity groups. Yet, criticism occurs regarding the choice and use of surrogates and therefore systematic ways of selecting suitable indicators have been proposed to promote cost-effective and efficient biodiversity monitoring [65]. In general, the identification of country specific biodiversity loss drivers and potential indicators can lead to e the design of targeted mitigation and conservation programs (Wintle, Runge, and Bekessy 2010).
Over all, the role of biodiversity in ecosystem services needs to be properly assessed and understood in order to mainstream biodiversity across governments and society. Such a complex topic can only be clearly understood when the necessary data are acquired and analysed using proper tools. Unravelling of changes and trends in biodiversity can help us to understand not just about species composition and abundance but it can also inform on how forests adapt to pressures, indicates on the resilience of the forest ecosystem, and the impact of mitigation and adaptation actions on the environment. Many argue that biodiversity conservation is placed in the background of climate change mitigation actions and carbon reduction efforts. However, Mant et al. [66] pointed out that adaptation and mitigation actions that do not consider the role of, and potential impacts on, biodiversity can have adverse consequences. Therefore, such possible impacts on biodiversity must be measured and monitored alongside forest status and carbon stock assessments. Contrasting results appear when looking in to the relationship between carbon and biodiversity in tropical forest. Talbot [67] found complex and limited correlation between the two, while Poorter et al. [68] proved diversity’s positive role in enhancing carbon storage of tropical forests. Even though there is a need for continuous research in the area, there are already promising steps towards promoting an all-inclusive measuring and monitoring of degrading tropical forest environments. Here, the role of remote sensing is especially recognised where same data that is collected to report on forest and carbon stock status can also be used to derive direct and indirect indicators of biodiversity status [38,69].
4.2. Potential and Progress of Evolving Technologies
To detect and monitor changes at different spatial, temporal and thematic scale not only a variety of monitoring approaches is required but also their integrated deployment. The application of remote sensing has been limited to deriving indirect indicators of biodiversity; mostly through using coarse to high spatial resolution satellite images for habitat analysis. However, advances in the field are bringing opportunities to develop direct indicators, e.g., using very high spatial resolution satellite images to identify large trees and animals [70,71], using hyper spectral sensors to ascertain vegetation biochemistry [72], and using LiDAR sensors to map the three-dimensional vegetation structure [73,74]. Moreover, such scale-related limitations can be overcome by coupling remote sensing with in situ sensors and DNA barcoding [19]. The ability of in situ based sensors to provide real-time observation and automated data acquisition could overcome the limitations that emerge when established field survey methods are used independently [75]. Moreover, the role of DNA barcoding is crucial for studying species that are elusive, and to acquire insight into ancient environments [18]. The accuracy of biodiversity estimation is expected to benefit from the integration of monitoring techniques as can be observed from the results of the review. However, one should be cautious of publication bias towards reporting only positive and significant results [76,77].
4.3. Gaps and Opportunities
4.3.1. Monitoring of Primary Biodiversity Attributes
Based on our review, we map the actual and optimal application of biodiversity monitoring approaches (Table 1) specified by Turner [38] in relation to primary biodiversity attributes specified by Noss [39].
In the synthesis table (Table 1), we quantified how many of the reviewed articles used a certain method to monitor the biodiversity attributes that are defined by Noss [39]. This was further related to the potential application that the methods can provide according to key literatures in the field [21,22,24,38]. It appears that none of the monitoring methods presented here are in themselves sufficient to properly address the three primary biodiversity attributes. However, this overview shows that there is complementarity between methods. As can be observed, in situ approaches perform well in biodiversity composition, while remote sensing based approaches are powerful for addressing structural and functional biodiversity. It can also be observed that despite their remarkable potential, these tools are underexploited. For instance, DNA barcoding, TLS and citizen science were among the methods least employed (not used in >80% of the reviewed studies). However, the role of citizen science on conservation efforts was demonstrated through various successful projects such as the breeding bird survey in the United States [78], global bird observation network—eBird [79], the Dutch phenological network [80], and ranger’s forest and biodiversity status observation in Ethiopia [81]. Neither were in situ sensors, LiDAR, SAR, and hyperspectral sensors that are ranked from very suitable to ideal for monitoring some biodiversity attributes used to their full potential in tropical forest biodiversity monitoring studies. Such shortcomings can lead to the development of monitoring techniques that produce under-or overestimations of biodiversity metrics. Whereas remote sensing data can be used to detect changes, provide a stratified sampling scheme for efficient monitoring and to identify certain species characteristics, in situ methods can be used for calibration and validation. While it is advantageous to have various methods of detecting biodiversity changes, a difficulty arises when trying to combine the different types of data for modelling the characteristics of species, their association with their environment and their response to changes [82]. For instance, differences among datasets in terms of spatial/temporal/taxonomic resolution, extrapolation, data standardisation, calibration and data format can be an obstacle. Thus, practicable spatial and ecological models need to be developed to map species distribution and ecosystem services, as well as to make projections. For these purposes, there is a pressing need to establish and strengthen networks such as GEO BON, which promote dialogue and collaboration between ecologists, biologists, remote sensing experts, modellers and statisticians. Such platforms can be used not only to overcome technological limitations and domain segregation, but also to address technical issues such as big-data processing capabilities and the skills needed to implement methods. Here, we can mention exemplary platforms, such as the Biodiversity Observation Network in a Box (BON in a Box), which provide information and access to biodiversity-relevant remote sensing datasets, protocols, and tools (https://boninabox.geobon.org/). Similarly, in situ data sources and analytical tools are provided by the Global biodiversity Information Facility (https://www.gbif.org/).
4.3.2. Operationalising EBVs with State-of-the-Art Technologies
EBVs are expected to promote standardised data workflows for harmonised monitoring and reporting of biodiversity change at a global scale, as a means to achieving the Aichi biodiversity targets [10]. However, biodiversity monitoring methods operate at different spatial, temporal, and taxonomic scales [15]. The operationalisation of EBVs requires a statement of measurable EBV candidates that can be matched with multiple monitoring tools. Several studies assessed the possibilities of putting EBVs to practice and investigated how relevant indicators can be derived from them. Kissling [15] investigated the necessary data and tools in order to operationalise species distribution and species abundance EBV candidates at a global level. Here, the requirement for multiple data sources was acknowledged, and limitations in the process of harmonizing and integrating observations from different data sources were indicated. Satellite remote sensing-based EBVs (SRS-EBVs) are being researched to provide scalable, rapid, and cost efficient global monitoring solutions towards operationalising EBVs [32]. However, SRS-EBVs are proven to contribute towards direct derivable of only few EBVs, as most of them require higher resolution (in terms of spatial, temporal, and taxonomic details) datasets [19].
We developed a synthesis matrix that indicates the relevance of the state-of-the-art technologies in operationalising tropical forest-relevant EBV candidates (Table 2 and Table 3). These synthesise are developed based on GEO BON strategy for EBVs [83] (Table 3) and studies [15,19,32,84,85] that assessed avenues for multi sensor approaches in EBV product development (Table 2), especially focussing on remote sensing. In Table 2, the suitability of remote sensing in relation to multiple EBVs as well as Aichi biodiversity targets is presented. Most importantly, the application of the range of remote sensing techniques in relation to specific candidates is presented. Most remote sensing tools are applied towards vegetation and habitat-related EBV candidates. Here EBV products such as vegetation types and land use/cover maps can be produced using spectral characteristics’ of the remote sensing data. These maps are often produced with medium or high spatial resolution images such as those from Landsat or Sentinel 2 sensors, respectively. Remote sensing can also be used in relation to EBV candidates that require finer details such as taxonomic diversity and population structure by age/size class. In the latter case, data sources with higher spectral and spatial resolution are required from the remote sensing domain such as hyperspectral and LiDAR remote sensing; however, associated costs could hamper their applicability in several countries from the tropics. Alternative approaches to deriving species diversity indices from satellite remote sensing datasets exist;, however, acquiring a reliable estimation of beta-diversity and gamma-diversity is challenging [86]. Remote sensing application is especially limited for EBV classes such as genetic composition and species traits that require monitoring at genetic (e.g., co-ancestry, population genetic differentiation) and species level (e.g., body mass, demographic traits). The spatial and spectral resolution of satellite remote sensing products limits the ability to identify individual trees or animal species. Very high spatial resolution images that can help identify large mammals are costly [15] and often have high cloud coverage over tropical forests, which makes them unsuitable for deriving tropical forest EBVs. The use of remote sensing is, however, suitable for ecosystem structure EBV class (i.e., habitat structure, ecosystem extent and fragmentation EBV candidates), where EBV data products can be directly derived from medium to high spatial resolution data sources (e.g., Landsat, Sentinel 2) that are often freely available, while habitats’ three-dimensional structure can be accurately mapped using LiDAR. The role of SRS for ecosystem function classes is also recognised. Pettorelli et al. [87] and Mora et al. [88] listed EBV products that can be derived from current and future SRS datasets.
Even though several SRS and Earth observation datasets are being identified as suitable for monitoring of EBVs, there is still remaining work to be done towards a better definition of some EBV classes such as the ecosystem function class [87]. In addition, testing the suitability of methods across scales, integration of heterogeneous monitoring technologies, setting up metadata standards, and making interpolation and/or extrapolation from observation at different scales is required [15,19]. This is especially true for EBV classes such as genetic composition and species traits where little data are directly available.
Finally, using the GEO BON strategy for development of EBVs [83], the integration of remote sensing with emerging tools appear as necessary to operationalise EBVs (Table 3). The complementary nature of the monitoring approaches highlights that synergy is required between the approaches to up/downscale observations between different spatiotemporal and taxonomic scales. EBV candidates such as species distribution, population abundance, net primary productivity, and habitat structure will benefit from such synergies. However, issues related with data standards, uncertainties, documentation of protocols and guidance, data sharing, as well as consensus on the usability of EBV derived products need to be dealt with to enable consistent global reporting of biodiversity changes using EBVs.
5. Future Directions and Recommendations
Our review has shown that the potential of some of the most recent technologies for monitoring biodiversity dynamics in tropical forests has been initially investigated but still needs to be explored further—notably their operational synergy across biophysical scales and extended taxonomic levels. This underlines the need to support further research and development activities to demonstrate the added value of such technologies; and learn from existing efforts such as the National Ecological Observatory Network (http://www.neonscience.org). Networks like GEO BON could, for instance, influence the formulation of research calls targeted specifically at closing such research and development gaps. To this end, the development of a Technology Readiness Level (TRL) framework could be initiated. Such TRLs could also be used to monitor scientific and technical progress and provide guidance to countries for the development of their monitoring systems. For instance, the GEO BON could build on the assessment framework for tropical forest monitoring developed by the Global Forest Observations Initiative (GFOI).
The lack of integration of the novel technologies also stresses the necessity to link up the different research communities that work on tropical forest environments. Different policy contexts with overlapping requirements co-exist, such as climate change mitigation and adaptation from the United Nations Framework Convention on Climate Change, but also the UN SDGs. More particularly, experts in the fields of genomics, Earth observation and information technology fields need to strengthen collaborations to tackle the challenges of the big-data era. In this context, successful efforts from the research community to incentivise free and open access to Earth observation data need to be maintained. Finally, guidance documents synthesising the operational monitoring methods and reviewing the state-of-the-art research should be developed. An appropriate platform for achieving this is the BON-in-a-Box concept tool (https://boninabox.geobon.org/) supported by the GEO initiative. One recent bon-in-a-box release is the sourcebook for biodiversity monitoring in tropical forests with SRS developed by GOFC-GOLD and the GEO BON presents techniques related to EBVs relevant to tropical forests [85].
Supplementary Materials
The following are available online at www.mdpi.com/2072-4292/9/10/1059/s1. List of systematically reviewed articles and their biodiversity monitoring details across the essential biodiversity components considered.
Acknowledgments
The authors extend appreciation to Maria Joao Ferreira Dos Santos for support in developing the synthesis on the operationalisation of EBVs. This research was supported by The Netherlands Fellowship Programmes (NFP) grant.
Author Contributions
Kalkidan Mulatu, Martin Herold, Brice Mora and Lammert Kooistra conceived the ideas and designed the methodology; Kalkidan Mulatu collected and analysed the data; Kalkidan Mulatu led the writing of the manuscript. All authors contributed critically to the drafts and gave final approval for publication.
Conflicts of Interest
The authors declare no conflict of interest.
References
- Barlow, J.; Lennox, G.D.; Ferreira, J.; Berenguer, E.; Lees, A.C.; Mac Nally, R.; Thomson, J.R.; de Barros Ferraz, S.F.; Louzada, J.; Oliveira, V.H.F. Anthropogenic disturbance in tropical forests can double biodiversity loss from deforestation. Nature 2016, 535, 144–147. [Google Scholar] [CrossRef] [PubMed]
- Turnhout, E.; Gupta, A.; Weatherley-Singh, J.; Vijge, M.J.; De Koning, J.; Visseren-Hamakers, I.J.; Herold, M.; Lederer, M. Envisioning redd+ in a post-paris era: Between evolving expectations and current practice. Wiley Interdiscip. Rev. Clim. Chang. 2016. [Google Scholar] [CrossRef]
- Thomas, S.C.; Baltzer, J.L. Tropical forests. In eLS; John Wiley & Sons, Inc.: Hoboken, NJ, USA, 2001. [Google Scholar]
- Bonan, G.B. Forests and climate change: Forcings, feedbacks, and the climate benefits of forests. Science 2008, 320, 1444–1449. [Google Scholar] [CrossRef] [PubMed]
- Malhi, Y.; Gardner, T.A.; Goldsmith, G.R.; Silman, M.R.; Zelazowski, P. Tropical forests in the anthropocene. In Annual Review of Environment and Resources; Gadgil, A., Liverman, D.M., Eds.; Annual Reviews: Palo Alto, CA, USA, 2014; Volume 39, pp. 125–159. [Google Scholar]
- Herold, M.; Román-Cuesta, R.; Heymell, V.; Hirata, Y.; Van Laake, P.; Asner, G.; Souza, C.; Avitabile, V.; MacDicken, K. A review of methods to measure and monitor historical carbon emissions from forest degradation. Unasylva 2011, 62, 238. [Google Scholar]
- Romijn, E.; Lantican, C.B.; Herold, M.; Lindquist, E.; Ochieng, R.; Wijaya, A.; Murdiyarso, D.; Verchot, L. Assessing change in national forest monitoring capacities of 99 tropical countries. For. Ecol. Manag. 2015, 352, 109–123. [Google Scholar] [CrossRef]
- Scholes, R.J.; Walters, M.; Turak, E.; Saarenmaa, H.; Heip, C.H.; Tuama, É.Ó.; Faith, D.P.; Mooney, H.A.; Ferrier, S.; Jongman, R.H. Building a global observing system for biodiversity. Curr. Opin. Environ. Sustain. 2012, 4, 139–146. [Google Scholar] [CrossRef]
- Vié, J.-C.; Hilton-Taylor, C.; Stuart, S.N. Wildlife in a Changing World: An Analysis of the 2008 IUCN Red List of Threatened Species; IUCN: Gland, Switerland, 2009. [Google Scholar]
- Convention on Biological Diversity (CBD). Decision X/2. In The Strategic Plan for Biodiversity 2011–2020 and the Aichi Biodiversity Targets 18 to 29 October 2010; Convention on Biological Diversity: Nagoya, Japan, 2010. [Google Scholar]
- Convention on Biological Diversity (CBD). Handbook of the Convention on Biological Diversity; Earthscan: London, UK, 2001; Volume 1. [Google Scholar]
- Transforming Our World: The 2030 Agenda for Sustainable. Available online: https://sustainabledevelopment.un.org/post2015/transformingourworld (accessed on 26 June 2017).
- United Nations (UN). Available online: http://www.un.org/sustainabledevelopment/development-agenda/ (accessed on 26 June 2017).
- Pereira, H.M.; Ferrier, S.; Walters, M.; Geller, G.; Jongman, R.; Scholes, R.; Bruford, M.; Brummitt, N.; Butchart, S.; Cardoso, A. Essential biodiversity variables. Science 2013, 339, 277–278. [Google Scholar] [CrossRef] [PubMed] [Green Version]
- Kissling, W.D.; Ahumada, J.A.; Bowser, A.; Fernandez, M.; Fernández, N.; García, E.A.; Guralnick, R.P.; Isaac, N.J.; Kelling, S.; Los, W. Building essential biodiversity variables (ebvs) of species distribution and abundance at a global scale. Biol. Rev. Camb. Philos. Soc. 2017. [Google Scholar] [CrossRef] [PubMed]
- Newbold, T.; Hudson, L.N.; Phillips, H.R.; Hill, S.L.; Contu, S.; Lysenko, I.; Blandon, A.; Butchart, S.H.; Booth, H.L.; Day, J. A global model of the response of tropical and sub-tropical forest biodiversity to anthropogenic pressures. Proc. Biol. Sci. 2014, 281, 20141371. [Google Scholar] [CrossRef] [PubMed]
- Lee, P.S.; Sing, K.W.; Wilson, J.J. Reading mammal diversity from flies: The persistence period of amplifiable mammal mtdna in blowfly guts (chrysomya megacephala) and a new DNA mini-barcode target. PLoS ONE 2015, 10, e0123871. [Google Scholar] [CrossRef] [PubMed]
- Thomsen, P.F.; Willerslev, E. Environmental DNA—An emerging tool in conservation for monitoring past and present biodiversity. Biol. Conserv. 2015, 183, 4–18. [Google Scholar] [CrossRef]
- Bush, A.; Sollmann, R.; Wilting, A.; Bohmann, K.; Cole, B.; Balzter, H.; Martius, C.; Zlinszky, A.; Calvignac-Spencer, S.; Cobbold, C.A. Connecting earth observation to high-throughput biodiversity data. Nat. Ecol. Evol. 2017, 1, 176. [Google Scholar] [CrossRef] [PubMed]
- Marvin, D.C.; Koh, L.P.; Lynam, A.J.; Wich, S.; Davies, A.B.; Krishnamurthy, R.; Stokes, E.; Starkey, R.; Asner, G.P. Integrating technologies for scalable ecology and conservation. Glob. Ecol. Conserv. 2016, 7, 262–275. [Google Scholar] [CrossRef]
- Pimm, S.L.; Alibhai, S.; Bergl, R.; Dehgan, A.; Giri, C.; Jewell, Z.; Joppa, L.; Kays, R.; Loarie, S. Emerging technologies to conserve biodiversity. Trends Ecol. Evol. 2015, 30, 685–696. [Google Scholar] [CrossRef] [PubMed]
- Lausch, A.; Bannehr, L.; Beckmann, M.; Boehm, C.; Feilhauer, H.; Hacker, J.M.; Heurich, M.; Jung, A.; Klenke, R.; Neumann, C.; et al. Linking earth observation and taxonomic, structural and functional biodiversity: Local to ecosystem perspectives. Ecol. Indic. 2016, 70, 317–339. [Google Scholar] [CrossRef]
- Lindenmayer, D.B.; Gibbons, P.; Bourke, M.; Burgman, M.; Dickman, C.R.; Ferrier, S.; Fitzsimons, J.; Freudenberger, D.; Garnett, S.T.; Groves, C. Improving biodiversity monitoring. Austral Ecol. 2012, 37, 285–294. [Google Scholar] [CrossRef]
- Kuenzer, C.; Ottinger, M.; Wegmann, M.; Guo, H.; Wang, C.; Zhang, J.; Dech, S.; Wikelski, M. Earth observation satellite sensors for biodiversity monitoring: Potentials and bottlenecks. Int. J. Remote Sens. 2014, 35, 6599–6647. [Google Scholar] [CrossRef]
- Rose, R.A.; Byler, D.; Eastman, J.R.; Fleishman, E.; Geller, G.; Goetz, S.; Guild, L.; Hamilton, H.; Hansen, M.; Headley, R. Ten ways remote sensing can contribute to conservation. Conserv. Biol. 2015, 29, 350–359. [Google Scholar] [CrossRef] [PubMed]
- Mildrexler, D.J.; Zhao, M.; Heinsch, F.A.; Running, S.W. A new satellite-based methodology for continental-scale disturbance detection. Ecol. Appl. 2007, 17, 235–250. [Google Scholar] [CrossRef]
- Butchart, S.H.; Walpole, M.; Collen, B.; Van Strien, A.; Scharlemann, J.P.; Almond, R.E.; Baillie, J.E.; Bomhard, B.; Brown, C.; Bruno, J. Global biodiversity: Indicators of recent declines. Science 2010, 328, 1164–1168. [Google Scholar] [CrossRef] [PubMed]
- Hansen, M.C.; Potapov, P.V.; Moore, R.; Hancher, M.; Turubanova, S.A.; Tyukavina, A.; Thau, D.; Stehman, S.V.; Goetz, S.J.; Loveland, T.R.; et al. High-resolution global maps of 21st-century forest cover change. Science 2013, 342, 850–853. [Google Scholar] [CrossRef] [PubMed]
- Schäfer, E.; Heiskanen, J.; Heikinheimo, V.; Pellikka, P. Mapping tree species diversity of a tropical montane forest by unsupervised clustering of airborne imaging spectroscopy data. Ecol. Indic. 2016, 64, 49–58. [Google Scholar] [CrossRef]
- Koh, L.; Wich, S. Dawn of drone ecology: Low-cost autonomous aerial vehicles for conservation. Trop. Conserv. Sci. 2012, 5, 121–132. [Google Scholar] [CrossRef] [Green Version]
- Calders, K.; Newnham, G.; Burt, A.; Murphy, S.; Raumonen, P.; Herold, M.; Culvenor, D.; Avitabile, V.; Disney, M.; Armston, J. Nondestructive estimates of above-ground biomass using terrestrial laser scanning. Methods Ecol. Evol. 2015, 6, 198–208. [Google Scholar] [CrossRef]
- Pettorelli, N.; Wegmann, M.; Skidmore, A.; Mücher, S.; Dawson, T.P.; Fernandez, M.; Lucas, R.; Schaepman, M.E.; Wang, T.; O’Connor, B. Framing the concept of satellite remote sensing essential biodiversity variables: Challenges and future directions. Remote Sens. Ecol. Conserv. 2016. [Google Scholar] [CrossRef]
- Riitters, K.; Wickham, J.; O’Neill, R.; Jones, K.B.; Smith, E. Global-scale patterns of forest fragmentation. Conserv. Ecol. 2000, 4, 3. [Google Scholar] [CrossRef]
- Riitters, K.; Wickham, J.; Costanza, J.K.; Vogt, P. A global evaluation of forest interior area dynamics using tree cover data from 2000 to 2012. Landsc. Ecol. 2016, 31, 137–148. [Google Scholar] [CrossRef] [Green Version]
- Kays, R.; Crofoot, M.C.; Jetz, W.; Wikelski, M. Terrestrial animal tracking as an eye on life and planet. Science 2015, 348, aaa2478. [Google Scholar] [CrossRef] [PubMed]
- Ji, Y.; Ashton, L.; Pedley, S.M.; Edwards, D.P.; Tang, Y.; Nakamura, A.; Kitching, R.; Dolman, P.M.; Woodcock, P.; Edwards, F.A. Reliable, verifiable and efficient monitoring of biodiversity via metabarcoding. Ecol. Lett. 2013, 16, 1245–1257. [Google Scholar] [CrossRef] [PubMed]
- Taberlet, P.; Coissac, E.; Pompanon, F.; Brochmann, C.; Willerslev, E. Towards next-generation biodiversity assessment using DNA metabarcoding. Mol. Ecol. 2012, 21, 2045–2050. [Google Scholar] [CrossRef] [PubMed]
- Turner, W. Sensing biodiversity. Science 2014, 346, 301–302. [Google Scholar] [CrossRef] [PubMed]
- Noss, R.F. Indicators for monitoring biodiversity: A hierarchical approach. Conserv. Biol. 1990, 4, 355–364. [Google Scholar] [CrossRef]
- CBD. What Is Forest Biological Diversity? Available online: http://www.fao.org/3/a-ac547e/y3582e02.htm (accessed on 26 June 2017).
- Whittaker, R.J.; Willis, K.J.; Field, R. Scale and species richness: Towards a general, hierarchical theory of species diversity. J. Biogeogr. 2001, 28, 453–470. [Google Scholar] [CrossRef]
- Beaudrot, L.; Ahumada, J.A.; O’Brien, T.; Alvarez-Loayza, P.; Boekee, K.; Campos-Arceiz, A.; Eichberg, D.; Espinosa, S.; Fegraus, E.; Fletcher, C.; et al. Standardized Assessment of Biodiversity Trends in Tropical Forest Protected Areas: The End Is Not in Sight. PLoS Biol. 2016, 14, e1002357. [Google Scholar] [CrossRef] [PubMed]
- Ellis, P.; Griscom, B.; Walker, W.; Goncalves, F.; Cormier, T. Mapping selective logging impacts in borneo with gps and airborne LiDAR. For. Ecol. Manag. 2016, 365, 184–196. [Google Scholar] [CrossRef]
- Rovero, F.; Martin, E.; Rosa, M.; Ahumada, J.A.; Spitale, D. Estimating species richness and modelling habitat preferences of tropical forest mammals from camera trap data. PLoS ONE 2014, 9, e103300. [Google Scholar] [CrossRef] [PubMed]
- Henle, K.; Potts, S.; Kunin, W.; Matsinos, Y.; Simila, J.; Pantis, J.; Grobelnik, V.; Penev, L.; Settele, J. Scaling in ecology and biodiversity conservation. Adv. Books 2014, 1, e1169. [Google Scholar]
- Rocchini, D. Seeing the unseen by remote sensing: Satellite imagery applied to species distribution modelling. J. Veg. Sci. 2013, 24, 209–210. [Google Scholar] [CrossRef]
- Pettorelli, N.; Laurance, W.F.; O’Brien, T.G.; Wegmann, M.; Nagendra, H.; Turner, W. Satellite remote sensing for applied ecologists: Opportunities and challenges. J. Appl. Ecol. 2014, 51, 839–848. [Google Scholar] [CrossRef]
- Haddad, N.M.; Brudvig, L.A.; Clobert, J.; Davies, K.F.; Gonzalez, A.; Holt, R.D.; Lovejoy, T.E.; Sexton, J.O.; Austin, M.P.; Collins, C.D.; et al. Habitat fragmentation and its lasting impact on earth’s ecosystems. Sci. Adv. 2015, 1, e1500052. [Google Scholar] [CrossRef] [PubMed]
- Fretwell, P.T.; LaRue, M.A.; Morin, P.; Kooyman, G.L.; Wienecke, B.; Ratcliffe, N.; Fox, A.J.; Fleming, A.H.; Porter, C.; Trathan, P.N. An emperor penguin population estimate: The first global, synoptic survey of a species from space. PLoS ONE 2012, 7, e33751. [Google Scholar] [CrossRef]
- Anderson, K.; Gaston, K.J. Lightweight unmanned aerial vehicles will revolutionize spatial ecology. Front. Ecol. Environ. 2013, 11, 138–146. [Google Scholar] [CrossRef]
- Blumstein, D.T.; Mennill, D.J.; Clemins, P.; Girod, L.; Yao, K.; Patricelli, G.; Deppe, J.L.; Krakauer, A.H.; Clark, C.; Cortopassi, K.A. Acoustic monitoring in terrestrial environments using microphone arrays: Applications, technological considerations and prospectus. J. Appl. Ecol. 2011, 48, 758–767. [Google Scholar] [CrossRef]
- Yu, X.; Wang, J.; Kays, R.; Jansen, P.A.; Wang, T.; Huang, T. Automated identification of animal species in camera trap images. EURASIP J. Image Video Process. 2013, 2013, 1–10. [Google Scholar] [CrossRef]
- Yu, D.W.; Ji, Y.; Emerson, B.C.; Wang, X.; Ye, C.; Yang, C.; Ding, Z. Biodiversity soup: Metabarcoding of arthropods for rapid biodiversity assessment and biomonitoring. Methods Ecol. Evol. 2012, 3, 613–623. [Google Scholar] [CrossRef]
- Hänfling, B.; Lawson Handley, L.; Read, D.S.; Hahn, C.; Li, J.; Nichols, P.; Blackman, R.C.; Oliver, A.; Winfield, I.J. Environmental DNA metabarcoding of lake fish communities reflects long-term data from established survey methods. Mol. Ecol. 2016. [Google Scholar] [CrossRef] [PubMed]
- Willerslev, E.; Davison, J.; Moora, M.; Zobel, M.; Coissac, E.; Edwards, M.E.; Lorenzen, E.D.; Vestergard, M.; Gussarova, G.; Haile, J.; et al. Fifty thousand years of arctic vegetation and megafaunal diet. Nature 2014, 506, 47–51. [Google Scholar] [CrossRef] [PubMed]
- Collins, R.; Cruickshank, R. The seven deadly sins of DNA barcoding. Mol. Ecol. Resour. 2013, 13, 969–975. [Google Scholar] [CrossRef] [PubMed]
- Proença, V.; Martin, L.J.; Pereira, H.M.; Fernandez, M.; McRae, L.; Belnap, J.; Böhm, M.; Brummitt, N.; García-Moreno, J.; Gregory, R.D. Global biodiversity monitoring: From data sources to essential biodiversity variables. Biol. Conserv. 2016, 213, 256–263. [Google Scholar] [CrossRef]
- Sanderson, J. Tropical ecology, assessment and monitoring initiative. Camera phototrapping monitoring protocol. Database 2015, 2015, bav054. [Google Scholar]
- Kattge, J.; Diaz, S.; Lavorel, S.; Prentice, I.C.; Leadley, P.; Bönisch, G.; Garnier, E.; Westoby, M.; Reich, P.B.; Wright, I.J. Try—A global database of plant traits. Philos. Trans. R. Soc. B Biol. Sci. 2010, 365, 3709–3718. [Google Scholar] [CrossRef] [Green Version]
- Baker, E.; Price, B.W.; Rycroft, S.D.; Hill, J.; Smith, V.S. Bioacoustica: A free and open repository and analysis platform for bioacoustics. Database 2015, 2015, bav054. [Google Scholar] [CrossRef] [PubMed]
- Morris, R.J. Anthropogenic impacts on tropical forest biodiversity: A network structure and ecosystem functioning perspective. Glob. Chang. Biol. 2011, 17, 2905–2935. [Google Scholar] [CrossRef] [PubMed]
- De Sy, V.; Herold, M.; Achard, F.; Asner, G.P.; Held, A.; Kellndorfer, J.; Verbesselt, J. Synergies of multiple remote sensing data sources for redd+ monitoring. Curr. Opin. Environ. Sustain. 2012, 4, 696–706. [Google Scholar] [CrossRef]
- Sexton, J.O.; Song, X.-P.; Feng, M.; Noojipady, P.; Anand, A.; Huang, C.; Kim, D.-H.; Collins, K.M.; Channan, S.; DiMiceli, C. Global, 30-m resolution continuous fields of tree cover: Landsat-based rescaling of modis vegetation continuous fields with LiDAR-based estimates of error. Int. J. Digit. Earth 2013, 6, 427–448. [Google Scholar] [CrossRef]
- Peres, C.A.; Barlow, J.; Laurance, W.F. Detecting anthropogenic disturbance in tropical forests. Trends Ecol. Evol. 2006, 21, 227–229. [Google Scholar] [CrossRef] [PubMed]
- Souza, J.L.P.; Baccaro, F.B.; Landeiro, V.L.; Franklin, E.; Magnusson, W.E.; Pequeno, P.A.C.L.; Fernandes, I.O. Taxonomic sufficiency and indicator taxa reduce sampling costs and increase monitoring effectiveness for ants. Divers. Distrib. 2016, 22, 111–122. [Google Scholar] [CrossRef]
- Mant, R.; Perry, E.; Heath, M.; Munroe, R.; Väänänen, E.; Großheim, C.; Kümper-Schlake, L. Addressing Climate Change—Why Biodiversity Matters; UNEP-WCMC: Cambridge, UK, 2014. [Google Scholar]
- Talbot, J.D. Carbon and Biodiversity Relationships in Tropical Forests. Available online: http://www.biotrade.org/congress/BackgroundDocs2/EI/UNREDD%20docs/Carbon%20&%20biodiversity%20relationships%20in%20tropical%20forests.pdf (accessed on 26 June 2017).
- Poorter, L.; Sande, M.; Thompson, J.; Arets, E.; Alarcón, A.; Álvarez-Sánchez, J.; Ascarrunz, N.; Balvanera, P.; Barajas-Guzmán, G.; Boit, A. Diversity enhances carbon storage in tropical forests. Glob. Ecol. Biogeogr. 2015, 24, 1314–1328. [Google Scholar] [CrossRef]
- Bustamante, M.; Roitman, I.; Aide, T.M.; Alencar, A.; Anderson, L.O.; Aragão, L.; Asner, G.P.; Barlow, J.; Berenguer, E.; Chambers, J. Toward an integrated monitoring framework to assess the effects of tropical forest degradation and recovery on carbon stocks and biodiversity. Glob. Chang. Biol. 2016, 22, 92–109. [Google Scholar] [CrossRef] [PubMed]
- Leblanc, G.; Francis, C.M.; Soffer, R.; Kalacska, M.; de Gea, J. Spectral reflectance of polar bear and other large arctic mammal pelts; potential applications to remote sensing surveys. Remote Sens. 2016, 8, 273. [Google Scholar] [CrossRef]
- Yang, Z.; Wang, T.; Skidmore, A.K.; de Leeuw, J.; Said, M.Y.; Freer, J. Spotting east african mammals in open savannah from space. PLoS ONE 2015, 9, e115989. [Google Scholar] [CrossRef] [PubMed]
- Thenkabail, P.S.; Lyon, J.G.; Huete, A. Hyperspectral Remote Sensing of Vegetation; CRC Press: Abingdon, UK, 2016. [Google Scholar]
- Badreldin, N.; Sanchez-Azofeifa, A. Estimating forest biomass dynamics by integrating multi-temporal landsat satellite images with ground and airborne LiDAR data in the coal valley mine, Alberta, Canada. Remote Sens. 2015, 7, 2832–2849. [Google Scholar] [CrossRef]
- Ioki, K.; Tsuyuki, S.; Hirata, Y.; Phua, M.H.; Wong, W.V.C.; Ling, Z.Y.; Johari, S.A.; Korom, A.; James, D.; Saito, H.; et al. Evaluation of the similarity in tree community composition in a tropical rainforest using airborne LiDAR data. Remote Sens. Environ. 2016, 173, 304–313. [Google Scholar] [CrossRef]
- O’Brien, T.G.; Baillie, J.E.M.; Krueger, L.; Cuke, M. The wildlife picture index: Monitoring top trophic levels. Anim. Conserv. 2010, 13, 335–343. [Google Scholar] [CrossRef]
- Peplow, M. Social sciences suffer from severe publication bias. Nature 2014. [Google Scholar] [CrossRef]
- Lortie, C.; Aarssen, L.; Budden, A.; Koricheva, J.; Leimu, R.; Tregenza, T. Publication bias and merit in ecology. Oikos 2007, 116, 1247–1253. [Google Scholar] [CrossRef]
- Pardieck, K.L.; Ziolkowski, D.J., Jr.; Lutmerding, M.; Campbell, K.; Hudson, M.-A.R. North American Breeding Bird Survey Dataset 1966–2015. Available online: https://www.mbr-pwrc.usgs.gov/bbs/BBS_Results_and_Analysis_2015.html (accessed on 26 June 2017).
- Sullivan, B.L.; Wood, C.L.; Iliff, M.J.; Bonney, R.E.; Fink, D.; Kelling, S. Ebird: A citizen-based bird observation network in the biological sciences. Biol. Conserv. 2009, 142, 2282–2292. [Google Scholar] [CrossRef]
- Dutch Phenological Network. Available online: https://www.naturetoday.com/intl/en/observations/natuurkalender (accessed on 26 June 2017).
- Nature and Biodiversity Conservation Union. Available online: https://www.nabu.de/imperia/md/content/nabude/nabu/jobs/nabu_agrobiodiv_study_ethiopia.pdf (accessed on 26 June 2017).
- Honrado, J.P.; Pereira, H.M.; Guisan, A. Fostering integration between biodiversity monitoring and modelling. J. Appl. Ecol. 2016, 53, 1299–1304. [Google Scholar] [CrossRef]
- GEO-BON. GEO BON Strategy for Development of Essential Biodiversity Variables. Available online: http://geobon.org/Downloads/Other_documents/Essential_Biodiversity_Variable_Strategy_v2.pdf (accessed on 26 June 2017).
- Skidmore, A.K.; Pettorelli, N. Agree on biodiversity metrics to track from space: Ecologists and space agencies must forge a global monitoring strategy. Nature 2015, 523, 403–406. [Google Scholar] [CrossRef] [PubMed]
- GOFC-GOLD. A Sourcebook of Methods and Procedures for Monitoring Essential Biodiversity Variables in Tropical Forests with Remote Sensing. In Report Version UNCBD COP-13; GOFC-GOLD Land Cover Project Office, Wageningen University: Wageningen, The Netherlands, 2017. [Google Scholar]
- Rocchini, D.; Boyd, D.S.; Féret, J.-B.; Foody, G.M.; He, K.S.; Lausch, A.; Nagendra, H.; Wegmann, M.; Pettorelli, N. Satellite remote sensing to monitor species diversity: Potential and pitfalls. Remote Sens. Ecol. Conserv. 2016, 2, 25–36. [Google Scholar] [CrossRef]
- Pettorelli, N.; Schulte to Bühne, H.; Tulloch, A.; Dubois, G.; Macinnis-Ng, C.; Queirós, A.M.; Keith, D.A.; Wegmann, M.; Schrodt, F.; Stellmes, M. Satellite remote sensing of ecosystem functions: Opportunities, challenges and way forward. Remote Sens. Ecol. Conserv. 2017. [Google Scholar] [CrossRef]
- Mora, B.; Szantoi, Z.; Heiden, U. Available online: http://elib.dlr.de/112264/1/BiodiversitySourcebook.pdf (accessed on 26 June 2017).
- Carlson, K.M.; Asner, G.P.; Hughes, R.F.; Ostertag, R.; Martin, R.E. Hyperspectral remote sensing of canopy biodiversity in Hawaiian lowland rainforests. Ecosystems 2007, 10, 536–549. [Google Scholar] [CrossRef]
- Ahumada, J.A.; Silva, C.E.; Gajapersad, K.; Hallam, C.; Hurtado, J.; Martin, E.; McWilliam, A.; Mugerwa, B.; O’Brien, T.; Rovero, F. Community structure and diversity of tropical forest mammals: Data from a global camera trap network. Philos. Trans. R. Soc. B-Biol. Sci. 2011, 366, 2703–2711. [Google Scholar] [CrossRef] [PubMed]
- Yao, W.; Krzystek, P.; Heurich, M. Tree species classification and estimation of stem volume and dbh based on single tree extraction by exploiting airborne full-waveform LiDAR data. Remote Sens. Environ. 2012, 123, 368–380. [Google Scholar] [CrossRef]
- Fisher, J.I.; Mustard, J.F.; Vadeboncoeur, M.A. Green leaf phenology at landsat resolution: Scaling from the field to the satellite. Remote Sens. Environ. 2006, 100, 265–279. [Google Scholar] [CrossRef]
- Atkinson, P.M.; Jeganathan, C.; Dash, J.; Atzberger, C. Inter-comparison of four models for smoothing satellite sensor time-series data to estimate vegetation phenology. Remote Sens. Environ. 2012, 123, 400–417. [Google Scholar] [CrossRef]
- Jay, S.; Potter, C.; Crabtree, R.; Genovese, V.; Weiss, D.J.; Kraft, M. Evaluation of modelled net primary production using modis and landsat satellite data fusion. Carbon Balance Manag. 2016, 11, 8. [Google Scholar] [CrossRef] [PubMed]
- Cleveland, C.C.; Taylor, P.; Chadwick, K.D.; Dahlin, K.; Doughty, C.E.; Malhi, Y.; Smith, W.K.; Sullivan, B.W.; Wieder, W.R.; Townsend, A.R. A comparison of plot-based satellite and earth system model estimates of tropical forest net primary production. Glob. Biogeochem. Cycles 2015, 29, 626–644. [Google Scholar] [CrossRef]
- Smith, M.-L.; Ollinger, S.V.; Martin, M.E.; Aber, J.D.; Hallett, R.A.; Goodale, C.L. Direct estimation of aboveground forest productivity through hyperspectral remote sensing of canopy nitrogen. Ecol. Appl. 2002, 12, 1286–1302. [Google Scholar] [CrossRef]
- Verma, M.; Friedl, M.A.; Law, B.; Bonal, D.; Kiely, G.; Black, T.; Wohlfahrt, G.; Moors, E.J.; Montagnani, L.; Marcolla, B. Improving the performance of remote sensing models for capturing intra-and inter-annual variations in daily gpp: An analysis using global fluxnet tower data. Agric. For. Meteorol. 2015, 214, 416–429. [Google Scholar] [CrossRef]
- Flores, B.M.; Piedade, M.-T.F.; Nelson, B.W. Fire disturbance in amazonian blackwater floodplain forests. Plant Ecol. Divers. 2014, 7, 319–327. [Google Scholar] [CrossRef]
- Jin, S.; Sader, S.A. Modis time-series imagery for forest disturbance detection and quantification of patch size effects. Remote Sens. Environ. 2005, 99, 462–470. [Google Scholar] [CrossRef]
- Ngoprasert, D.; Lynam, A.J.; Gale, G.A. Human disturbance affects habitat use and behaviour of asiatic leopard panthera pardus in kaeng krachan national park, Thailand. Oryx 2007, 41, 343–351. [Google Scholar] [CrossRef]
- Hansen, M.C.; Potapov, P.V.; Goetz, S.J.; Turubanova, S.; Tyukavina, A.; Krylov, A.; Kommareddy, A.; Egorov, A. Mapping tree height distributions in sub-saharan africa using landsat 7 and 8 data. Remote Sens. Environ. 2016, 185, 221–232. [Google Scholar] [CrossRef]
- Tuanmu, M.N.; Jetz, W. A global, remote sensing-based characterization of terrestrial habitat heterogeneity for biodiversity and ecosystem modelling. Glob. Ecol. Biogeogr. 2015, 24, 1329–1339. [Google Scholar] [CrossRef]
- Simonson, W.D.; Allen, H.D.; Coomes, D.A. Applications of airborne LiDAR for the assessment of animal species diversity. Methods Ecol. Evol. 2014, 5, 719–729. [Google Scholar] [CrossRef]
- Betbeder, J.; Hubert-Moy, L.; Burel, F.; Corgne, S.; Baudry, J. Assessing ecological habitat structure from local to landscape scales using synthetic aperture radar. Ecol. Indic. 2015, 52, 545–557. [Google Scholar] [CrossRef] [Green Version]
- Leblanc, S.G.; Fournier, R.A. Measurement of forest structure with hemispherical photography. In Hemispherical Photography in Forest Science: Theory, Methods, Applications; Springer: Berlin, Germany, 2017; pp. 53–83. [Google Scholar]
- Lehner, B.; Döll, P. Development and validation of a global database of lakes, reservoirs and wetlands. J. Hydrol. 2004, 296, 1–22. [Google Scholar] [CrossRef]
- Bruford, M.W.; Davies, N.; Dulloo, M.E.; Faith, D.P.; Walters, M. Monitoring changes in genetic diversity. In The GEO Handbook on Biodiversity Observation Networks; Walters, M., Scholes, R.J., Eds.; Springer International Publishing: Berlin, Germany, 2017; pp. 107–128. [Google Scholar]
- Vihervaara, P.; Auvinen, A.-P.; Mononen, L.; Törmä, M.; Ahlroth, P.; Anttila, S.; Böttcher, K.; Forsius, M.; Heino, J.; Heliölä, J. How essential biodiversity variables and remote sensing can help national biodiversity monitoring. Glob. Ecol. Conserv. 2017, 10, 43–59. [Google Scholar] [CrossRef]
- Obrist, M.K.; Pavan, G.; Sueur, J.; Riede, K.; Llusia, D.; Márquez, R. Bioacoustics approaches in biodiversity inventories. Abc Taxa 2010, 8, 68–99. [Google Scholar]
- Pereira, H.M.; Belnap, J.; Böhm, M.; Brummitt, N.; Garcia-Moreno, J.; Gregory, R.; Martin, L.; Peng, C.; Proença, V.; Schmeller, D.; et al. Monitoring essential biodiversity variables at the species level. In The GEO Handbook on Biodiversity Observation Networks; Walters, M., Scholes, R.J., Eds.; Springer International Publishing: Berlin, Germany, 2017; pp. 79–105. [Google Scholar]
- Rocchini, D.; Foody, G.M.; Nagendra, H.; Ricotta, C.; Anand, M.; He, K.S.; Amici, V.; Kleinschmit, B.; Förster, M.; Schmidtlein, S. Uncertainty in ecosystem mapping by remote sensing. Comput. Geosci. 2013, 50, 128–135. [Google Scholar] [CrossRef]
- Wrege, P.H.; Rowland, E.D.; Keen, S.; Shiu, Y. Acoustic monitoring for conservation in tropical forests: Examples from forest elephants. Methods Ecol. Evol. 2017. [Google Scholar] [CrossRef]
- Bucklin, A.; Lindeque, P.K.; Rodriguez-Ezpeleta, N.; Albaina, A.; Lehtiniemi, M. Metabarcoding of marine zooplankton: Prospects, progress and pitfalls. J. Plankton Res. 2016, 38, 393–400. [Google Scholar] [CrossRef]
- Paganini, M.; Leidner, A.K.; Geller, G.; Turner, W.; Wegmann, M. The role of space agencies in remotely sensed essential biodiversity variables. Remote Sens. Ecol. Conserv. 2016, 2, 132–140. [Google Scholar] [CrossRef]
- Geller, G.N.; Halpin, P.N.; Helmuth, B.; Hestir, E.L.; Skidmore, A.; Abrams, M.J.; Aguirre, N.; Blair, M.; Botha, E.; Colloff, M.; et al. Remote sensing for biodiversity. In The GEO Handbook on Biodiversity Observation Networks; Walters, M., Scholes, R.J., Eds.; Springer International Publishing: Berlin, Germany, 2017; pp. 187–210. [Google Scholar]
- Creer, S.; Deiner, K.; Frey, S.; Porazinska, D.; Taberlet, P.; Thomas, W.K.; Potter, C.; Bik, H.M. The ecologist’s field guide to sequence-based identification of biodiversity. Methods Ecol. Evol. 2016, 7, 1008–1018. [Google Scholar] [CrossRef]
- Jahn, O.; Ganchev, T.D.; Marques, M.I.; Schuchmann, K.-L. Automated sound recognition provides insights into the behavioral ecology of a tropical bird. PLoS ONE 2017, 12, e0169041. [Google Scholar] [CrossRef] [PubMed]
- Jeliazkov, A.; Bas, Y.; Kerbiriou, C.; Julien, J.-F.; Penone, C.; Le Viol, I. Large-scale semi-automated acoustic monitoring allows to detect temporal decline of bush-crickets. Glob. Ecol. Conserv. 2016, 6, 208–218. [Google Scholar] [CrossRef]
- O’Brien, T. On the use of automated cameras to estimate species richness for large-and medium-sized rainforest mammals. Anim. Conserv. 2008, 11, 179–181. [Google Scholar] [CrossRef]
- Ivanova, N.V.; Dewaard, J.R.; Hebert, P.D. An inexpensive, automation-friendly protocol for recovering high-quality DNA. Mol. Ecol. Resour. 2006, 6, 998–1002. [Google Scholar] [CrossRef]
- Forrester, T.; O’Brien, T.; Fegraus, E.; Jansen, P.A.; Palmer, J.; Kays, R.; Ahumada, J.; Stern, B.; McShea, W. An open standard for camera trap data. Biodivers. Data J. 2016. [Google Scholar] [CrossRef] [PubMed]
- Roch, M.A.; Batchelor, H.; Baumann-Pickering, S.; Berchok, C.L.; Cholewiak, D.; Fujioka, E.; Garland, E.C.; Herbert, S.; Hildebrand, J.A.; Oleson, E.M. Management of acoustic metadata for bioacoustics. Ecol. Inform. 2016, 31, 122–136. [Google Scholar] [CrossRef] [Green Version]
- Ratnasingham, S.; Hebert, P.D. Bold: The barcode of life data system (http://www.barcodinglife.org). Mol. Ecol. Resour. 2007, 7, 355–364. [Google Scholar] [CrossRef] [PubMed]
- Aide, T.M.; Corrada-Bravo, C.; Campos-Cerqueira, M.; Milan, C.; Vega, G.; Alvarez, R. Real-time bioacoustics monitoring and automated species identification. PeerJ 2013, 1, e103. [Google Scholar] [CrossRef] [PubMed]
- Bohmann, K.; Evans, A.; Gilbert, M.T.P.; Carvalho, G.R.; Creer, S.; Knapp, M.; Douglas, W.Y.; de Bruyn, M. Environmental DNA for wildlife biology and biodiversity monitoring. Trends Ecol. Evol. 2014, 29, 358–367. [Google Scholar] [CrossRef] [PubMed]
Figure 1.
Criteria and categories defined to set up the review database.

Figure 2.
Spatial scale of studies and biodiversity monitoring techniques employed. Note: some studies address multiple spatial scales.
Figure 2.
Spatial scale of studies and biodiversity monitoring techniques employed. Note: some studies address multiple spatial scales.

Figure 3.
The use of monitoring methods for each disturbance type.

Figure 4.
Global distribution of forest biodiversity disturbance factors.

Figure 5.
Biodiversity groups monitored and monitoring techniques applied. Note: some studies addresses multiple biodiversity groups.
Figure 5.
Biodiversity groups monitored and monitoring techniques applied. Note: some studies addresses multiple biodiversity groups.

Figure 6.
Temporal trends towards incorporation of new biodiversity monitoring techniques.

Figure 7.
The use of new technologies and emerging opportunities in reviewed studies in relation to EBV classes. SAR: Synthetic aperture radar, LiDAR: Light Detection and Ranging. Note: some studies address multiple EBVs.
Figure 7.
The use of new technologies and emerging opportunities in reviewed studies in relation to EBV classes. SAR: Synthetic aperture radar, LiDAR: Light Detection and Ranging. Note: some studies address multiple EBVs.


Table 1.
Complementarity of monitoring methods for assessing biodiversity change in tropical forests along primary biodiversity attributes. Brown: suitable, Orange: very suitable, Green: ideal; up arrow: well exploited potential, horizontal arrow: potential reasonably exploited, down arrow: used insufficiently. Note: Monitoring methods are classified between in situ and remote sensing based on their data acquisition technique.
| Compositional Biodiversity | Functional Biodiversity | Structural Biodiversity | ||
|---|---|---|---|---|
| In situ | Established field survey |  |  |  |
| In situ activity sensors |  |  |  | |
| DNA Barcoding |  | | | |
| Citizen Science | | |  | |
| Remote sensing | Coarse to medium spatial resolution | | | |
| High to very high spatial resolution | | | | |
| Hyperspectral | | | | |
| SAR |  | | | |
| Airborne LiDAR | | | | |
| Terrestrial Laser Scanner | | | | |
Table 2.
State-of-the-art monitoring tools for tropical forest-relevant EBV candidates and related Aichi targets. SR: spatial resolution.
Table 2.
State-of-the-art monitoring tools for tropical forest-relevant EBV candidates and related Aichi targets. SR: spatial resolution.
| EBV Classes | EBV Candidates | Aichi Target [10] | Remote Sensing | Emerging Opportunities |
|---|---|---|---|---|
| Species Populations | Species distribution | 4–12, 14, 15 | High to very high SR [49], Hyperspectral [89] | In situ activity sensors [90] DNA barcoding [36] |
| Population abundance | 4–12, 14, 15 | High to very high SR [49], Hyperspectral [89] | In situ activity sensors [90] | |
| Population structure by age/size class | 4–12, 14, 15 | LiDAR [91] | ||
| Species Traits | Phenology | 10, 15 | High to very high SR [92], coarse to medium SR [93], hyperspectral [72] | |
| Migratory behaviour | 5, 6, 10, 11, 12 | In situ activity sensors [35] | ||
| Community Composition | Taxonomic diversity | 8, 10, 12, 14 | Hyperspectral [29] | In situ activity sensors DNA barcoding [36] |
| Ecosystem Function | Net primary productivity | 5, 8, 14 | High to very high SR [94], coarse to medium SR [95], hyperspectral [96] | In situ activity sensors [97] |
| Nutrient retention | 5, 8, 14 | Hyperspectral [96] | ||
| Disturbance regime | 5, 7, 9, 10, 11, 14, 15 | High to very high SR [98], coarse to medium SR [99] | In situ activity sensors [100] | |
| Ecosystem Structure | Habitat structure | 5, 11, 14, 15 | High to very high SR [101], coarse to medium SR [102], LiDAR [103], SAR [104] | In situ activity sensors [105] |
| Ecosystem extent and fragmentation | 5, 7, 10, 14, 15 | coarse to medium SR [106] |
Table 3.
The relevance of state-of-the-art monitoring approaches in the context of GEO BON strategy to operationalise EBVs. Colours represent readiness level for each subcategory. Brown = low level, Orange = medium level, Green = high level (adapted from GEO BON strategy for development of EBVs).
Table 3.
The relevance of state-of-the-art monitoring approaches in the context of GEO BON strategy to operationalise EBVs. Colours represent readiness level for each subcategory. Brown = low level, Orange = medium level, Green = high level (adapted from GEO BON strategy for development of EBVs).
| EBV Criteria Components | Remote Sensing | In Situ | DNA Barcoding |
|---|---|---|---|
| Spatial extent | Global [57] | Global with gaps. Example: TEAM network (http://www.teamnetwork.org/), http://bio.acousti.ca Bioacoustics [60] | Local/regional [107] |
| Spatial resolution | Optical satellite: coarse spatial resolution 250–1200 m (e.g., MODIS), Medium to high spatial resolution: 5–30 m (e.g., Landsat, sentinel 2, RapidEye), Very high spatial resolution (e.g., Ikonos, GeoEye): 0.5–4 m. Airborne Hyperspectral: 1–2 m (according to flight height). Active remote sensing (radar): 1–100 m [108]. Upcoming: GEDI (satellite LiDAR): 25 m footprint, EnMAP (satellite hyperspectral): 250 narrow bands [88] | Field based. Example: TEAM has 23 tropical forest sites (120–200 km2 resolution) [15] | Requires physical sampling [107] |
| Periodicity | Continuous long term time-series data, with high revisit-time period for high-resolution data (e.g., Landsat: every 16 days, Sentinel 2: every 10 days, RapidEye: Daily ) [108] | From real-time to different times of the day and seasons [109] | No clear understanding [107] |
| Taxonomic coverage | Multiple taxa can be covered [110] | Multiple taxa can be covered [110] | Multiple taxa can be covered [110] |
| uncertainty | Imperfect detections, data uncertainties, model uncertainties [111] | Measurement error, detection algorithms [112], spatial mismatches [69] | Reference datasets [15], variation in primer use, amplification steps and sequencing platforms [113] |
| Operational definition | Several demonstrations are made to derive EBVs [85,87,114,115] | The technology has been identified as candidate [57] | The technology has been identified as candidate [19,116] |
| Documentation | Documentations is available [85,87,115] | Lack of documentation and established protocols | Lack of documentation and established protocols |
| Abstraction | Few to several steps involved in derivation of products [85,87] | Few steps involved in derivation of products [110] | Several steps in derivation of products [116] |
| Measurement and sampling schema | Sampling and measuring strategies are often well defined [87] | Limited sampling and measuring strategies are available [14]. Camera traps: www.teamnetwork.org/protocols | Few sampling and measuring strategies are available [116] (www.biocodecommons.org/, www.gensc.org/) |
| Automatisation | Automation of data acquisition and processing is possible [115] | Automation of data acquisition, processing, and management are possible. Example: automated and semi-automated sound recognition [117,118], automated camera traps and image recognition [119] | Automated DNA extraction is possible [120] |
| Interoperability | Global standards and protocols exist for harmonised data and metadata formats (e.g., http://docs.opengeospatial.org/is/10-157r4/10-157r4.html) | Camera traps: individual initiatives exist [121], Bioacoustics: metadata standards are proposed [122] | Data standards are defined [123] |
| Data availability | Data available for multiple EBVs [85,87]. (e.g. https://scihub.copernicus.eu/dhus/#/home, https://gcmd.nasa.gov/, https://boninabox.geobon.org/) | Data mobilisation opportunities exist www.TEAMNetwork.org, http://bio.acousti.ca/, https://boninabox.geobon.org/, https://www.movebank.org/ | Data mobilisation opportunities exist http://www.barcodinglife.org, https://0-www-ncbi-nlm-nih-gov.brum.beds.ac.uk/, https://boninabox.geobon.org/ |
| Temporal sustainability | Data have been available from satellite agencies for 40 years now (e.g., Landsat) and is secured until the end of the 2020’s [108,114] | Data availability and methods are evolving [124] | Data availability and methods are evolving [18] |
| Baseline | Historical satellite datasets are available: e.g., Landsat program (since 1972) [108] | Baselines can be made from past field inventories [112] | Ancient DNA (e.g., from museum collections) [125], https://0-www-ncbi-nlm-nih-gov.brum.beds.ac.uk/ |
| Relevancy | Relevance for multiple EBVs has been demonstrated [87,108] | Relevance for multiple EBVs has been demonstrated [110,112] | Relevance for multiple EBVs has been demonstrated [107,110] |
| Consensus | Large consensus exists [85] | Consensus underway [110] | Consensus underway [107] |
| Scalability | Robust to scalability (e.g., diversity indices) [86] | Robust to scalability (e.g., Wildlife Picture Index) [75] | Robust to scalability using statistical models (e.g., species distribution models) [19] |
| Institutional support | Several institutions are contributing. Example: GEO BON (http://geobon.org/essential-biodiversity-variables/monitoring/), GOFC-GOLD: (http://www.gofcgold.wur.nl) | Several institutions are contributing. Example: GEO BON [14], Map Of Life (https://mol.org/), Move bank (https://www.movebank.org/) | GEO BON (http://geobon.org/essential-biodiversity-variables/monitoring/), GOFC-GOLD: (http://www.gofcgold.wur.nl) |
© 2017 by the authors. Licensee MDPI, Basel, Switzerland. This article is an open access article distributed under the terms and conditions of the Creative Commons Attribution (CC BY) license (http://creativecommons.org/licenses/by/4.0/).
Share and Cite
MDPI and ACS Style
Mulatu, K.A.; Mora, B.; Kooistra, L.; Herold, M. Biodiversity Monitoring in Changing Tropical Forests: A Review of Approaches and New Opportunities. Remote Sens. 2017, 9, 1059. https://0-doi-org.brum.beds.ac.uk/10.3390/rs9101059
AMA Style
Mulatu KA, Mora B, Kooistra L, Herold M. Biodiversity Monitoring in Changing Tropical Forests: A Review of Approaches and New Opportunities. Remote Sensing. 2017; 9(10):1059. https://0-doi-org.brum.beds.ac.uk/10.3390/rs9101059
Chicago/Turabian StyleMulatu, Kalkidan Ayele, Brice Mora, Lammert Kooistra, and Martin Herold. 2017. "Biodiversity Monitoring in Changing Tropical Forests: A Review of Approaches and New Opportunities" Remote Sensing 9, no. 10: 1059. https://0-doi-org.brum.beds.ac.uk/10.3390/rs9101059
Note that from the first issue of 2016, this journal uses article numbers instead of page numbers. See further details here.