Article

The Cooling Effect of Urban Parks and Its Monthly Variations in a Snow Climate City

1
Northeast Institute of Geography and Agroecology, Chinese Academy of Sciences, Changchun 130102, China
2
University of Chinese Academy of Sciences, No. 19A Yuquan Road, Beijing 100049, China
3
Department of Geography and Earth Sciences, University of North Carolina at Charlotte, Charlotte, NC 28223, USA
*
Author to whom correspondence should be addressed.
Remote Sens. 2017, 9(10), 1066; https://0-doi-org.brum.beds.ac.uk/10.3390/rs9101066
Submission received: 24 August 2017 / Revised: 4 October 2017 / Accepted: 15 October 2017 / Published: 19 October 2017

Abstract

:
Urban parks have been shown to form park cool islands (PCIs), which can effectively alleviate the negative influences of urban heat islands (UHI). However, few studies have examined the detailed characteristics of PCIs, the effect of urban park features on their individual temperatures, and monthly variation in PCIs. Land surface temperature (LST) retrieved from Landsat 8 TIR images between May and October were used to represent the thermal environment. Urban park characteristics were extracted from high-resolution GF-2 images. Using these datasets, the relationships between urban park characteristics and PCIs were explored in this study using Changchun, which has a snow climate, as a case study. The results showed the following: (1) the urban parks exhibited a cooling island effect, and the PCIs showed significant monthly variations with the highest intensities in the hot months; (2) the effects of composition (e.g., park size and the percentage of water area) on LSTs and PCIs showed significant monthly variability and were stronger than the configuration effects. Furthermore, an unexpected, negative correlation between PCIs and the area of park grass was also found; and (3) larger parks tended to have stronger PCI intensities and extents of influence. For parks larger than 30 ha, the cooling effects extended approximately 480 m from the park edge between June and August. For all of parks during the study duration, the rate of temperature increase was highest within 60 m from the park edge. The PCI we employ specifically in this study is characterized by LST.

Graphical Abstract

1. Introduction

Rapid urbanization has led to 54% of the world’s population residing in urban areas, with the percentage projected to reach 66% by 2050 [1]. This unprecedented process will inevitably lead to changes in the landscape patterns through the transformation of natural surfaces into dense, artificial buildings [2,3]. The differences in the thermal characteristics of natural and man-made environments result in the urban heat island (UHI), a phenomenon in which urban areas have higher temperatures than the surrounding environment [4,5]. The UHI negatively affects energy consumption, air quality, runoff, and human health, particularly for the poor and the old sections of society [6,7,8,9].
Urban parks which can provide important ecosystem services to ameliorate the impacts of urbanization, such as noise reduction, recreational facilities, microclimate regulation, and air pollution reduction, have been shown to significantly mitigate the UHI effect during the hot season [10,11,12,13,14,15]. The cooling effect of urban parks is also referred as “park cool island” (PCI) [16]. Urban parks are typically covered by a high percentage of vegetation and water. Vegetation with a lower emissivity than chemical material can have lower surface temperatures through higher evapotranspiration and/or shading processes [17,18]. The high heat capacity of water also contributes to the cooling effect. Therefore, the integration of urban parks in urban planning is vitally important to mitigate the UHI effects for surrounding populations.
There are two methods of conducting PCI research: in-situ observations and thermal infrared (TIR) remote sensing [19,20]. Traditionally, air temperature measurements were used to investigate the temperature reductions at park edges. However, the limited meteorological stations and/or air temperature measurement facilities restrict the ability of this method to examine the PCIs of all parks within an urban area. Recently, land surface temperature (LST) retrieved from thermal remote sensing has attracted attention among scientists [21,22]. The availability of high quality TIR images that provide a continuous and simultaneous view of the city, as well as mature LST retrieval algorithms, allow for the characterization of the urban thermal environment using LST [23,24,25]. However, similar to UHI studies, the intensity of PCI values varied considerably because of the different data resources [11,26,27,28]. In addition, the emergence of very high spatial resolution (prior 2 m) remote sensing images, such as Quickbird, IKONOS, and GF-2, allow for extraction and identification of park features, such as single trees [16,29,30]. The development of remote sensing has contributed much to the urban thermal environment studies.
Many studies have been conducted to explore the relationships between urban park characteristics and PCI [31,32,33,34]. Both the park composition and configuration can influence the observed cooling effect. Park size, park perimeter, percent woodland, and percent water bodies can significantly influence the PCI intensity [11,16]. Impervious surface area has shown a positive relationship with LST in previous studies [35,36]. However, the area of grass in parks has also shown a heating effect [16]. Landscape ecology methods that employ landscape metrics, such as landscape shape index, patch density, edge density, and fractal dimension, are used to characterize park features [37,38,39], with FRAGSTATS being the most popular method of calculation [40]. Due to the temporal differences in vegetation growth and radiation conditions, seasonal variation of the cooling effect has also been widely explored [30,41,42].
Despite the contributions of previous studies, deficiencies still exist in the literature. First, most studies only have explored the difference between the park and surrounding area temperatures at certain distances. Neither the PCI change nor the rate of temperature decrease with increasing distance from parks have been examined in detail [43]. Second, few studies have discussed the effects of urban park characteristics on park temperature, which affects the PCI intensity considerably. Additionally, information concerning the influence of the surrounding park environment on the PCI is sparse in the literature. Third, seasonal variations of PCI were common in temporal studies, and the results showed that the PCI was not significant during the winter [16]. However, studies that focus on PCI monthly variability are rare, impeding a comprehensive understanding of PCIs. Finally, studies in cities with a snow climate are needed to inform the theory and provide diverse data from different environmental conditions [44].
This study focuses on Changchun, China, a city with a snow climate. Based on the LST and urban park datasets retrieved from Landsat 8 TIR and GF-2 images, the specific objectives of this study were to: (1) analyze the spatial characteristics of the thermal environment and land use in parks within the study area; (2) explore the effects of urban park features on both park LSTs and PCIs; and (3) examine the monthly variations of PCI characteristics (i.e., PCI intensity, PCI extent, and PCI temperature gradient) by using qualitative and quantitative approaches in combination with geographical information system (GIS) and remote sensing. The aim of this study is to promote a further understanding of PCIs, to produce techniques for ameliorating the UHI effect, and to improve urban park design and planning. In our study, LST rather than air temperature was employed to characterize PCIs.

2. Materials and Methods
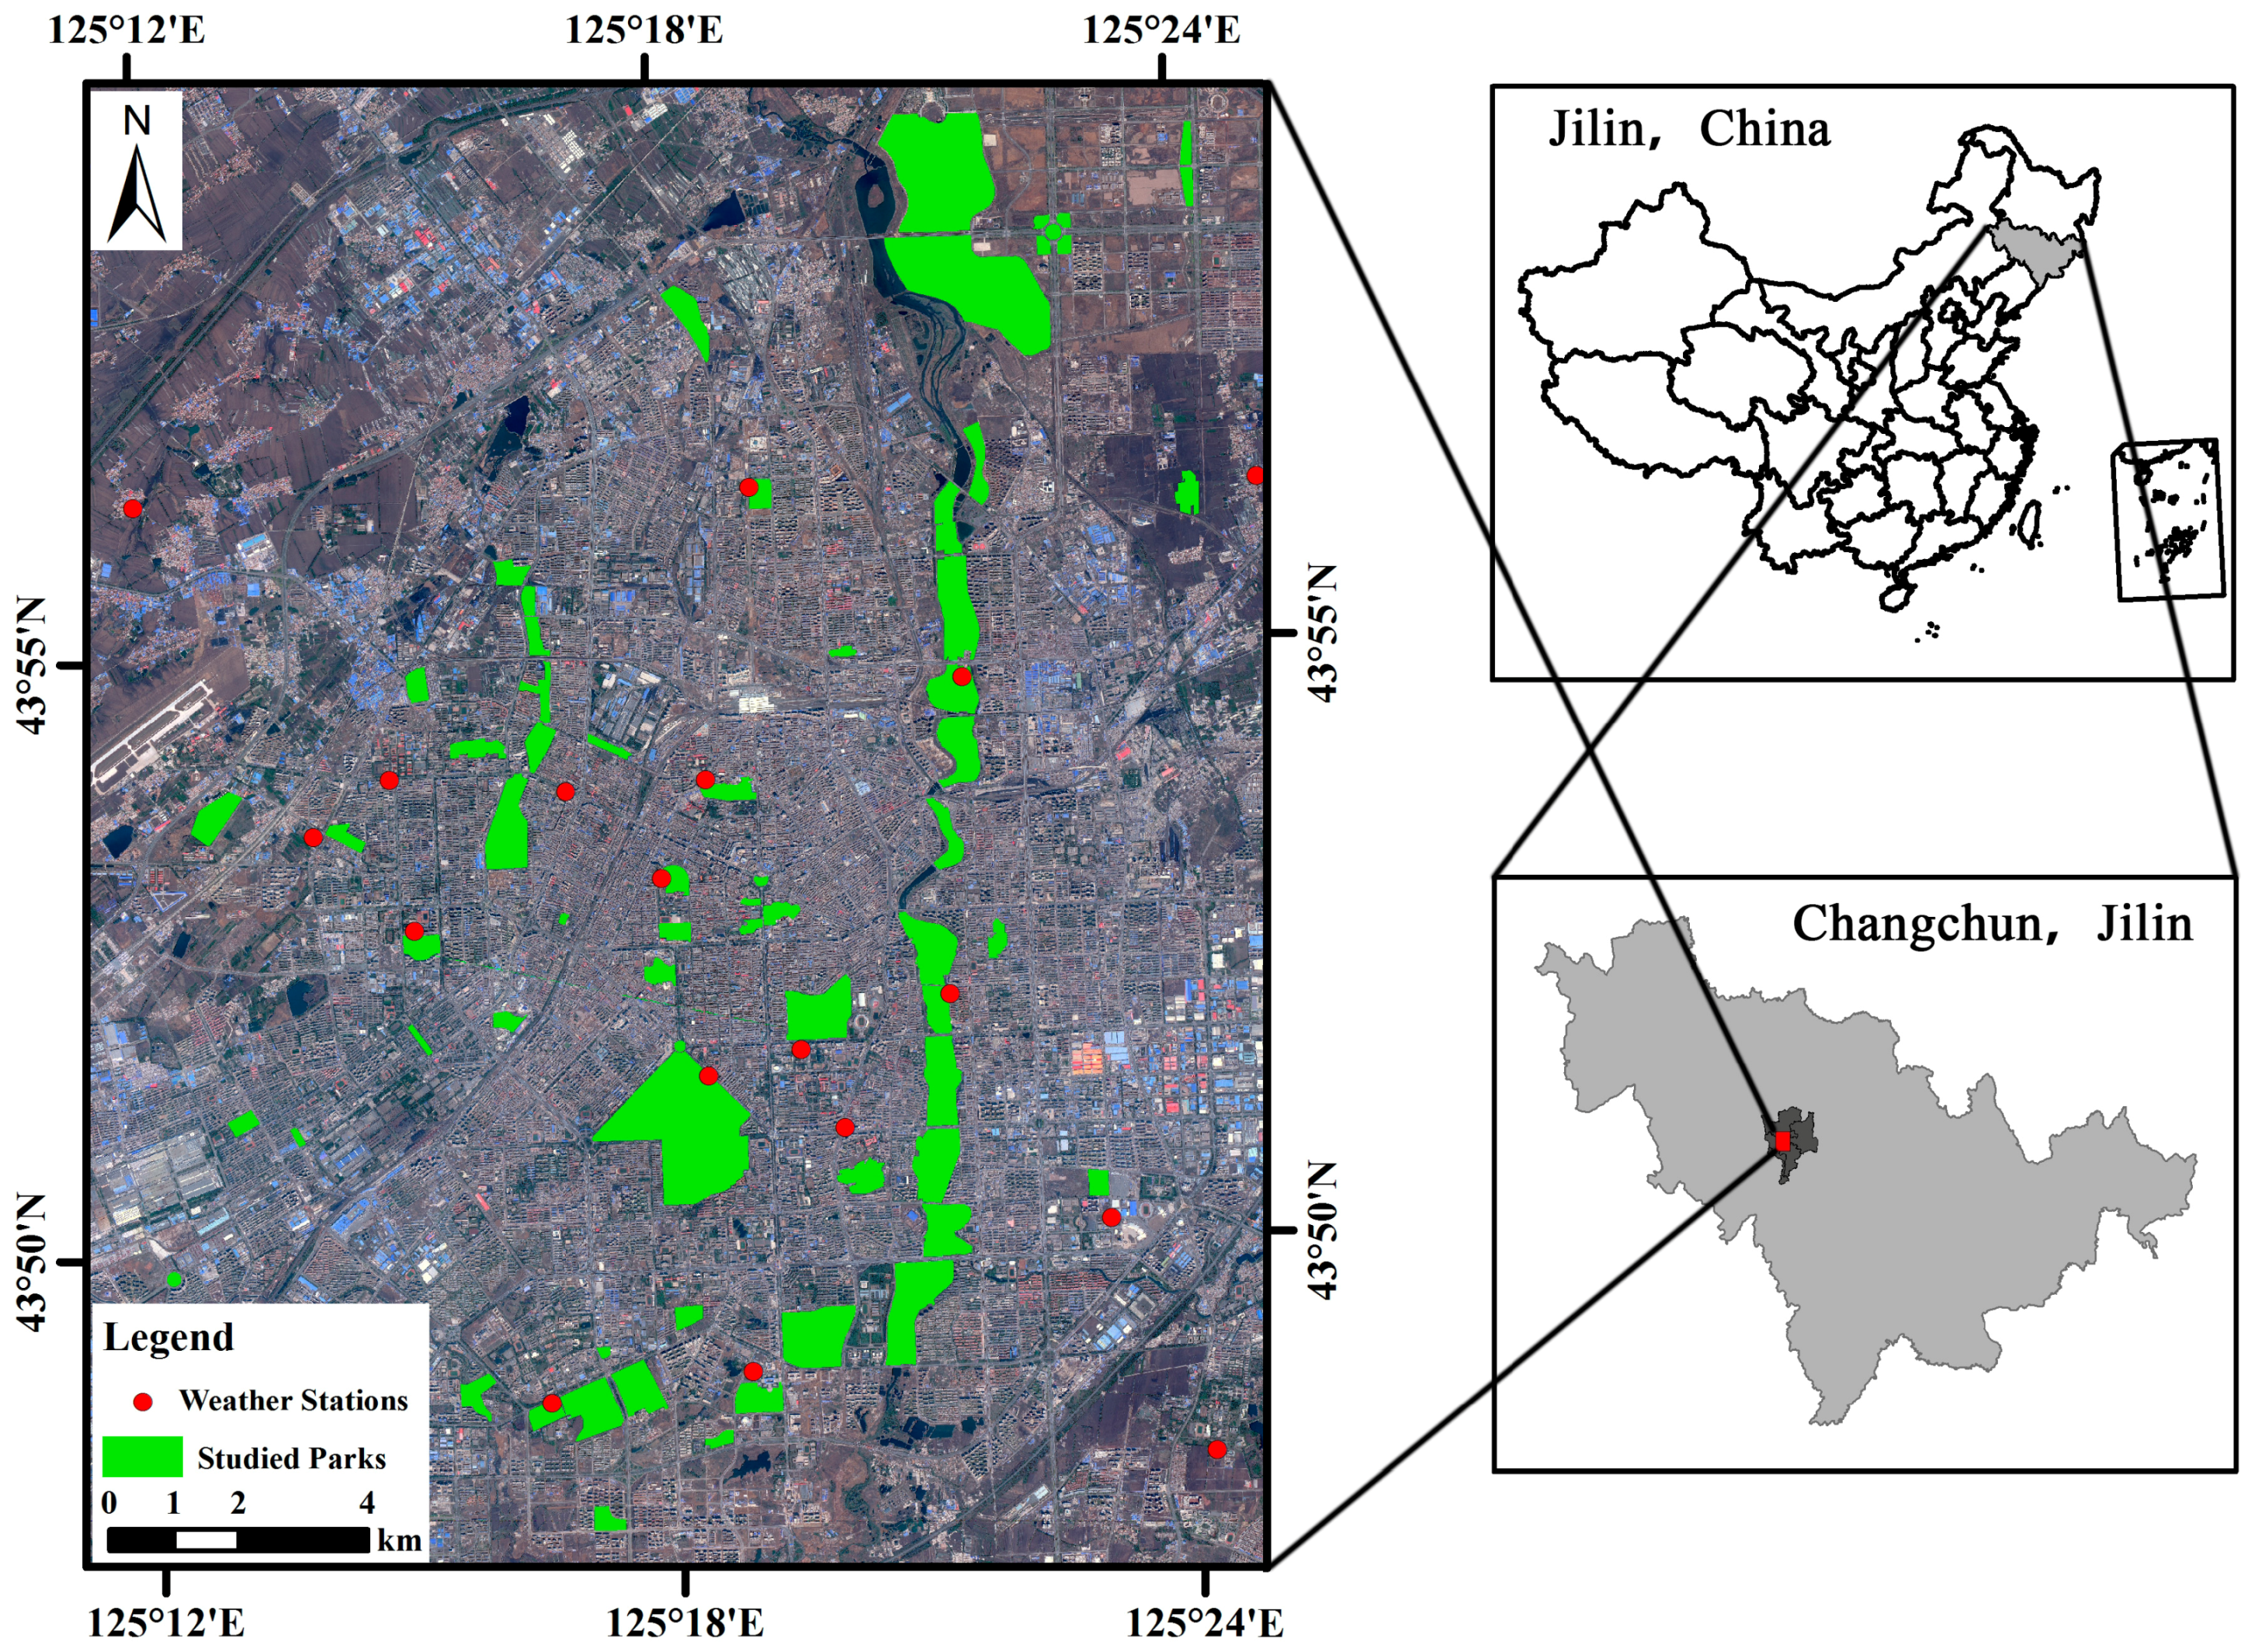
2.1. Study Area

Changchun city (125°11′–125°25E′, 43°43′–43°59′N) (Figure 1), the political, economic, and cultural center of Jilin province, is a highly populated city with approximately 3.66 million residents in 2014. Located in the cold temperate zone of the Northern Hemisphere, Changchun has a sub-humid continental climate characterized by long, cold, and dry winters and short, hot summers. According to the local meteorological records from 1951–2014, the average annual precipitation and air temperature of Changchun are 561.6 mm and 5.5 °C, respectively, and the mean monthly temperature from November to April is below 10 °C. In the past 30 years, as a result of rapid urbanization, the urban area of Changchun has more than quadrupled in size, and the thermal environment has undergone simultaneous changes [45]. The land use in Changchun urban area is heterogeneous with a mosaic of commercial, industrial, residential, and open green space land use classifications. Therefore, high-resolution remote sensing images are essential to capture the detailed surface information.

2.2. Data Sources

High spatial resolution GF-2 remote sensing images were acquired on 15 May 2015 from China Center for Resources Satellite Data and Application (CCRSDA) to extract the urban park information used in this study. GF-2 is equipped with two multispectral scanners with 1 m panchromatic and 4 m high resolution, respectively, and is characterized by a sub-meter spatial resolution and high accuracy of positioning. The launch of Landsat 8 in 2013 with the most advanced Thermal Infrared Sensor (TIRS) extends the 40-year record at least for another 5 years [46]. The free Landsat 8 TIRS images were obtained from the United States Geological Survey (USGS) and were used to derive LSTs. The information concerning the images used in this study is shown in Table 1.

2.3. Methods

2.3.1. LST Retrieval

Based on the radiative transfer equation, Landsat 8 TIRS images can establish direct links to LST [23]. The Mono-window algorithm (MWA), developed for Landsat TM data, was chosen to retrieve LST in this study due to lack of detailed atmospheric variables. The MWA only requires three parameters: emissivity, transmittance, and effective mean atmospheric temperature [47]. The basic form can be written as follows:
T s = [ a ( 1 C D ) + ( b ( 1 C D ) + C + D ) T i D T a ] / C
C = ε τ
D = ( 1 τ ) [ 1 + ( 1 ε ) ]
where T s is LST; T i is the at-sensor brightness temperature of the TIR bands i; ε is land surface emissivity (LSE) of bands i; τ is the atmospheric transmittance of bands i; T a is the effective mean atmospheric temperature; and a and b are constants. More information on the LST retrieval and validation processes may be found in Yang et al. [30,45].

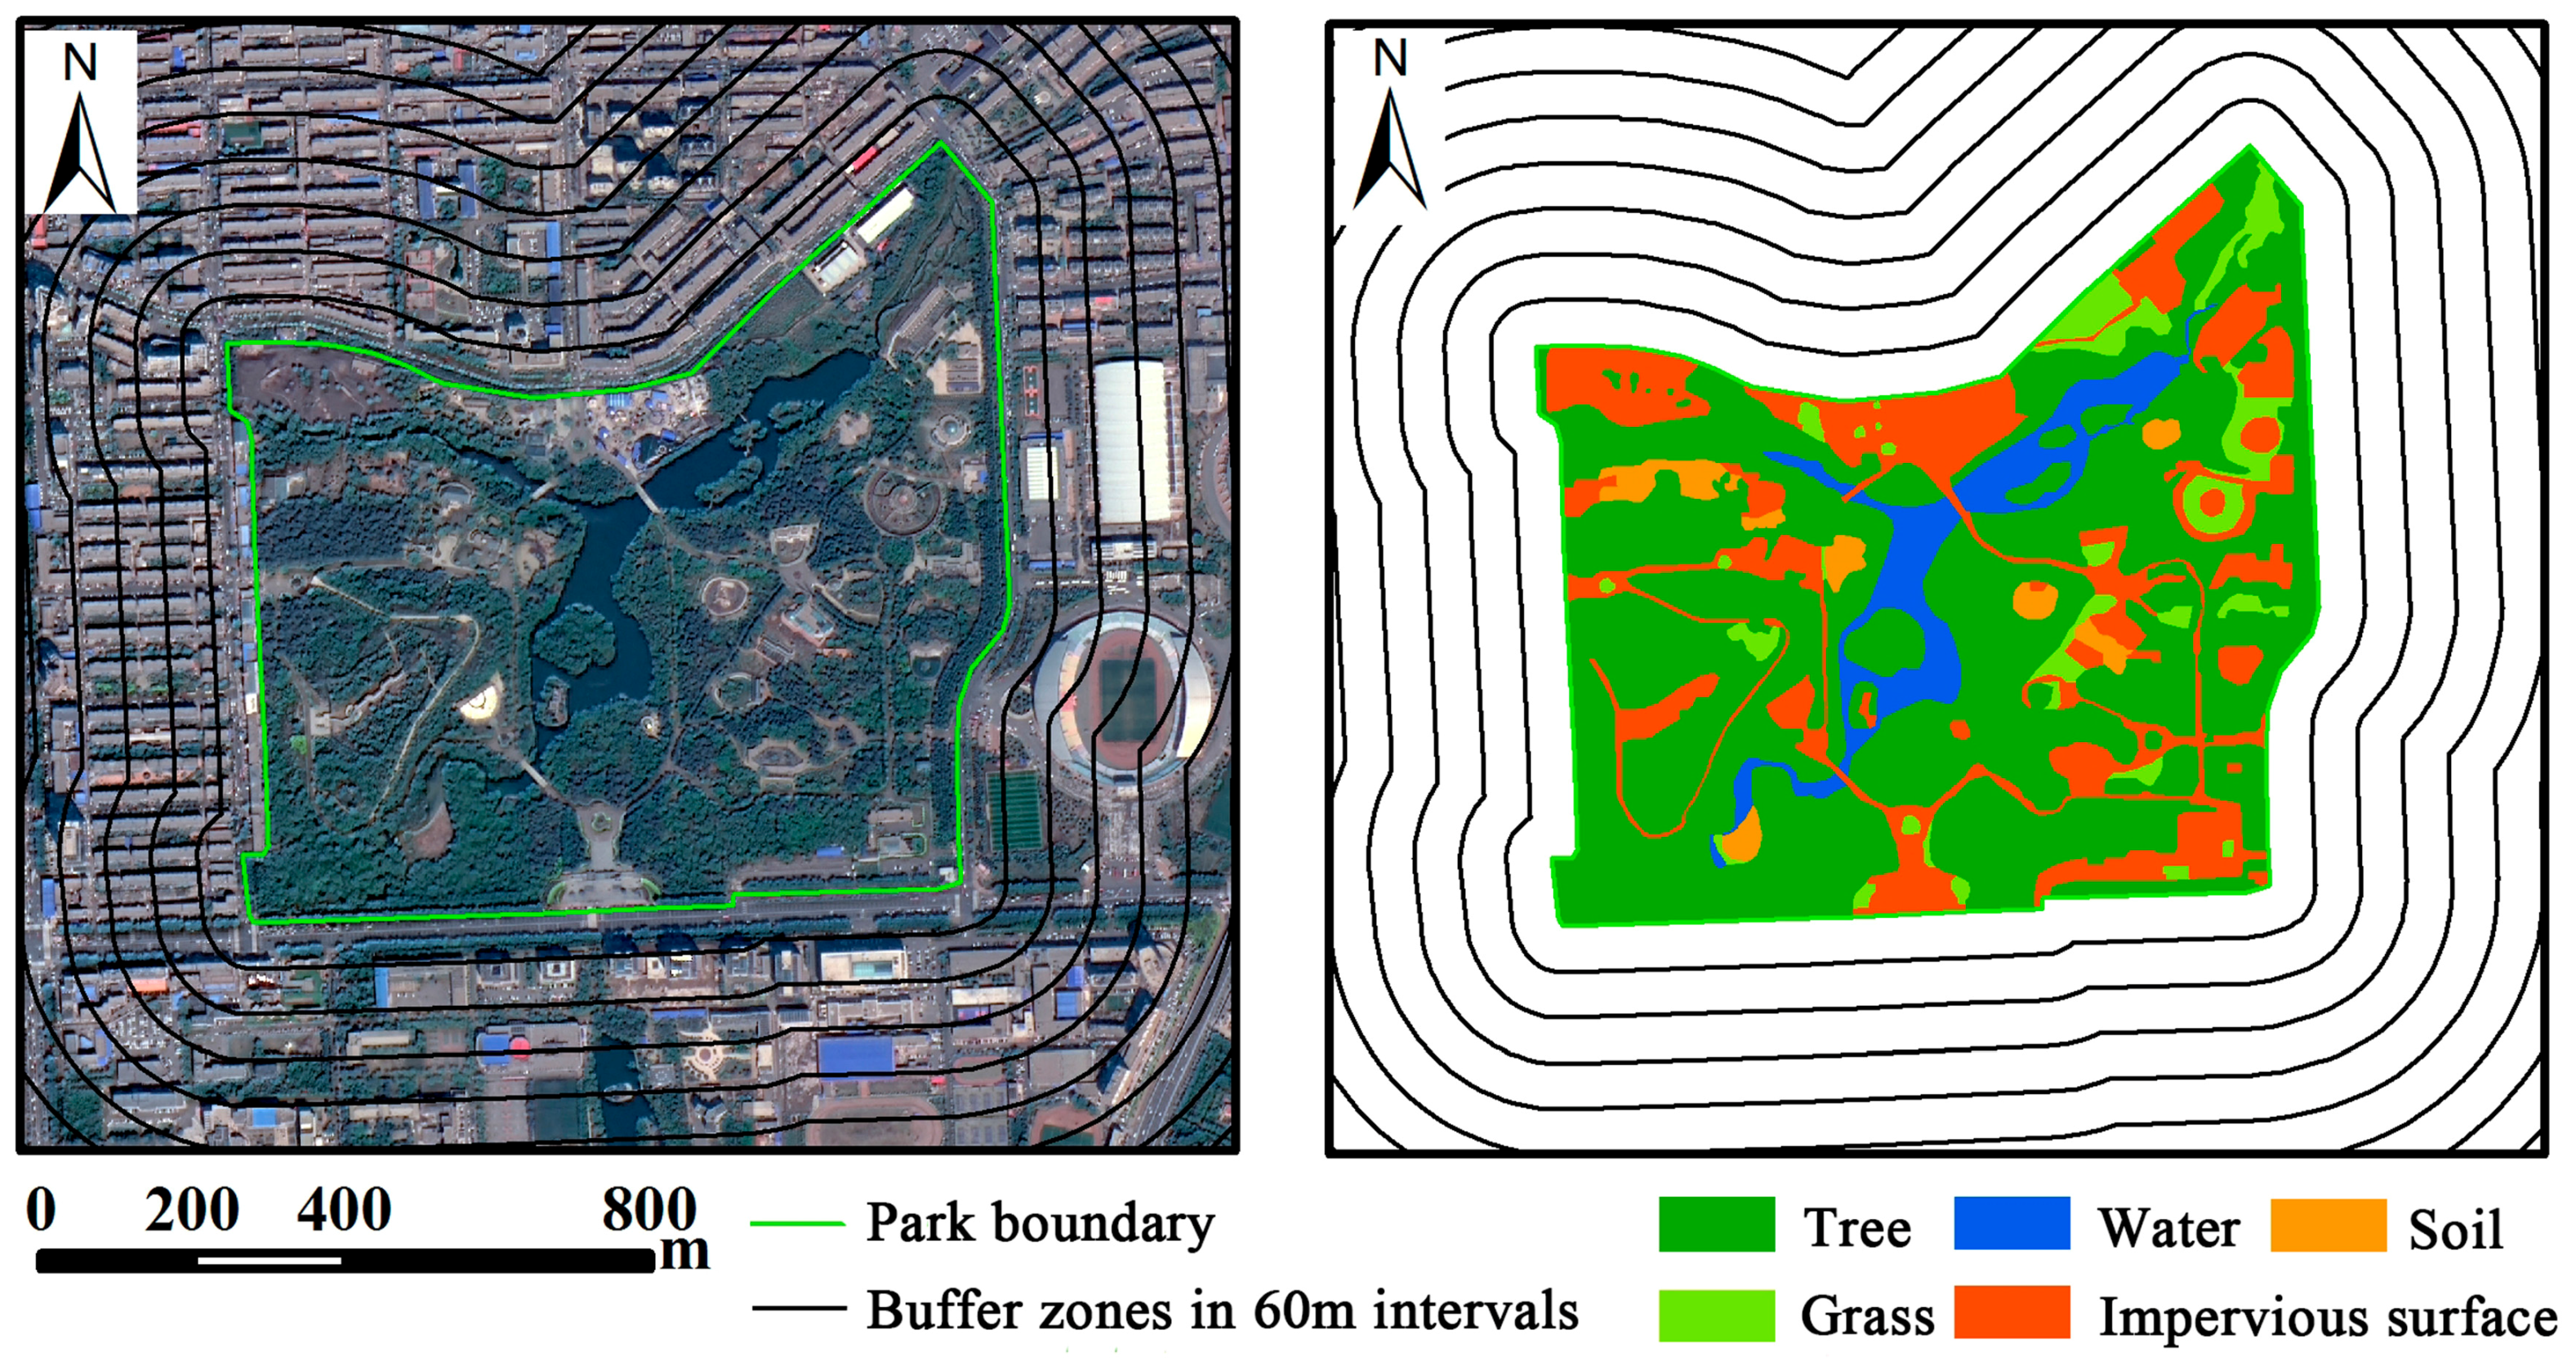
2.3.2. Urban Parks Mapping

Owing to the high spatial resolution images, park land use was visually mapped and classified into five categories: trees, grass, water bodies, soil land, and impervious surfaces (Table 2). The multispectral and panchromatic images were first fused to produce a four-band pan multispectral image with a 1 m resolution. Then, the edge of each park land use classification was identified based on its color, size, and location (Figure 2).
Landscape metrics methods have been widely employed to measure landscape patterns by characterizing the composition and configuration of associated features [48,49]. In this study, four landscape metrics including park area (PA), park perimeter (PP), park landscape shape index (PLSI), and park patch density (PD) were used to quantitatively describe urban parks according to the following principles: (1) easily calculated; (2) practical and scientific importance [50]. PA and PP are composition metrics that show the size and perimeter of each park. As a shape metric, PLSI quantifies the relationship between park area and perimeter. Circular and square-shaped urban parks have PLSI values of 1.00 and 1.13, respectively, while large PLSI values typically signify complicated shapes. PD is a measure of division; higher PD values indicate more land use patches inside the park. Table 3 shows information concerning the metrics used in this study.

2.3.3. Park Cool Island

According to the definition of the UHI, PCI intensity (in this study) refers to differences in LSTs between urban parks and the surrounding urban areas:
PCI = T o u t T i n
where T i n is the average park LST, and T o u t is the average LST of the urban area surrounding the park.
Based on previous studies, the PCI intensity includes three main aspects: the largest PCI (LPCI), the PCI extent (EPCI), and the temperature gradient of PCI (TPCI) [43]. LPCI is the highest LST difference between the parks and their surrounding areas, reported in °C. EPCI is the spatial extent, in which the PCI has significant influence, given in m. TPCI is the rate of temperature increase with distance, in units of °C/m.
Although the edge of each park is fixed, the boundaries of the surrounding urban areas are not explicit. As a result, 60-m interval buffer zones (excluding other parks and water bodies) from the edge of parks to 600 m were used to explore LST differences between the parks and their surroundings (Figure 2). The 600-m buffer zone around a park is large enough to include the neighboring thermal environment. The LPCI is defined for all parks as the difference between the 600-m buffer zone and park LST [16]. If the LST difference between two adjacent buffer zones was less than 0.1 °C, the distance from the park edge to the previous buffer zone was considered the EPCI.

2.3.4. Spatial Analysis

Analysis of time series data that were collected between May and October was used to explore the monthly variations of PCIs, excluding the winter months. For each date, the average interior LSTs of each urban park and associated buffer zones were acquired by using the Overlay and Statistic Analysis tools in ArcGIS 10.2 (ESRI, Redlands, CA, USA). Then, the LST difference between the parks and their associated buffer zone intervals were calculated to examine PCI spatial variability. Pearson correlation coefficients were used to assess the relationships between average park LST, land use, and landscape metrics. In addition, multiple linear regression models and curve fitting methods were employed to examine the influence of land use and landscape metrics on PCIs. All of the statistical analyses were performed with SPSS 19.0 (IBM, Armonk, NY, USA).

3. Results

3.1. The Urban Thermal Environment

Figure 3 shows the differences between retrieved LST and observed air temperature across different dates using the method outlined in previous studies [30,51]. Overall, average LST was approximately 3.63 °C, 5.02 °C, 5.23 °C, 5.51 °C, 3.41 °C, and 2.78 °C higher than the average observed air temperature from May to October, respectively. The square of the correlation coefficient (R2) were 0.72, 0.60, and 0.76 for June, July, and August, respectively, which were higher than other months. Based on the results, the consistency between LST and observed air temperature indicates that the LST can reflect the urban thermal environment.
Figure 4 shows the thermal environment of the study area in different months. There were remarkable monthly variations in the spatial pattern of LST. The urban area tended to have higher LSTs than the rural area in the northwest part of the study area, with the exception of October. The hottest regions were distributed in the central and southwest parts of the study area, where there were dense commercial and industrial districts, respectively. The distribution of urban parks corresponded to the spatial patterns of LST, and although the urban area had high LSTs, urban park LSTs were significantly lower than the surrounding environment, with the exception of October.
The average study area LSTs for May, June, July, August, September, and October were 23.12 °C, 33.85 °C, 35.17 °C, 37.67 °C, 25.87 °C, and 16.18 °C, respectively, while the corresponding LST difference between the mean park temperatures and mean study area temperature for the same months were −2.89 °C, −3.12 °C, −3.33 °C, −3.44 °C, −2.48 °C, and −1.86 °C, respectively. The results demonstrated that the urban parks in this area exhibit a cool island effect. The month of August showed the largest LST differences, while the coldest month of October had the smallest. These results were counterintuitive because it was hypothesized that high average study area LSTs would result in large LST differences between the parks and urban area.

3.2. Urban Parks Characteristics

Only parks of 2 ha (0.02 km2) or larger were considered in this study because the size of a single LST pixel is 900 m2 (0.09 ha). There are 66 urban parks in the study area (Figure 1), and the spatial patterns of land use inside one park is shown in Figure 2. The total urban park area is approximately 2329 ha (5% of the study area), with an average park area of 35.29 ha. The landscape metrics and the LST for the 66 urban parks are shown in Table 4. As previously mentioned, the urban park LSTs were lower than the surrounding area, but there were still large differences in LSTs among the parks. For example, LSTs varied by 9.22 °C on 5 August 2016. The LST differences may be due to park characteristics, which will be explored in the following section.

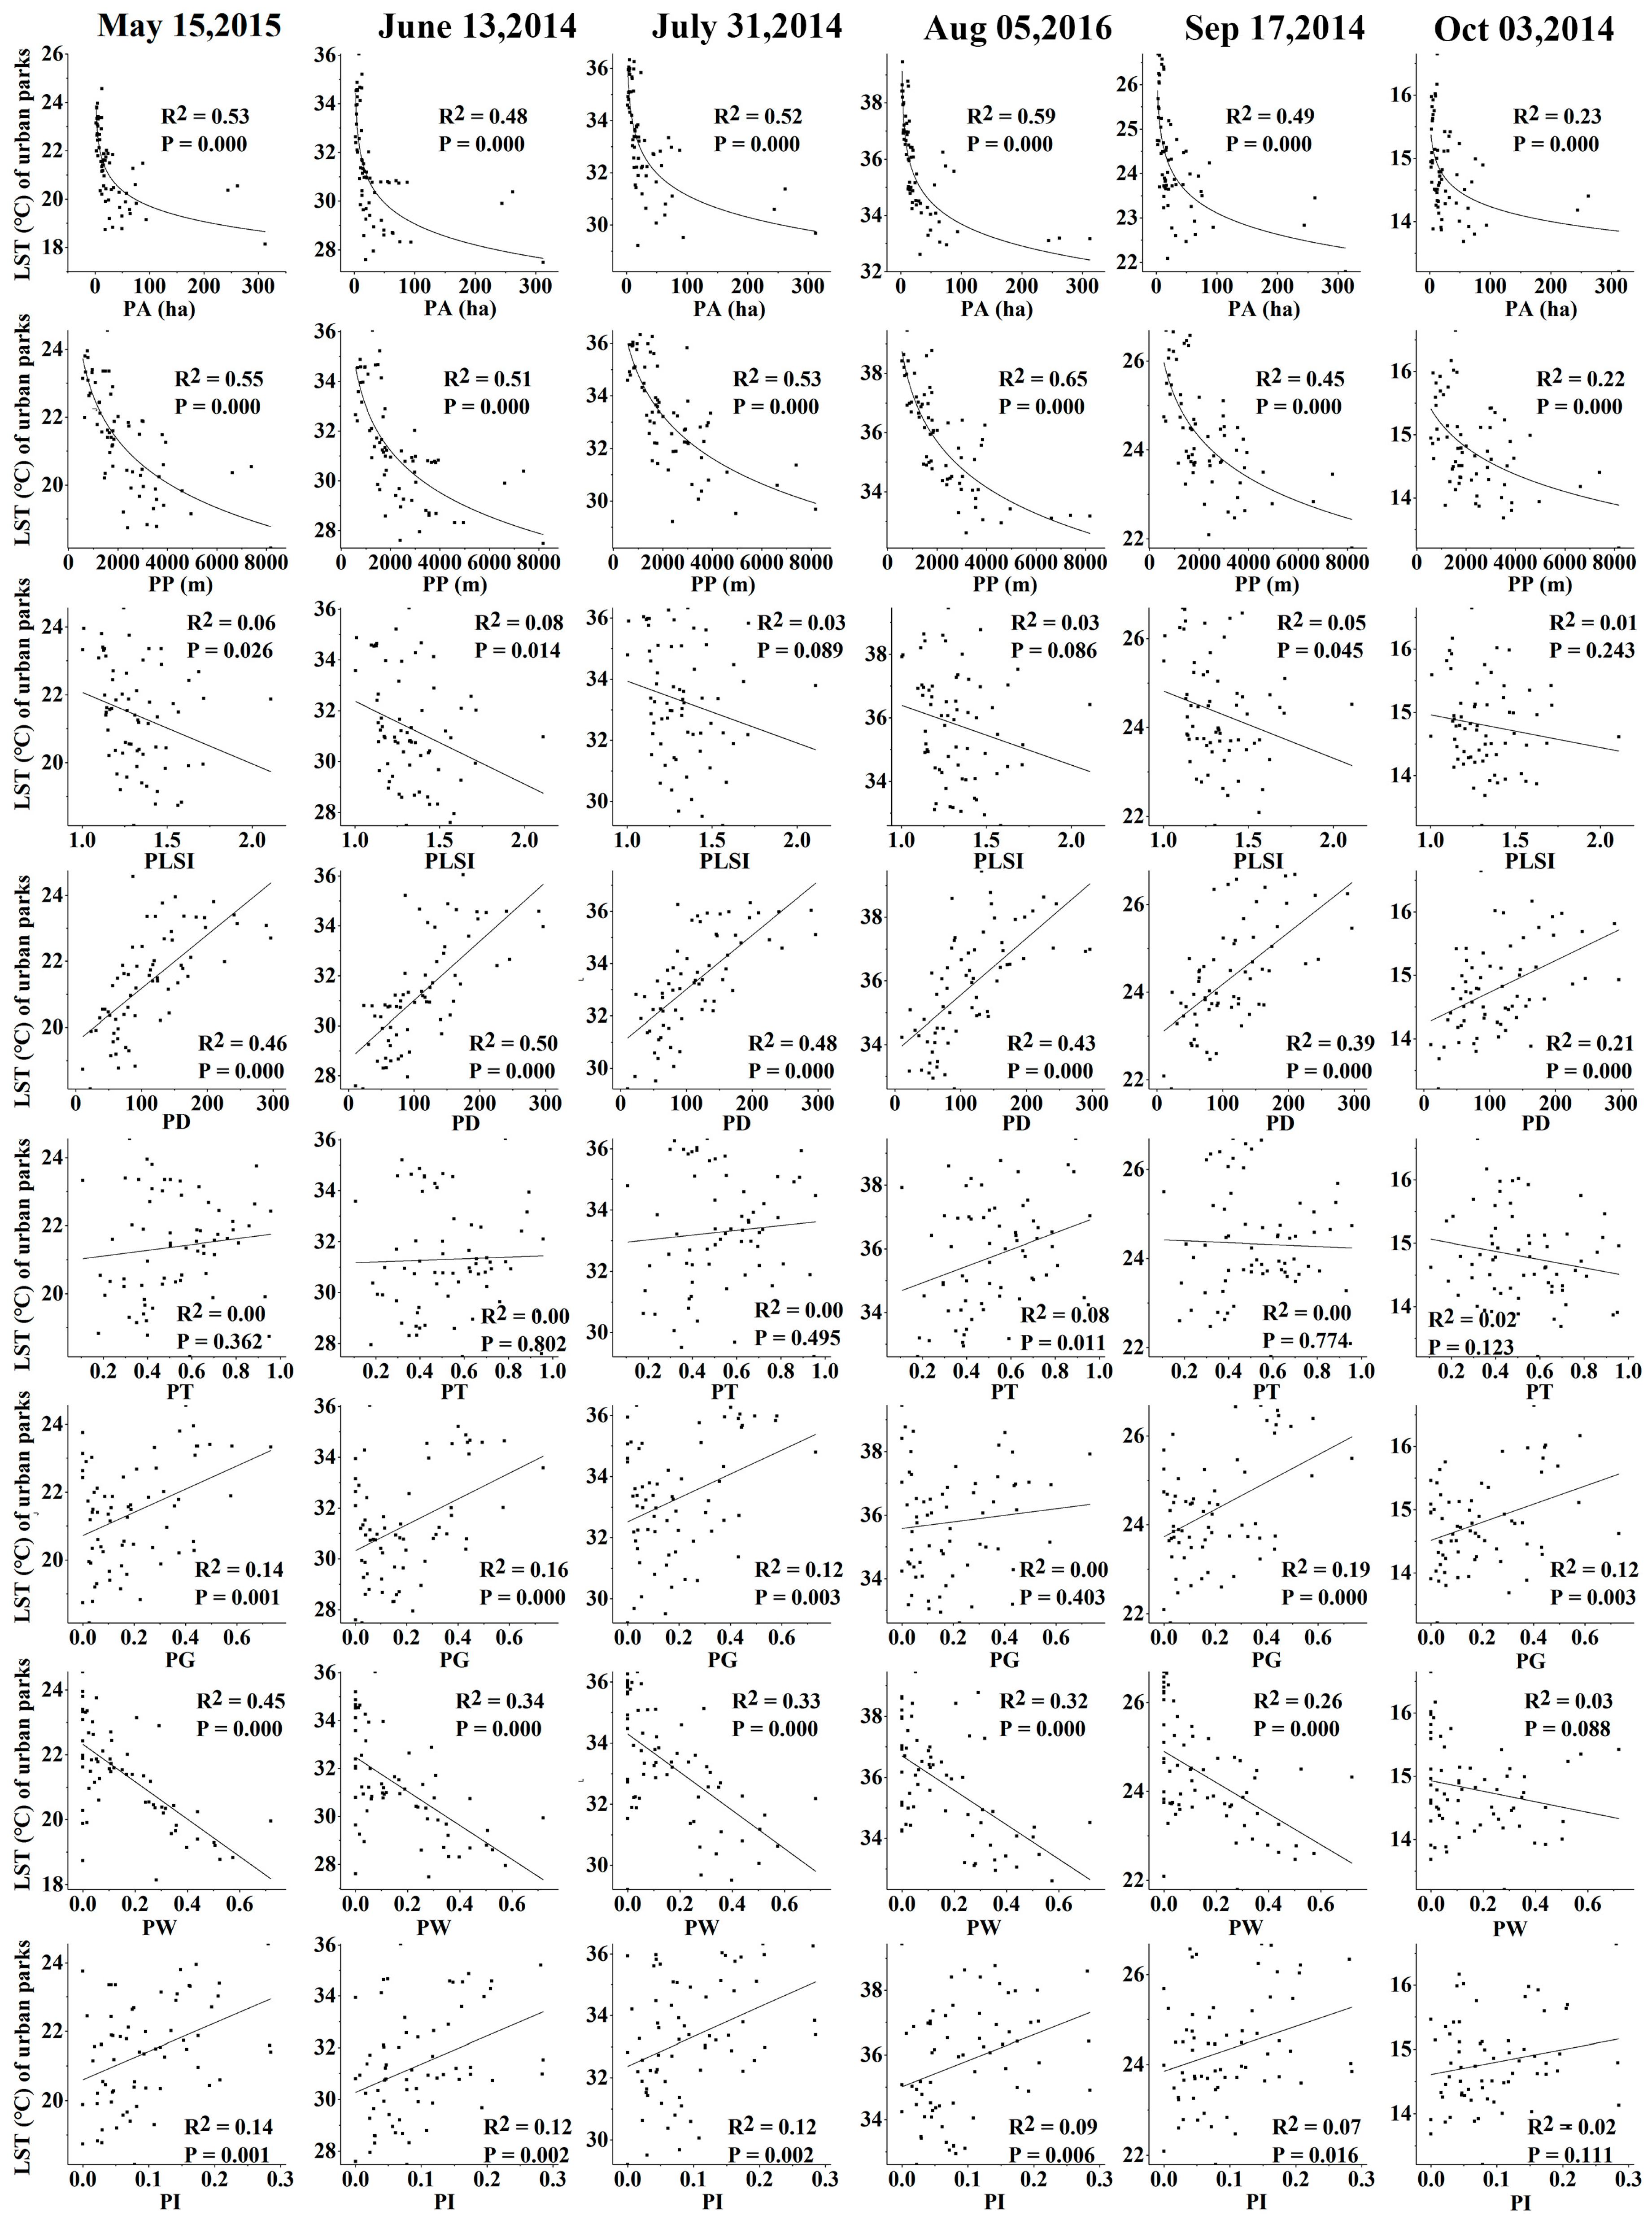
3.3. Relationships between Urban Parks Interior LST and Characteristics

The bivariate correlation coefficients between urban park LST and landscape metrics, the percent area of trees (PT), grass (PG), water (PW), impervious surfaces (PI), and soil land (PS) are shown in Table 5. Figure 5 shows the regression models between these park characteristics and LST. Both PA and PP have strong negative relationships with LST in all months. The negative influence of PA and PP on LST was strong in July and August, while the October correlations were the weakest. The PW also had significant negative relationships with LST in all months except October. This finding indicates that urban parks with high PA, PP, and PW values tend to have low LSTs. The PLSI only showed negative correlations with LST in some months. Although the correlation coefficients between PS and LST were negative, they were not significant statistically.
The PD showed significantly correlations with LST during all six different months that were much stronger than the correlations between PI and LST. PI also showed significant correlations with LST in all months except for October. A very interesting phenomenon was that the relationships between the percent tree area and LST were not significant in all months, while the percent grass area showed a positive relationship with LST throughout study duration.

3.4. PCI Characteristics

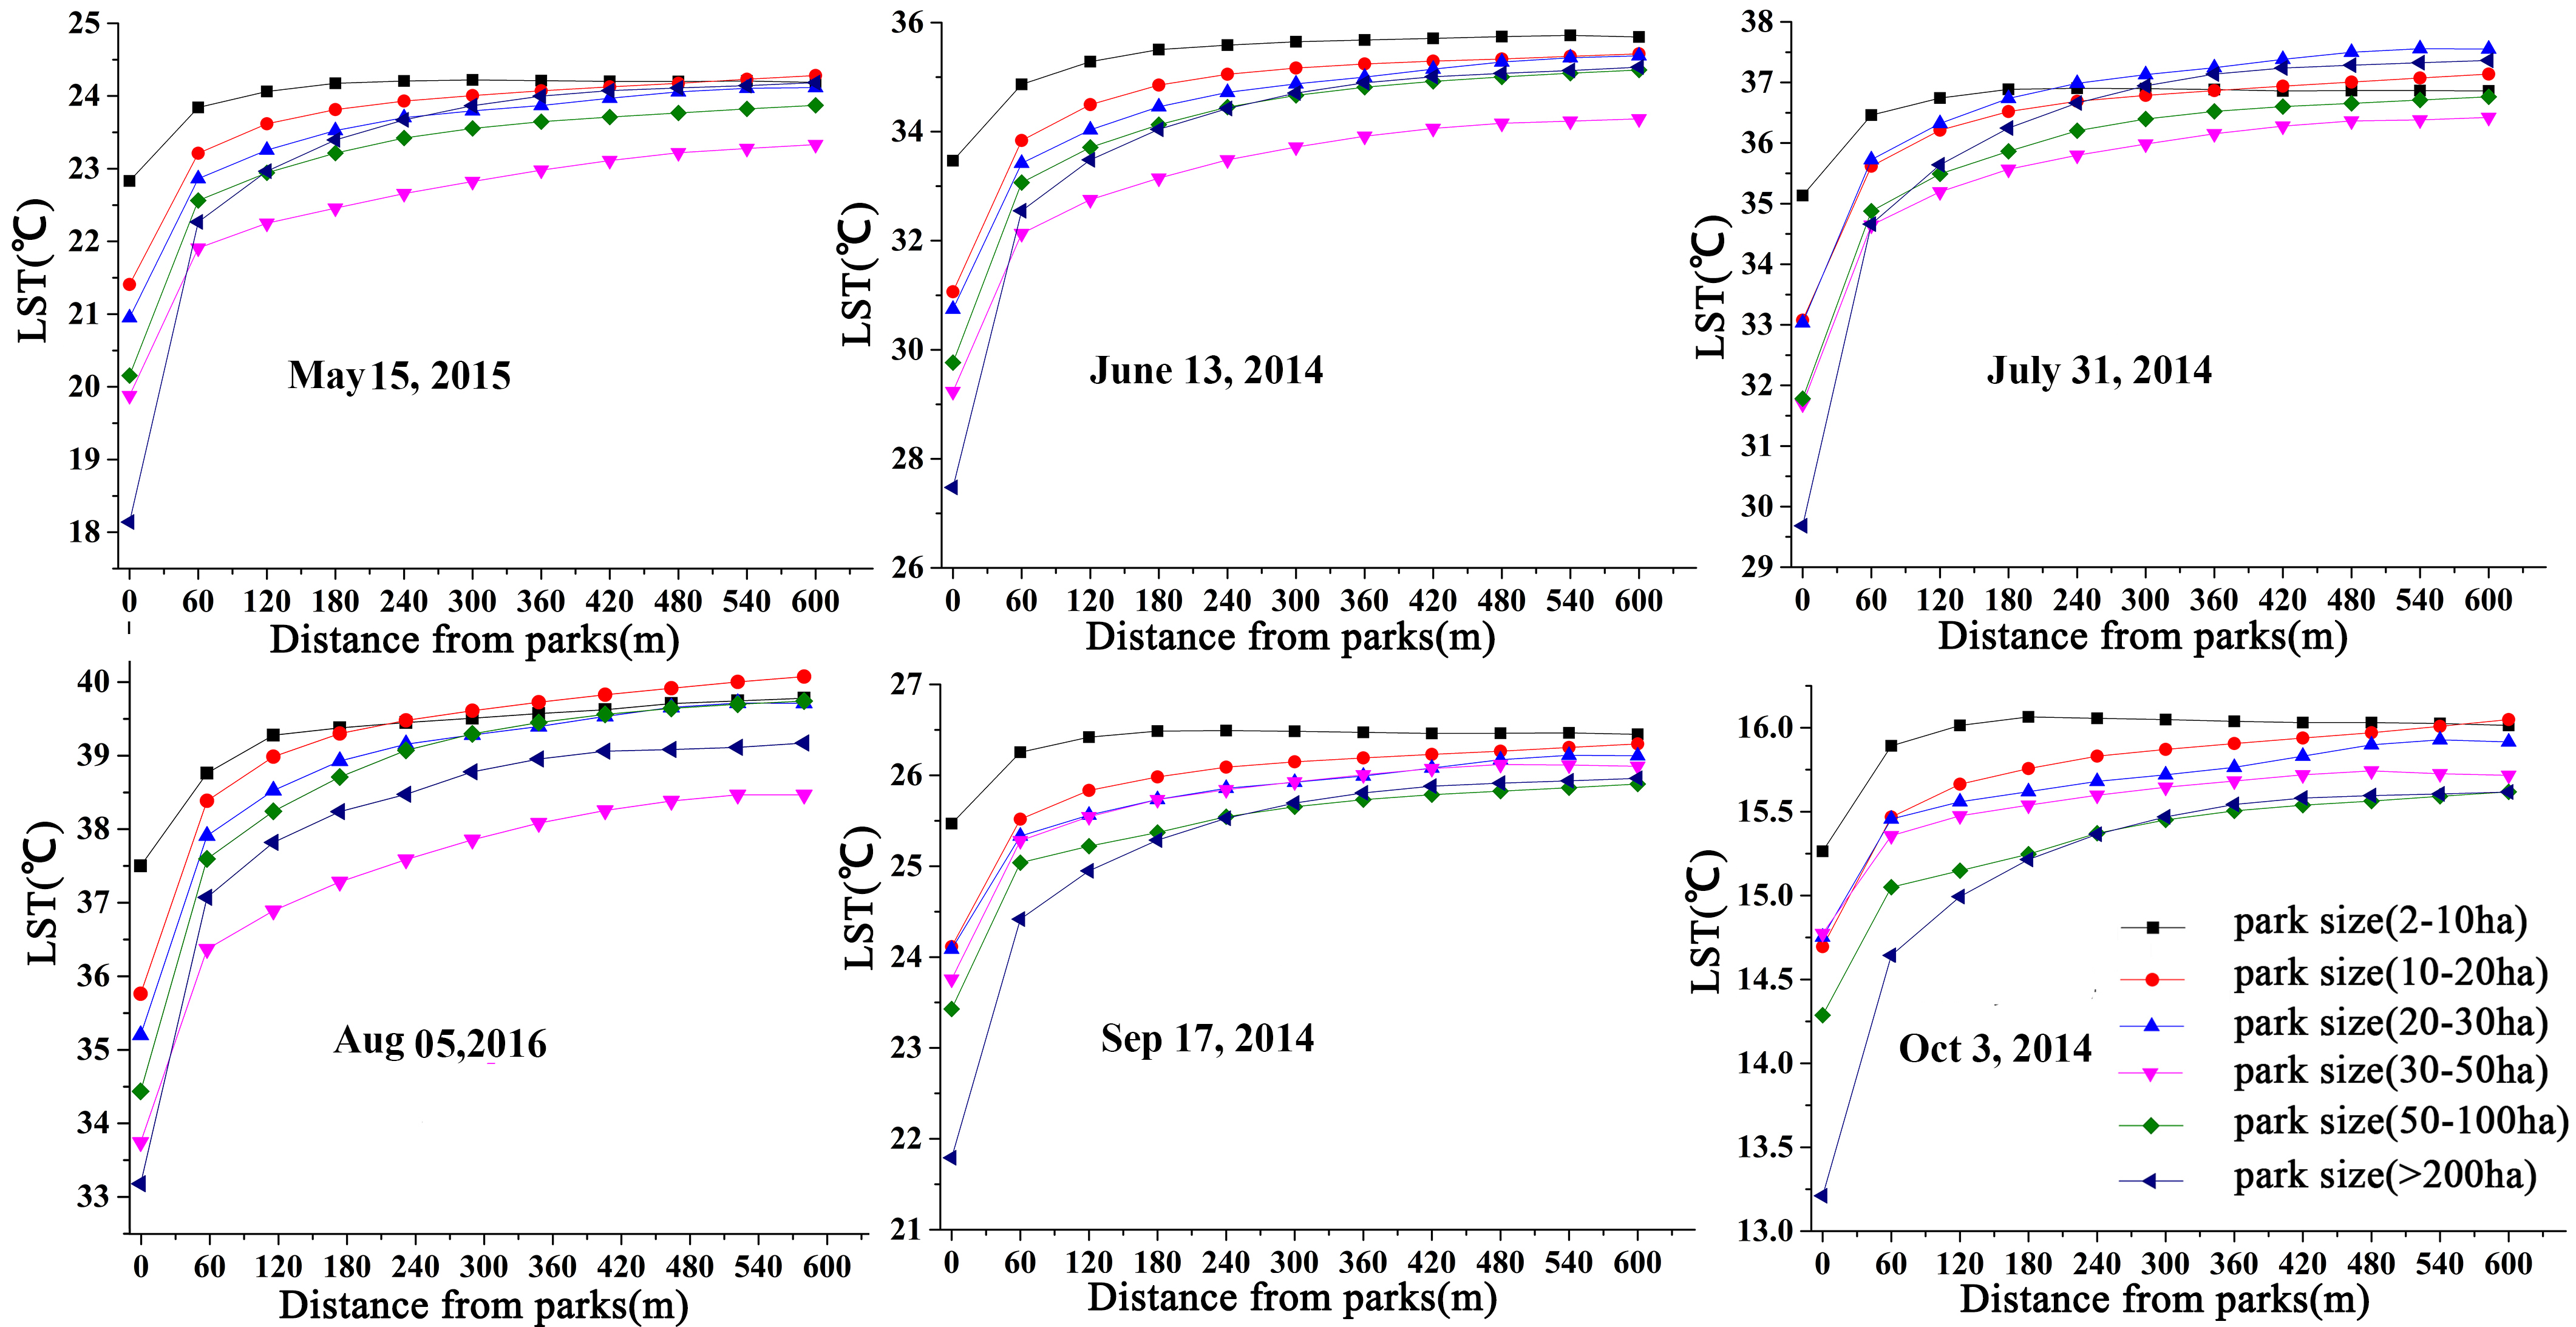
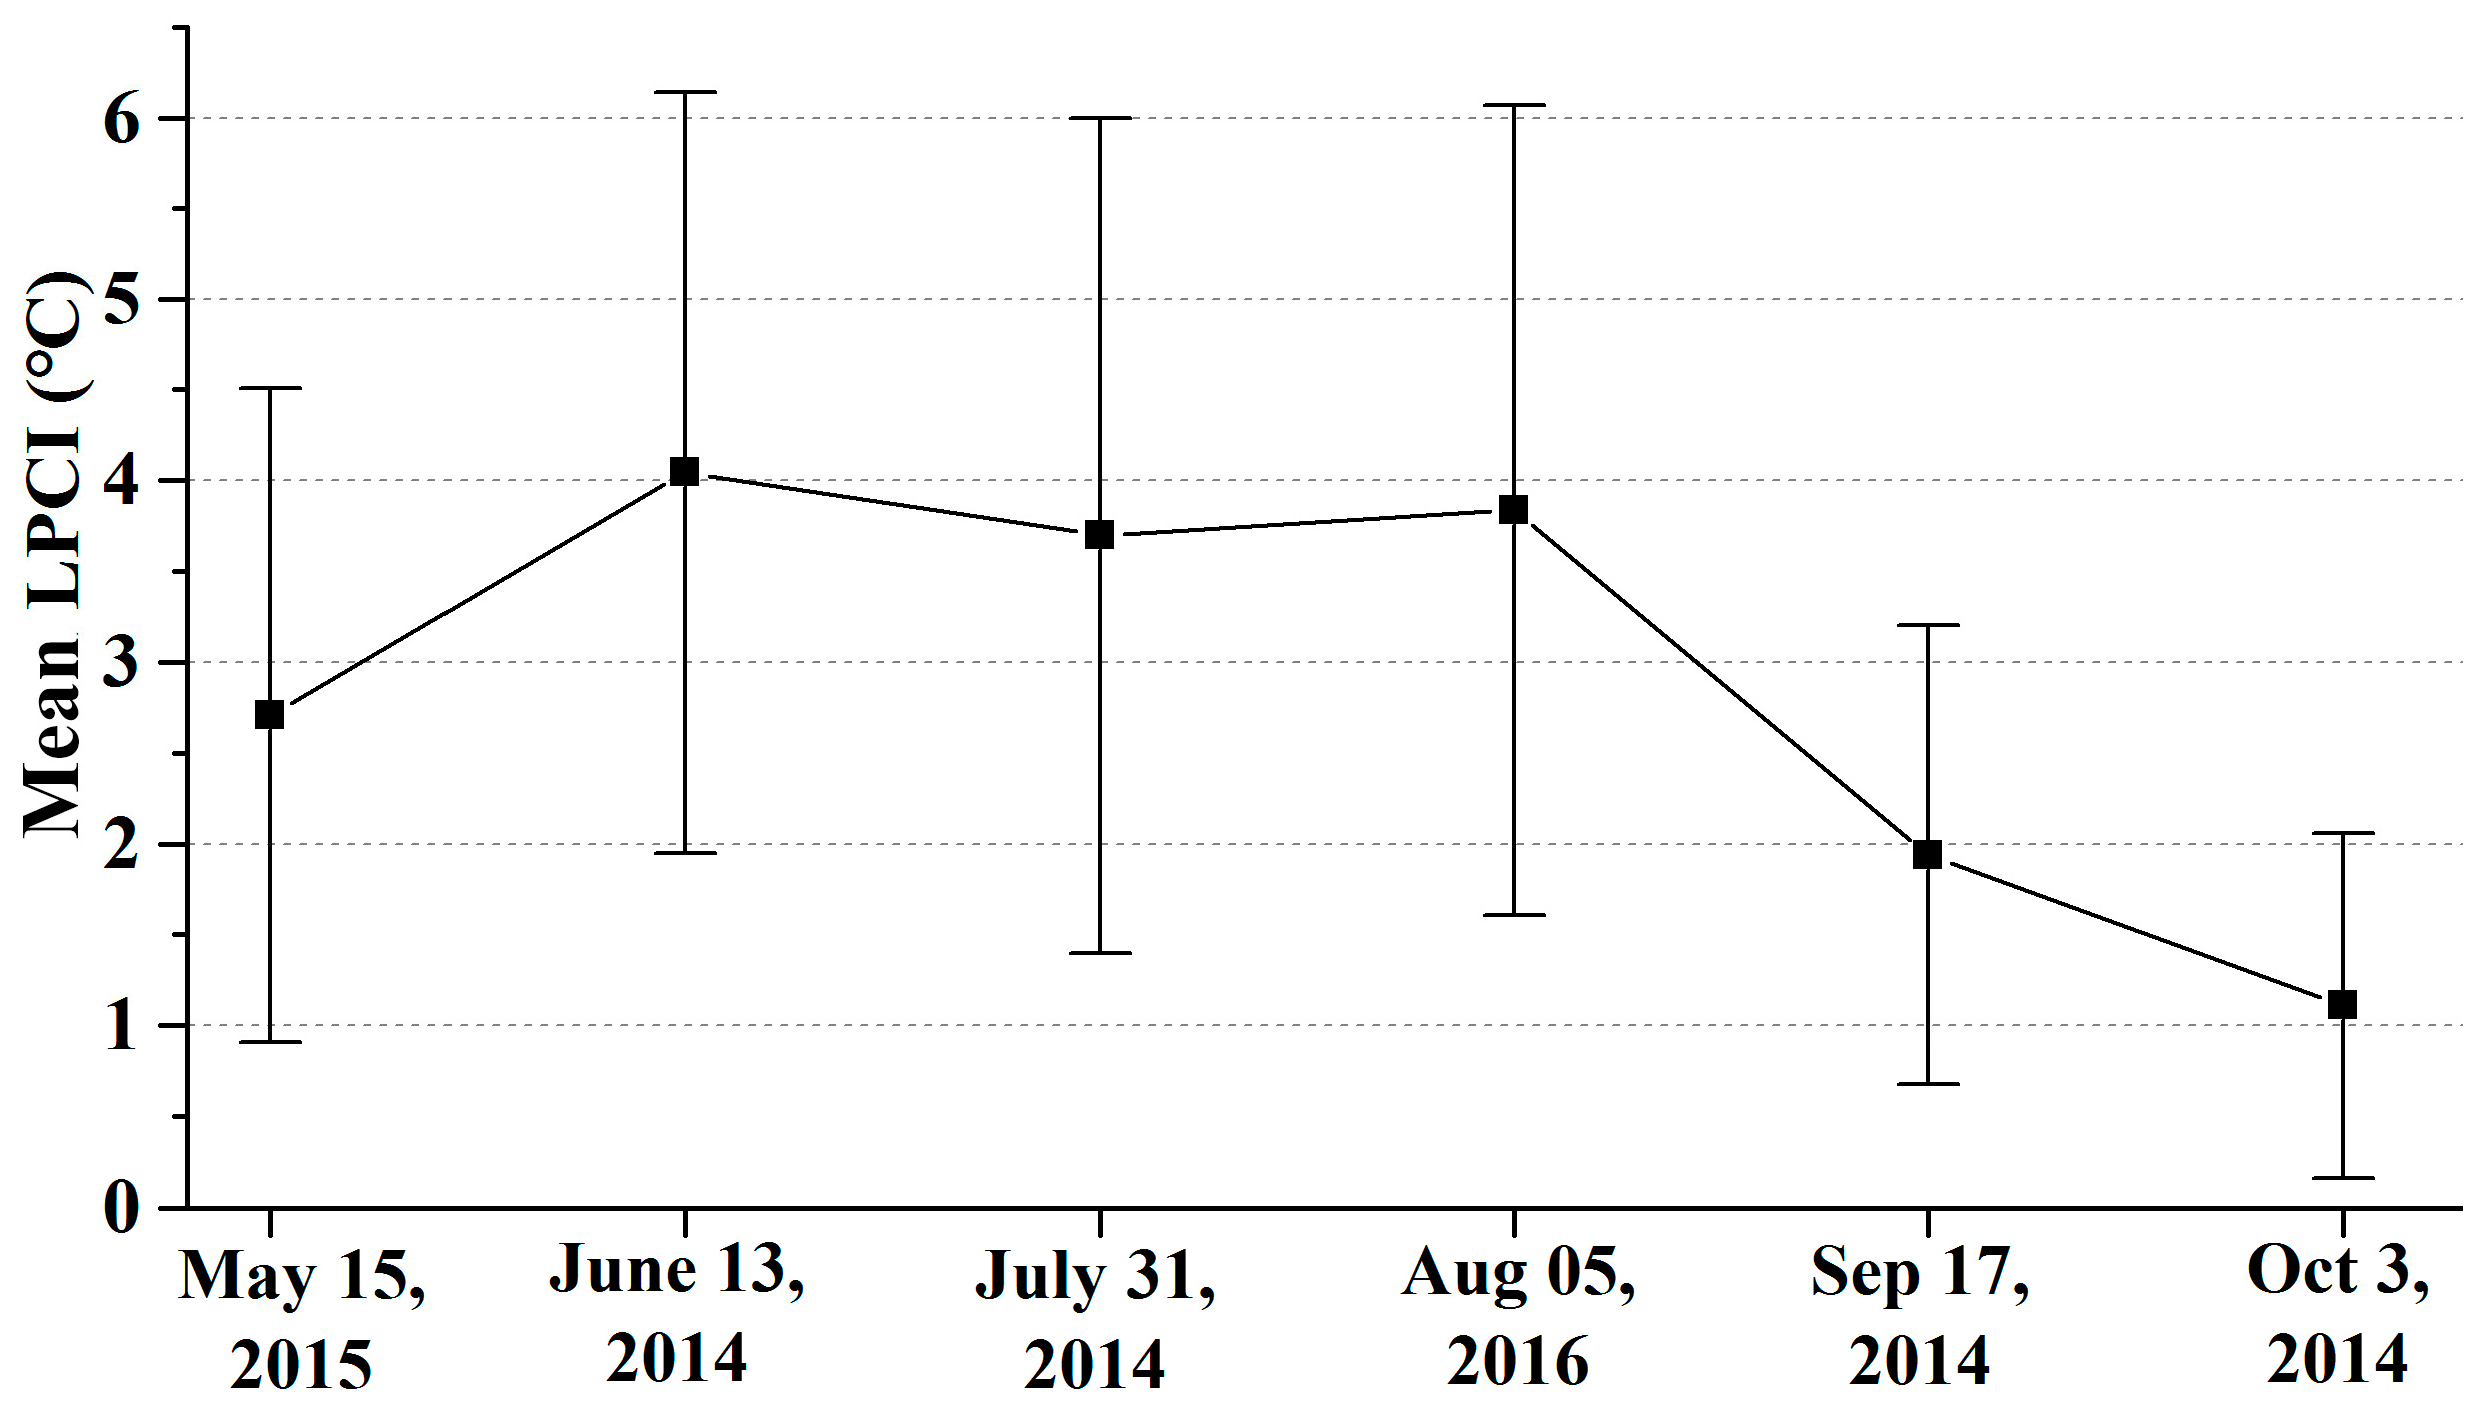
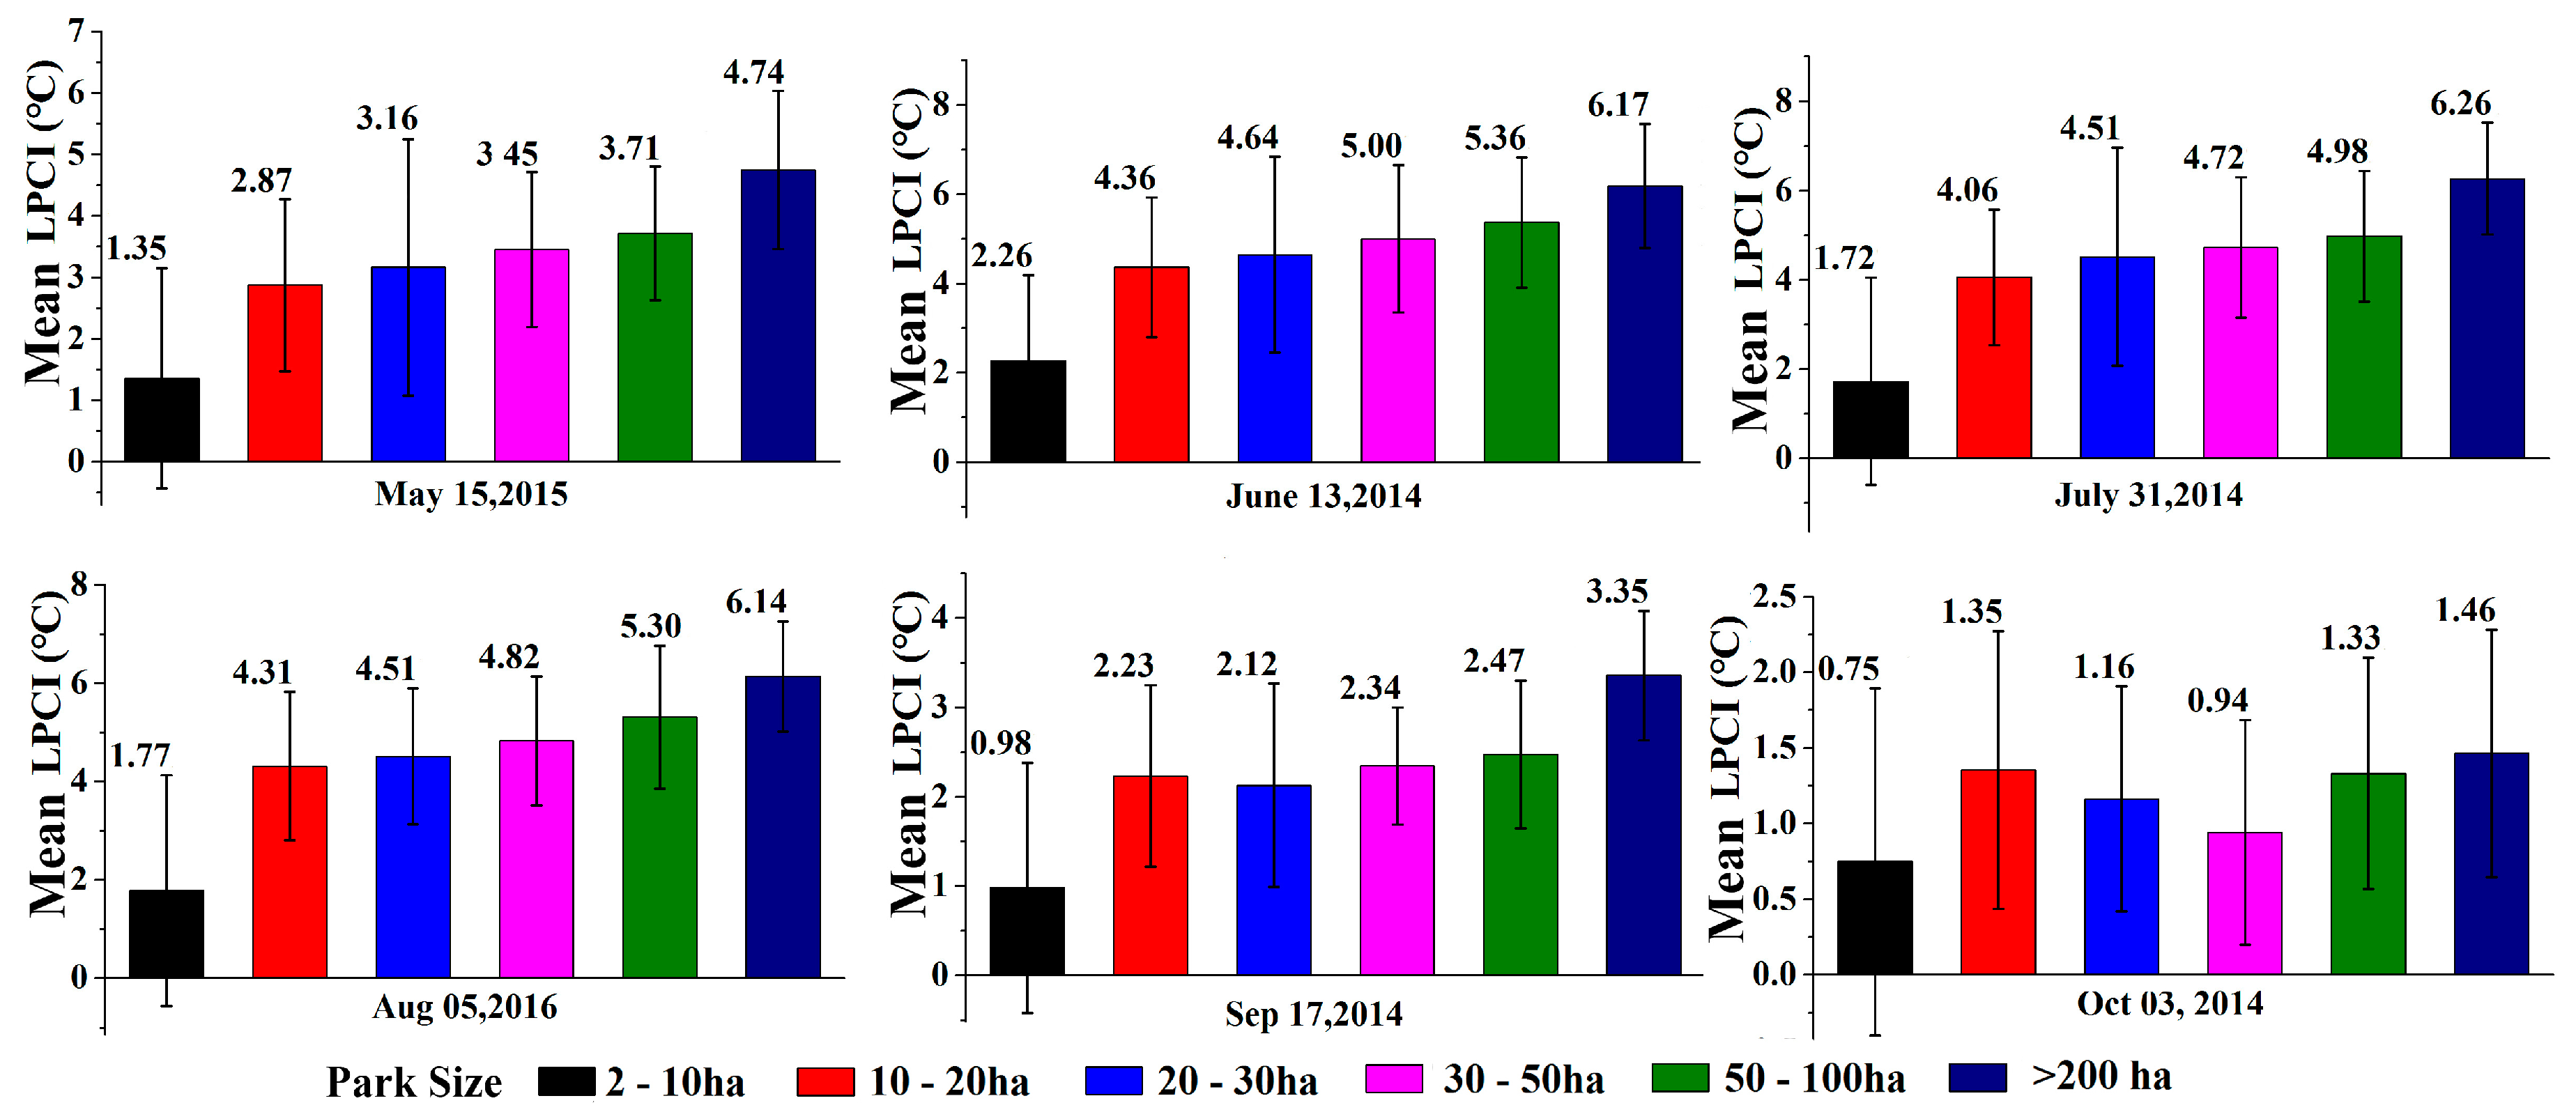
3.4.1. Monthly PCI Variations

Figure 6 shows the monthly mean and standard deviation of LPCI for all urban parks from May to October. In June, July, and August, mean values of LPCI were above 3.50 °C and significantly higher than in other months. The mean LPCI values in May, September, and October were 2.71 °C, 1.93 °C, and 1.10 °C, respectively.
Previous studies have shown that park size significantly influences the LPCI [10,16]. As a result, the urban parks in this study were classified into six size classes (Figure 7). The LPCI intensity increases with urban park size on all of the dates except 3 October 2014. In June, July, and August, low temperatures were observed in parks with areas greater than 10 ha, and the LPCI values of these parks were greater than 4.0 °C. However, the LST contrast was relatively small during May and September in most parks. The LPCI of the largest park was less than 1.5 °C in October when the LST of the whole area was low. In October, park size had little influence on LPCL. The LPCI values of the largest parks (>200 ha) were the highest on all dates and the intensity was greater than 6.0 °C during the hot summer months. The LPCI was much lower in small parks throughout the study period. However, these parks showed the largest standard deviations of LPCI values, suggesting that the surrounding environment easily affects the small parks in the study area. To summarize, the cooling effect of urban parks was pronounced in larger parks during the hotter months.

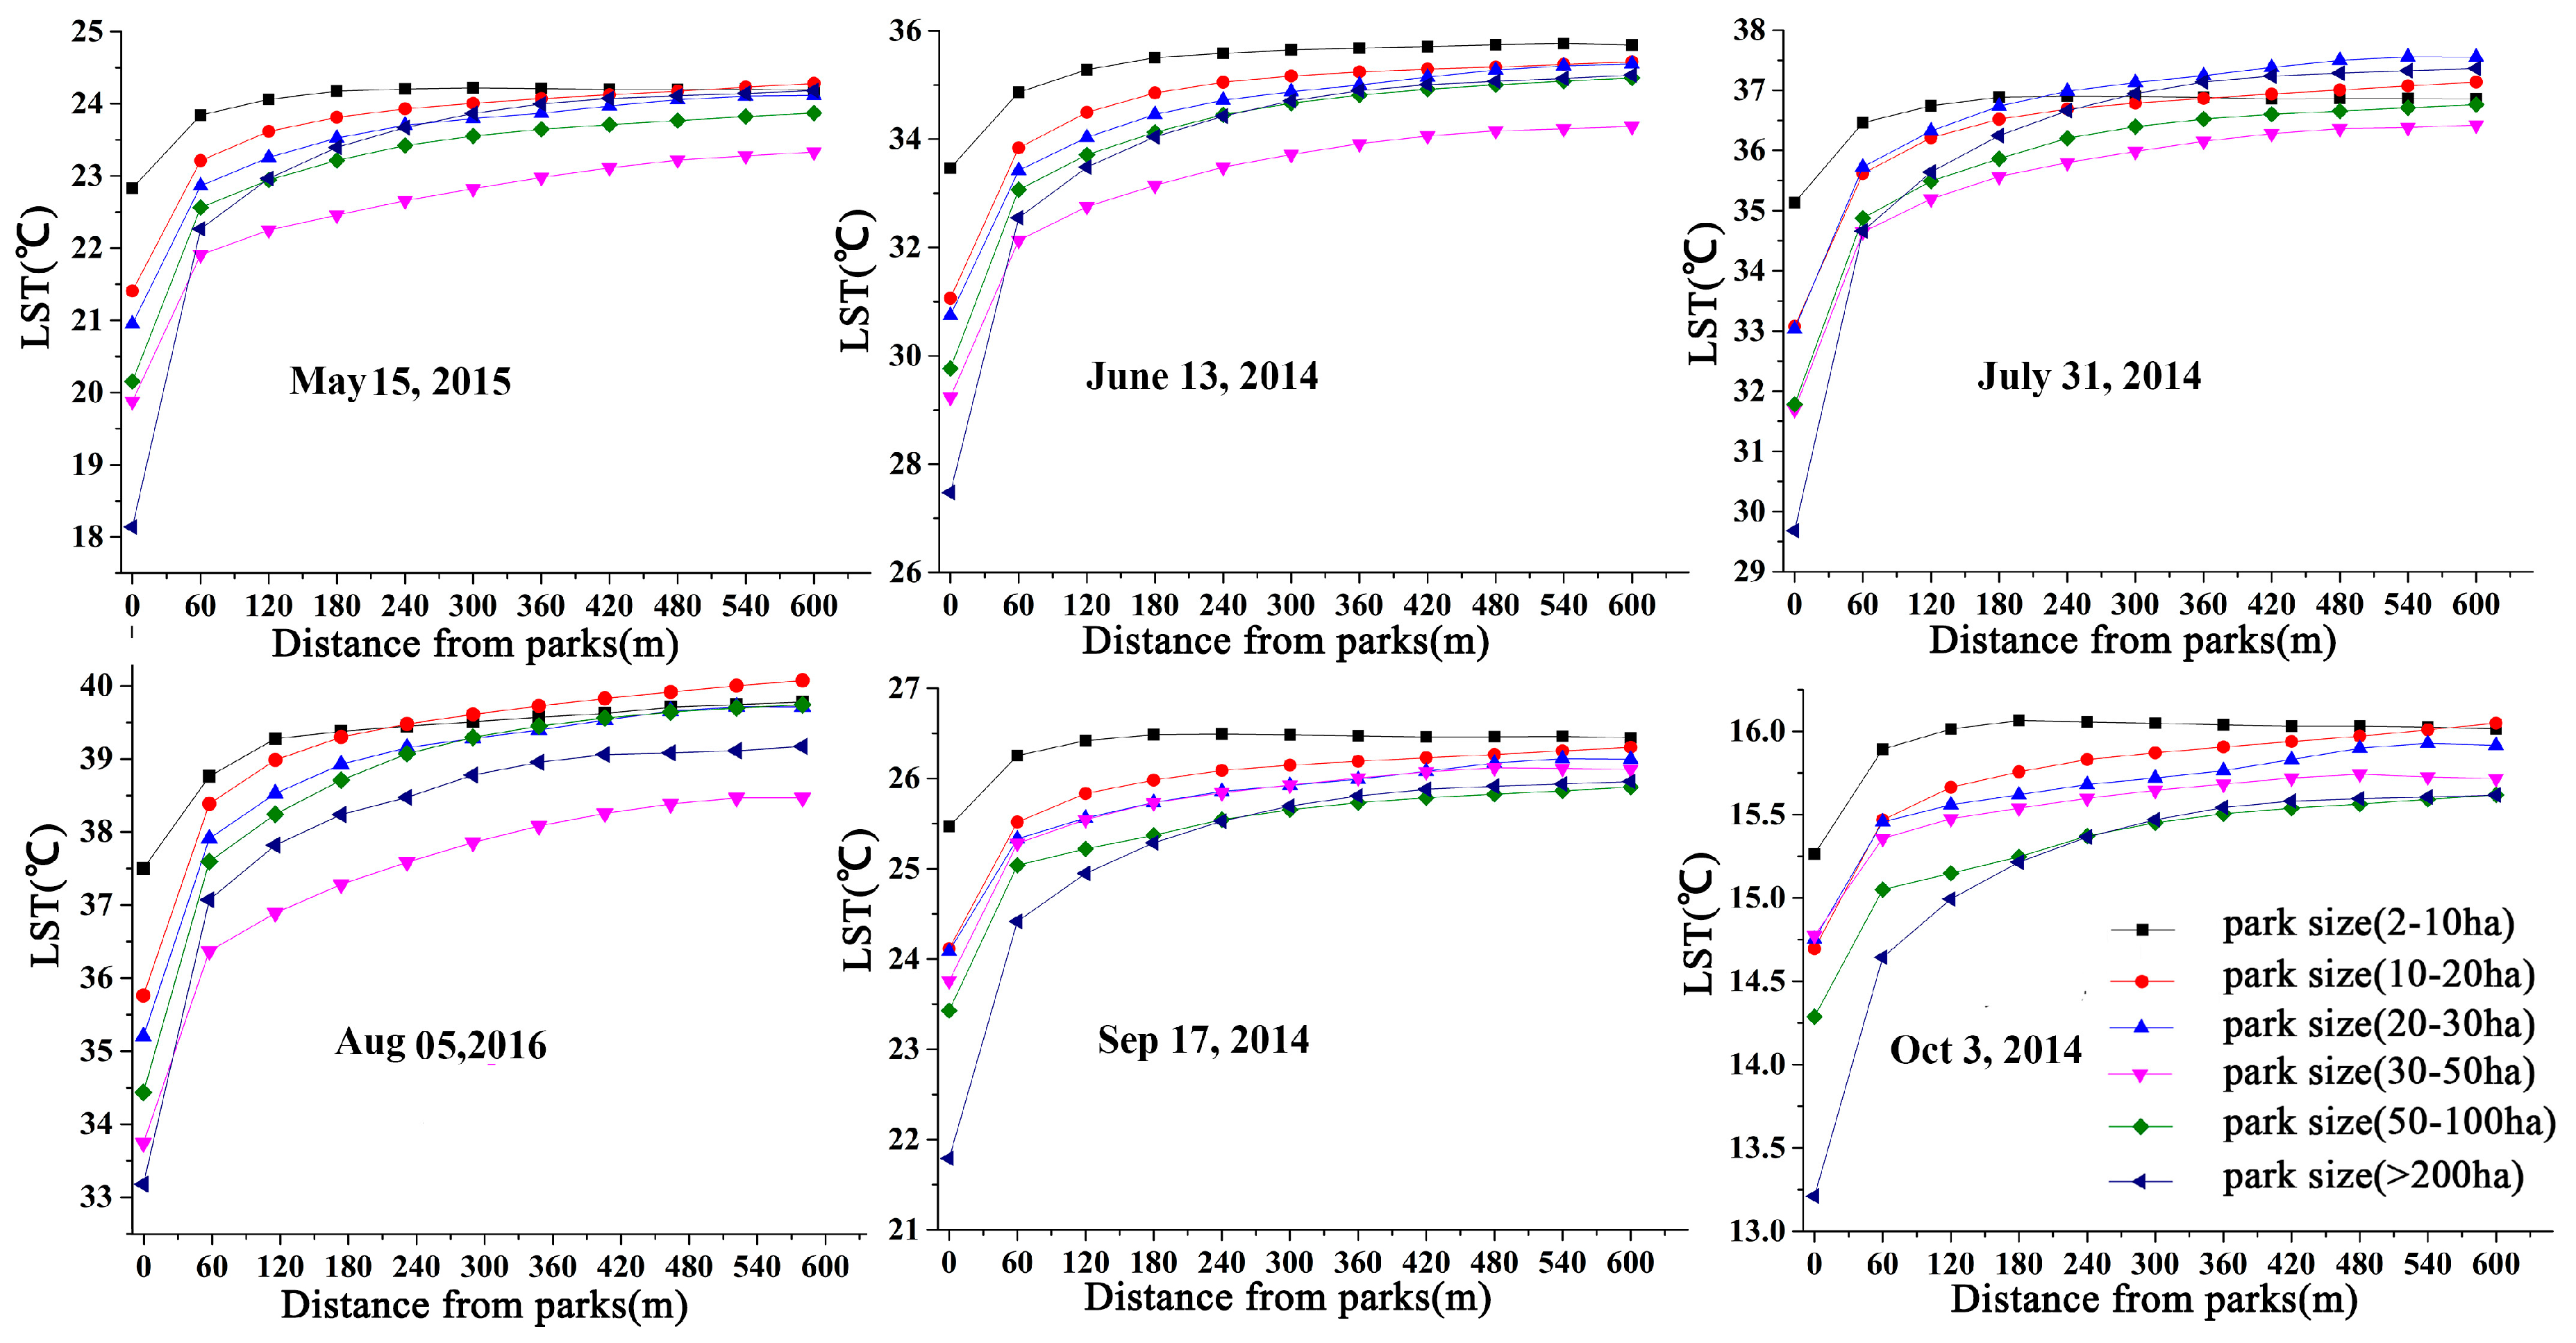
3.4.2. The Cooling Effect Extent

The extent of PCIs were estimated by calculating the LST changes in the buffer zones (60 m intervals) surrounding the urban parks (Figure 8). Overall, LSTs were lower inside parks than in their associated buffer zones and gradually increased with the distance from the park. The trend in LST can be divided into three stages. First, LST increased sharply with distance from the park. Second, the rate of LST increase slowed to a point at which the influence of urban parks diminished. Third, the LST showed little change and even decreased, especially in the buffer zones of small parks. For all of the parks throughout the study duration, the rate of LST increase was highest during the first 60 m form the park edge, averaging 0.037 °C/m, 0.050 °C/m, 0.048 °C/m, 0.045 °C/m, 0.026 °C/m, and 0.014 °C/m for May, June, July, August, September, and October, respectively.
The results showed that park size had an influence on the EPCI. Overall, the cooling influence of larger parks extended a greater distance compared with small parks. For park sizes of larger than 30 ha, size was not the primary factor affecting the EPCI. Additionally, EPCI showed monthly variations, with greater cooling distances in June, July, and August. The EPCI of parks larger than 30 ha was approximately 480 m during these three months. In October, the EPCI of these parks was 240 m, with the exception of parks over 200 ha, which had an average EPCI of 360 m. For parks smaller than 10 ha, the mean EPCI was approximately 120 m for all the dates, similar to previous studies [41].

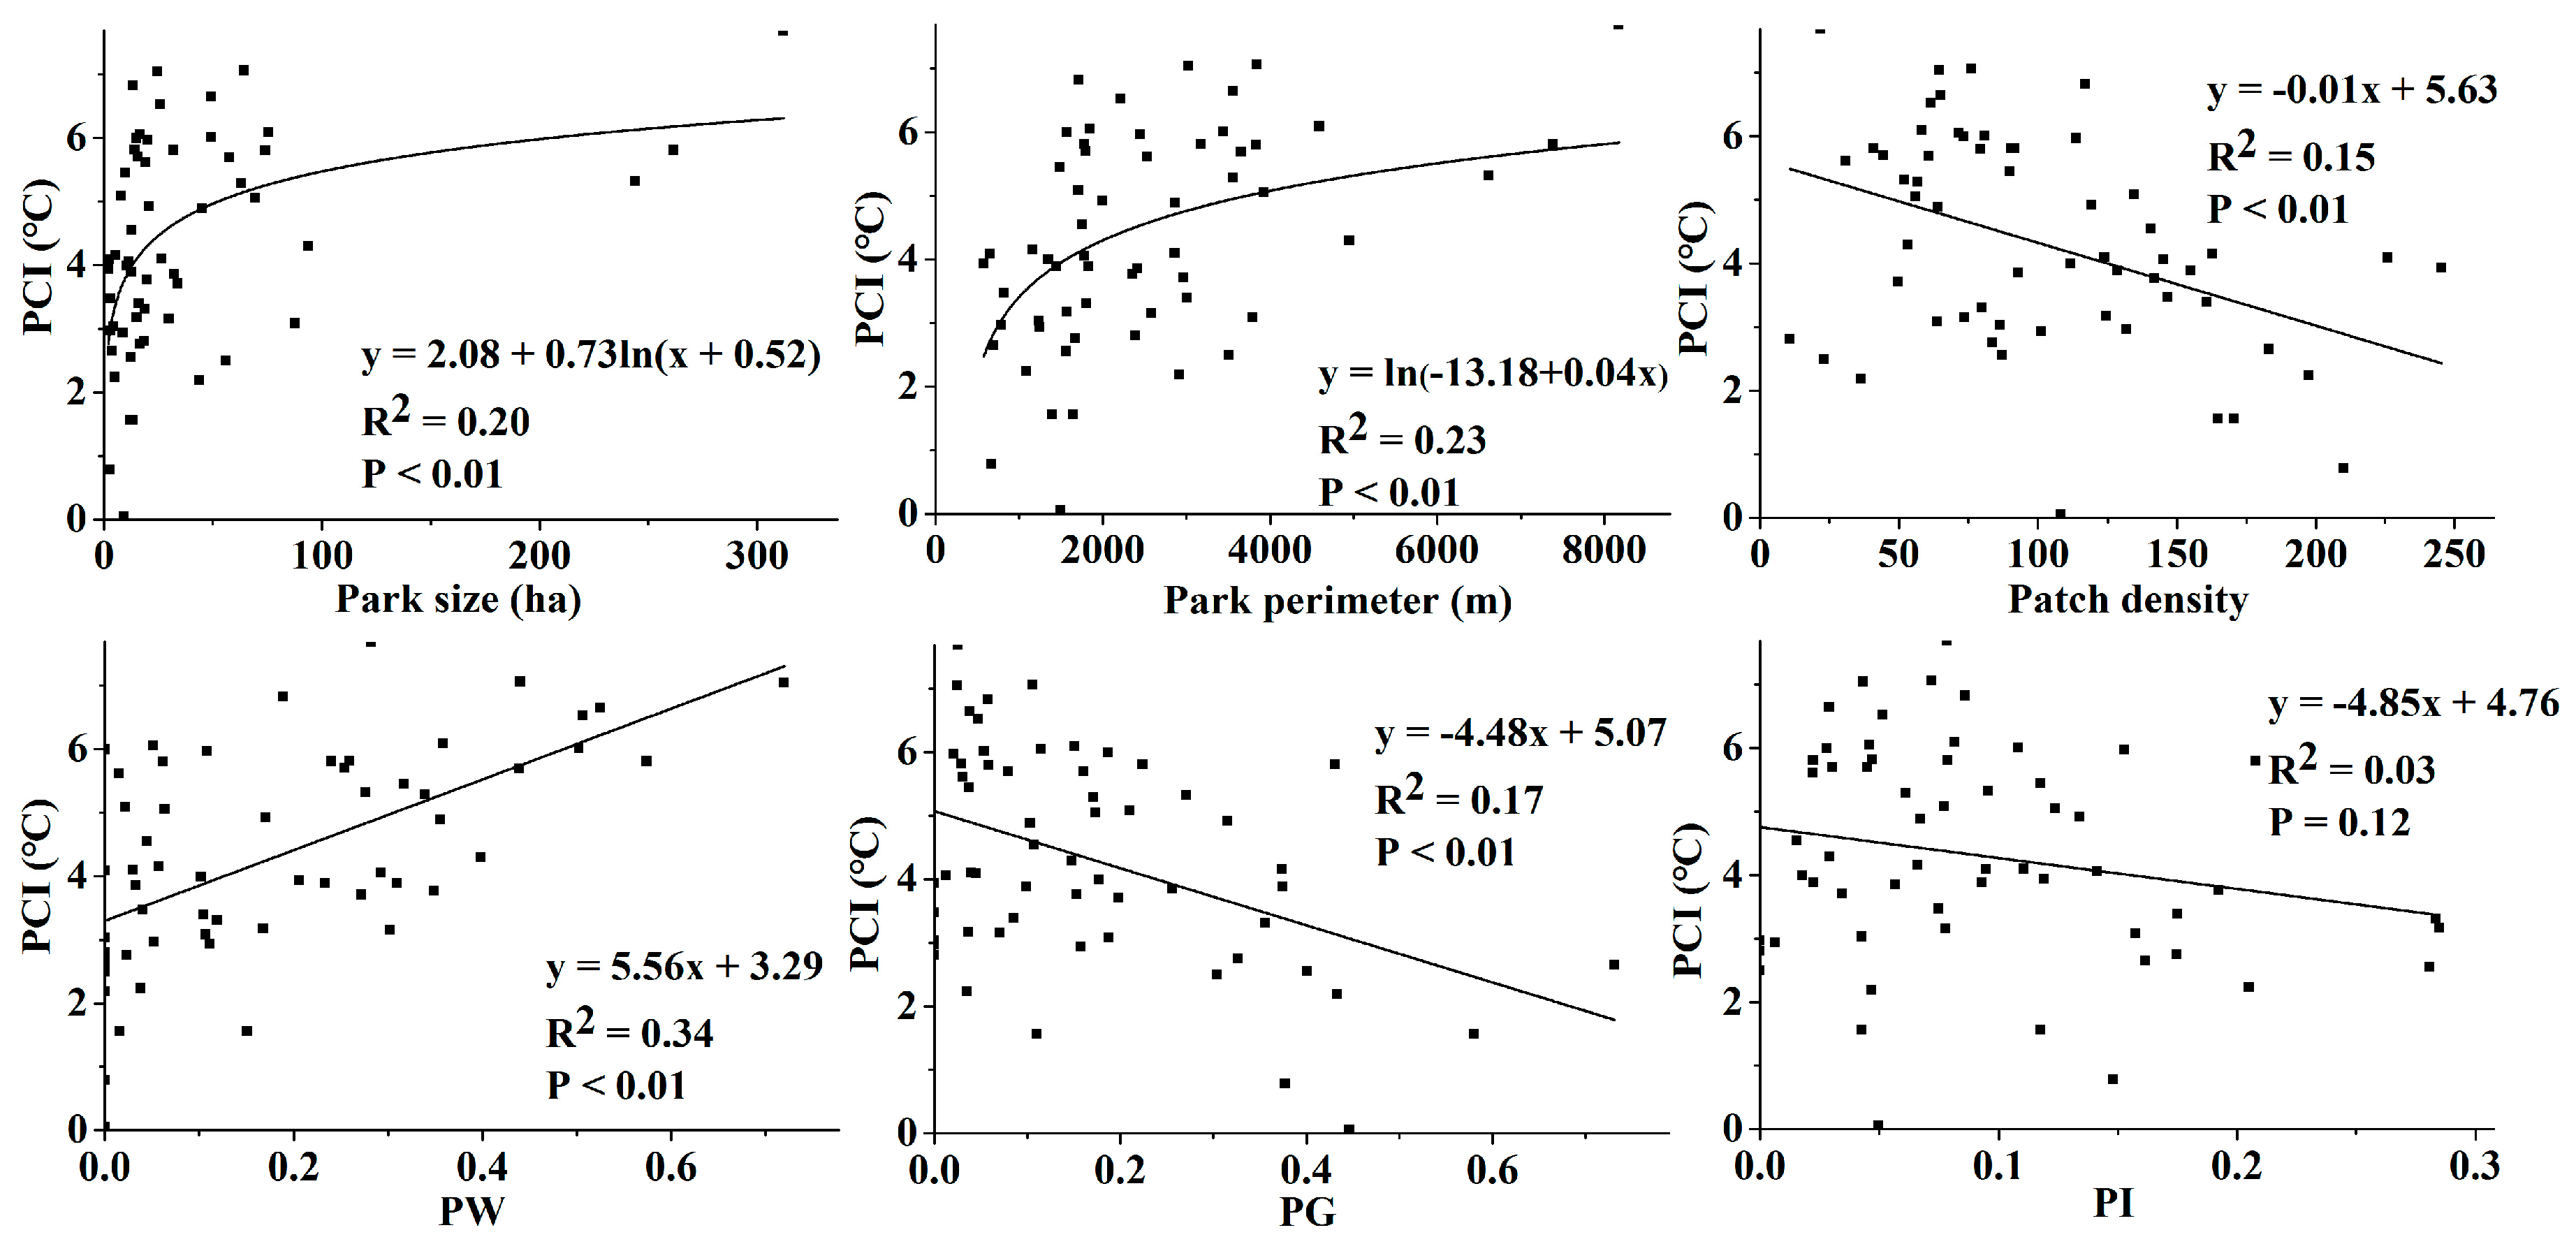
3.4.3. The Effects of Land Use and Landscape Metrics on PCIs

Both park land use and park landscape metrics potentially influence PCI formation. Multiple regression analyses were performed between the LPCI and park characteristics, and the standardized coefficients of these models indicate the relative contribution (importance) of each independent variable.
The results showed that the value (standardized coefficients) of each park characteristic differed significantly (Table 6). In May, June, and July, the significant independent variables included PG, PW, and PD. In August, PW and PD were significant. Only PD was significant in September and there were no significant variables in October. The percentage of tree area was not included in these models. LPCI was positively correlated with PW from May to August, implying that a higher percentage of water increases the LPCI and that PW was the only variable that influenced the LPCI. Conversely, LPCI was negatively correlated with PG from May to July. Finally, a significant negative relationship was found between LPCI and PD, but the effect of PD on LPCI was less important than that of PG. The influence of other factors including PI, PS, and PLSI, on LPCI were not significant throughout the study duration.

4. Discussion

4.1. Urban Park LST and Impact Factors

Parks with lower LSTs tend to produce stronger PCI without regard to the surrounding environment and could reduce the negative effects of UHI. Theoretically, the LST is a function of the material composition and the energy received from the sun [23]. As a result, both the urban park characteristics and the date of measurement could have an important influence on park LSTs. Our results indicated that the park LST depended on the park size, perimeter, shape, and patch density, as well as the percent area of water, grass, and impervious surfaces in parks. These results generally agree with previous studies [11,16].
The park size and perimeter significantly affected the LST of all parks throughout the study period, particularly from June to August when the air temperatures were the highest. The parks consisted primarily of land use classifications that induce cooling, including vegetation and water bodies; the area of buildings and soil only comprise a small area. Therefore, parks with larger areas and perimeters had low LSTs. The effect of the percentage of tree area in parks on the LST was not significant in our study, although many studies have shown that the area of urban green space significantly decreases the LST [50,52]. In this study, most parks had water bodies that significantly reduced the LST, and this cooling effect may have reduced the effect of park trees. However, if the area of trees and water bodies are considered a single variable, there is a clear negative correlation between this variable and LST [43]. The park soil did not significantly affect LST due to a limited amount of soil land area in the parks studied.
Both the percent area of grass and impervious surfaces showed positive relationships with park LST on all dates except for 3 October 2014, indicating that park LST should increase with corresponding increases in both of these variables. Impervious surfaces, made up of chemical materials that store short-wave radiation, will increase the LST. However, the heating effect of grass found in this study was consistent with previous studies [16]. It seemed that the different growth conditions of grass significantly affect LST. As landscape metrics, compared to PLSI, the positive relationship between patch density and LST was much stronger. High patch density indicates that the park is divided into many small parts, which results in higher LSTs.

4.2. The Relationships between the PCI and Impact Factors

The results from this study verified that urban parks have cooling island effects (except for during the winter) and that PCI intensity varies considerably by month, similar to the cooling effect of urban green spaces [10,30,43]. The PCI effect was strong during the warm months. Although the urban parks still have PCIs during cool periods, the PCI effect in this study was insignificant as the temperature of urban area was low. The strongest PCI intensity (6.26 °C) was found in parks with areas greater than 200 ha on 31 July 2014. The TIR images were acquired at approximately 10:21 am local time, which was not the hottest time during the day, and therefore, the PCI effect may be even larger during the warmest parts of the day.
The urban park cooling effect can be influenced by many factors that can be classified into two categories: urban park characteristics and external impactors (e.g., distance to the park, surrounding land use pattern, and topography) [11,28]. Similar to the relationships between urban park features and LST, the park size, park perimeter, and park water bodies were all positively correlated with the PCI, consistent with previous studies [32,53,54]. Figure 9 shows the regression models of the relationships between urban park features and PCIs on 31 July 2014, which was the hottest period for Changchun city according to the local meteorological records. Figure 7 and Figure 8 indicate that larger parks generally had stronger PCI intensities and greater extents of cooling effects than smaller parks. Figure 9 indicates that the relationship between park size and PCIs is not linear, a result which agrees with previous studies [16]. Additionally, the results showed a threshold park size of 80 ha over which the PCI effect did not sharply increase.
Figure 7 also shows the large standard deviations of small park PCIs, indicating that the small park PCIs were easily affected by the surrounding environment. In addition, the PCIs of parks with similar characteristics (e.g., park size and land use) differ considerable solely due to location. As a result, regardless of the park features, 6 regression models were constructed to explore the effect of the mean LSTs of the 600-m buffer zones on PCI (Figure 10). Moreover, the relationships between PCIs and the surrounding LSTs were significant on all dates, providing evidence that the PCI effect was stronger in hotter regions, independent of park features.

4.3. Implication for Urban Park Planning

Urban parks planning is of vital importance to regulating urban area microclimates [10,15,55]. There are two main considerations in urban park planning: location and park characteristics. Based on the results from this study and only considering the thermal environment, parks should be placed in the hottest areas of the city because PCI effects will be stronger, regardless of park size. Although both the park shape and the patch density influence the PCI effect, these metrics should be considered secondary to park size and land use. When considering park land use, the total area of trees and water bodies should be prioritized, as these features contribute the most to decreasing temperatures. Although, according to this study, increasing the area of grass will increase park temperature, grass provides beneficial services. For example, grassy areas supply open space for residents to perform outdoor activities. Creation of large urban parks with many trees and bodies of water optimizes the associated cooling effects.

4.4. Limitations and Future Research

Despite the positive results, there are some limitations to this study. Due to the sparse temporal resolution of thermal infrared images, only one image was used to represent each month. In addition, only day-time data were collected, and information concerning the night-time hours is necessary for a more comprehensive understanding of the mechanism behind the cooling effect. Although other parks were excluded from the buffer zones, other urban green spaces, such as road forests, may affect the PCI calculations. Thus, in future studies, it is better to combine remote sensing data with good synchronicity and in-situ observation with high temporal resolution to examine the cooling effect of urban parks in a more detailed way. Finally, other factors, such as wind speed, wind direction, and anthropogenic activities, may influence the cooling effect and should be a focus of future research.

5. Conclusions

A better understanding of the urban park cooling effect is vitally important in mitigating the negative influences of UHI. Taking Changchun, China, a snow climate city as a case study, the current study investigates the monthly variations of the urban park cooling island effect and its relationship to urban park characteristics using quantitative methods based on Landsat 8 TIR and GF-2 images. The main results are as follows:
(1) The urban parks showed a cooling island effect, which varied significantly by month. The mean park cooling island intensity was approximately 4.0 °C between June and August, and 2.71 °C, 1.93 °C, and 1.10 °C for May, September, and October, respectively. The strongest PCI (6.26 °C) was observed in parks with 200 ha areas or greater in July, which was also the hottest month during the year.
(2) Urban park characteristics affected PCIs considerably. PCIs showed positive relationships with park size, park perimeter, and the percent water area. PCIs also had negative relationships with patch density and area of impervious surfaces. Unexpectedly, the percent area of grass showed a positive relationship with park LST.
(3) Large urban parks tend to have greater PCI extents than small parks. For parks larger than 30 ha, the cooling effect extended approximately 480 m from the park edges between June and August. PCI extent was greatly reduced during the other months when temperatures were relatively low.
In urban park planning, park size and the total area of trees and water merit consideration due to their significant influence on the cooling effect. We hope the results of this study will provide insights for the sustainable developments of cities.

Acknowledgments

This research was supported by the project of Multidisciplinary Scientific Investigation in the boundary of China, Russia, and Mongolia (2017FY101301) and the Youth Science Fund Project (41301466) approved by the National Natural Science Foundation of China. Thanks to the Weather Bureau of Changchun for providing local meteorological data. Thanks to the China Scholarship Council for funding Chaobin Yang to study and do scientific research at the University of North Carolina at Charlotte (UNCC), USA. Thanks to the Writing Resources Center in UNCC and Elsevier’s language editing service for helping with the English editing.

Author Contributions

Chaobin Yang analyzed the data and wrote the paper. Xingyuan He and Shuwen Zhang conceived and designed the research; Liping Chang, Kun Bu, and Jiuchun Yang helped to gain data and extract urban parks information. Lingxue Yu and Fengqin Yan assisted in data analysis and editing manuscript.

Conflicts of Interest

The authors declare no conflict of interest.

References

  1. United Nations, Department of Economic and Social Affairs, Population Division. The World’s Cities in 2016—Data Booklet; st/esa/ ser.A/392; United Nations, Department of Economic and Social Affairs, Population Division: New York, NY, USA, 2016. [Google Scholar]
  2. Kalnay, E.; Cai, M. Impact of urbanization and land-use change on climate. Nature 2003, 423, 528. [Google Scholar] [CrossRef] [PubMed]
  3. Weng, Y.-C. Spatiotemporal changes of landscape pattern in response to urbanization. Landsc. Urban Plan. 2007, 81, 341–353. [Google Scholar] [CrossRef]
  4. Oke, T.R. City size and the urban heat island. Atmos. Environ. 1973, 7, 769–779. [Google Scholar] [CrossRef]
  5. Rizwan, A.M.; Dennis, L.Y.; Chunho, L. A review on the generation, determination and mitigation of urban heat island. J. Environ.Sci. 2008, 20, 120–128. [Google Scholar] [CrossRef]
  6. Debbage, N.; Shepherd, J.M. The urban heat island effect and city contiguity. Comput. Environ. Urban Syst. 2015, 54, 181–194. [Google Scholar] [CrossRef]
  7. Patz, J.A.; Campbell-Lendrum, D.; Holloway, T.; Foley, J.A. Impact of regional climate change on human health. Nature 2005, 438, 310–317. [Google Scholar] [CrossRef] [PubMed]
  8. Sarrat, C.; Lemonsu, A.; Masson, V.; Guedalia, D. Impact of urban heat island on regional atmospheric pollution. Atmos. Environ. 2006, 40, 1743–1758. [Google Scholar] [CrossRef]
  9. Santamouris, M. On the energy impact of urban heat island and global warming on buildings. Energy Build. 2014, 82, 100–113. [Google Scholar] [CrossRef]
  10. Chang, C.-R.; Li, M.-H. Effects of urban parks on the local urban thermal environment. Urban For. Urban Green. 2014, 13, 672–681. [Google Scholar] [CrossRef]
  11. Feyisa, G.L.; Dons, K.; Meilby, H. Efficiency of parks in mitigating urban heat island effect: An example from Addis Ababa. Landsc. Urban Plan. 2014, 123, 87–95. [Google Scholar] [CrossRef]
  12. Akpinar, A.; Barbosa-Leiker, C.; Brooks, K.R. Does green space matter? Exploring relationships between green space type and health indicators. Urban For. Urban Green. 2016, 20, 407–418. [Google Scholar] [CrossRef]
  13. Zhang, B.; Xie, G.-D.; Gao, J.-X.; Yang, Y. The cooling effect of urban green spaces as a contribution to energy-saving and emission-reduction: A case study in Beijing, China. Build. Environ. 2014, 76, 37–43. [Google Scholar] [CrossRef]
  14. Kabisch, N. Ecosystem service implementation and governance challenges in urban green space planning—The case of Berlin, Germany. Land Use Policy 2015, 42, 557–567. [Google Scholar] [CrossRef]
  15. Xu, X.; Sun, S.; Liu, W.; García, E.H.; He, L.; Cai, Q.; Xu, S.; Wang, J.; Zhu, J. The cooling and energy saving effect of landscape design parameters of urban park in summer: A case of Beijing, China. Energy Build. 2017, 149, 91–100. [Google Scholar] [CrossRef]
  16. Cao, X.; Onishi, A.; Chen, J.; Imura, H. Quantifying the cool island intensity of urban parks using ASTER and IKONOS data. Landsc. Urban Plan. 2010, 96, 224–231. [Google Scholar] [CrossRef]
  17. Shashua-Bar, L.; Hoffman, M.E. Vegetation as a climatic component in the design of an urban street: An empirical model for predicting the cooling effect of urban green areas with trees. Energy Build. 2000, 31, 221–235. [Google Scholar] [CrossRef]
  18. Susca, T.; Gaffin, S.; Dell’Osso, G. Positive effects of vegetation: Urban heat island and green roofs. Environ. Pollut. 2011, 159, 2119–2126. [Google Scholar] [CrossRef] [PubMed]
  19. Camilloni, I.; Barrucand, M. Temporal variability of the Buenos Aires, Argentina, urban heat island. Theor. Appl. Climatol. 2012, 107, 47–58. [Google Scholar] [CrossRef]
  20. Weng, Q. Thermal infrared remote sensing for urban climate and environmental studies: Methods, applications, and trends. ISPRS J. Photogramm. Remote Sens. 2009, 64, 335–344. [Google Scholar] [CrossRef]
  21. Voogt, J.A.; Oke, T.R. Thermal remote sensing of urban climates. Remote Sens. Environ. 2003, 86, 370–384. [Google Scholar] [CrossRef]
  22. Estoque, R.C.; Murayama, Y.; Myint, S.W. Effects of landscape composition and pattern on land surface temperature: An urban heat island study in the megacities of Southeast Asia. Sci. Total Environ. 2017, 577, 349–359. [Google Scholar] [CrossRef] [PubMed]
  23. Li, Z.-L.; Tang, B.-H.; Wu, H.; Ren, H.; Yan, G.; Wan, Z.; Trigo, I.F.; Sobrino, J.A. Satellite-derived land surface temperature: Current status and perspectives. Remote Sens. Environ. 2013, 131, 14–37. [Google Scholar] [CrossRef]
  24. Rogan, J.; Ziemer, M.; Martin, D.; Ratick, S.; Cuba, N.; DeLauer, V. The impact of tree cover loss on land surface temperature: A case study of central Massachusetts using Landsat Thematic Mapper thermal data. Appl. Geogr. 2013, 45, 49–57. [Google Scholar] [CrossRef]
  25. Peng, S.; Piao, S.; Ciais, P.; Friedlingstein, P.; Ottle, C.; Bréon, F.-M.; Nan, H.; Zhou, L.; Myneni, R.B. Surface urban heat island across 419 global big cities. Environ. Sci. Technol. 2011, 46, 696–703. [Google Scholar] [CrossRef] [PubMed]
  26. Schwarz, N.; Schlink, U.; Franck, U.; Großmann, K. Relationship of land surface and air temperatures and its implications for quantifying urban heat island indicators—An application for the city of Leipzig (Germany). Ecol. Indic. 2012, 18, 693–704. [Google Scholar] [CrossRef]
  27. Ho, H.C.; Knudby, A.; Xu, Y.; Hodul, M.; Aminipouri, M. A comparison of urban heat islands mapped using skin temperature, air temperature, and apparent temperature (Humidex), for the greater Vancouver area. Sci. Total Environ. 2016, 544, 929–938. [Google Scholar] [CrossRef] [PubMed]
  28. Hamada, S.; Tanaka, T.; Ohta, T. Impacts of land use and topography on the cooling effect of green areas on surrounding urban areas. Urban For. Urban Green. 2013, 12, 426–434. [Google Scholar] [CrossRef]
  29. Derkzen, M.L.; Teeffelen, A.J.; Verburg, P.H. Review: Quantifying urban ecosystem services based on high-resolution data of urban green space: An assessment for Rotterdam, The Netherlands. J. Appl. Ecol. 2015, 52, 1020–1032. [Google Scholar] [CrossRef]
  30. Yang, C.; He, X.; Wang, R.; Yan, F.; Yu, L.; Bu, K.; Yang, J.; Chang, L.; Zhang, S. The effect of urban green spaces on the urban thermal environment and its seasonal variations. Forests 2017, 8, 153. [Google Scholar] [CrossRef]
  31. Spronken-Smith, R.; Oke, T. The thermal regime of urban parks in two cities with different summer climates. Int. J. Remote Sens. 1998, 19, 2085–2104. [Google Scholar] [CrossRef]
  32. Potchter, O.; Cohen, P.; Bitan, A. Climatic behavior of various urban parks during hot and humid summer in the Mediterranean city of Tel Aviv, Israel. Int. J. Climatol. 2006, 26, 1695–1711. [Google Scholar] [CrossRef]
  33. Chen, X.; Su, Y.; Li, D.; Huang, G.; Chen, W.; Chen, S. Study on the cooling effects of urban parks on surrounding environments using Landsat TM data: A case study in Guangzhou, Southern China. Int. J. Remote Sens. 2012, 33, 5889–5914. [Google Scholar] [CrossRef]
  34. Chan, S.; Chau, C.; Leung, T. On the study of thermal comfort and perceptions of environmental features in urban parks: A structural equation modeling approach. Build. Environ. 2017, 122, 171–183. [Google Scholar] [CrossRef]
  35. Yuan, F.; Bauer, M.E. Comparison of impervious surface area and normalized difference vegetation index as indicators of surface urban heat island effects in Landsat imagery. Remote Sens. Environ. 2007, 106, 375–386. [Google Scholar] [CrossRef]
  36. Mallick, J.; Rahman, A.; Singh, C.K. Modeling urban heat islands in heterogeneous land surface and its correlation with impervious surface area by using night-time aster satellite data in highly urbanizing city, Delhi-India. Adv. Space Res. 2013, 52, 639–655. [Google Scholar] [CrossRef]
  37. Turner, M.G. Landscape ecology: The effect of pattern on process. Annu. Rev. Ecol. Syst. 1989, 20, 171–197. [Google Scholar] [CrossRef]
  38. Deng, J.S.; Wang, K.; Hong, Y.; Qi, J.G. Spatio-temporal dynamics and evolution of land use change and landscape pattern in response to rapid urbanization. Landsc. Urban Plan. 2009, 92, 187–198. [Google Scholar] [CrossRef]
  39. Connors, J.P.; Galletti, C.S.; Chow, W.T. Landscape configuration and urban heat island effects: Assessing the relationship between landscape characteristics and land surface temperature in Phoenix, Arizona. Landsc. Ecol. 2013, 28, 271–283. [Google Scholar] [CrossRef]
  40. McGarigal, K.; Cushman, S.A.; Neel, M.C.; Ene, E. FRAGSTATS: Spatial Pattern Analysis Program for Categorical Maps; University of Massachusetts: Amherst, MA, USA, 2002. [Google Scholar]
  41. Hamada, S.; Ohta, T. Seasonal variations in the cooling effect of urban green areas on surrounding urban areas. Urban For. Urban Green. 2010, 9, 15–24. [Google Scholar] [CrossRef]
  42. Cui, Y.Y.; De Foy, B. Seasonal variations of the urban heat island at the surface and the near-surface and reductions due to urban vegetation in Mexico City. J. Appl. Meteorol. Climatol. 2012, 51, 855–868. [Google Scholar] [CrossRef]
  43. Du, H.; Cai, W.; Xu, Y.; Wang, Z.; Wang, Y.; Cai, Y. Quantifying the cool island effects of urban green spaces using remote sensing data. Urban For. Urban Green. 2017, 27, 24–31. [Google Scholar] [CrossRef]
  44. Kottek, M.; Grieser, J.; Beck, C.; Rudolf, B.; Rubel, F. World map of the Köppen-Geiger climate classification updated. Meteorol. Z. 2006, 15, 259–263. [Google Scholar] [CrossRef]
  45. Yang, C.; He, X.; Yan, F.; Yu, L.; Bu, K.; Yang, J.; Chang, L.; Zhang, S. Mapping the influence of land use/land cover changes on the urban heat island effect—A case study of Changchun, China. Sustainability 2017, 9, 312. [Google Scholar] [CrossRef]
  46. Roy, D.P.; Wulder, M.; Loveland, T.; Woodcock, C.; Allen, R.; Anderson, M.; Helder, D.; Irons, J.; Johnson, D.; Kennedy, R. Landsat-8: Science and product vision for terrestrial global change research. Remote Sens. Environ. 2014, 145, 154–172. [Google Scholar] [CrossRef]
  47. Qin, Z.-H.; Karnieli, A.; Berliner, P. A mono-window algorithm for retrieving land surface temperature from Landsat TM data and its application to the Israel-Egypt border region. Int. J. Remote Sens. 2001, 22, 3719–3746. [Google Scholar] [CrossRef]
  48. Chen, A.; Yao, L.; Sun, R.; Chen, L. How many metrics are required to identify the effects of the landscape pattern on land surface temperature? Ecol. Indic. 2014, 45, 424–433. [Google Scholar] [CrossRef]
  49. Fan, C.; Myint, S. A comparison of spatial autocorrelation indices and landscape metrics in measuring urban landscape fragmentation. Landsc. Urban Plan. 2014, 121, 117–128. [Google Scholar] [CrossRef]
  50. Maimaitiyiming, M.; Ghulam, A.; Tiyip, T.; Pla, F.; Latorre-Carmona, P.; Halik, Ü.; Sawut, M.; Caetano, M. Effects of green space spatial pattern on land surface temperature: Implications for sustainable urban planning and climate change adaptation. ISPRS J. Photogramm. Remote Sens. 2014, 89, 59–66. [Google Scholar] [CrossRef]
  51. Zhao, M.; Cai, H.; Qiao, Z.; Xu, X. Influence of urban expansion on the urban heat island effect in Shanghai. Int. J. Geogr. Inf. Sci. 2016, 30, 2421–2441. [Google Scholar] [CrossRef]
  52. Doick, K.J.; Peace, A.; Hutchings, T.R. The role of one large greenspace in mitigating London’s nocturnal urban heat island. Sci. Total Environ. 2014, 493, 662–671. [Google Scholar] [CrossRef] [PubMed]
  53. Zhang, Z.; Lv, Y.; Pan, H. Cooling and humidifying effect of plant communities in subtropical urban parks. Urban For. Urban Green. 2013, 12, 323–329. [Google Scholar] [CrossRef]
  54. Brown, R.D.; Vanos, J.; Kenny, N.; Lenzholzer, S. Designing urban parks that ameliorate the effects of climate change. Landsc. Urban Plan. 2015, 138, 118–131. [Google Scholar] [CrossRef]
  55. Lin, C.-H.; Lin, T.-P.; Hwang, R.-L. Thermal comfort for urban parks in subtropics: Understanding visitor’s perceptions, behavior and attendance. Adv. Meteorol. 2013, 2013, 640473. [Google Scholar] [CrossRef]
Figure 1. GF-2 image of Changchun city (1 m resolution) and the distribution of weather stations.
Remotesensing 09 01066 g001
Figure 2. Urban park land use and 60 m interval buffer zones.
Remotesensing 09 01066 g002
Figure 3. Relationship between observed air temperature and retrieved land surface temperature (LST).
Remotesensing 09 01066 g003
Figure 4. The spatial patterns of LST in selected months and the black polygons correspond to the park boundaries from Figure 1.
Remotesensing 09 01066 g004
Figure 5. Correlations between urban park characteristics and LST (the columns correspond to dates and the rows correspond to characteristics. All the Y-axes are park LST values. Soil land (PS) was excluded from the plot because park PS is small and the relationship between PS and LST is not significant).
Remotesensing 09 01066 g005
Figure 6. Mean urban park largest park cool islands (LPCI) for various dates.
Remotesensing 09 01066 g006
Figure 7. Mean and standard deviation of LPCI for different park sizes.
Remotesensing 09 01066 g007
Figure 8. Mean LST versus distance from urban park edge.
Remotesensing 09 01066 g008
Figure 9. Regression models of PCI and urban park characteristics on 31 July 2014.
Remotesensing 09 01066 g009
Figure 10. Regression models for the mean LST of the 600 m buffer zones and LPCI.
Remotesensing 09 01066 g010
Table 1. The images used in this study
SensorsDateResolutionPath/Row
Landsat 8 OLI/TIRS15 May 2015, 13 June 2014, 31 July 2014
5 August 2016, 17 September 2014, 3 October 2014
30 m118/30
GF-215 May 20151 m125.3°E, 43.8°N
125.4°E, 44.0°N
Table 2. Urban park land use classifications.
Types and AbbreviationDescription
Park trees, PTCovered by woodland and shrubs; other vegetation is less than 10%
Park grass, PGDominated by herbs and lawn; other vegetation is less than 10%
Park water bodies, PWRivers, lakes, and/or ponds
Park soil land, PSCovered by bare soil; less than 5% vegetation cover
Park impervious surfaces, PIBuildings, pavements, and other man-made impervious surfaces
Table 3. Landscape metrics used in this study.
Landscape Metrics And AbbreviationsDescriptions and Calculations
Park area, PAThe area of parks (ha), PA > 0, without limit
Park perimeter, PPThe perimeter (m) of parks, PP > 0, without limit
Park landscape shape index, PLSILSI = PP/(2√πPA), LSI > 0, without limit
Park patch density, PDPD = n*100/PA, where n is the number of patches in a given park
Table 4. Urban park metrics and monthly LST data.
Values PA (ha)PP (m)PLSIPDMay (°C)June (°C)July (°C)August (°C)September (°C)October (°C)
Max312.138171.592.11296.5124.5636.0436.3239.4526.6916.64
Min2.03576.671.0110.7418.1427.4728.2030.2321.7913.21
Ave35.292348.691.33112.4920.2330.7331.6834.2323.3914.32
Max, Min, and Ave are abbreviations maximum, minimum, and average, respectively.
Table 5. Bivariate correlations between urban park characteristics, landscape metrics, and LST.
DatePAPPPLSIPDPTPGPWPIPS
15 May 2015−0.47 **−0.65 **−0.27 **0.68 **0.120.40 **−0.67 **0.39 **−0.03
13 June 2014−0.43 **−0.63 **−0.30 *0.71 **0.030.42 **−0.59 **0.37 **−0.02
31 July 2014−0.52 **−0.67 **−0.220.70 **0.070.37 **−0.57 **0.37 **−0.08
5 August 2016−0.50 **−0.69 **−0.240.69 **0.220.35 **−0.51 **0.36 **−0.12
17 September 2014−0.48 **−0.62 **−0.25 *0.63 **−0.040.45 **−0.52 **0.29 *−0.02
3 October 2014−0.41 **−0.49 **−0.150.46 **−0.190.36 **−0.210.19−0.01
* Correlation is significant at the 0.05 level (2-tailed); ** correlation is significant at the 0.01 level (2-tailed).
Table 6. Multiple linear regressions of PCI intensity and characteristics of parks (n = 66).
Date5 May 201513 June 201431 July 20145 August 201617 September 20143 October 2014
VariablesValueSig.ValueSig.ValueSig.ValueSig.ValueSig.ValueSig.
Intercept3.9110.0046.1650.0005.640.0006.260.0003.280.0032.770.006
PG−0.3140.008−0.3620.001−0.3070.008−0.2160.091−0.2560.064−0.2690.066
PW0.3690.0020.3310.0030.4300.0000.3370.0080.1920.151−0.2760.053
PI−0.0040.968−0.0150.883−0.0180.8620.0200.864−0.0300.814−0.1030.448
PS−0.1100.284−0.1050.284−0.0810.421−0.0410.721−0.1560.205−0.2590.051
PD−0.2850.012−0.3540.001−0.2620.019−0.3430.007−0.2640.049−0.1330.342
PLSI0.0040.971−0.0240.821−0.0480.660−0.0940.445−0.0470.721−0.0940.506
R20.48 0.54 0.50 0.37 0.27 0.17
Std. error1.10 1.24 1.25 1.27 0.90 0.80

