Automated Detection of Buildings from Heterogeneous VHR Satellite Images for Rapid Response to Natural Disasters


1
Key Laboratory of Environment Change and Natural Disaster, Ministry of Education, Beijing Normal University, Beijing 100875, China
2
State Key Laboratory of Earth Surface Processes and Resource Ecology, Beijing Normal University, Beijing 100875, China
3
School of Remote Sensing and Information Engineering, Wuhan University, Wuhan 430072, China
*
Author to whom correspondence should be addressed.
Remote Sens. 2017, 9(11), 1177; https://0-doi-org.brum.beds.ac.uk/10.3390/rs9111177
Submission received: 22 August 2017
/
Revised: 3 November 2017
/
Accepted: 14 November 2017
/
Published: 17 November 2017
(This article belongs to the Section Remote Sensing Image Processing)
Abstract
:In this paper, we present a novel approach for automatically detecting buildings from multiple heterogeneous and uncalibrated very high-resolution (VHR) satellite images for a rapid response to natural disasters. In the proposed method, a simple and efficient visual attention method is first used to extract built-up area candidates (BACs) from each multispectral (MS) satellite image. After this, morphological building indices (MBIs) are extracted from all the masked panchromatic (PAN) and MS images with BACs to characterize the structural features of buildings. Finally, buildings are automatically detected in a hierarchical probabilistic model by fusing the MBI and masked PAN images. The experimental results show that the proposed method is comparable to supervised classification methods in terms of recall, precision and F-value.
1. Introduction
Natural hazards (e.g., earthquakes) can destroy buildings and often result in serious casualties and huge property losses. Therefore, rapid building mapping and damage assessments play a significant role in the speed of emergency responses and disaster reduction [1,2,3,4]. Since earthquakes cannot be predicted, such events must be managed using available satellite images. Figure 1 shows the available very high-resolution (VHR) satellite images captured several days after the Wenchuan earthquake in 2008. The lack of appropriate satellite imagery poses a considerable challenge for current rapid building mapping techniques that require little or no human intervention [5], because (1) multiple monocular VHR images are obtained from sensors with different spectral, spatial and radiometric characteristics; (2) diverse buildings are scattered throughout areas with different backgrounds, such as plains, mountainous regions, rural or urban areas; and (3) variable imaging environments, such as haze or cloud cover conditions.
Currently, a number of studies have documented methods of extracting buildings from remote-sensing images using low-level features, such as edge/line segments [6,7,8,9], corners [10], spectra, texture [11,12] and morphological features (MFs) [13,14]. One study [5] has conducted a thorough review of previous studies on building detection using single monocular remote-sensing images. In the remainder of this section, we will provide an overview of recent work combining multiple features to detect buildings.
Supervised classification is a flexible approach to combining detailed spectral and spatial information with shapes or textures to delineate buildings from VHR satellite images. Shackelford and Davis proposed a combination of pixel-based and object-based methods to classify urban land cover from pan-sharpened multispectral (MS) IKONOS-2 images [15]. A fuzzy pixel-based classifier was first used to discriminate spectrally similar road and building classes by integrating both spectral and spatial information. Subsequently, an object-based classifier discriminated the classes from urban impervious surfaces by using shape, spectral and neighborhood information. Huang et al. investigated a structural feature set for land cover classification in urban areas from MS imagery with high spatial resolution [16]. Fauvel et al. used a support vector machine (SVM) method to classify land cover in urban areas by concatenating spectral information and MFs [14]. Pesaresi et al. proposed an inter-scale learning and classification framework to produce a global human settlement layer by fusing the globally available information with low resolution and high-resolution image-derived textures and MFs [17]. San and Turker utilized the two-class SVM to detect building patches from pan-sharpened IKONOS imagery, and found that additional bands in SVM classification had a significant effect in building detection accuracy [18]. Pal and Foody found that the relevance vector machine (RVM) and sparse multi-nominal logistic regression (SMLR) were able to derive classifications of similar accuracy to the SVM but required considerably fewer training cases [19]. However, supervised methods for building classification may not be appropriate for facilitating rapid responses to disaster reduction because the effectiveness and efficiency of such methods are heavily dependent on training samples and the chosen machine learning approaches.
Graph-based approaches are commonly used to verify buildings over possible rooftop candidates by modeling the spatial dependencies between candidates in a stochastic optimization process. Katartzis and Sahli used Markov random fields (MRFs) in a stochastic framework for the identification of building rooftops [20]. Benedek et al. integrated several low-level features in a multi-temporal marked point process model to detect buildings and their possible changes [21]. Li et al. proposed a higher-order conditional random field to extract rooftops by integrating both pixel-level and segment-level features [22,23]. Anees et.al exploited the least squares probabilistic classifier (LSPC) method to model class posterior probabilities using a linear combination of 74 Gaussian kernels for change detection [24]. However, in graph-based methods, spatial dependencies among candidates are usually inferred for specific image planes. For another image with different patterns of land cover, the parameters of the models must be finely tuned. Therefore, such methods are inappropriate for rapid response techniques after natural disasters, which require rapid building mapping methods with little or no human input.
In this paper, we present an unsupervised classification framework for rapid building mapping after natural disasters from multiple heterogeneous monocular VHR satellite images, which could eliminate the need to fine-tune model parameters from one image to another. In the proposed framework, both VHR satellite images and their MFs are fused in a hierarchical probabilistic clustering model. As shown in Figure 2, the model consists of two-layer clustering in which a local clustering model is learned for a different VHR image. The goal of the local clustering is to segment the images into individual objects or object parts. Therefore, the proposed model could adapt well to different characteristics of the studied images and the imaging environment in terms of local clustering. In the second layer, the MFs of image objects are used to discriminate buildings from non-buildings with a learned probabilistic distribution over all images, which we call global clustering. The two-layer clustering method is different from the method used by Shackelford and Davis [15], because learning occurs in a unified hierarchical probabilistic model, which is an extension of the generalized Chinese restaurant franchise (gCRF) method of Mao et al. [25].
2. Proposed Method
In this section, we describe the relationship among the three indispensable components of the proposed method, gCRF_MBI (i.e., generalized Chinese restaurant franchise and morphological building index). After being given a VHR satellite image, a detailed algorithm and its mathematical description for the proposed method are given in Section 2.2 and Section 2.3, respectively. Finally, we outline the way to detect buildings from multiple VHR satellite images.
2.1. Relationship between Components
The proposed method consists of three sequential steps: (1) detection of built-up area candidates (BACs) from VHR satellite images; (2) extraction of the MFs masked by the BACs; and (3) unsupervised classification of both buildings and non-buildings. To simplify the expression, the acronyms used in the papers are given in Table 1.
The approaches adopted in the proposed method are presented in Figure 3. First, the spectral residual (SR) method is used to detect potential built-up areas, i.e., BACs [26,27]. The BACs are used as basic units for feature extraction and classification. After this, the morphological building index (MBI) of Huang and Zhang is used to extract MFs for classification [28]. Based on the BACs, the gCRF process is expanded to fuse both the panchromatic (PAN) image and the MF image for unsupervised learning and classification.
2.2. Algorithm for VHR Satellite Images
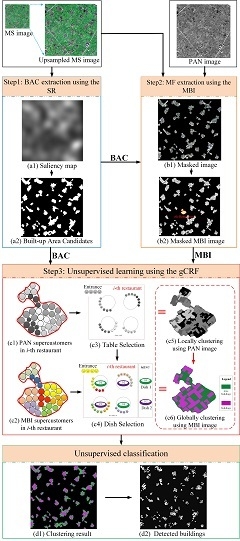
The flowchart of the proposed algorithm for a VHR satellite image is illustrated in Figure 4 and consists of three steps: (1) BAC extraction using the SR method, (2) MF extraction using the MBI, and (3) unsupervised learning for classification using the gCRF.
In the first step, an MS image is upsampled to the same spatial resolution as a PAN image using nearest-neighbor resampling. After this, a saliency map is derived from the upsampled MS image using the SR method as shown in Figure 4a, while a binary map with BACs is generated using a selection threshold [29].
In the second step, the upsampled MS image and PAN image are first stacked to obtain a masked stacked image using the BAC mask operation as shown in Figure 4b. After this, the MFs of buildings in the BACs (i.e., the MBIs) are extracted from the masked stacked image.
In the third step, hierarchical clusters are learned using both the VHR PAN image and the MBIs. To simplify the description, certain terms are analogized between the image process and model inference in the gCRF. The PAN images are first over-segmented into a set of superpixels, before each superpixel with a band of pixels is analogized as a super-customer that includes a set of customers. Thus, an over-segment over a PAN image and an MBI image will be explained by two types of people: PAN super-customers (see gray circles in Figure 4c) and MBI super-customers (see color circles in Figure 4c), respectively. Additionally, each BAC is analogized as a restaurant in the gCRF, with the “i-th restaurant” marked with a red dotted line for illustration in Figure 4b. In the metaphor of the gCRF, two random processes occur when a super-customer enters the restaurant: (1) a PAN super-customer randomly selects a table to sit at according to the PAN image and (2) an MBI super-customer takes the same table as the PAN super-customer and then randomly selects a dish to eat according to the MBI image. From the perspective of image processing, both table selection and dish selection in the gCRF model correspond to the local clustering and global clustering as shown in Figure 4c, respectively. In the global clustering of the gCRF model, we assume that only two types of clusters occur: buildings and non-buildings. Based on two-class clustering, buildings and non-buildings can be discriminated. Since MBI features imply the structural information of buildings, buildings can be identified as clusters with larger averaged MBI values.
2.3. Mathematical Description of Algorithm for VHR Satellite Images
In this subsection, a mathematical description is provided for each component adopted in the proposed method.
2.3.1. SR
First, the BACs are extracted using the SR method. For the upsampled MS image I(x), the BACs are extracted as follows.
- (1)
- A frequency image f of the upsampled MS image I(x) is obtained by Fourier transform:where F denotes the Fourier transform.f = F(I(x)),
- (2)
- The SR R(f) is defined as follows:where L(f) = log(A(f)); A(f) represents the amplitude spectrum and is determined by A(f) = abs(f) and h(f) is a 3 × 3 local average filter. Correspondingly, R(f) denotes the built-up areas of the input image.R(f) = L(f) − h(f) × L(f),
- (3)
- The saliency map S(x) in the spatial domain is constructed by the inverse Fourier transform:where F−1 denotes the inverse Fourier transform and P(f) represents the phase spectrum, which is determined by P(f) = angle (f).S(x) = F−1[exp(R(f) + P(f))]2,
After the saliency map, a binary image with BACs is obtained using the Otsu threshold algorithm. Additional details on built-up area detection using the SR method can be found in a previous study [27].
2.3.2. MBI
After obtaining the BACs, the building structural features in the BACs are extracted using MBI. Given the masked stacked image, the MBI calculations can be briefly described as follows.
- (1)
- The brightness value b(x) for pixel x of the masked stacked image is calculated as follows:where bandk indicates the spectral value of pixel x at the kth band and K is the number of bands.
- (2)
- The differential morphological profiles (DMPs) of the white top-hat are defined as follows:DMPW_TH(d, s) = |MPW_TH(d, s +Δs) − MPW_TH(d, s)|The white top-hat is defined as follows:where denotes the opening-by-reconstruction of the brightness image b, while s and d indicate the scale and direction of a linear structure element (SE), respectively. The term Δs represents the interval of the profiles, with smin ≤ s ≤ smax. The sizes of SE (smax, smin, and Δs) are determined according to the resolution of the image and the characteristics of buildings (smax = 2, smin = 52, and Δs = 5 in this paper).
- (3)
- The MBI of the built-up areas are defined as the average of their DMPs:where D and S denote the direction and scale of the profiles, respectively. Four directions are considered in this letter (D = 4), because an increase in D did not result in higher accuracy for building detection. The number of scales is calculated by S = ((smax − smin)/Δs) + 1.
MBI construction is based on the fact that building structures have larger values in most DMP directions. An MBI image that indicates the building structure is thus obtained.
2.3.3. gCRF
As shown in Figure 4, the probabilistic inference in the gCRF method can be explained by the iterative progress of both local and global clusters. In the local cluster, each over-segment of the PAN image within each BAC would be allocated with a local label using currently-inferred statistical models of local clusters. In the global cluster, all the over-segments of the BMI images with the same local cluster label would be allocated with global labels using currently-inferred statistical models of two global clusters, which are namely building and non-building.
Specifically, let and be the matrix with randomly-initiated labels of local and global clusters, respectively. Given a PAN image and its corresponding MBI image , the statistical models of l-th local cluster and g-th global cluster could be estimated as i.e., and , respectively. In this paper, the function is a multinomial function.
Given the j-th oversegmented pixels within the i-th BAC on a PAN image, the local clustering is used to allocate a local cluster label (i.e., ) with a probability distribution equal to:
where is the matrix without local label ; is the number of pixels in the l-th local cluster with the exception of the j-th over-segment; is the likelihood of in the l-th local cluster over the PAN image, which can be inferred from pixels using both the PAN image and the matrix of local cluster labels, i.e., ; and is a prior parameter.
Let be all of the pixels within the i-th BAC on the MBI images, whose local cluster label is equal to l. The global clustering is to allocate a global label (i.e., gi,l = g) to those with a probability distribution equal to:
where is the matrix without the l-th global label in the i-th BAC; is the number of local clusters within the g-th global clusters, when the l-th local cluster in the i-th BAC has been removed; and is the likelihood of in the g-th global cluster. The global label g could be two different integers, which corresponds to the class label of building or non-building, respectively. The global cluster is regarded as having the class of building if it has a higher mean MBI value.
The iteration of both local and global clustering would be stopped when the number of iterations of sweeping the whole image is up to the preset number of iterations.
2.4. Algorithm for Multiple Heterogeneous VHR Satellite Images
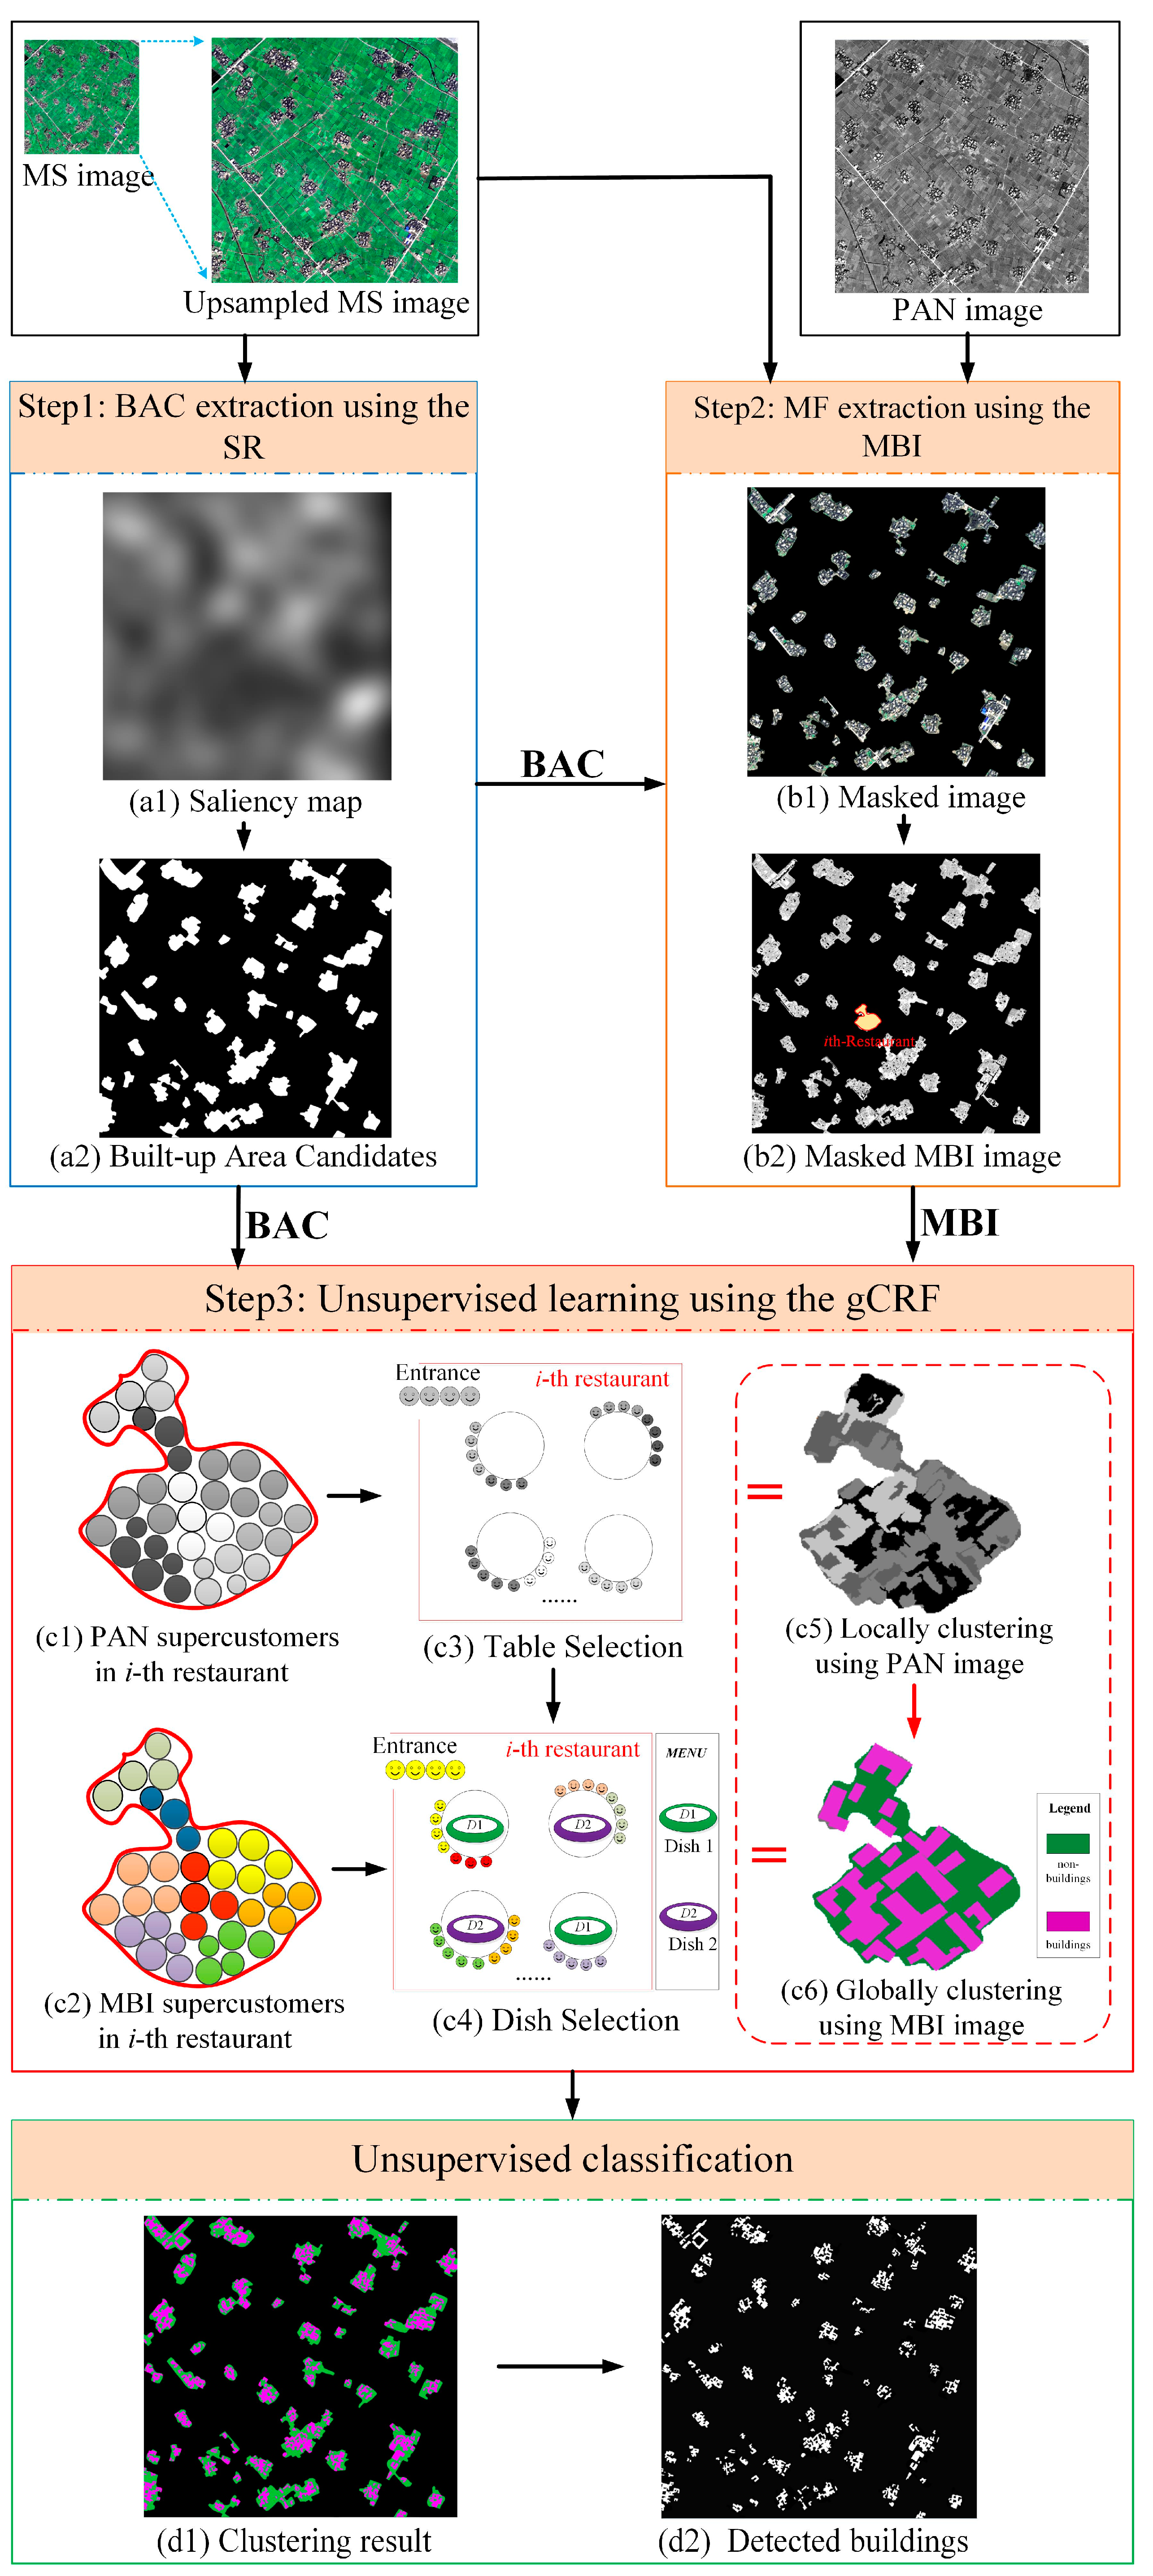
In a stage of emergency rescue for earthquake disasters, multiple pre-earthquake satellite images might be distributed in a progressive way. The proposed method could also be utilized in these types of situations. For the sake of the simplification of description, we take two satellite images as an example to describe the algorithm for two types of situation: (1) the two images are simultaneously used to learn and detect buildings from them unsupervised; and (2) the statistical models of both building and non-building (i.e., the two global clusters based on morphological features) have been learned from one image, which are used to infer the global cluster label for each local cluster learning from the other image.
For the sake of illustration, we assume that the two images come from two different sensors, namely QuickBird and Pléiades. As for the first situation, the process of building detection from the two images is shown in Figure 5a. The local clustering over the two images is totally separated. In other words, a set of statistical models of local clusters are learned for each image in the local clustering. However, during the global clustering, the same set of statistical models of global clusters would be learned from all local clusters from the two images. At the same time, each local cluster would be randomly allocated a global cluster label using Equation (9). Please note that both the multiple local clustering and the global clustering are integrated in a unified framework of probabilistic inference, which is called gCRF [25].
As shown in Figure 5b, in the second situation, we assume that one image is available after the other one. Therefore, we could learn statistical models of global clusters from the first available image, which is the QuickBird image. Given a new image (e.g., the Pléiades image) the clustering process consists of: (1) local clustering using the Pléiades PAN image; and (2) allocating the global cluster label for each inferred local cluster within each BAC using the learned statistics model of global clusters.
3. Experimental Results and Discussion
In this section, both the experimental data and evaluation methods are described in detail, before the relationships among the three components of the proposed method are analyzed using a set of experiments with different combinations of components. After this, the performance of the gCRF_MBI method is evaluated by a comparison with spectral-based and MBI-based methods in terms of both qualitative and quantitative perspectives.
3.1. Experimental Setting
3.1.1. Experimental Data
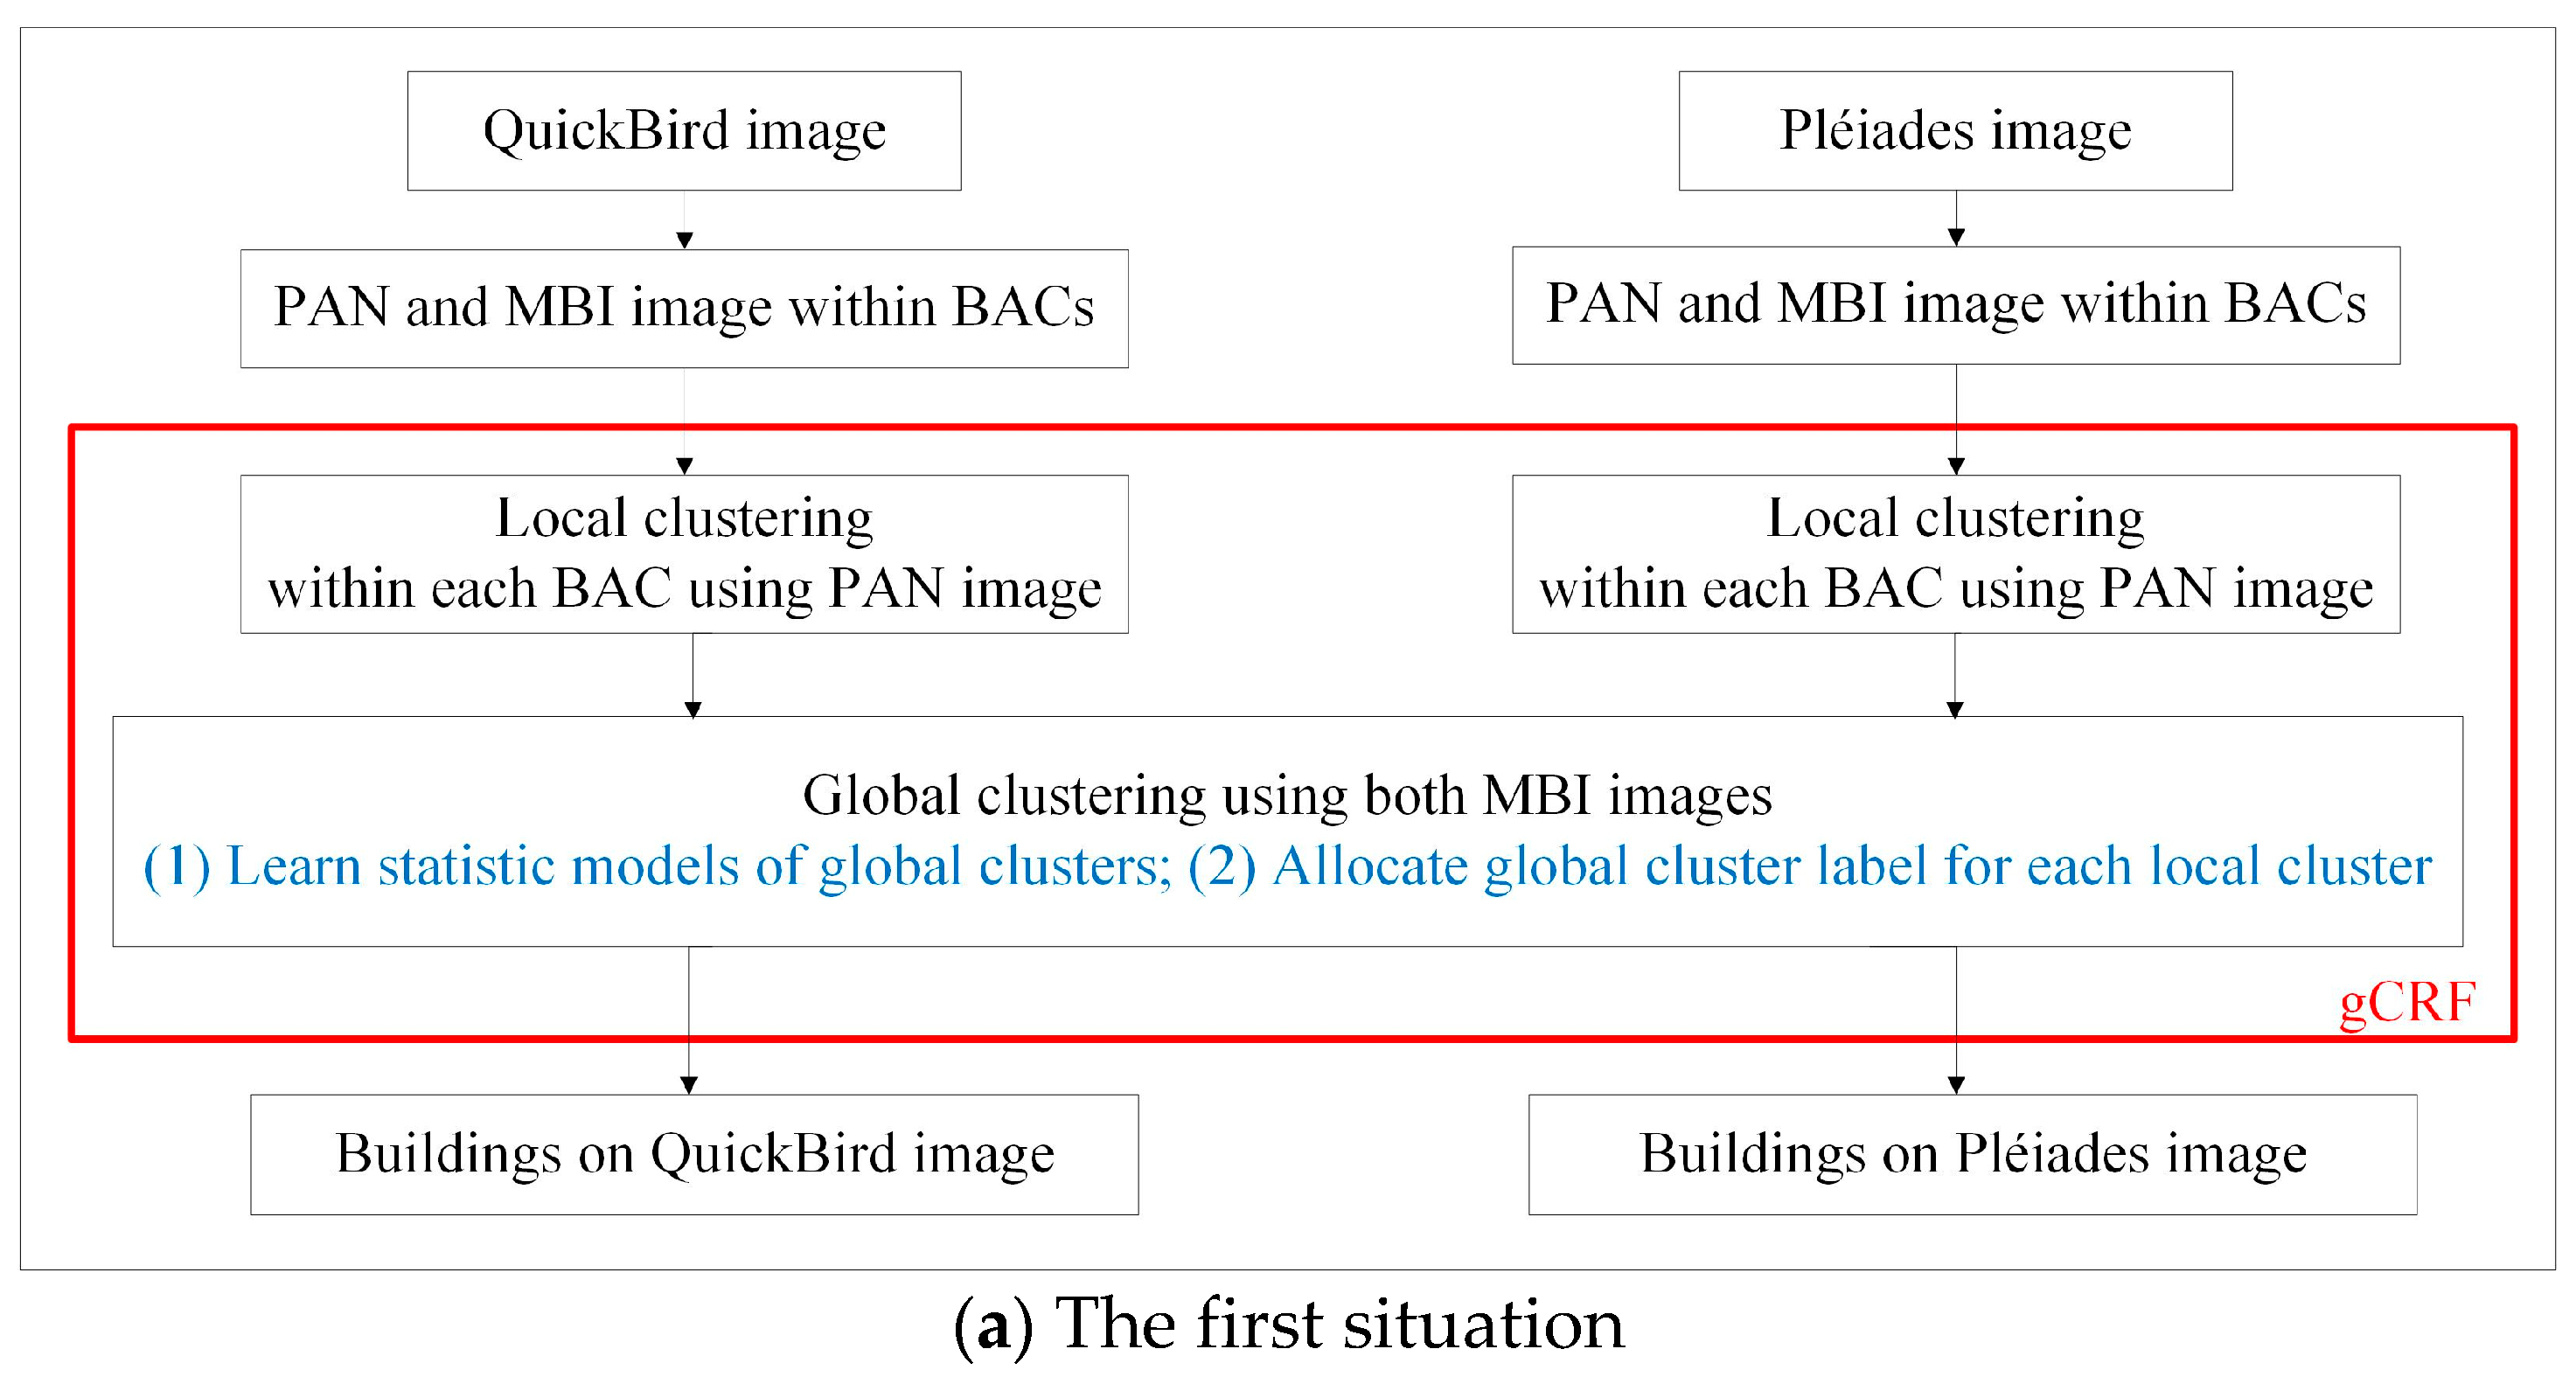
Two VHR satellite images that cover the areas frequently affected by earthquakes in Sichuan Province, China, were used in our experiments (Figure 6a). One image of an area in the town of Hanwang, Mianzhu City, was taken by the QuickBird satellite on 29 February 2008, with a size of 6500 × 6500 pixels (approximately 15 km2). Another image of Yuxi Village, Ya’an City was acquired on 22 January 2013 by the Pléiades satellite, with a size of 8000 × 8000 pixels (approximately 20 km2) (Figure 6b). The ground-truth maps for the two test images were manually delineated, with Figure 6c,d showing the same location with the magnified regions of the ground-truth maps. Table 2 lists the corresponding parameters of the two satellite sensors.
The two test images covering southwest China have heterogeneous landscapes typical to this region. Thus, they include scattered built-up areas and dense vegetation mixed together. Additionally, Hanwang is a town on a plain, whereas the Yuxi is a village in a mountainous region with considerable topographic relief. The background of built-up areas in the former region is relatively simple, while that of the latter region is more complex in terms of spectra. The collection time (UTC, universal time coordinated) of the QuickBird image and Pléiades image is 04:10:15.
3.1.2. Evaluation Method
In our experiments, three well-known quality measures (recall, precision and F-value) were used to evaluate the performance of the proposed method as applied in a previous study [30], which were calculated as follows:
where TP represents the building pixels detected by the model and included in the ground-truth dataset, FP refers to the building pixels detected by the model but not included in the ground-truth dataset and FN represents the building pixels not detected by the model but included in the ground-truth dataset. The F-value is the harmonic mean of the recall and precision values.
3.2. Interaction between Components in Proposed Method
The gCRF_MBI method consists of three indispensable components: SR, MBI, and gCRF. Each component can affect the final building result. In this subsection, we first analyze the relationship between the SR and gCRF and then the relationship between the MBI and SR. Finally, we describe the relationship between the MBI and gCRF.
3.2.1. SR and gCRF
The relationship between the SR and gCRF was analyzed by comparing the gCRF model and the “SR+gCRF” model. In the gCRF model, the restaurant is defined as a square partition grid, and the size of the square grid is provided in advance. In comparison, the definition of the restaurants in the “SR+gCRF” model is replaced by the built-up areas and each BAC extracted by the SR is regarded as a restaurant in the model.
We compared the building results of the two models to evaluate how the SR affects the results. For the sake of fairness, the PAN image and MS image were both used as inputs for the two models. The only difference between the two models was the definition of a restaurant. In the gCRF model, determining the optimal size of the squared partition grid is difficult, and its size affects the clustering results. The size of the restaurant in this experiment was 20 × 20 pixels. As shown in Figure 7a, certain roads, bare soils and vegetation were inaccurately detected as buildings because of the similar spectral information. Quantitative evaluations of the building results of the two models are provided in Table 3. Due the restrictions of the built-up areas, the building results in the “SR+gCRF” model were much better than those of the gCRF model. Additionally, classifying the built-up areas as restaurants presented several advantages, such as eliminating the need to select the size of the square grid and providing semantic information for the built-up area.
3.2.2. MBI and gCRF
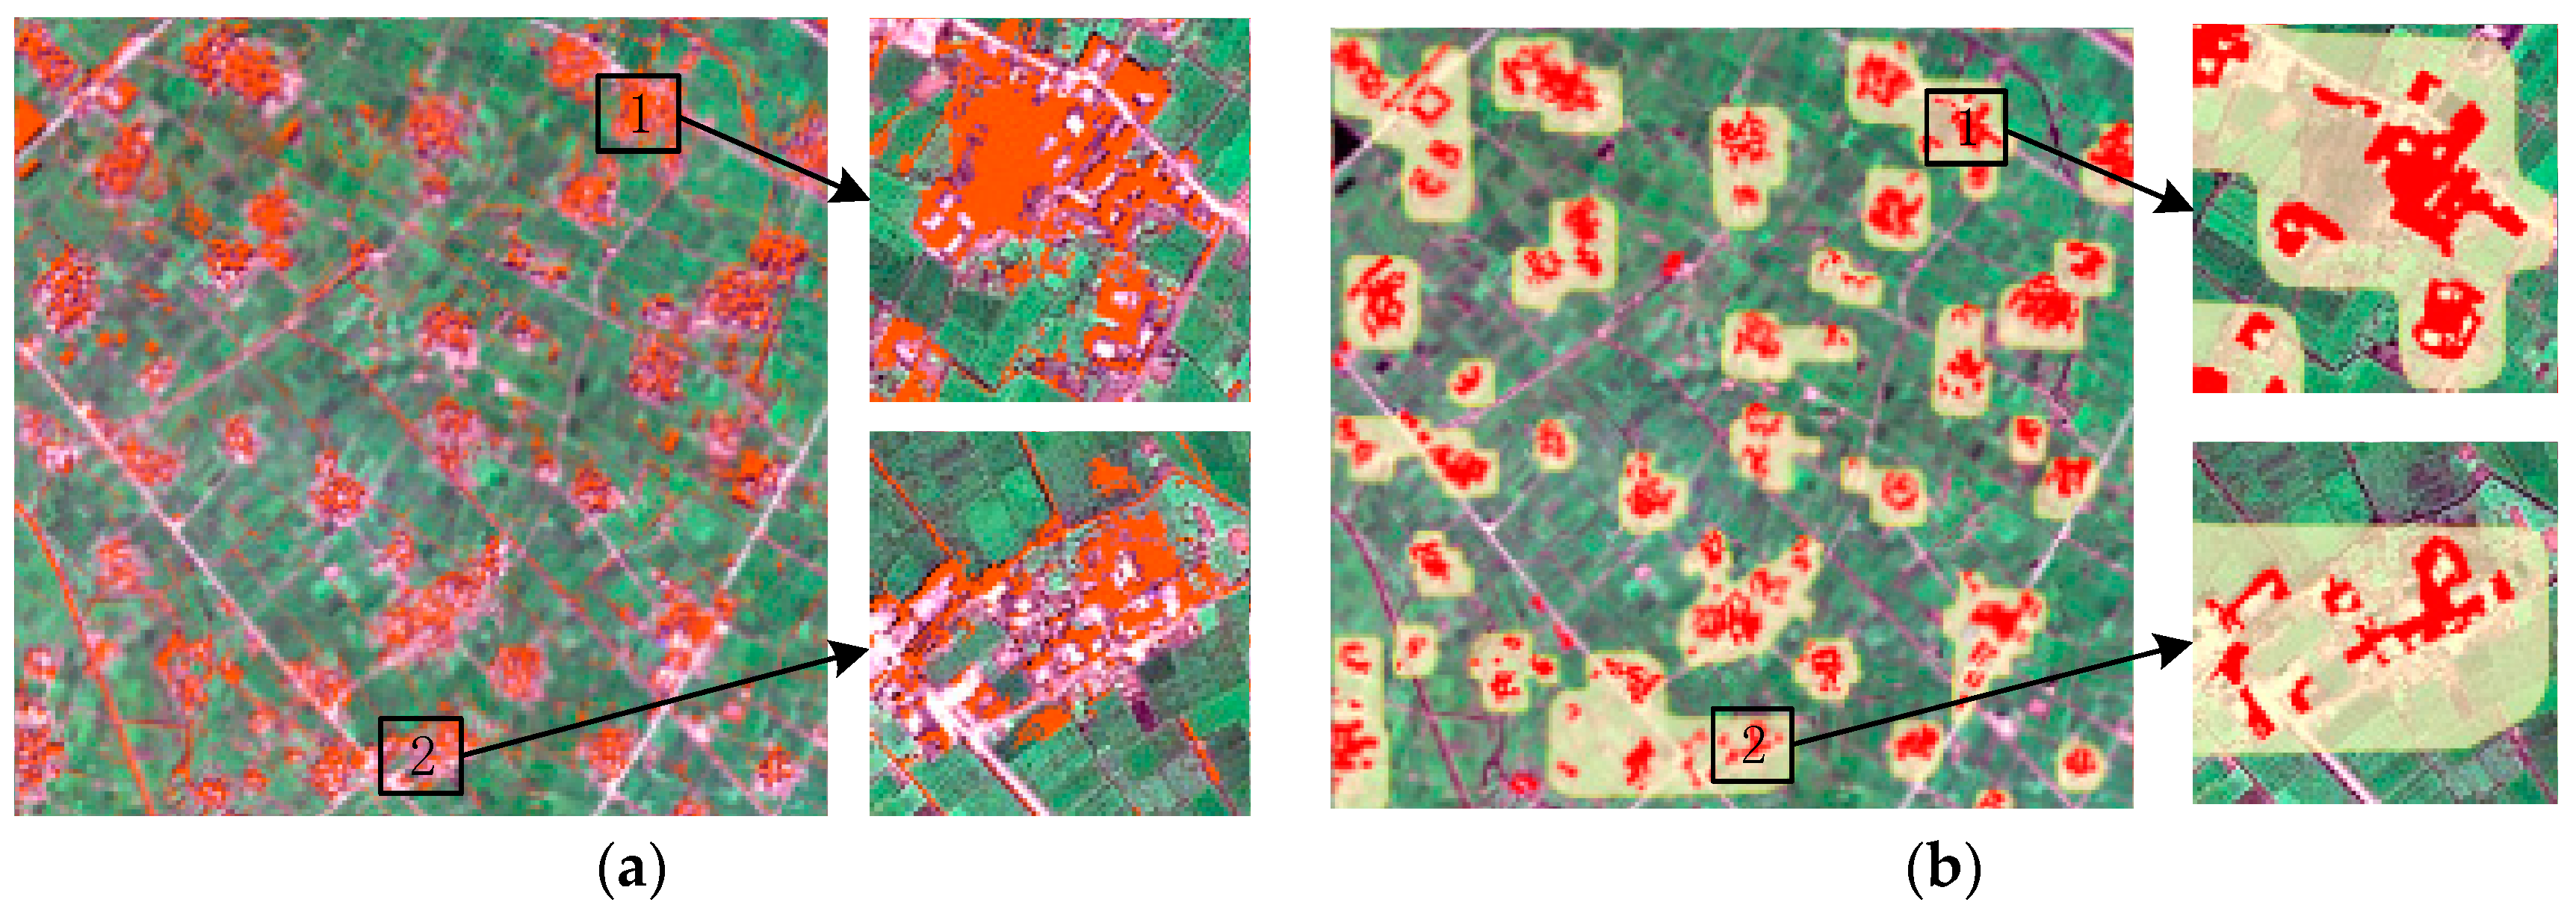
We analyzed the relationship between the MBI and gCRF by comparing the building results of the “SR+gCRF” model and the proposed method. The inputs were different for these two models. In the “SR+gCRF” model, we fused the PAN and MS images to extract the buildings. In comparison, in the proposed method, the MBI image replaced the MS image and the PAN image was fused by the gCRF model to extract the buildings. The building results of the “SR+gCRF” model and the proposed method are provided in Figure 8. In terms of visual inspection, the results of the “SR+gCRF” model were worse than those of the proposed method overall with respect to the details. Darker roads were incorrectly labeled as roofs because their spectra were too similar for discrimination, which reveals that the MBI feature was better than the MS feature in building extraction. It is important to note that the roofs were dark and roads were highlighted in our experiments, which is inconsistent with normal conditions.
A quantitative evaluation of the building results of the two models is provided in Table 3. In terms of the recall, precision and F-value results, the proposed method was nearly 10% better than the “SR+gCRF” model. In addition, the proposed method had greater consistency with the ground-truth data compared to the “SR+gCRF” model.
3.2.3. MBI and SR
The relationship between the MBI and SR was analyzed by comparing the “MBI+SR+gCRF” model and the proposed method. The inputs were the same for the two models (i.e., masked PAN image and masked MBI image), although the methods for obtaining the MBI were different. In the “MBI+SR+gCRF” model, the MBI feature was first extracted from the stacked image (i.e., the MBI feature of the whole image was obtained), before the masked MBI image was generated by the BAC mask operation. Finally, the masked MBI image and PAN image were fused into the gCRF model for building extraction. However, in the proposed method, the masked stacked image was first obtained from the stacked image by the BAC mask operation, before the masked MBI feature was extracted using the MBI. Finally, the masked MBI image and PAN image were used as inputs for the gCRF model. The MBI features and the corresponding building results of the two methods are shown in Figure 9 and Figure 10, respectively.
As illustrated in Figure 10, the MBI feature of the “MBI+SR+gCRF” model was much worse than that of the proposed method due to the effect of a large amount of vegetation. This was greatly improved in the proposed method because the influence of BACs was eliminated. We also quantitatively compared the buildings extracted by the two methods. As shown in Table 3, the recall, precision and F-values of the “MBI+SR+gCRF” model were much lower than those of the proposed method. Thus, the MBI feature in the “MBI+SR+gCRF” model was inadequate for extracting buildings. The comparative experiment revealed that extracting buildings using MBI directly (i.e., in the “MBI+SR+gCRF” model) was not ideal and could be greatly improved by restraining the BACs extracted by the SR, such as in the proposed method.
3.3. Performance Evaluation
This section describes three group experiments that were conducted to evaluate the performance of the proposed method. The first group of experiments was used to compare the buildings extracted from two satellite images with those from a single image; the second group was used to compare the performance of the proposed method and spectral-based methods; and the third group was used to evaluate the performance of the proposed method and MBI-based methods. It is important to note that the spectral-based methods and MBI-based methods in the second and third groups included Kmeans-based unsupervised methods and SVM-based supervised algorithms. For the sake of clarity, the compared methods (except for gCRF_MBI) are named according to the form “CLASSIFIER_FEATURE_TYPE”, where “CLASSIFIER” refers to the name of the classifier used in the method, such as Kmeans or SVM; “FEATURE” denotes the input feature image of the classifier, which could be an MS image or MBI image; and “TYPE” refers to the type of the image unit. For example, “Pix” and “Seg” denote pixel-based and object-based classifications, respectively. “MV” means that the label of an over-segment was derived from a majority vote of the pixel-based classification label within the over-segment. It is important to note that each over-segment is represented as the mean value of the image within the over-segment. Moreover, the over-segments used in these methods were obtained using eCognition. In the supervised methods, the training samples of buildings and non-buildings are 10% of the total pixels of the ground truth for SVM-based methods [31].
3.3.1. Number of Images
In the gCRF_MBI method, the MBI structural features of buildings, which replaces the spectral feature in MS images, were fused with spatial details in the PAN images to extract buildings. Compared with the spectral features of the buildings in the MS images, the MBI features of buildings cannot change with a change in sensor. Therefore, the proposed method has the capability to simultaneously extract buildings from multiple heterogeneous VHR satellite images.
In this subsection, we compare the building results extracted from a single image with those from two heterogeneous satellite images, which are called “generalized images”. The “generalized-image” experiments are the VHR satellite images acquired in succession, as described in the second situation in Section 2.4. In the “generalized-image” experiments, we used the QuickBird image and the Pléiades image, with the parameters of the proposed method learned by one image being generalized to another.
Two experiments were designed for the QuickBird image. In the first experiment, only the QuickBird image was used to extract buildings as the input for the gCRF_MBI model. However, in the second experiment, two images from different sensors (the “generalized-images”) were used as inputs for the model. The parameters of global clustering in the model learned from the Pléiades image were directly applied to the QuickBird image for building extraction. Similarly, only the Pléiades image was used input for the model for building extraction in the first experiment. In the second experiment, the “generalized images” were used as model inputs, while the parameters of global clustering in the model learned from the QuickBird image were directly used for building extraction in the Pléiades image.
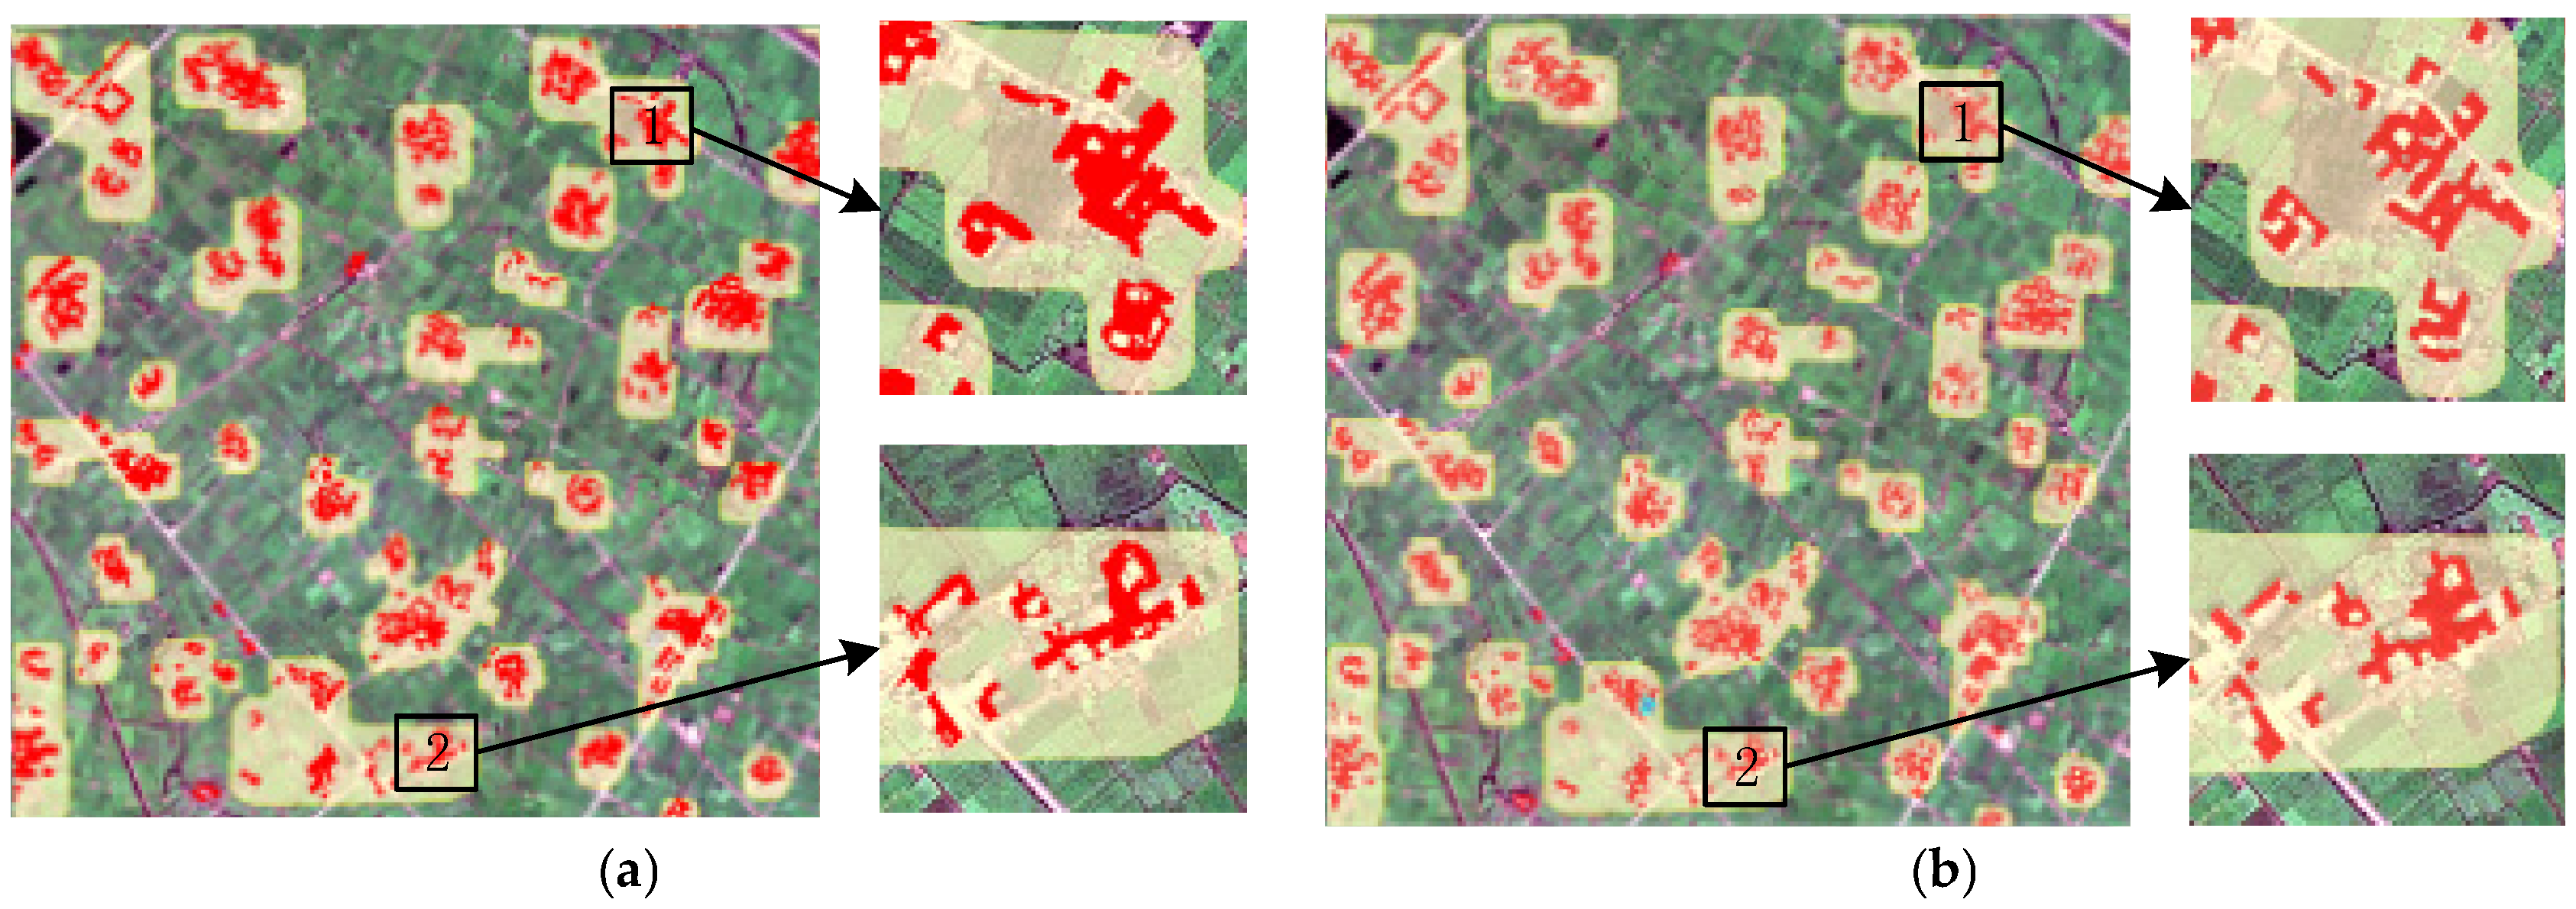
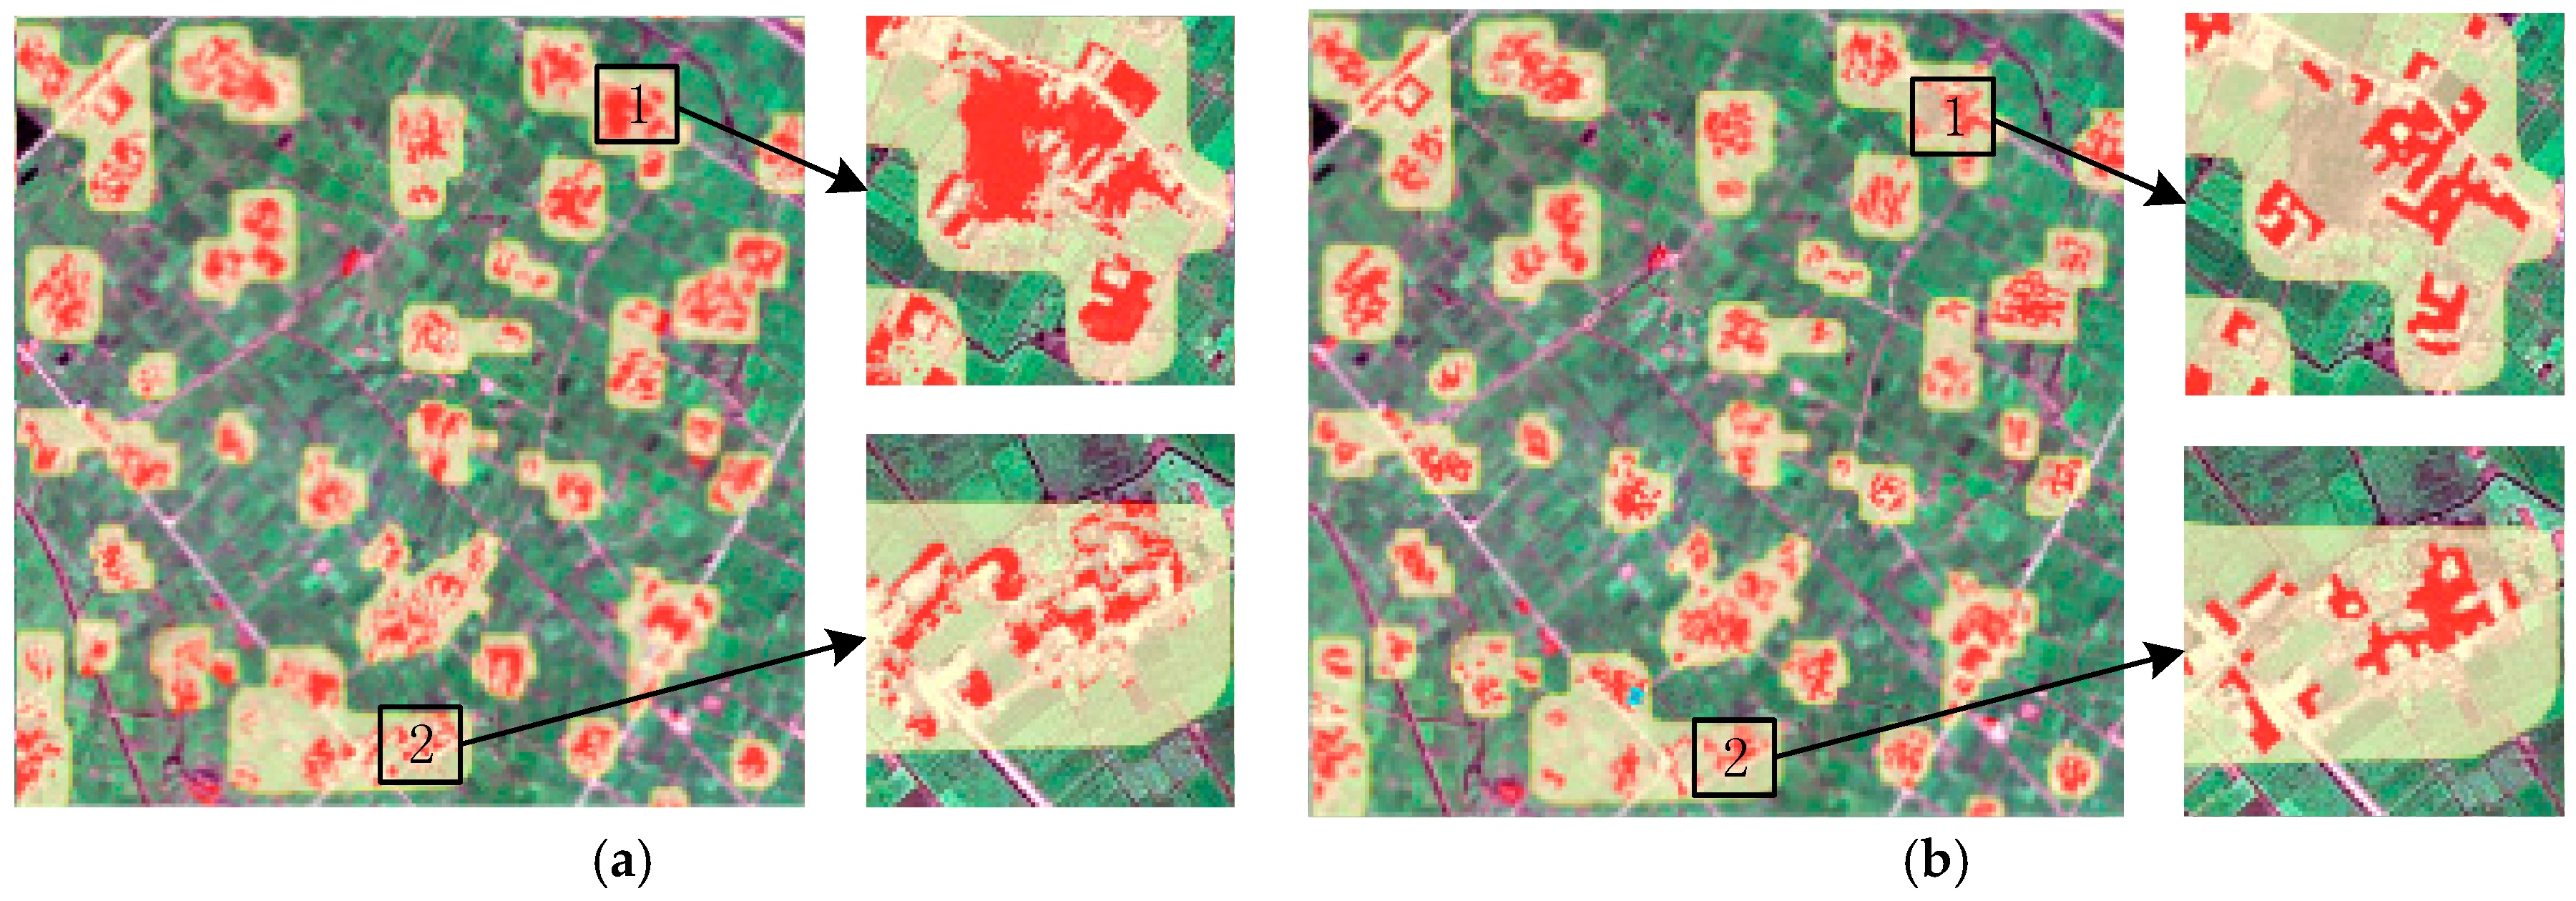
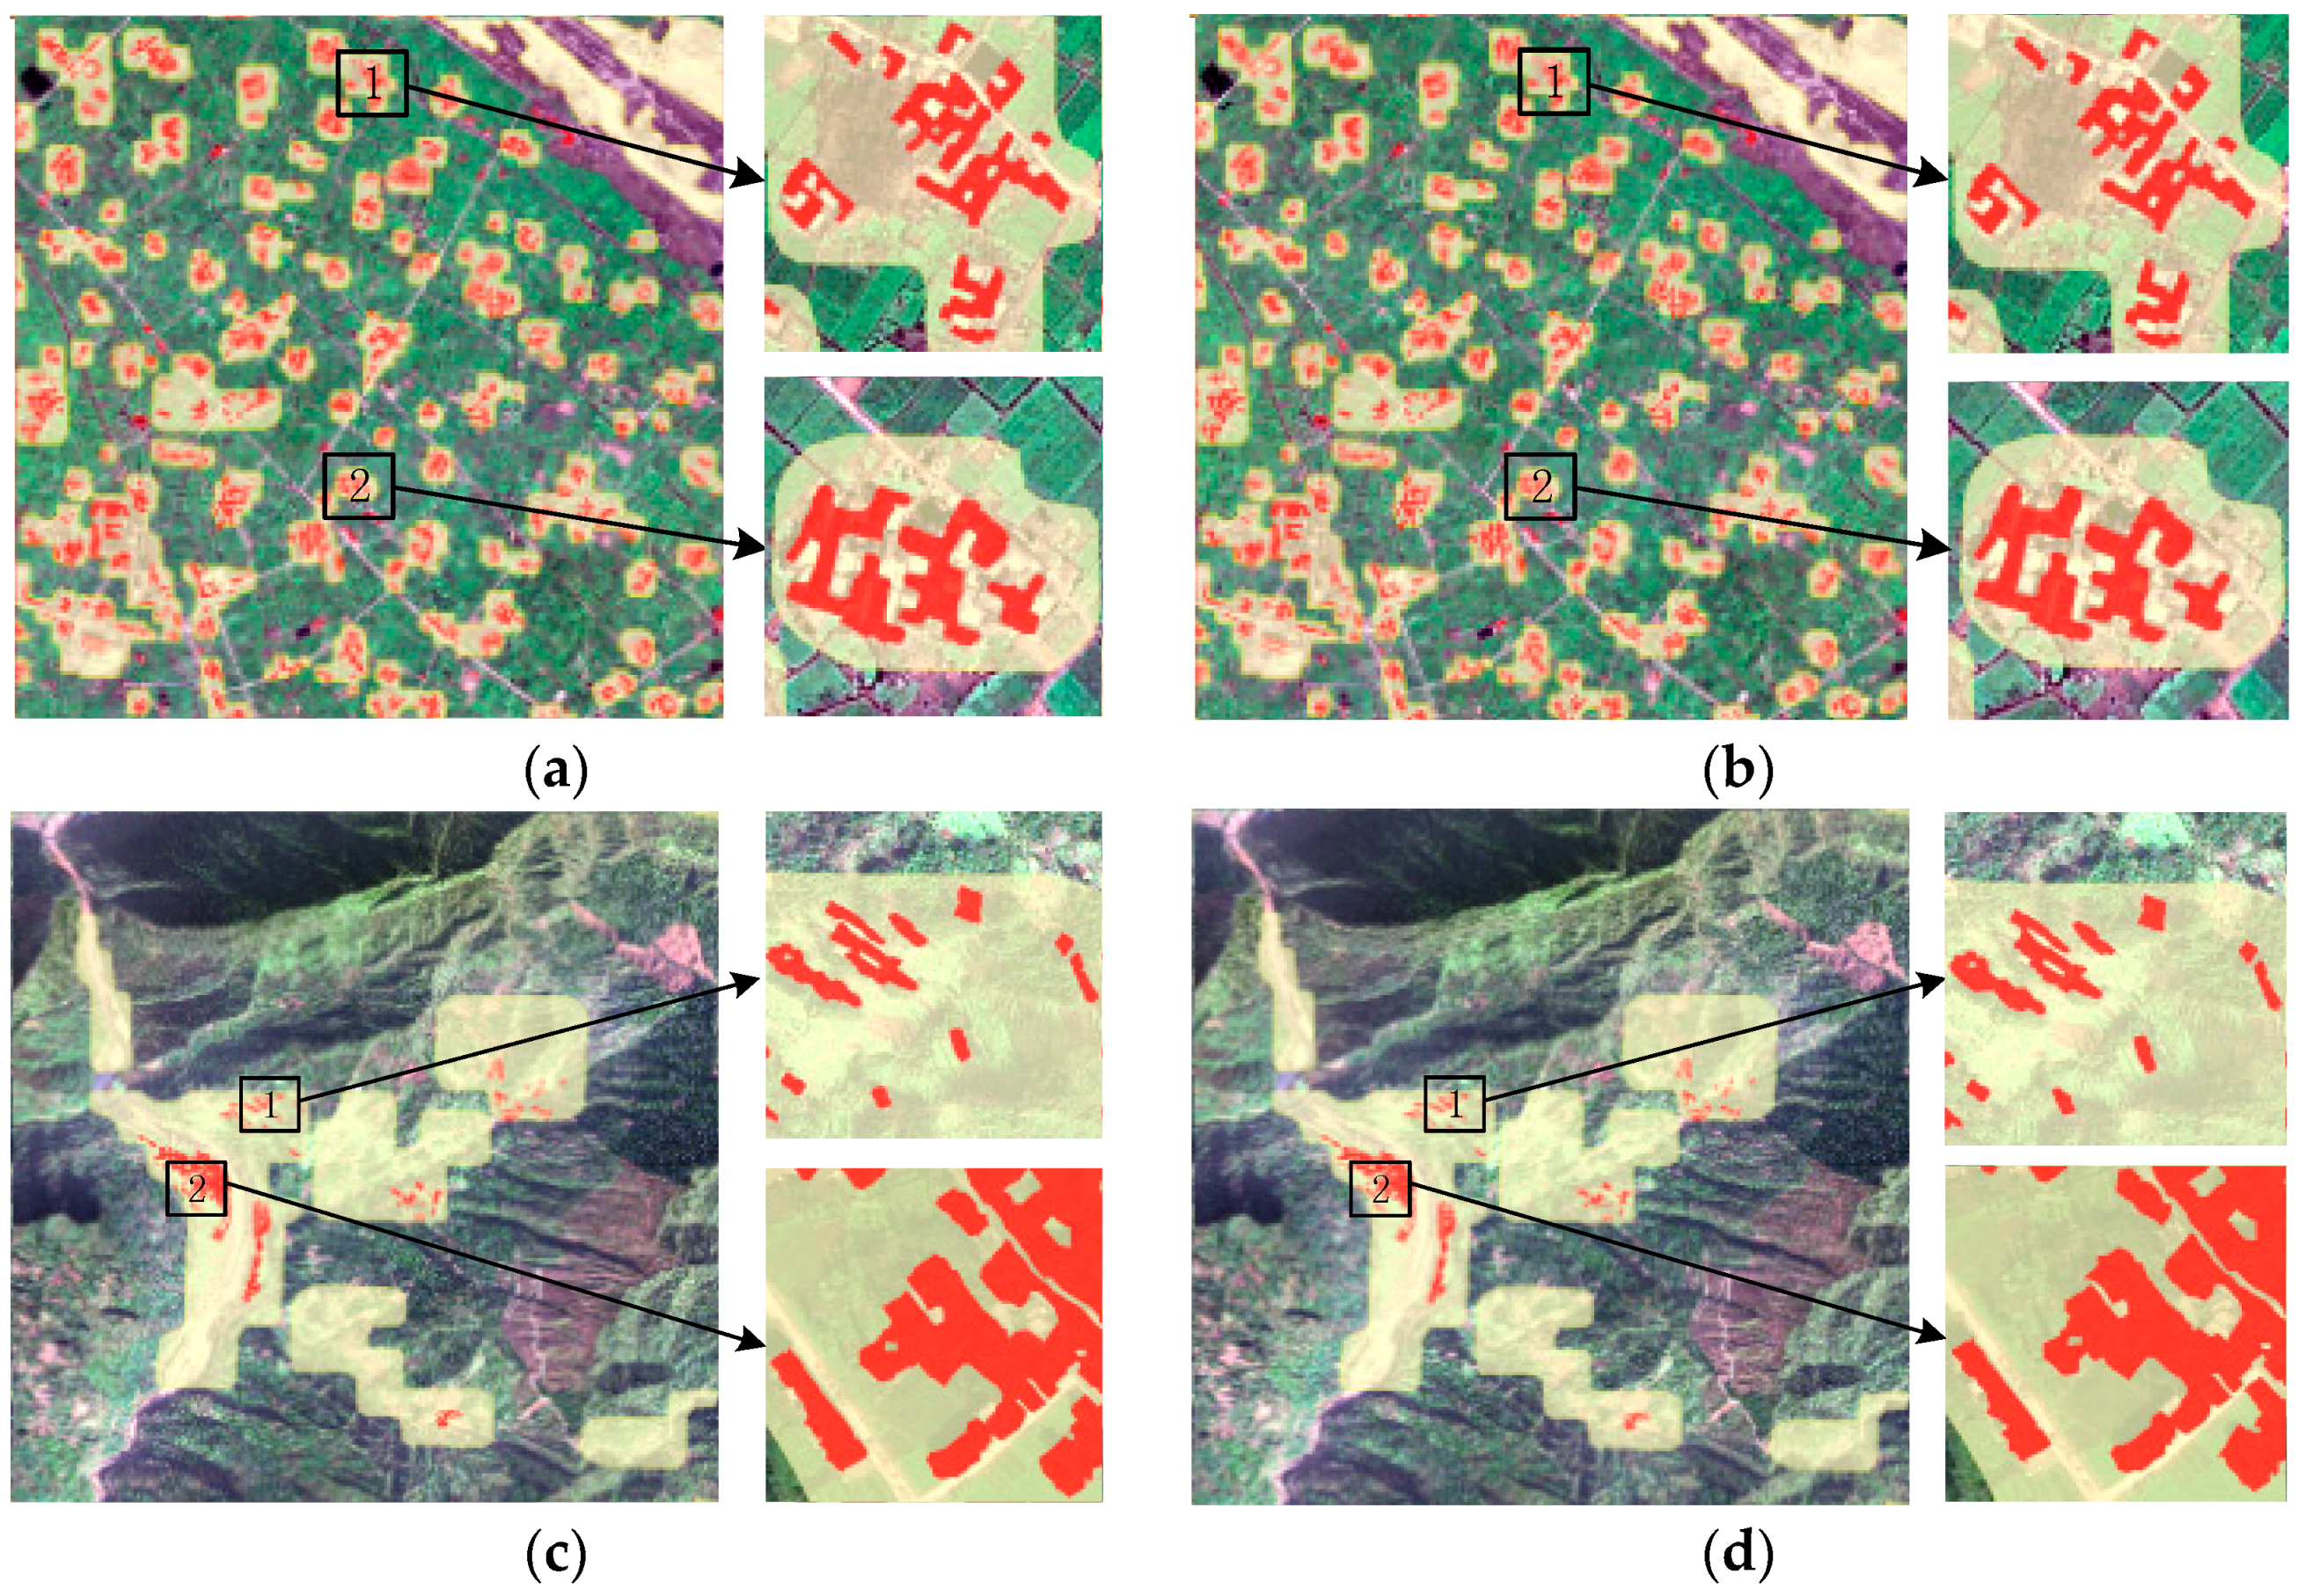
With respect to visual interpretation, the results of two experiments for the QuickBird image were similar and the same as those used for the Pléiades image (Figure 11). Table 4 presents the quantitative evaluation of the building results. The results show that for both the QuickBird image and the Pléiades image, the building results extracted from a single image were 0.2% higher than that from “generalized images” in terms of recall and precision. The difference in accuracy was small. Therefore, we conclude that the proposed method has the capability to simultaneously extract buildings from multiple heterogeneous and non-calibrated VHR satellite images.
3.3.2. gCRF_MBI Compared to Spectral-Based Methods
In this subsection, we compare the proposed gCRF_MBI method to spectral-based methods. It is important to note that the input for all experiments in this subsection are the two test images, which are the QuickBird image and the Pléiades image. The gCRF_MBI experiment involves the two images being acquired simultaneously, as described in the first situation in Section 2.4. The experimental results reveal that the accuracy of the building results extracted from the two images simultaneously is the same as that from a single image. The compared spectral-based methods are the Kmeans-based unsupervised methods and SVM-based supervised methods. The Kmeans-based methods included Kmeans_MS_Pix, Kmeans_MS_MV and Kmeans_MS_Seg. The SVM-based methods included SVM_MS_Pix, SVM_MS_MV and SVM_MS_Seg. In the supervised SVM-based algorithms, training samples were selected from two experimental images rather than from either of the two alone.
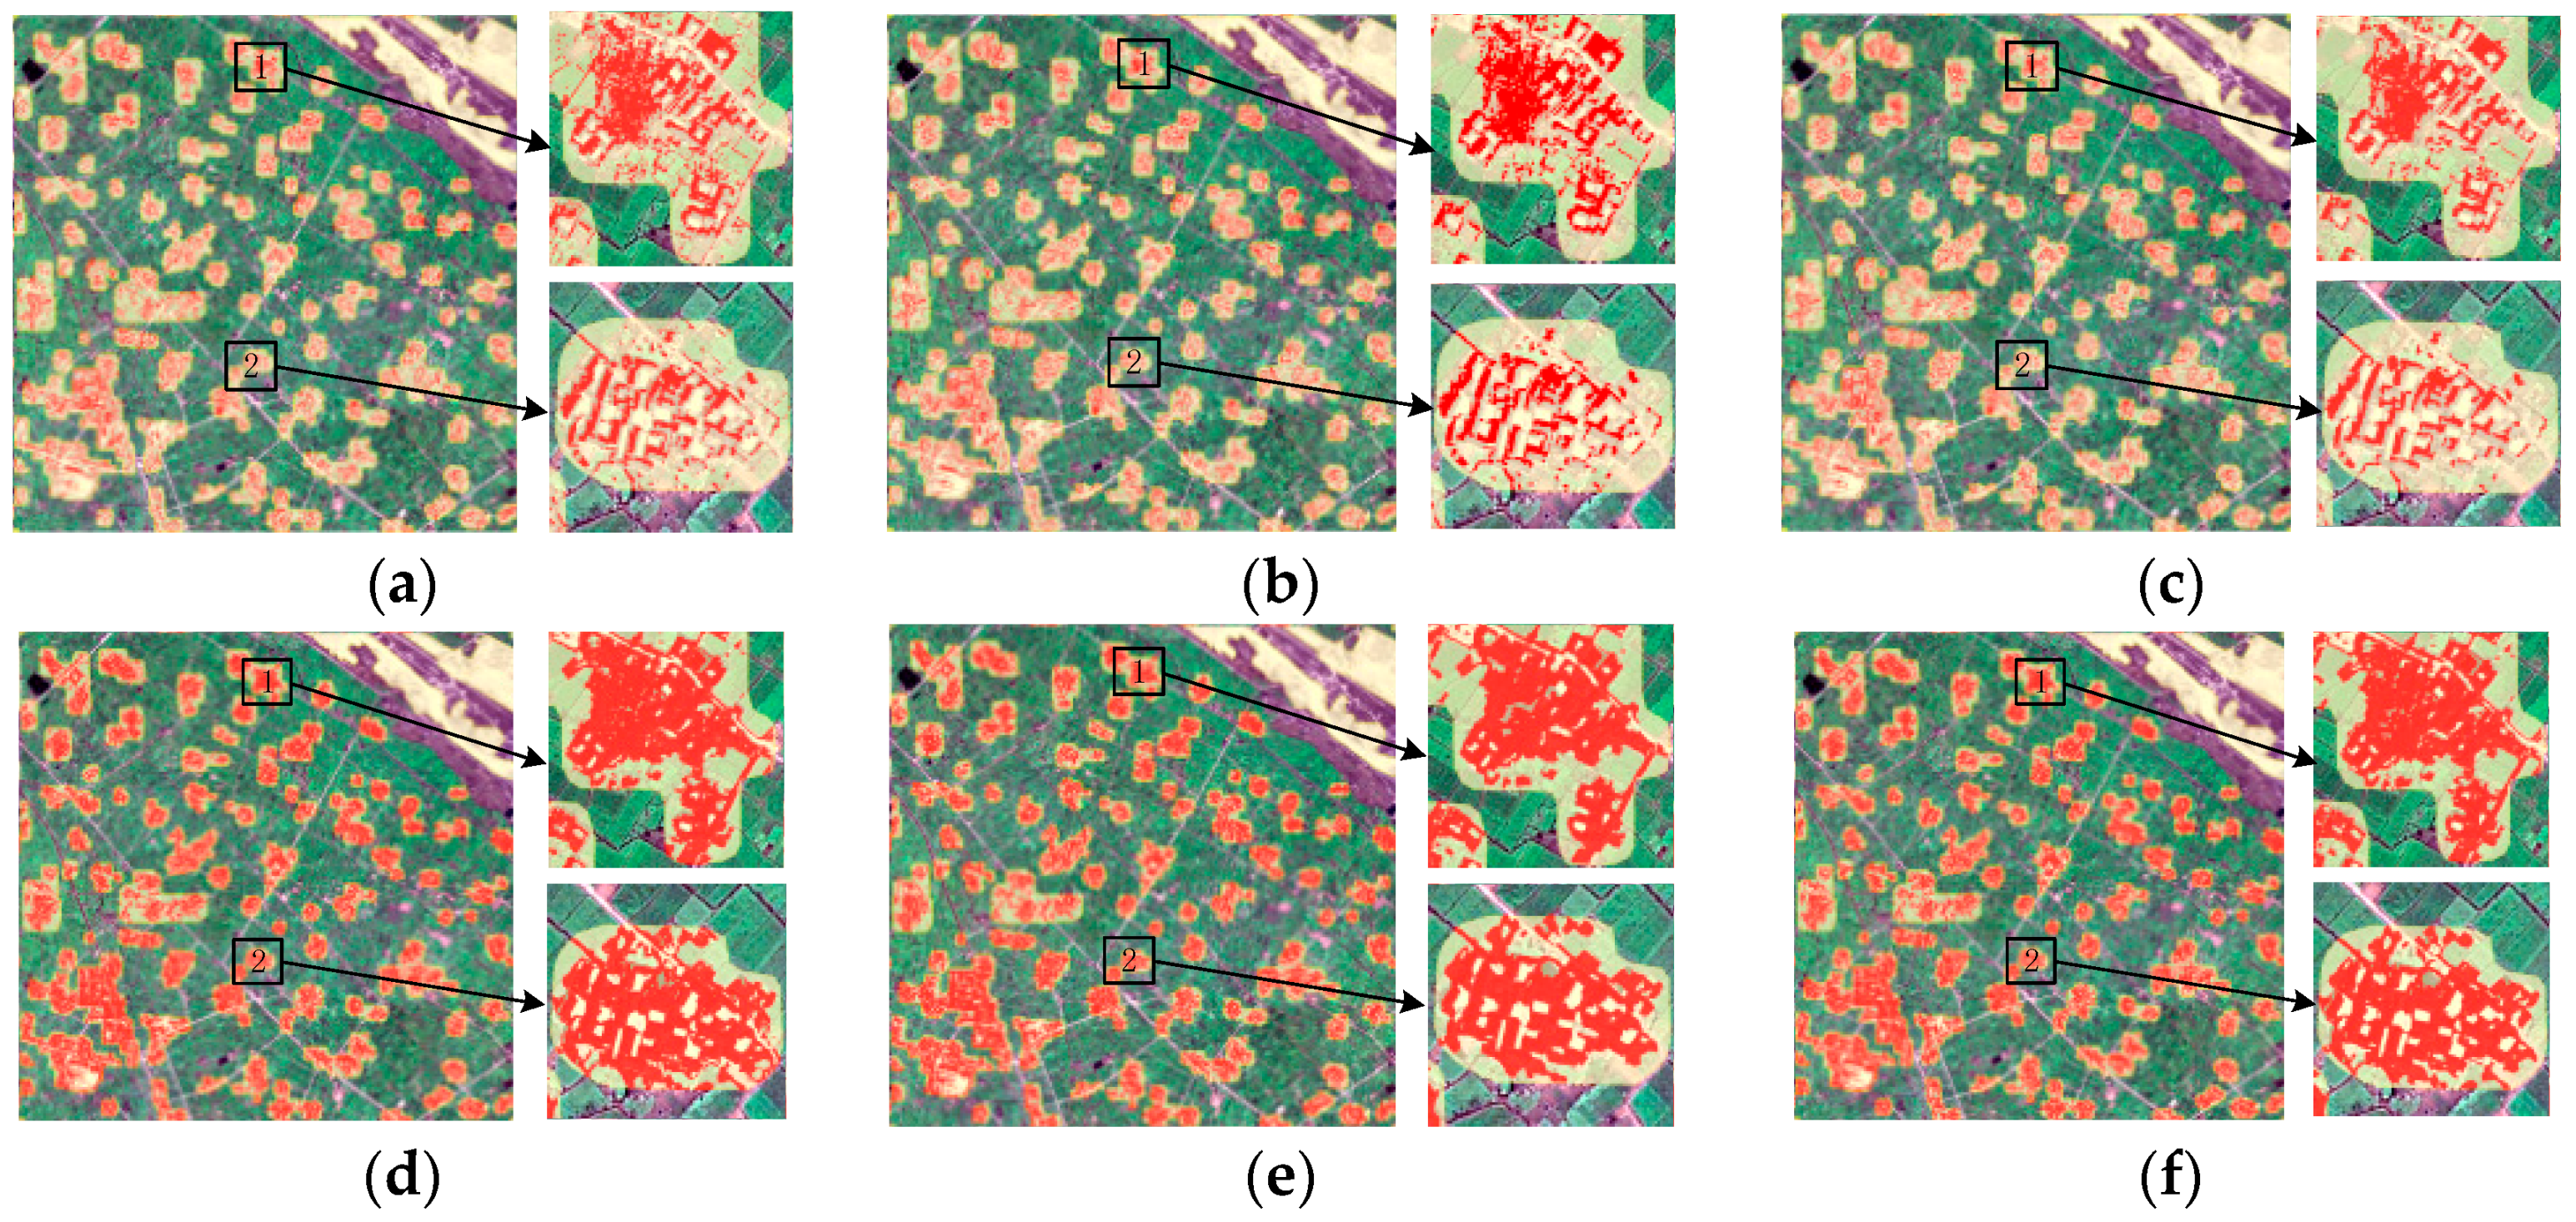
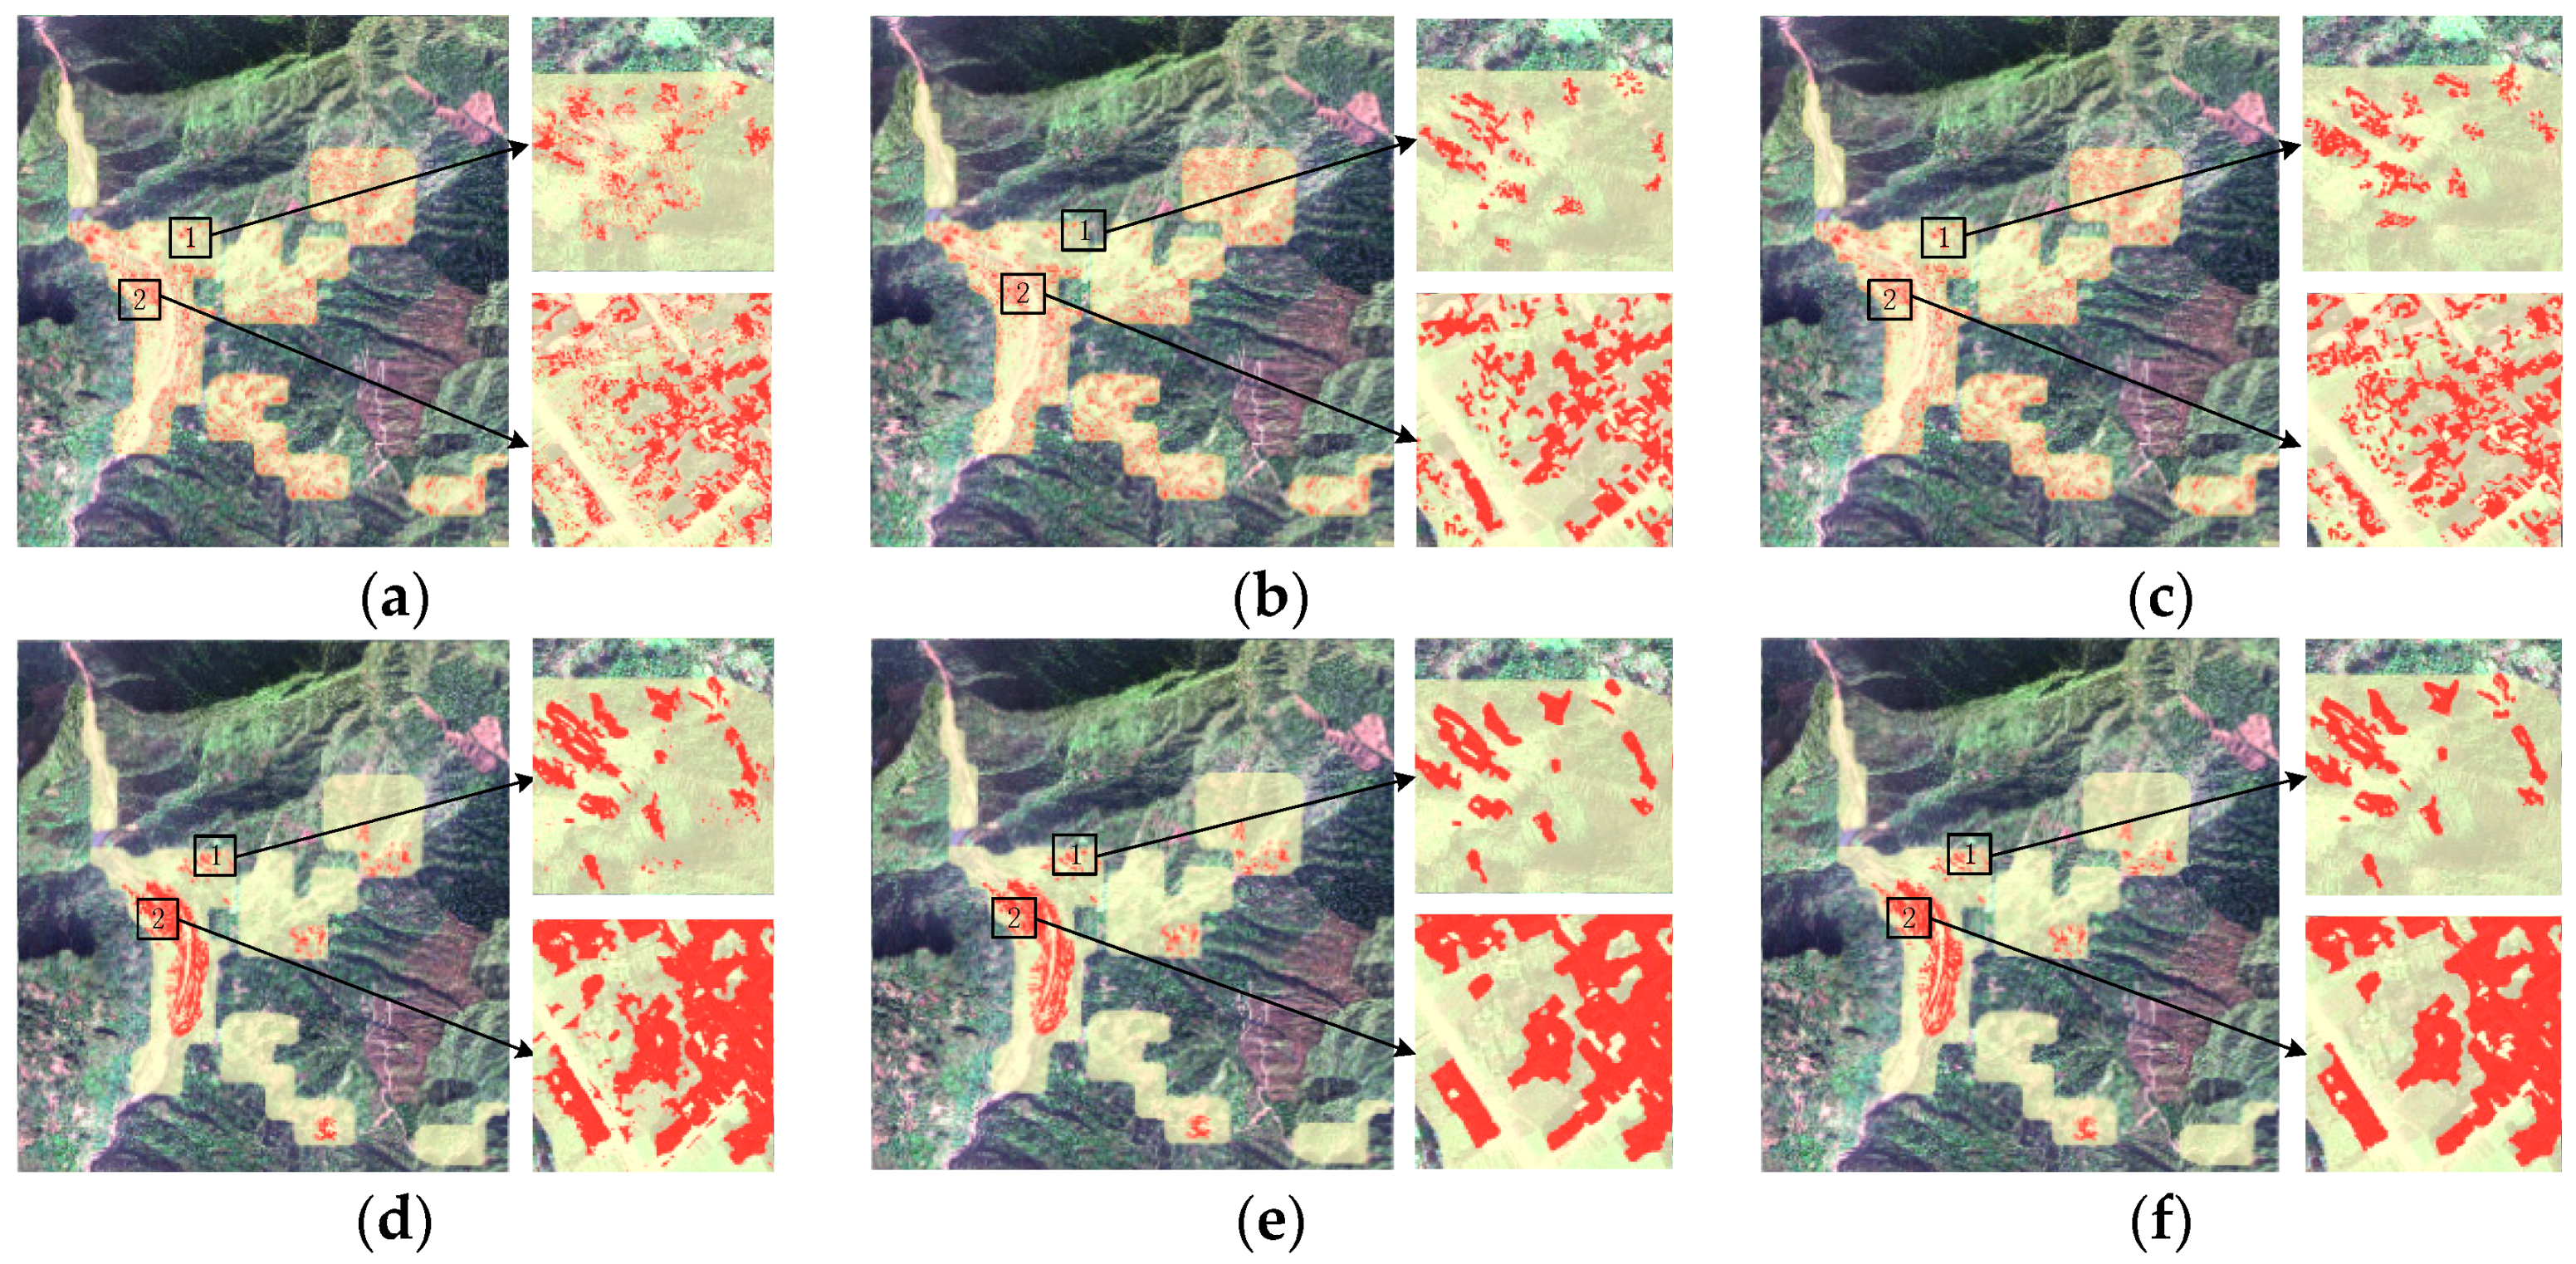
The building results for the different spectral-based methods from the two images are shown in Figure 12 and Figure 13. Overall, the building results extracted by the SVM-based supervised methods were better than those of the Kmeans-based unsupervised methods. Both the Kmeans-based unsupervised and SVM-based supervised methods used the spectral feature in the MS image to extract buildings. In the Pléiades image, some water in the rivers and certain building roofs were similar in their spectra. Thus, many mistakes were introduced in the building results extracted by both the unsupervised and supervised methods, as shown in Figure 13.
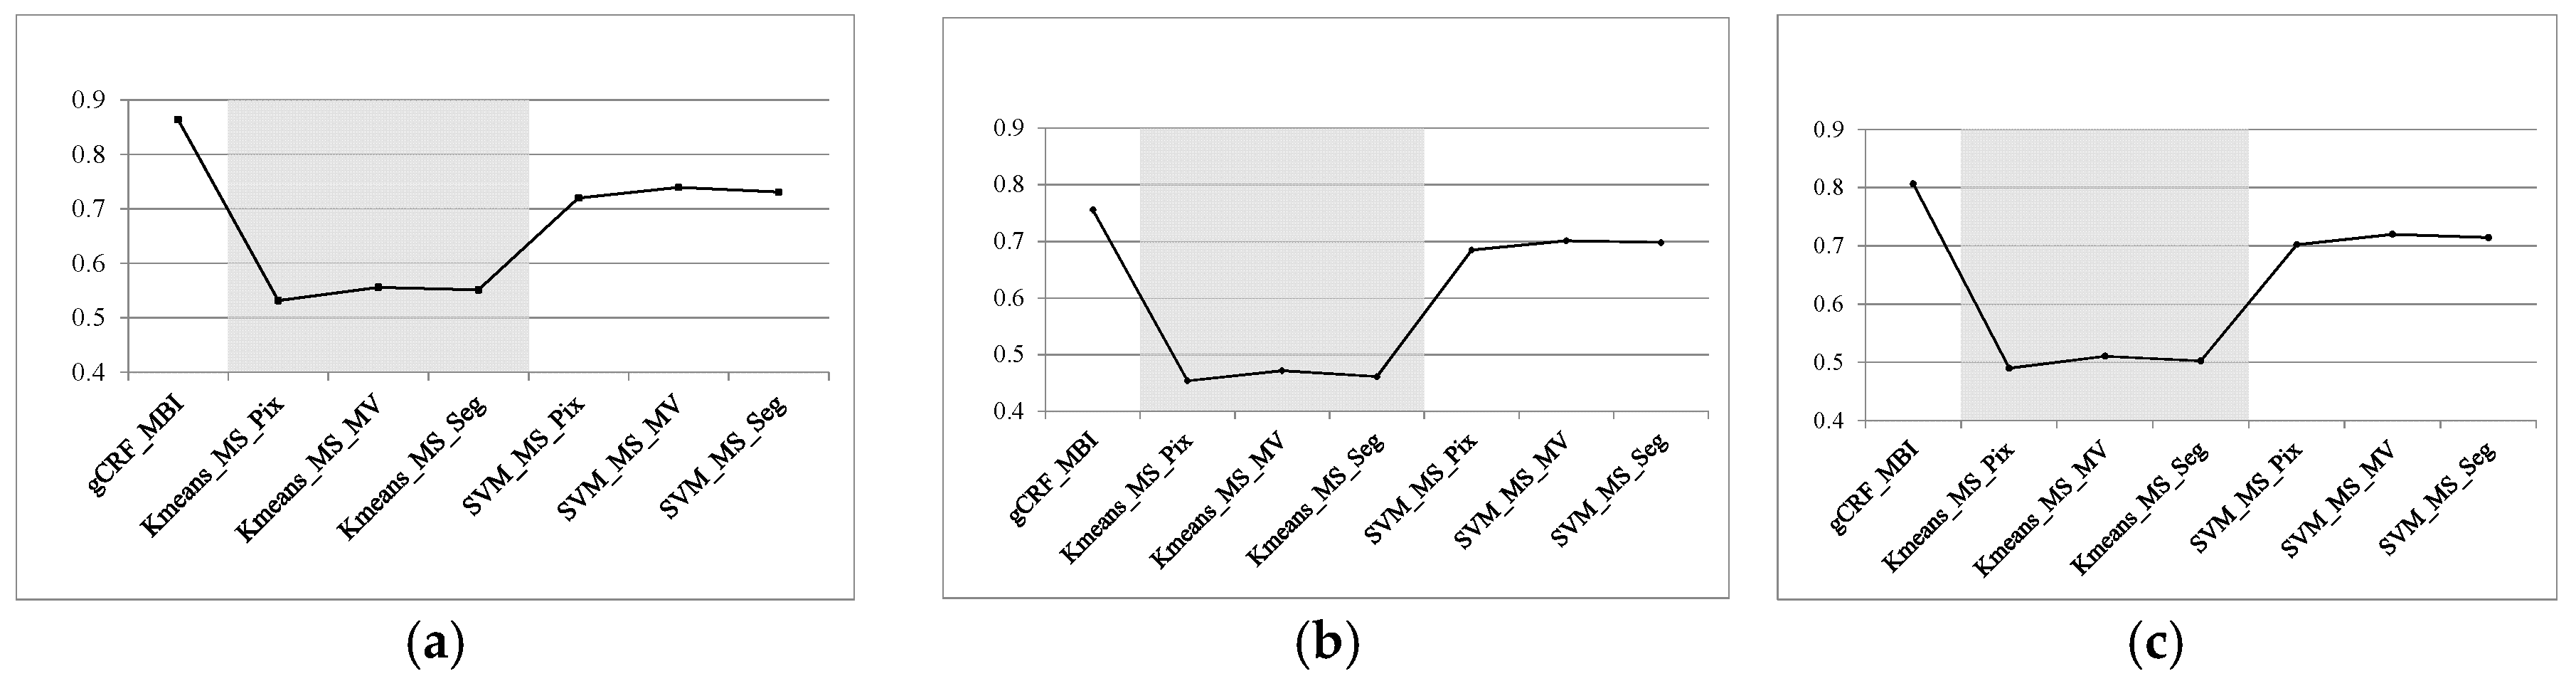
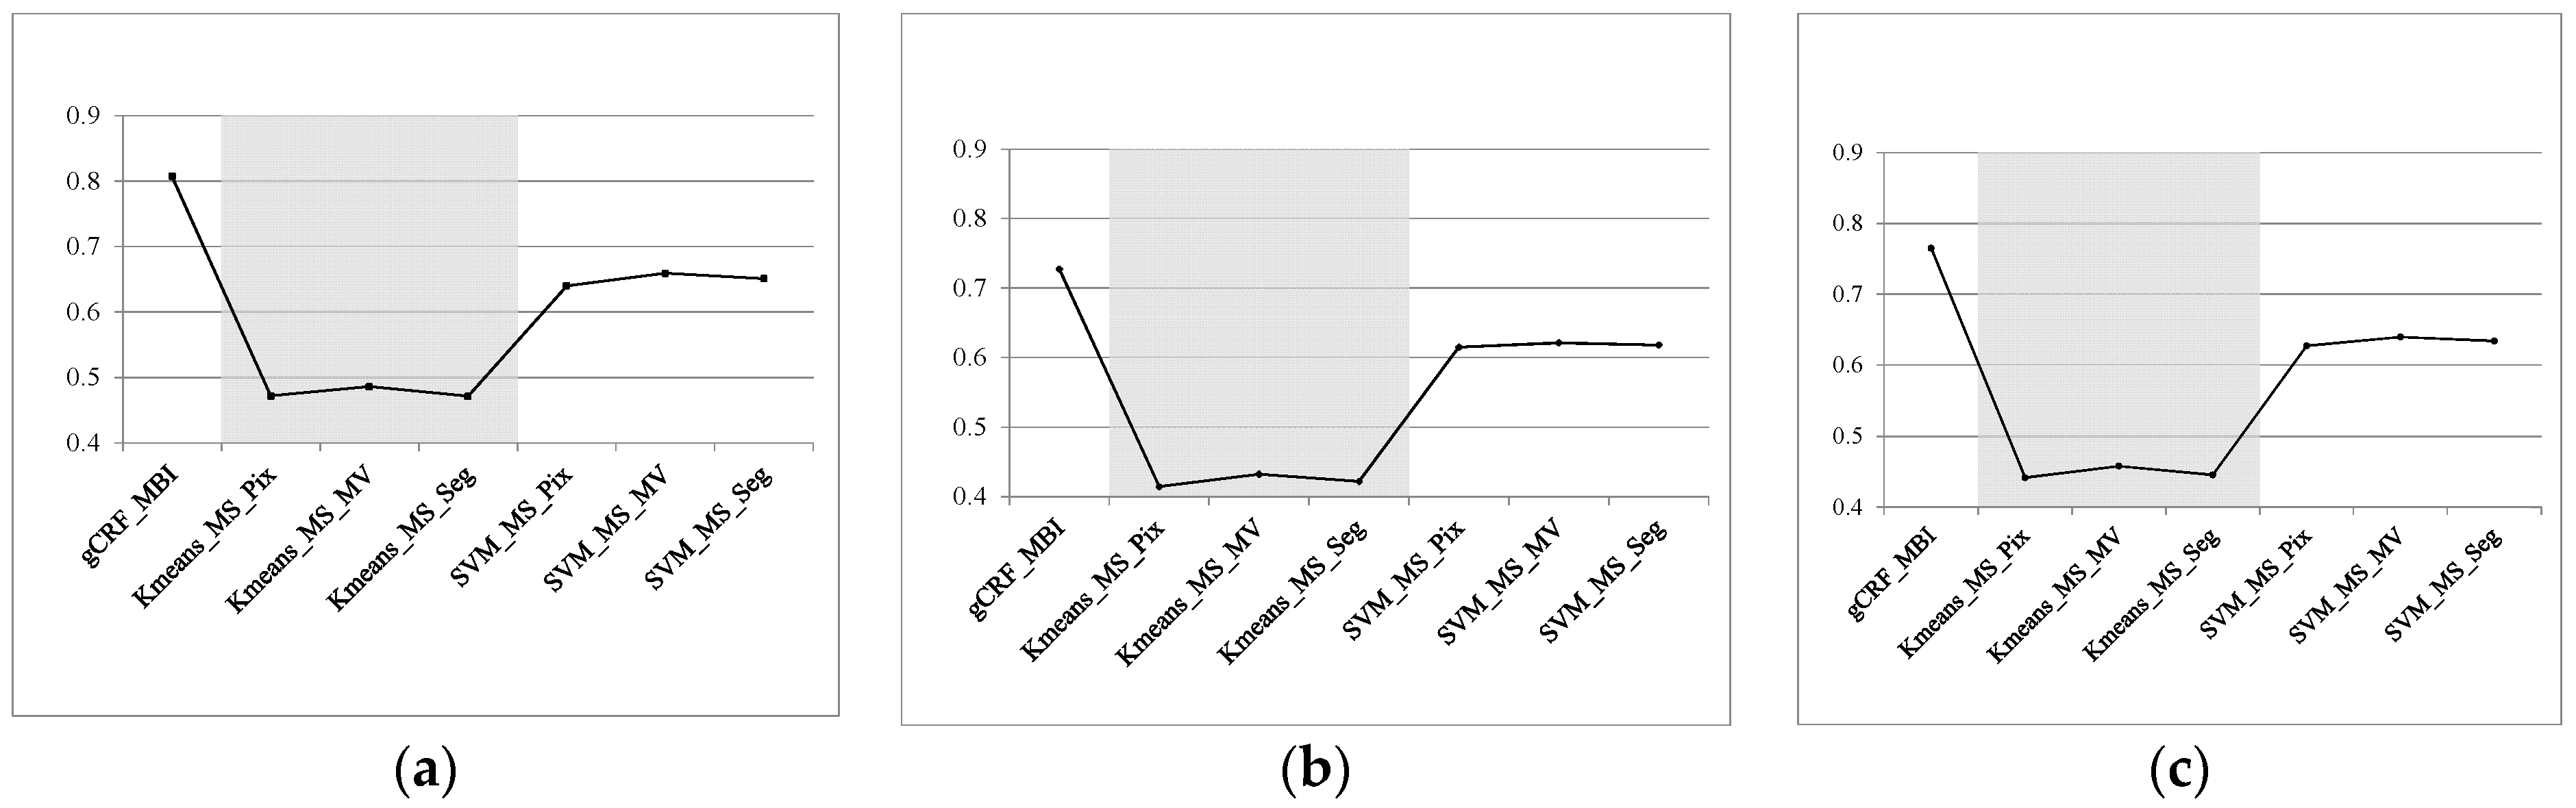
Figure 14 and Figure 15 show the quantitative evaluation of the building results. The results of the quantitative evaluation also validated the above analysis. In the QuickBird image, the F-values of the Kmeans-based methods were approximately 50%, while the F-values of the SVM-based methods were nearly 70%. Additionally, the F-values of both the Kmeans-based and SVM-based methods for the Pléiades image were lower than those for the QuickBird image. The low accuracy of the Kmeans-based and SVM-based methods based on the spectral features from the two images was due to the variations in the sensors used to take the images and the spectral resolution, wavelength range and central wavelength of the images. These building results were not satisfactory and were far lower than those of the proposed method.
3.3.3. gCRF_MBI Compared to MBI-Based Methods
In this subsection, we compare the proposed gCRF_MBI method with MBI-based methods. Similarly, the inputs of all experiments in this subsection are the two test images, which are namely the QuickBird image and the Pléiades image. The gCRF_MBI experiment involves these two images acquired simultaneously, as described in the spectral-based experiments. The compared MBI-based methods are the Kmeans-based unsupervised methods and SVM-based supervised methods. Similar to the spectral-based experiments, the Kmeans-based methods included Kmeans_MBI_Pix, Kmeans_MBI_MV and Kmeans_MBI_Seg. The SVM-based methods included SVM_MBI_Pix, SVM_MBI_MV and SVM_MBI_Seg. In the supervised SVM-based algorithms, training samples were selected from two experimental images.
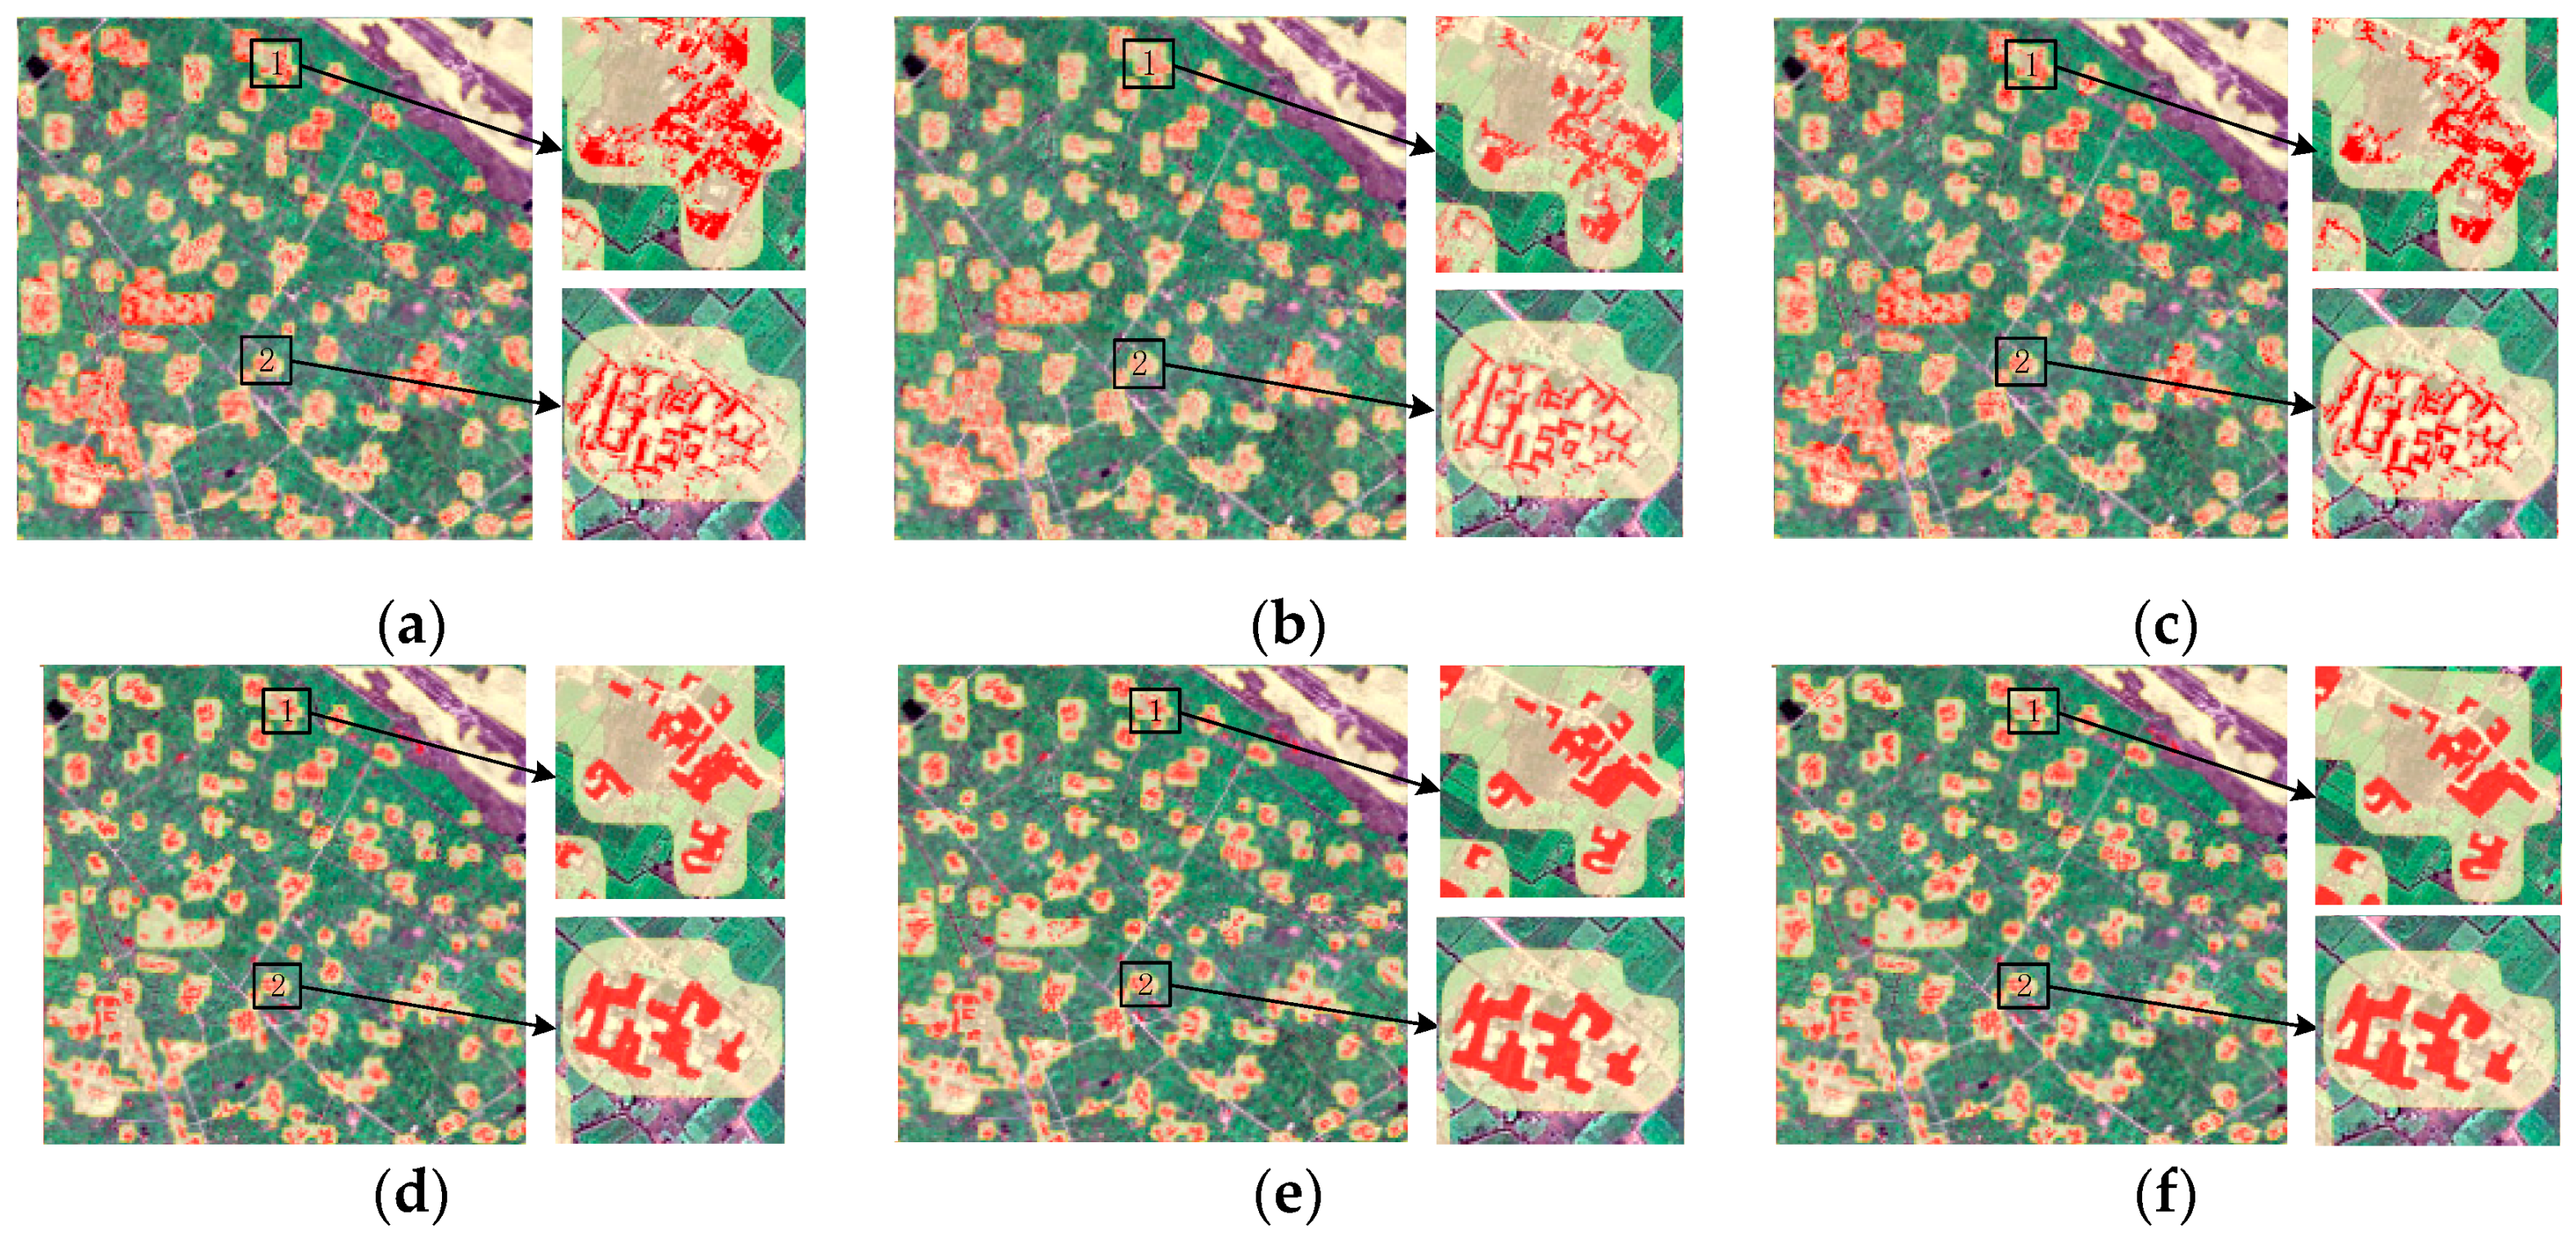
The building results of the different MBI-based methods from the two images are shown in Figure 16 and Figure 17. In terms of visual interpretation, the building results of the MBI-based methods were much better than those of the spectral-based methods, while the results of the proposed method were similar to those of the SVM-based methods, because the MBI features of buildings could be shared in different images from different sensors. Therefore, the MBI features were more suitable for building extraction compared to spectral features.
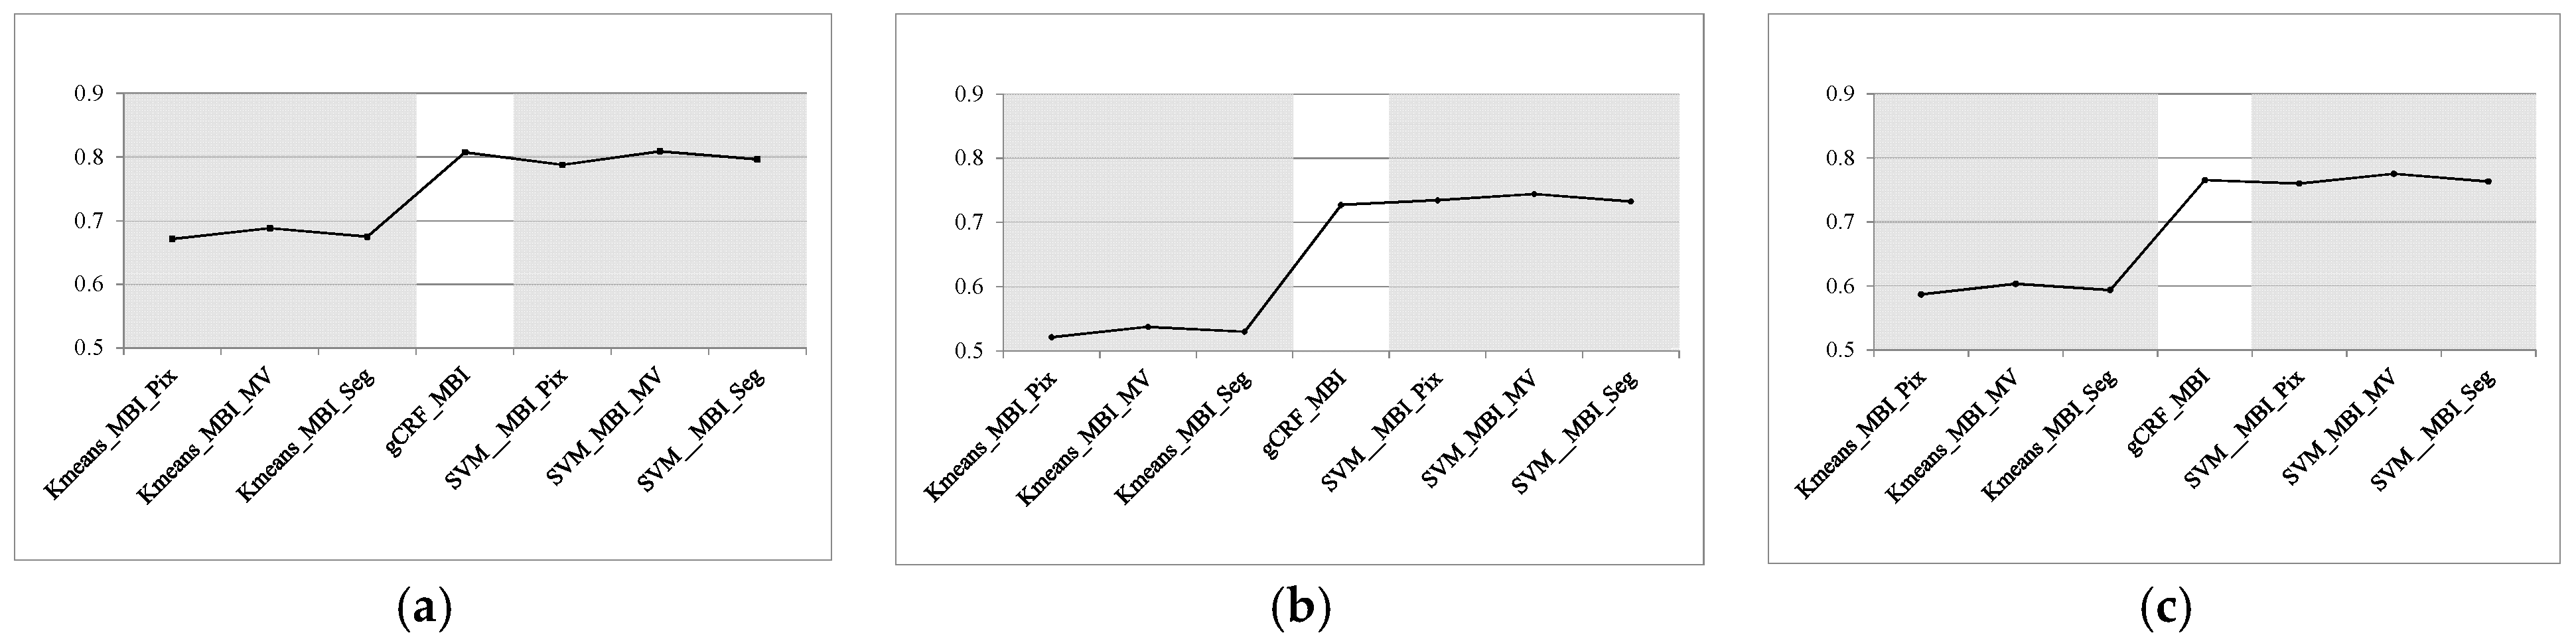
Figure 18 and Figure 19 show the quantitative evaluation of the building results. In the QuickBird image, the building results of the gCRF_MBI method had a slightly higher recall than those of the SVM-based methods, although they performed slightly worse than the SVM_MBI_MV and SVM_MBI_Seg methods in terms of precision. The Pléiades image produced a similar result to that of the QuickBird image. However, distinguishing the buildings in the extracted results was difficult because the buildings in the Pléiades image were closely adjacent. Therefore, in terms of recall and precision, the accuracy of the building results using the Pléiades image was lower than that of the QuickBird image. In summary, the gCRF_MBI method achieved a result comparable to that of the SVM-based supervised methods.
4. Discussion
In this section, we discussed the proposed method from the viewpoint of three aspects: hierarchical image analysis units, feature fusion in a probabilistic framework and multiple methods of application.
4.1. Hierarchical Image Analysis Units
The gCRF_MBI method consists of three indispensable components, which are namely SR, MBI and gCRF. They work on a set of hierarchical image analysis units, i.e., pixels, over-segments, buildings and BACs. In terms of image analysis units, the gCRF_MBI method is similar to the unsupervised classification method in [32], which utilizes a set of pixels, over-segments, objects and scenes. In [32], both objects and scenes are inferred from PAN images during unsupervised learning. Instead of inference, the scenes, i.e., BACs in the gCRF_MBI method, have already been extracted before they are used as analysis units. Specifically, the SR produces the BACs from each satellite image in the gCRF_MBI method. Within each BAC, morphological features (i.e., MBI) are extracted and used to delineate the buildings during the local clustering. It can be seen from Figure 10 that the MBI extracted from each BAC is significantly better than that from the whole image in terms of building extraction. In addition, the complementary relationship among the three components has been analyzed under multiple combinations in Section 3.2.
As for the relationship of SR and gCRF, the definition of a restaurant in the gCRF is different. Results reveal that the built-up areas extracted using the SR can help improving the building results. As for the MBI and gCRF, experimental results show that morphological feature extracted using MBI is better than the MS feature in building extraction. As shown in Table 3, the gCRF_MBI method is the best one among all of the other combinations in terms of the quantitative evaluation.
4.2. Feature Fusion in a Probabilistic Framework
Similar to the gCRF in [25], the proposed gCRF_MBI method is also based on a probabilistic framework for feature fusion. Unlike the gCRF, the MBI features instead of MS images are fused with PAN images in the gCRF_MBI method. As shown in Figure 8, the morphological feature is better than the MS feature in terms of building extraction. In addition, as an unsupervised method, the gCRF_MBI is comparable to the SVM-based supervised classification methods in terms of quantitative evaluations. This shows that the proposed method might be an effective and efficient way to extract buildings from VHR satellite images to support decision making in the response phase of natural disasters. The reason for this is that the proposed method is free of supervised learning. Specifically, in Section 3.3, we compared the gCRF_MBI method with spectral-based methods and MBI-based classification methods. As shown in Figure 14 and Figure 15, the proposed method is better than both the SVM-based supervised method and the Kmeans-based unsupervised method, when MS features are fed into the classifiers. It can be seen from Figure 18 and Figure 19 that the gCRF_MBI method is better than Kmeans-based methods and comparable to the supervised SVM-based methods when MBI is used as a feature in these classifiers. Furthermore, we also compared spectral-based and MBI-based classification results in a same type of classifier. For both Kmeans-based and SVM-based classification methods, MBI-based results are better than spectral-based results. These results show that morphological features could characterize buildings in a rather consistent way across different VHR satellite images. This is the key point that the proposed method could be applied to building extraction from multiple heterogeneous VHR satellite images.
4.3. Multiple Methods of Application
Until now, it has been very difficult, if not impossible, to prepare or teach a general model to automatically detect buildings from heterogeneous VHR satellite images over the world. When an emergent natural disaster occurs, rapid-building mapping techniques that require little or no human intervention are preferred. The proposed method would be a nice choice, since it is not only unsupervised and free of supervised training with fine-tuned parameters, but it could be also utilized in multiple ways. As shown in Figure 5, the gCRF_MBI could be utilized to automatically detect buildings using a model learned from multiple VHR satellite images. The learned model could also be adaptively generalized to new VHR satellite images by keeping the learned statistic characteristics of buildings unchanged. In this manner, the proposed method could further boost the speed of building maps from a large number of VHR satellite images for rapid responses to natural disasters.
5. Conclusions
In this paper, an unsupervised method was proposed to automatically detect buildings from multiple heterogeneous and non-calibrated VHR satellite images to provide a rapid response to natural disasters. The contributions of this research consist of the following:
- (1)
- We propose a novel, unsupervised classification framework for building maps from multiple heterogeneous VHR satellite images by fusing two-layer image information in a unified, hierarchical model. The first layer is used to reshape over-segmented superpixels to potential individual buildings. The second layer is used to discriminate buildings from non-buildings using the MFs of the candidates. Due to the flexible hierarchical structure of the probabilistic model, a model is learned for each image in the first layer, while a probabilistic distribution for buildings and non-buildings is inferred for all images in the second layer.
- (2)
- Compared with traditional methods, the combination of multiple features eliminates the need to fine-tune model parameters from one image to another. Therefore, the proposed method is more suitable for automatically detecting buildings from multiple heterogeneous and uncalibrated VHR satellite images.
In the proposed gCRF_MBI method, the SR was first used to extract BACs from each MS image. After this, MBIs were extracted from all the masked PAN and MS images with the BACs to characterize the structural features of buildings. Finally, buildings were automatically detected in the gCRF model by fusing both the MBI and masked PAN images. Moreover, the roles of three components of the gCRF_MBI model (SR, MBI and gCRF) were analyzed in our experiments, which showed that each component in the proposed method could be improved in some way. For example, the SR used for extracting the BACs could be replaced by other visual attention models, such as the Itti model [36] or the FDA_SRD (i.e., frequency domain analysis and salient region detection) model [37], while the MBI used for extracting MFs could be replaced by other common features of buildings, such as shadows or heights. The experimental results show that the proposed method is better than Kmeans-based unsupervised methods and comparable to SVM-based supervised methods. In addition, there are some drawbacks to the proposed method. For example, variable imaging environments, such as haze or cloud cover, were not considered here. In the future, we would extend the proposed method to a general scene for building detection or other object categories.
Acknowledgments
This work was partly supported by the National Natural Science Foundation of China (No. 41571334), the XJCC Innovation Team of Geospatial Information Technology (No. 2016AB001), and National key R&D program of China (No. 2017YFB0504100).
Author Contributions
Shaodan Li and Hong Tang designed and performed the experiment; Shaodan Li collected the required data; Xin Huang provided the MBI code; Ting Mao provided the MBI code; Xiaonan Niu drew Figure 1.
Conflicts of Interest
The authors declare no conflicts of interest.
References
- Hoffmann, J. Mapping damage during the Bam (Iran) earthquake using interferometric coherence. Int. J. Remote Sens. 2007, 28, 1199–1216. [Google Scholar] [CrossRef]
- Hussain, E.; Ural, S.; Kim, K.; Fu, C.S.; Shan, J. Building extraction and rubble mapping for city of Port-au-Prince post-2010 earthquake with GeoEye-1 imagery and Lidar data. Photogramm. Eng. Remote Sens. 2011, 77, 1011–1023. [Google Scholar]
- Matsuoka, M.; Yamazaki, F. Building damage mapping of the 2003 Bam, Iran Earthquake using Envisat/ASAR intensity imagery. Earthq. Spectra 2005, 21, S285–S294. [Google Scholar] [CrossRef]
- Vu, T.; Ban, Y. Context-based mapping of damaged buildings from high-resolution optical satellite images. Int. J. Remote Sens. 2010, 31, 3411–3425. [Google Scholar] [CrossRef]
- Ok, A.O. Automated detection of buildings from single VHR multispectral images using shadow information and graph cuts. ISPRS J. Photogramm. Remote Sens. 2013, 86, 21–40. [Google Scholar] [CrossRef]
- Kim, T.; Muller, J. Development of a graph-based approach for building detection. Image Vis. Comput. 1999, 17, 3–14. [Google Scholar] [CrossRef]
- Huyck, C.; Adams, B.; Cho, S.; Chung, H.; Eguchi, R.T. Towards rapid citywide damage mapping using neighborhood edge dissimilarities in very high-resolution optical satellite imagery—Application to the 2003 Bam, Iran earthquake. Earthq. Spectra 2005, 21, S255–S266. [Google Scholar] [CrossRef]
- Ishii, M.; Goto, T.; Sugiyama, T.; Saji, H.; Abe, K. Detection of earthquake damaged areas from aerial photographs by using color and edge information. In Proceedings of the 5th Asian Conference on Computer Vision, Melbourne, Australia, 22–25 January 2002. [Google Scholar]
- Wang, D. A method of building edge extraction from very high resolution remote sensing images. Environ. Prot. Circ. Econ. 2009, 29, 26–28. [Google Scholar]
- Sirmacek, B.; Unsalan, C. Urban-area and building detection using SIFT keypoints and graph theory. IEEE Trans. Geosci. Remote Sens. 2009, 47, 1156–1167. [Google Scholar] [CrossRef]
- Miura, H.; Modorikawa, S.; Chen, S. Texture characteristics of high-resolution satellite images in damaged areas of the 2010 Haiti Earthquake. In Proceedings of the 9th International Workshop on Remote Sensing for Disaster Response, Stanford, CA, USA, 15–16 September 2011. [Google Scholar]
- Duan, F.; Gong, H.; Zhao, W. Collapsed houses automatic identification based on texture changes of post-earthquake aerial remote sensing image. In Proceedings of the 18th International Conference on Geoinformatics, Beijing, China, 18–20 June 2010. [Google Scholar]
- Pesaresi, M.; Benediktsson, J. A new approach for the morphological segmentation of high-resolution satellite imagery. IEEE Trans. Geosci. Remote Sens. 2001, 39, 309–320. [Google Scholar] [CrossRef]
- Fauvel, M.; Benediktsson, J.; Chanussot, J. Spectral and spatial classification of hyperspectral data using SVMs and morphological profiles. IEEE Trans. Geosci. Remote Sens. 2008, 46, 3804–3814. [Google Scholar] [CrossRef]
- Shackelford, A.; Davis, C. A combined fuzzy pixel-based and object-based approach for classification of high-resolution multispectral data over urban areas. IEEE Trans. Geosci. Remote Sens. 2003, 41, 2354–2363. [Google Scholar] [CrossRef]
- Huang, X.; Zhang, L. Morphological building/shadow index for building extraction from high-resolution imagery over urban areas. IEEE J. Sel. Top. Appl. Earth Obs. Remote Sens. 2012, 5, 161–172. [Google Scholar] [CrossRef]
- Pesaresi, M.; Guo, H.; Blaes, X.; Ehrlich, D.; Ferri, S.; Gueguen, L.; Halkia, M.; Kauffmann, M.; Kemper, T.; Lu, L.; et al. A global human settlement layer from optical HR/VHR RS data: Concept and first results. IEEE J. Sel. Top. Appl. Earth Obs. Remote Sens. 2013, 6, 2102–2131. [Google Scholar] [CrossRef]
- San, D.; Turker, M. Support vector machines classification for finding building patches from IKONOS imagery: The effect of additional bands. J. Appl. Remote Sens. 2014, 8, 083694. [Google Scholar]
- Pal, M.; Foody, G. Evaluation of SVM, RVM and SMLR for accurate image classification with limited ground data. IEEE J. Sel. Top. Appl. Earth Obs. Remote Sens. 2012, 5, 1344–1355. [Google Scholar] [CrossRef]
- Katartzis, A.; Sahli, H. A stochastic framework for the identification of building rooftops using a single remote sensing image. IEEE Trans. Geosci. Remote Sens. 2008, 46, 259–271. [Google Scholar] [CrossRef]
- Benedek, C.; Descombes, X.; Zerubia, J. Building development monitoring in multitemporal remotely sensed image pairs with stochastic birth-death dynamics. IEEE Trans. Pattern Anal. Mach. Intell. 2012, 34, 33–50. [Google Scholar] [CrossRef] [PubMed] [Green Version]
- Li, E.; Femiani, J.; Xu, S.; Zhang, X.; Wonka, P. Robust rooftop extraction from visible band images using higher order CRF. IEEE Trans. Geosci. Remote Sens. 2015, 53, 4483–4495. [Google Scholar] [CrossRef]
- Li, E.; Xu, S.; Meng, W.; Zhang, X. Building extraction from remotely sensed images by integrating saliency cue. IEEE J. Sel. Top. Appl. Earth Obs. Remote Sens. 2017, 10, 906–919. [Google Scholar] [CrossRef]
- Anees, A.; Aryal, J.; O’Reilly, M.; Gale, T.J.; Wardlaw, T. A robust multi-kernel change detection framework for detecting leaf beetle defoliation using Landsat 7 ETM+ data. ISPRS J. Photogramm. Remote Sens. 2016, 122, 167–178. [Google Scholar] [CrossRef]
- Mao, T.; Tang, H.; Wu, J.; Jiang, W.; He, S.; Shu, Y. A generalized metaphor of Chinese restaurant franchise to fusing both panchromatic and multispectral images for unsupervised classification. IEEE Trans. Geosci. Remote Sens. 2016, 54, 4594–4604. [Google Scholar] [CrossRef]
- Hou, X.; Zhang, L. Saliency detection: A spectral residual approach. In Proceedings of the Computer Vision and Pattern Recognition, Minneapolis, MN, USA, 17–22 June 2007. [Google Scholar]
- Li, S.; Tang, H.; Yang, X. Spectral residual model for rural residential region extraction from GF-1 satellite images. Math. Probl. Eng. 2016, 1–13. [Google Scholar] [CrossRef]
- Huang, X.; Zhang, L. A multidirectional and multiscale morphological index for automatic building extraction from multispectral GeoEye-1 imagery. Photogramm. Eng. Remote Sens. 2011, 77, 721–732. [Google Scholar] [CrossRef]
- Otsu, N. A threshold selection method from gray-level histograms. IEEE Trans. Syst. Man Cybern. 1979, 9, 62–66. [Google Scholar] [CrossRef]
- Ok, A.; Senaras, C.; Yuksel, B. Automated detection of arbitrarily shaped buildings in complex environments from monocular VHR optical satellite imagery. IEEE Trans. Geosci. Remote Sens. 2013, 51, 1701–1717. [Google Scholar] [CrossRef]
- Chang, C.; Lin, C. LIBSVM: A library for support vector machines. ACM Trans. Intell. Syst. Technol. 2011, 2, 1–39. [Google Scholar] [CrossRef]
- Shu, Y.; Tang, H.; Li, J.; Mao, T.; He, S.; Gong, A.; Chen, Y.; Du, H. Object-Based Unsupervised Classification of VHR Panchromatic Satellite Images by Combining the HDP and IBP on Multiple Scenes. IEEE Trans. Geosci. Remote Sens. 2015, 53, 6148–6162. [Google Scholar] [CrossRef]
- Li, S.; Tang, H.; He, S.; Shu, Y.; Mao, T.; Li, J.; Xu, Z. Unsupervised Detection of Earthquake-Triggered Roof-Holes from UAV Images Using Joint Color and Shape Features. IEEE Geosci. Remote Sens. Lett. 2015, 12, 1823–1827. [Google Scholar]
- Anees, A.; Aryal, J.; O’Reilly, M.; Gale, T.J. A Relative Density Ratio-Based Framework for Detection of Land Cover Changes in MODIS NDVI Time Series. IEEE J. Sel. Top. Appl. Earth Obs. Remote Sens. 2016, 9, 3359–3371. [Google Scholar] [CrossRef]
- Anees, A.; Aryal, J. Near-Real Time Detection of Beetle Infestation in Pine Forests Using MODIS Data. IEEE J. Sel. Top. Appl. Earth Obs. Remote Sens. 2014, 7, 3713–3723. [Google Scholar] [CrossRef]
- Itti, L.; Koch, C.; Niebur, E. A model of saliency-based visual attention for rapid scene analysis. IEEE Comput. Soc. 1998, 20, 1254–1259. [Google Scholar] [CrossRef]
- Zhang, L.; Yang, K. Region-of-interest extraction based on frequency domain analysis and salient region detection for remote sensing image. IEEE Geosci. Remote Sens. Lett. 2013, 11, 916–920. [Google Scholar] [CrossRef]
Figure 1.
Historical images captured within seven days of the Wenchuan earthquake.

Figure 2.
Framework of the proposed model.

Figure 3.
Three components in the gCRF_MBI (i.e., generalized Chinese restaurant franchise and morphological building index) method.
Figure 3.
Three components in the gCRF_MBI (i.e., generalized Chinese restaurant franchise and morphological building index) method.

Figure 4.
Algorithm of the proposed method for VHR (i.e., very high resolution) satellite image.

Figure 5.
Algorithm for multiple heterogeneous VHR satellite images: (a) The first situation and (b) the second situation.
Figure 5.
Algorithm for multiple heterogeneous VHR satellite images: (a) The first situation and (b) the second situation.


Figure 6.
Experimental images and their corresponding ground-truth map: (a) study area; (b) test images; (c) ground-truth maps; and (d) magnified regions same as ground-truth maps.
Figure 6.
Experimental images and their corresponding ground-truth map: (a) study area; (b) test images; (c) ground-truth maps; and (d) magnified regions same as ground-truth maps.

Figure 7.
Building results of two compared models: (a) gCRF; (b) “SR+gCRF”.

Figure 8.
Building results of two compared models: (a) “SR+gCRF”; and (b) gCRF_MBI.

Figure 9.
MBI features of two compared models: (a) “MBI+SR+gCRF”; and (b) gCRF_MBI.

Figure 10.
Building results of two compared models: (a) “MBI+SR+gCRF”; and (b) gCRF_MBI.

Figure 11.
Building results of the “generalized-image” comparison experiments: (a) only QuickBird image; (b) “generalized images” (for QuickBird image); (c) only Pléiades image; and (d) “generalized images” (for Pléiades image).
Figure 11.
Building results of the “generalized-image” comparison experiments: (a) only QuickBird image; (b) “generalized images” (for QuickBird image); (c) only Pléiades image; and (d) “generalized images” (for Pléiades image).

Figure 12.
Building results of the spectral-based methods using the QuickBird image: (a) Kmeans_MS_Pix; (b) Kmeans_MS_MV; (c) Kmeans_MS_Seg; (d) SVM_MS_Pix; (e) SVM_MS_MV; and (f) SVM_MS_Seg.
Figure 12.
Building results of the spectral-based methods using the QuickBird image: (a) Kmeans_MS_Pix; (b) Kmeans_MS_MV; (c) Kmeans_MS_Seg; (d) SVM_MS_Pix; (e) SVM_MS_MV; and (f) SVM_MS_Seg.

Figure 13.
Building results of the spectral-based methods using the Pléiades image: (a) Kmeans_MS_Pix; (b) Kmeans_MS_MV; (c) Kmeans_MS_Seg; (d) SVM_MS_Pix; (e) SVM_MS_MV; and (f) SVM_MS_Seg.
Figure 13.
Building results of the spectral-based methods using the Pléiades image: (a) Kmeans_MS_Pix; (b) Kmeans_MS_MV; (c) Kmeans_MS_Seg; (d) SVM_MS_Pix; (e) SVM_MS_MV; and (f) SVM_MS_Seg.

Figure 14.
Quantitative evaluation of the spectral-based methods using the QuickBird image: (a) recall; (b) precision; and (c) F-value.
Figure 14.
Quantitative evaluation of the spectral-based methods using the QuickBird image: (a) recall; (b) precision; and (c) F-value.

Figure 15.
Quantitative evaluation of the spectral-based methods using the Pléiades image: (a) recall; (b) precision; and (c) F-value.
Figure 15.
Quantitative evaluation of the spectral-based methods using the Pléiades image: (a) recall; (b) precision; and (c) F-value.

Figure 16.
Building results of the MBI-based methods using the QuickBird image: (a) Kmeans_MBI_Pix; (b) Kmeans_MBI_MV; (c) Kmeans_MBI_Seg; (d) SVM_MBI_Pix; (e) SVM_MBI_MV; and (f) SVM_MBI_Seg.
Figure 16.
Building results of the MBI-based methods using the QuickBird image: (a) Kmeans_MBI_Pix; (b) Kmeans_MBI_MV; (c) Kmeans_MBI_Seg; (d) SVM_MBI_Pix; (e) SVM_MBI_MV; and (f) SVM_MBI_Seg.

Figure 17.
Building results of the MBI-based methods using the Pléiades image: (a) Kmeans_MBI_Pix; (b) Kmeans_MBI_MV; (c) Kmeans_MBI_Seg; (d) SVM_MBI_Pix; (e) SVM_MBI_MV; and (f) SVM_MBI_Seg.
Figure 17.
Building results of the MBI-based methods using the Pléiades image: (a) Kmeans_MBI_Pix; (b) Kmeans_MBI_MV; (c) Kmeans_MBI_Seg; (d) SVM_MBI_Pix; (e) SVM_MBI_MV; and (f) SVM_MBI_Seg.

Figure 18.
Quantitative evaluation of the MBI-based methods using the QuickBird image: (a) recall; (b) precision; and (c) F-value.
Figure 18.
Quantitative evaluation of the MBI-based methods using the QuickBird image: (a) recall; (b) precision; and (c) F-value.

Figure 19.
Quantitative evaluation of the MBI-based methods using the Pléiades image: (a) recall; (b) precision; and (c) F-value.
Figure 19.
Quantitative evaluation of the MBI-based methods using the Pléiades image: (a) recall; (b) precision; and (c) F-value.


Table 1.
The glossary of acronyms used in the paper.
| Acronyms | Full Names |
|---|---|
| VHR | Very high resolution |
| BAC | Built-up area candidate |
| MS | Multispectral |
| PAN | Panchromatic |
| MBI | Morphological building index |
| MF | Morphological feature |
| SVM | Support vector machine |
| RVM | Relevance vector machine |
| SMLR | Sparse multi-nominal logistic regression |
| LSPC | Least squares probabilistic classifier |
| MRF | Markov random field |
| gCRF | generalized Chinese Restaurant Franchise |
| SR | Spectral residual |
| DMP | Differential morphological profile |
| SE | Structure element |
| UTC | Universal time coordinated |
| MV | Majority vote |
Table 2.
Parameters of the satellite sensors.
| Sensor Satellite | Pan | MS | ||
|---|---|---|---|---|
| Resolution (m) | Band (µm) | Resolution (m) | Band (µm) | |
| QuickBird | 0.6 | 0.45–0.90 | 2.4 | 0.45–0.52 |
| 0.52–0.60 | ||||
| 0.63–0.69 | ||||
| 0.76–0.90 | ||||
| Pléiades | 0.5 | 0.47–0.83 | 2.0 | 0.43–0.55 |
| 0.50–0.62 | ||||
| 0.59–0.71 | ||||
| 0.74–0.94 | ||||
Table 3.
Quantitative evaluation of the building results of the different methods.
| Methods | Recall | Precision | F-Value |
|---|---|---|---|
| gCRF | 61.17% | 35.43% | 44.88% |
| SR+gCRF | 78.19% | 61.86% | 69.07% |
| MBI+SR+gCRF | 51.53% | 39.78% | 44.90% |
| The proposed method | 86.39% | 75.62% | 80.65% |
Table 4.
Quantitative evaluation of the building results of the different methods.
| Images | Recall | Precision | F-Value |
|---|---|---|---|
| Only QuickBird image | 86.39% | 75.62% | 80.65% |
| “generalized-images” (for QuickBird image) | 86.19% | 75.36% | 80.41% |
| Only Pléiades image | 80.73% | 72.73% | 76.52% |
| “generalized-images” (for Pléiades image) | 80.49% | 72.42% | 76.24% |
© 2017 by the authors. Licensee MDPI, Basel, Switzerland. This article is an open access article distributed under the terms and conditions of the Creative Commons Attribution (CC BY) license (http://creativecommons.org/licenses/by/4.0/).
Share and Cite
MDPI and ACS Style
Li, S.; Tang, H.; Huang, X.; Mao, T.; Niu, X. Automated Detection of Buildings from Heterogeneous VHR Satellite Images for Rapid Response to Natural Disasters. Remote Sens. 2017, 9, 1177. https://0-doi-org.brum.beds.ac.uk/10.3390/rs9111177
AMA Style
Li S, Tang H, Huang X, Mao T, Niu X. Automated Detection of Buildings from Heterogeneous VHR Satellite Images for Rapid Response to Natural Disasters. Remote Sensing. 2017; 9(11):1177. https://0-doi-org.brum.beds.ac.uk/10.3390/rs9111177
Chicago/Turabian StyleLi, Shaodan, Hong Tang, Xin Huang, Ting Mao, and Xiaonan Niu. 2017. "Automated Detection of Buildings from Heterogeneous VHR Satellite Images for Rapid Response to Natural Disasters" Remote Sensing 9, no. 11: 1177. https://0-doi-org.brum.beds.ac.uk/10.3390/rs9111177
Note that from the first issue of 2016, this journal uses article numbers instead of page numbers. See further details here.